Article

Exploring Methane Emission Dynamics Using Bayesian Networks and Machine Learning Analysis of Nutritional and Production Traits in Dairy Cattle

by
Mohammadreza Mohammadabadi
1,*,
Mahmoud Amiri Roudbar
2,
Moslem Momen
3,
Seyedeh Fatemeh Mousavi
4 and
Mehdi Momen
5
1
Department of Animal Science, Faculty of Agriculture, Shahid Bahonar University of Kerman, Kerman 7616914111, Iran
2
Department of Animal Science, Safiabad-Dezful Agricultural and Natural Resources Research and Education Center, Agricultural Research, Education & Extension Organization, Dezful 333, Iran
3
Computer Engineering Department, Islamic Azad University-Bandar Abbas Branch, Hormozgan 7915893144, Iran
4
Department of Animal Breeding and Genetics, Swedish University of Agricultural Sciences, P.O. Box 7070, SE-750 07 Uppsala, Sweden
5
Department of Surgical Sciences, School of Veterinary Medicine, University of Wisconsin-Madison, Madison, WI 53706, USA
*
Author to whom correspondence should be addressed.
Methane 2025, 4(3), 21; https://doi.org/10.3390/methane4030021
Submission received: 1 August 2025 / Revised: 10 September 2025 / Accepted: 16 September 2025 / Published: 17 September 2025

Abstract

Methane emissions (CH4-em) from dairy cows are a major environmental concern, contributing to greenhouse gases and energy loss in dairy cows. This study implemented advanced data analysis techniques to understand how different diet ingredients and production traits in dairy production systems can affect methane emissions. We analyzed a comprehensive meta dataset compiled from 225 peer-reviewed studies including 303 observations across multiple traits, using Bayesian networks and various machine learning models to explore the relationships between MEs, diet chemical ingredients, and production traits in dairy cattle. Eight models were applied, including linear models (OLS, LASSO, ridge, elastic net) and non-linear models (PLSR, spline regression, support vector machine, Gaussian process), to assess predictive performance. CH4-em showed correlations ranged from −0.43 (with diet starch; STR) to 0.50 (with neutral detergent fiber; NDF) for diet-related factors, and 0.18 (with body weight; BW) to 0.29 (with milk yield; MY) for production traits. Also, Bayesian network analysis indicated that CH4-em was a downstream variable for diet-related factors and an upstream variable for production traits. Additionally, the likelihood ratio test identified NDF as significant variable among the diet-related factors, while MY and milk fat (FAT) were crucial for production traits. non-linear models, particularly spline regression (SPL) and Gaussian process (GP), outperformed linear models in predicting CH4-em. For production traits, support vector machine (SVM) and GP models showed superior predictive capabilities. Model performance was evaluated using R2 and mean squared error (MSE) metrics. We found that while larger cows emitted more methane overall, they were generally more efficient, as methane intensity decreased with increasing MY regardless of body size. These findings offer valuable insights for developing sustainable methane mitigation strategies in dairy cattle production.

1. Introduction

Greenhouse gases (GHGs) are crucial in regulating Earth’s climate by trapping heat in the atmosphere, which is essential for maintaining temperatures that support life. The approximate percentage contributions of the four major greenhouse gases to total global greenhouse gas emissions are as follows: carbon dioxide (CO2) accounts for about 76%, methane (CH4) for approximately 16%, nitrous oxide (N2O) for around 6%, and fluorinated gases for about 2% (https://www.epa.gov/ghgemissions/inventory-us-greenhouse-gas-emissions-and-sinks) (accessed on 15 September 2025). These percentages reflect their respective roles in contributing to global warming and climate change. In the US, GHG emissions from agriculture account for approximately 11% of total emissions [1,2]. Agriculture is a significant contributor to anthropogenic GHG emissions, particularly CH4 and N2O [3]. CH4 concentrations have been increasing at an unprecedented annual growth rate of ~17–18 ppb/year in recent years (compared with ~5–8 ppb/year in the early 2000s), and since 2014, they have been nearing the highest GHG emission scenarios [4,5].
This trend is particularly alarming given methane’s global warming potential (GWP), which is approximately 28 times greater than that of CO2 over a 100-year period. Livestock have received extra attention for their contributions to GHG emissions along with other environmental impacts [6,7,8]. Methane is primarily produced by livestock through enteric fermentation and manure management, making it a significant contributor to agricultural GHGs. This process is inherent to the digestive systems of domestic animals. As a result, livestock such as cattle, swine, sheep, and goats naturally produce methane (CH4) during digestion. Among these, ruminants like cattle are the most significant emitters due to their specialized multi-chambered stomachs that support methanogenic archaea. Also, when animal manure is stored or managed in lagoons or holding tanks, CH4 is produced, including CH4 from ruminant digestion, CH4 and N2O emissions from manure during collection and storage, methane and nitrous oxide emissions from crop fields and pastures, CO2 emissions from on-farm energy use, and carbon dioxide emissions generated off-farm for inputs such as fertilizers and pesticides. Emission levels for each gas were converted to CO2 equivalents to represent their equivalent global warming impact [9,10]. According to the EPA Greenhouse Gas Inventory (2022) and IPCC Guidelines (2019), a typical dairy cow emits approximately 143 kg of CH4 per year from enteric fermentation and 93 kg of CH4 from manure management, along with 1.4 kg of N2O per year from manure, equivalent to roughly 7 t of CO2 eq. annually; for beef cattle, corresponding values are 95 kg of CH4 (enteric), 1.6 kg of CH4 (manure), and 0.3 kg of N2O, or about 2.8 t of CO2 eq. annually. GHG emissions pose a significant environmental challenge, warranting considerable attention due to their accelerating contribution to global warming, disruption of ecosystems, and increasing frequency of climate-related extreme events such as droughts, floods, and heatwaves. A significant proportion of total emissions originates from the agricultural sector, with methane being a particular concern. Methane accounts for nearly 37% of GHG emissions when measured in terms of CO2 eq., making it the second most significant GHG in the agricultural domain, following carbon dioxide [1,2]. Livestock production contributes substantially to GHG emissions in the agricultural sector, with beef cattle alone responsible for approximately 15% of methane emissions from manure management (and dairy cattle accounting for around 46.7%), based on estimates from [3]. It is noteworthy that manure emissions account for over 10% of the total GHG emissions from agriculture. This highlights the urgent need to quantify and manage emissions at the farm level, especially in intensive dairy systems where feed composition and productivity vary widely.
Efforts have been devoted to mitigating methane emissions from beef cattle [4,5], with studies exploring the efficacy of various feed additives, such as 3-nitroxpropanol (3-NOP), nitrates, and halogenated compounds, in reducing methane production within the cattle’s rumen [6,7]. These additives typically operate by inhibiting methanogens, the microorganisms responsible for methane production. It is important to acknowledge that none of these additives have been granted approval by the United States Food and Drug Administration (FDA) due to concerns regarding their potential toxicity. Consequently, nutritional strategies that rely on naturally occurring feed components, such as fiber fractions, offer a safer and more practical alternative for emission reduction.
Hence, the relationship between methane emission and diet chemical ingredients like neutral detergent fiber (NDF) and acid detergent fiber (ADF), as well as production variables like milk yield (MY) and meat production in dairy cows, is vital to consider due to its environmental impact and climate change mitigation potential [8]. Understanding these connections is crucial for developing more sustainable and efficient farming practices. Therefore, the aim of this study was to understand these connections, which enables the development of more sustainable and efficient farming practices, reducing the environmental footprint of dairy production while optimizing productivity and promoting animal well-being.

2. Results

2.1. Correlations Among Diet Ingredients and Traits

The correlations provide a comprehensive understanding of the relationships between the amount of CH4-em and ingredients of dairy cattle ratio (Figure 1A). Our analysis reveals that methane emission correlation with feed components has a range of −0.43 with STR to +0.50 with NDF. A moderate positive correlation was observed between methane emissions and the dry matter content of the diet (0.36), indicating that higher dry matter intake may have led to increased methane emissions. Additionally, CH4-em showed a nearly weak positive relationship with the organic matter of the diet (0.27). On the other hand, a considerable negative correlation was found between CH4-em and the crude protein content of the diet (−0.337). Moreover, methane emissions exhibit a high positive association with neutral detergent fiber (0.50) and acid detergent fiber contents (0.49), suggesting that higher fiber levels may contribute to increased methane production. Finally, a moderate negative correlation is observed between CH4-em and the STR content of the diet (−0.43), indicating that higher STR levels may be associated with lower methane emissions.
For the production-related variables (Figure 1B), our analysis showed that the correlation between CH4-em and body weight (BW) was moderate and positive, with a correlation coefficient of 0.185. This finding is consistent with previous studies that have reported similar correlations between body weight and methane emissions [11,12,13]. Additionally, a moderate positive correlation was observed between methane emissions and MY, with a correlation coefficient of 0.29. This supports previous research highlighting the positive association between MY and CH4-em in dairy cattle [14]. In terms of milk chemical compositions, the correlations between CH4-em and fat content (0.14) and protein content (0.02) were relatively weak. Furthermore, there was no significant correlation between methane emissions and milk lactose content (0.01), which is consistent with previous findings indicating the limited impact of lactose on methane emissions [15].

2.2. ME Based on the Body Weight and Milk Yield Scales

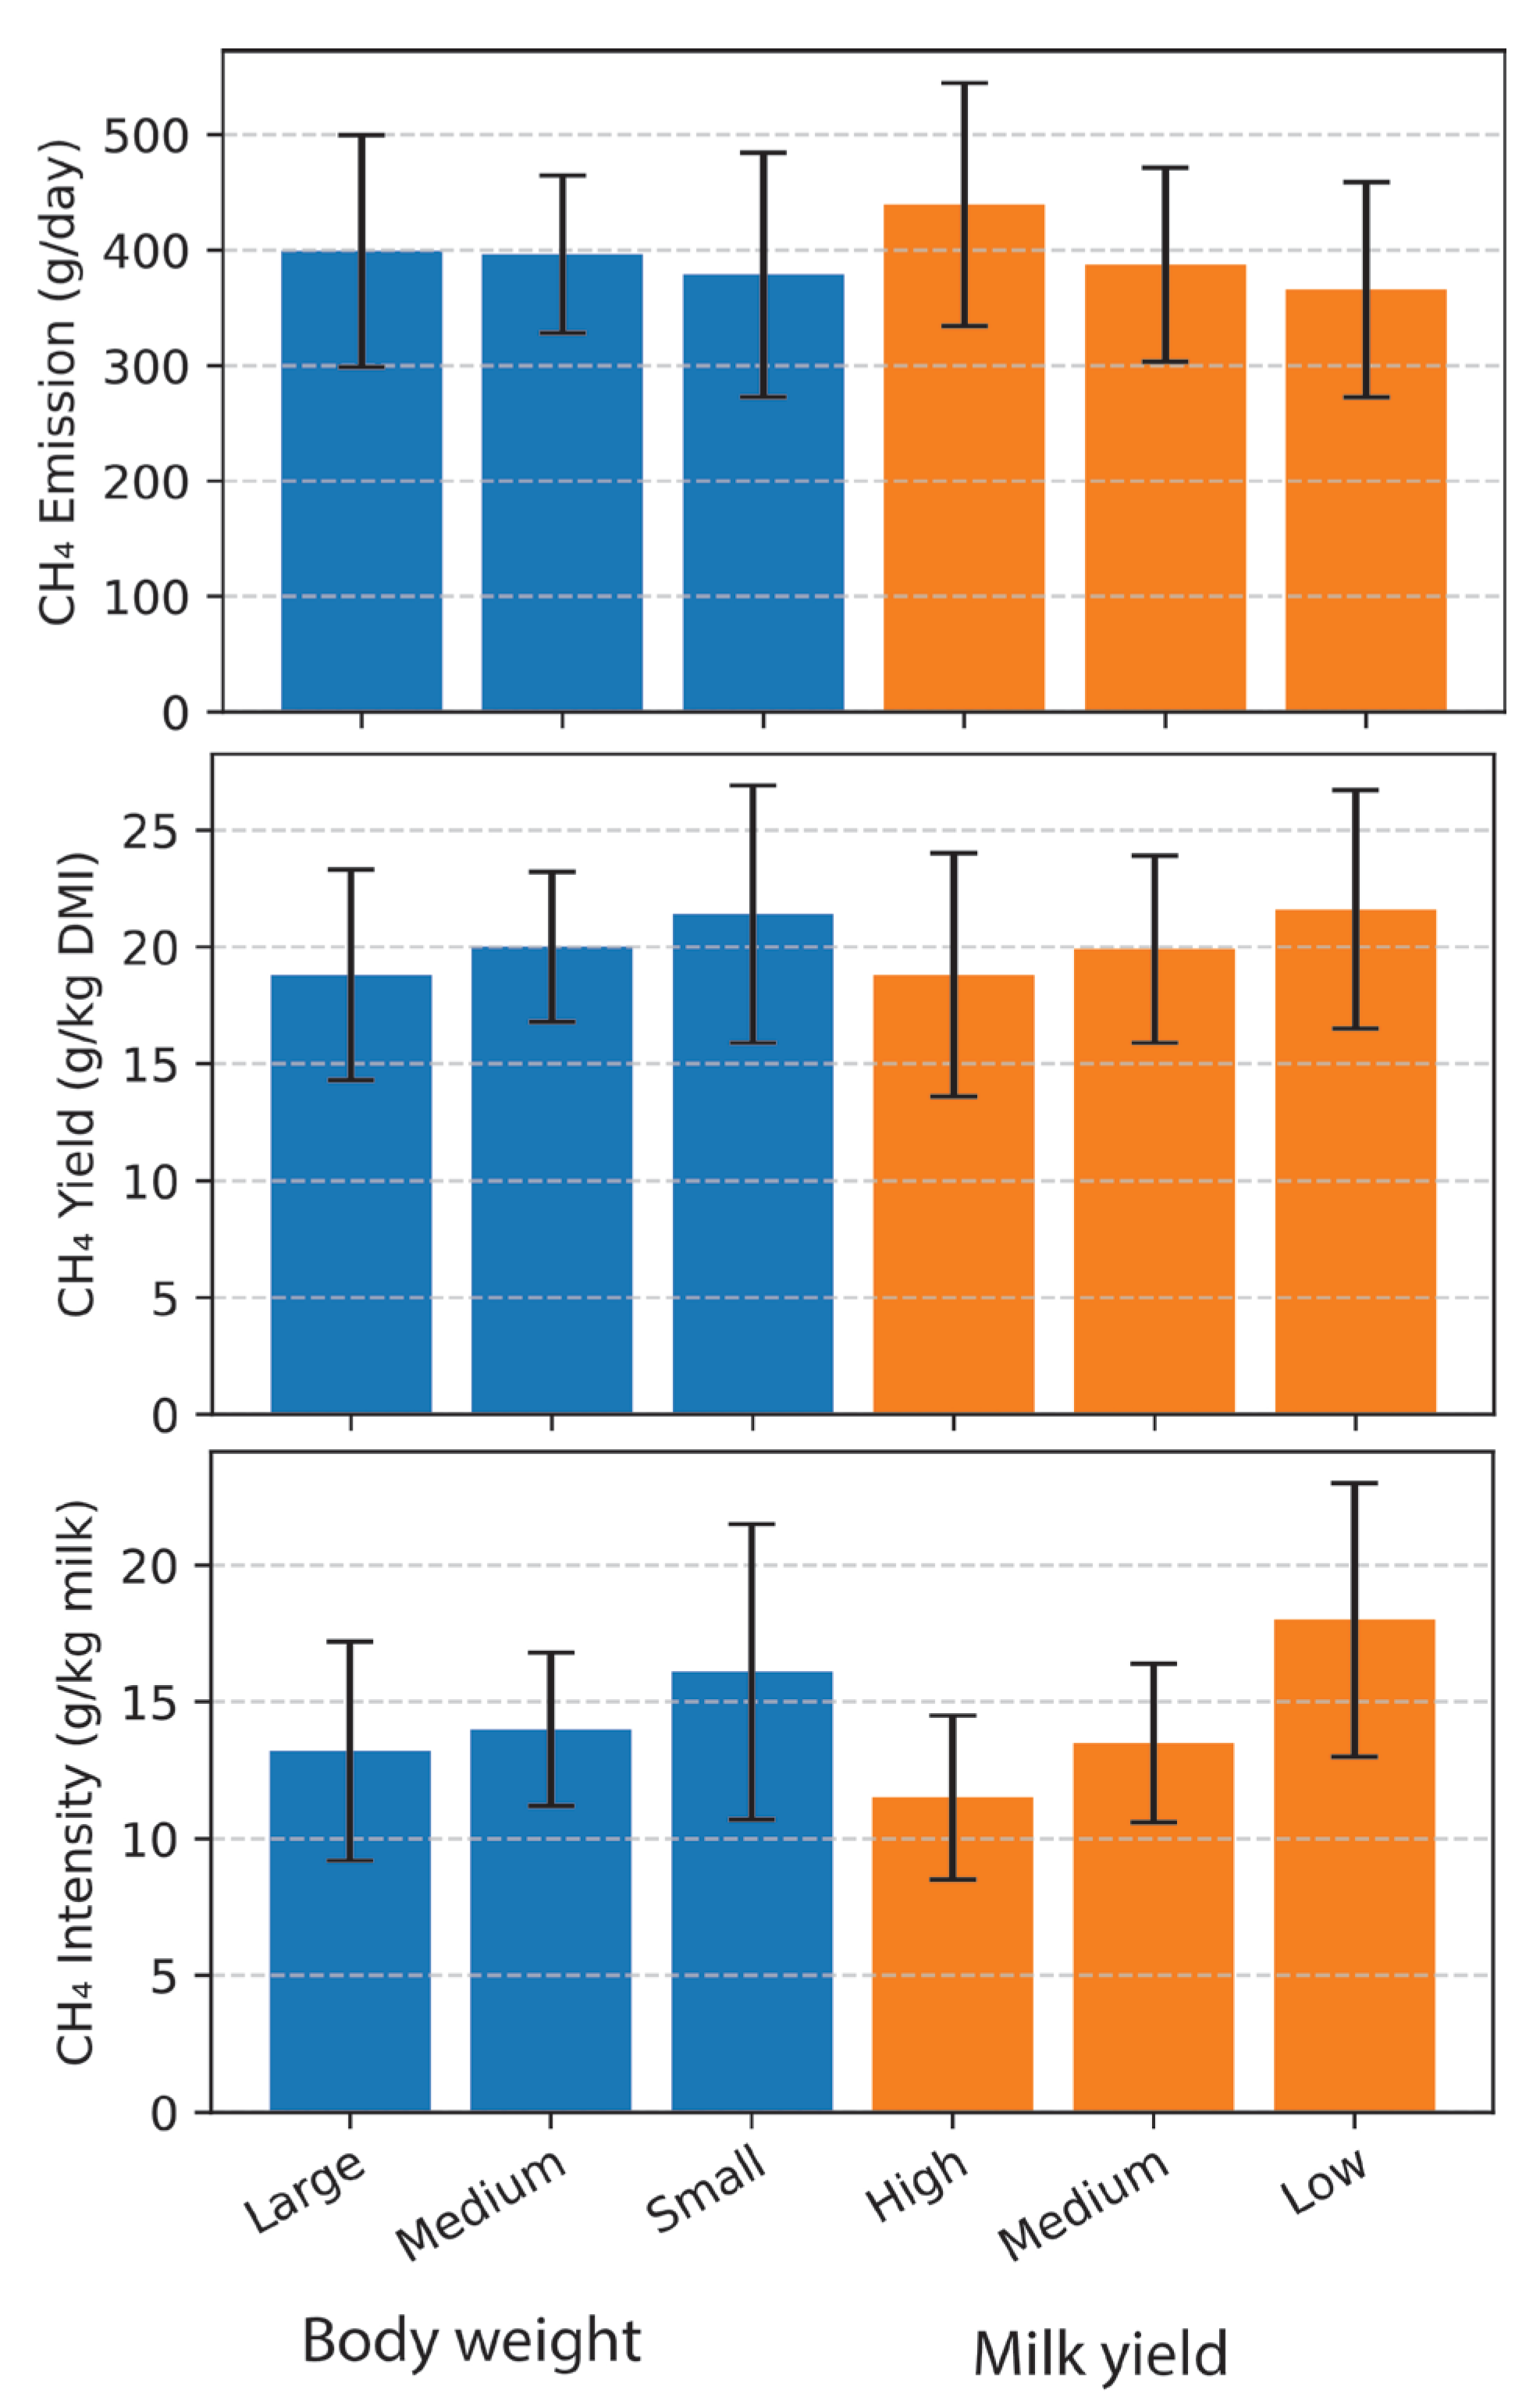
To provide a more comprehensive understanding of methane emissions in dairy systems, we jointly classified cows based on body weight and MY category (high, medium, low). This stratified analysis enabled us to assess how combinations of animal size and productivity influenced total methane emissions, methane yield (per unit DMI), and methane intensity (per unit MY). Large-size and high-yielding cows showed the highest absolute methane emissions (431.9 ± 71.4 g/day) but had the lowest methane intensity (10.4 ± 2.0 g/kg milk), indicating that the efficient conversion of feed to milk lowered emissions per unit of output. In contrast, large-size and low-yielding cows had substantially lower milk productivity and correspondingly higher methane intensity (15.1 ± 4.2), despite a lower total CH4 output (364.4 ± 82.8 g/day). Our results showed methane intensity tended to decrease with increasing MY, regardless of body size. Larger cows emit more methane in total but are generally more efficient if they also produce more milk. Small-scale, low-yield animals are the least emission-efficient group, suggesting that both low productivity and scale are associated with elevated methane intensity. Small-scale, low-yield animals are the least emission-efficient group, suggesting that both low productivity and scale are associated with elevated methane intensity (Figure 2).

2.3. Bayesian Network Structure Learning for the Diet Chemical Components and Production Traits

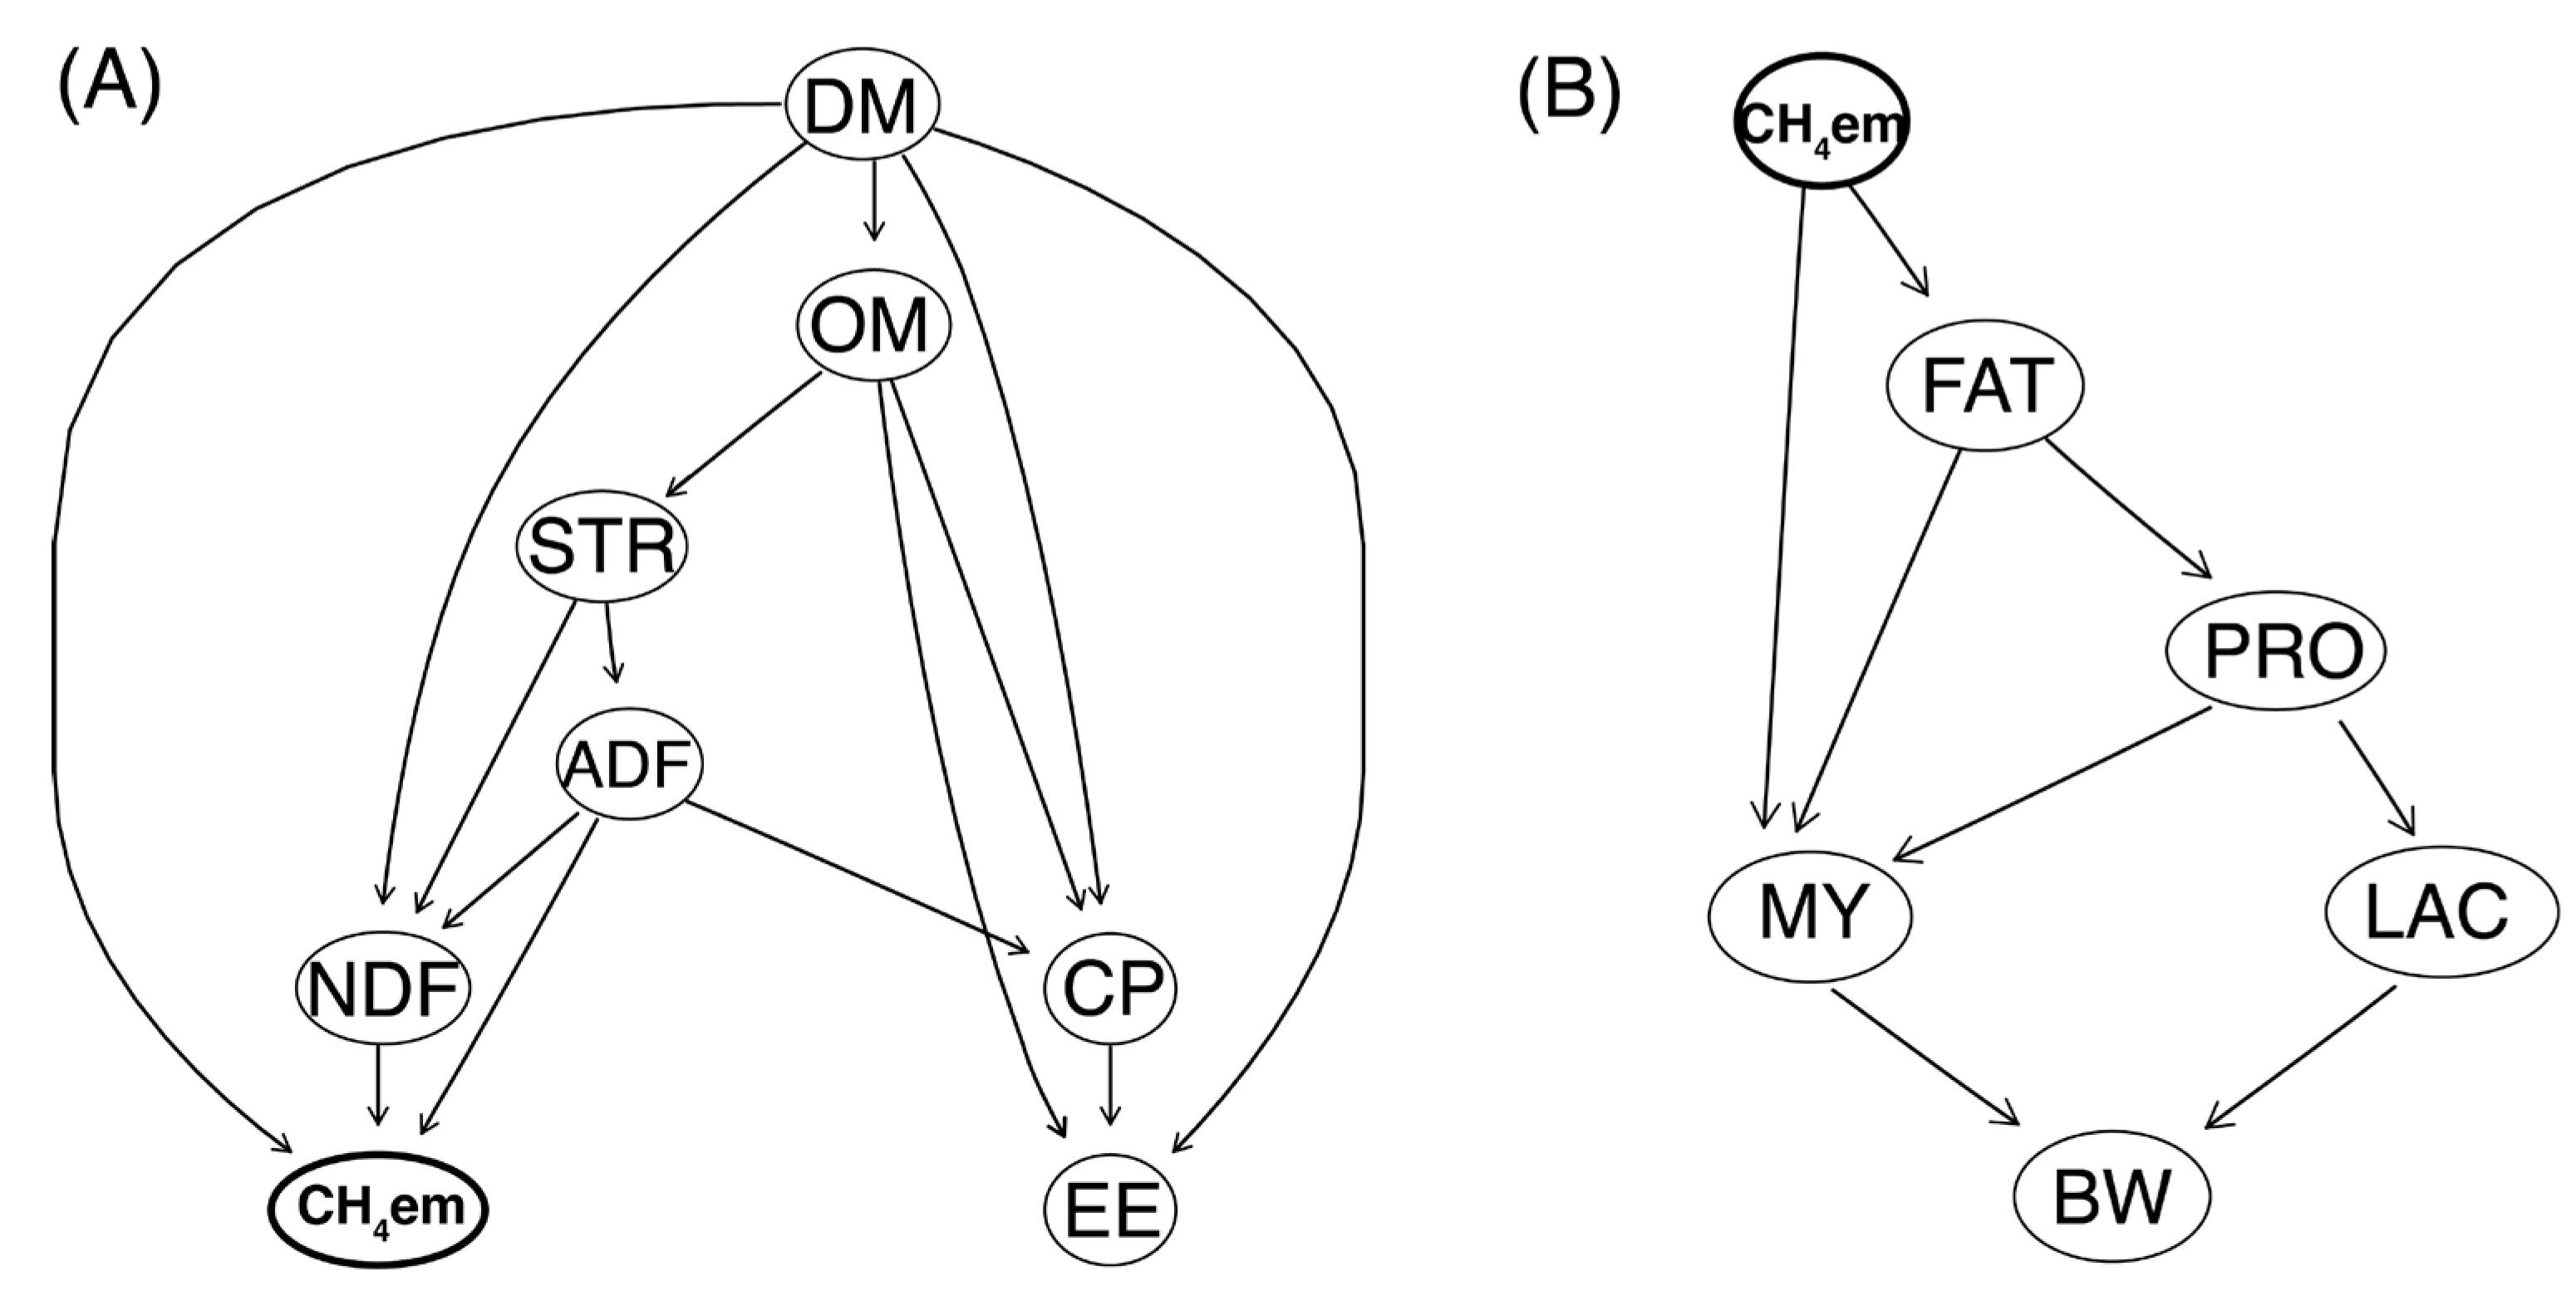
The inferred Bayesian network structures are visualized in Figure 3, which focuses on the variable of methane emission as the core node. Plot A consisted of eight nodes and 14 directed strong arcs that passed the bootstrap threshold at 0.55. A structure learning test was performed, with mutual information as the test statistic for both feed components and production variables. The significance level was set at α = 0.01. The results highlighted a strong association between diet dry matter (DM) and methane emission (ME), indicating that levels of dry matter were directly associated with methane production and indirectly by other variables. In the inferred network, DM was a node (driver variable), meaning it affected the other variables in the network, and CH4-em was a downstream node (response variable), meaning it received effects from others. In the Bayesian network, upstream variables such as DM, NDF, and ADF exert direct effects on methane emission, while “downstream” nodes receive these effects, clarifying cause–effect relationships. The BN model allows visualization of how indirect relationships (e.g., STR and OM effects mediated via fiber) contribute to methane output. EE was the only variable that did not show any causal effect on methane emissions.
In terms of the quality of the network, the generated Bayesian network exhibited a BIC score of −1018.212, indicating a good fit of the network to the data. The strength values range from −10.341 to 0.903, indicating the magnitude and direction of influence (Table 1). For example, the strength of the arc from OM to CP was −10.341, suggesting a strong influence of OM on CP. This BIC value was notably lower than the other values in the table, suggesting a stronger relationship between OM and CP compared with other variable pairs. Conversely, the arc from OM to STR had a strength BIC of 0.130, indicating a weaker influence. Similarly, the DM and CH4-em link demonstrated a relatively negative BIC value of −8.186, further emphasizing their influential association. These two nodes exhibited a strong negative BIC value, indicating their importance within the network. On the other hand, arcs involving EE (ether extract) had less negative BIC values, such as −1.065 for the OM and EE pair and −0.417 for the DM and EE pair. These values, while still negative, suggested weaker associations between ether extract and the other variables compared with the pairs with more negative BIC values.
For the production variables (Figure 3, plot B), the BN algorithm highlighted a complex relationship between CH4-em and various production variables. The CH4-em and BW were the upstream and downstream nodes, respectively. The BN demonstrated that CH4-em could exert both direct and indirect effects on MY, FAT, PRO, and LAC content, thereby influencing the overall productivity and composition of milk. Results showed that CH4-em has a significant negative impact on MY, as indicated by the high negative BIC value (−14.879) and a strong strength value (0.815). Furthermore, CH4-em had a positive effect on FAT content, with a BIC value of 0.935 and a moderate strength value (0.321). The relationship between MY and BW showed a strong negative impact, with a high negative BIC value (−32.287), indicating that a higher MY was associated with lower body weight.
FAT showed a negative influence on MY, as evidenced by the BIC value of −10.376 and a high strength value (0.936). This suggests that a higher fat percentage in milk is linked to a decrease in MY. The relationship between milk fat and protein exhibited a significant negative impact, as reflected by the low BIC value of −36.418 and a strength value of 1. This indicates that a higher fat content is associated with lower protein content in milk. Protein, in turn, demonstrated a negative impact on MY, with a BIC value of -6.288 and a high strength value (0.965). This implies that a higher protein content in milk is associated with a decrease in MY. The relationship between protein and lactose shows a positive impact, with a BIC value of 1.164 and a relatively low strength value (0.162). This suggests that higher protein content is related to an increase in lactose content in milk. Lastly, the relationship between lactose and BW showed a negative impact, with a BIC value of −4.787 and a moderate strength value (0.728). This implies that a higher lactose content is associated with lower body weight.

2.4. Quantifying the Influence of Key Factors on CH4-em

The LRT results from the full and reduced models provided insights into the importance of dietary and production variable on the CH4-em for each variable (Table 2). Among the feed chemical components, the level of NDF showed a significant impact on the CH4-em. The positive coefficient of 0.827 (p-value = 0.0029) suggests that for every unit increase in NDF percentage content, there is an estimated increase of 0.827 g/day units in CH4-em ( b N D F = 0.827 ). On the other hand, the variables DM ( b D M = 0.216 and p-value = 0.598), OM ( b O M = 2.101 and p-value = 0.535), CP ( b C P = −1.69 and p-value = 0.704), EE ( b E E = 0.021 and p-value = 0.868), ADF ( b A D F = 1.80 and p-value = 0.295), and STR ( b S t a r c h = −0.612 and p-value = 0.705), showed less significant impacts on the ME. The R2 for the full models was 0.69, indicating that approximately 69% of the variation in CH4-em could be explained by the variables included in the model.
For the production-related variables, our findings revealed important insights into the influence of the production variables on CH4-em in dairy cattle production systems. Among the variables considered, MY was the most influential factor, with a substantial positive association ( b M Y = 3.892) with CH4-em. The LRT confirmed the statistical significance of this impact (p-value = 5.20 × 10⁻⁷), indicating a strong effect of MY on CH4-em levels. The other variables showed varying degrees of impacts on CH4-em. Cow’s BW exhibited another positive impact, although not statistically significant ( b B W = 2.106, p-value = 0.847). Similarly, both FAT content and PRO displayed positive coefficients ( b F a t = 2.572 and b P r o = 0.862, respectively), suggesting a potential influence on CH4-em. FAT was the second most important variable and had a significant effect (p-value = 1.10 × 10⁻⁴). Additionally, Lactose demonstrated a negligible impact on CH4-em levels ( b L a c = 0.301, p-value = 0.871). The R2 value of the full model was 0.196, indicating that approximately 19.62% of the variance in CH4-em could be explained by the variables included in the model.

2.5. CH4-em Prediction Using Machine Learning Models (ML)

Among the linear models, the OLS and EN models showed a similar performance with an MSE of around 2826 and R2 values close to 0.68 (Table 3). These models assume a linear relationship between diet-related variables and methane emissions, capturing some of the variability but showing limitations in explaining the full complexity of the data. The LASSO model also performed similarly with slightly higher MSE and R2 values compared with OLS and EN.
The RR model had a higher MSE and a smaller R2 compared with other linear models, indicating that the additional regularization might have affected its predictive performance. Among the non-linear models, the SPL and GP models were the top performers. The SPL model demonstrated a lower MSE = 1494.579 and a higher R2 = 0.832. The GP model also performed remarkably well with a MSE = 2242.79 and a high R2 = 0.844. The PLSR and SVM models showed reasonable performance with comparable MSE and R2 values, but they did not match the predictive accuracy of SPL and GP.
For production-related traits, the linear models (OLS, LASSO, RR, EN, and PLSR) all demonstrated nearly similar performances, with relatively high MSE values around 7100 and low R2 values around 0.196. Among the non-linear models, SPL and GP showed notably better performances compared with the linear models. The SPL model had an MSE = 5764.416 and a higher R2 = 0.347, indicating a better fit to the data and a more effective capturing of non-linear relationships between production traits and methane emissions. The SVM model had even stronger performance than SPL with a MSE = 3652.175 and a significantly higher R2 = 0.595. The SVM ability to model complex non-linear relationships contributes to its improved predictive accuracy. The GP model was the top performer among all models with the lowest MSE = 1969.975 and an impressive R2 = 0.861. The GP probabilistic approach allows it to effectively capture complex non-linear associations, leading to superior predictions. Overall, non-linear models (SPL, SVM, and GP) outperform linear models in predicting methane emissions based on production-related variables.

3. Discussion

It has been reported that 37% of CH4-em from human activity is the direct result of the livestock and agricultural practices (https://www.epa.gov/ghgemissions/inventory-us-greenhouse-gas-emissions-and-sinks) (accessed on 15 September 2025). In this study, our aim was to quantify the relationship between nutrition-related factors and production traits in the dairy cow production system using correlation analysis, Bayesian networks modeling, and machine learning predictive models. Because methane is mainly produced through rumen fermentation where methanogenic archaea utilize hydrogen from fiber digestion, the observed associations can be explained by physiological and microbial mechanisms. Understanding the causal relationship between these factors can significantly assist producers in optimizing their systems and reducing the emission of greenhouse gases. Numerous technical strategies have been proposed to mitigate non-CO2 greenhouse gas emissions from livestock systems, including dietary interventions, manure management practices, and feed additives that directly target rumen methanogenesis.

3.1. Correlations Among Diet Ingredients and Traits

Our findings highlight the importance of dietary fiber fractions (NDF and ADF) and overall dry matter intake as primary drivers of methane emissions, reflecting their central role in rumen fermentation dynamics and hydrogen production, which methanogens use for CH4 synthesis. These factors showed stronger relationships and causality impacts on CH4-em than the others. Therefore, by optimizing these nutritional factors, dairy farmers and nutritionists can potentially minimize methane production without compromising other essential nutritional aspects. For high-yield dairy cows, these results underscore the need for carefully balancing NDF levels to ensure adequate rumen health and milk fat synthesis while avoiding excessive fiber that reduces energy density and feed efficiency and increases methane output. Practical ration adjustments, such as incorporating highly digestible forages or fiber substitutes, can help maintain production while lowering emissions [15,16]. Such optimization may involve strategic ration balancing, including the use of feed additives or alternative forages that modulate rumen microbial populations. This study, utilizing correlation analysis, revealed that CH4-em in dairy cattle had a moderate positive correlation with DMI and OM in the diet, while a significant negative correlation is observed with CP. Although CP exhibited a negative trend with methane, this association was not statistically significant, which may reflect variations in protein source (rumen degradable vs. undegradable protein), amino acid balance, and nitrogen recycling dynamics across studies. Differences in digestibility, dietary formulation, and experimental design likely diluted this relationship in the meta dataset [17,18]. Also, crude protein levels may result in lower methane emissions. This trend is consistent with improved nitrogen utilization efficiency, as protein supplementation can optimize rumen microbial growth and shift fermentation patterns away from methane-producing pathways, reducing methanogenesis per unit of feed intake. This suggests that increasing dietary CP alone is not a consistent methane mitigation strategy unless combined with protein quality optimization and energy–protein synchronization in the rumen [17,18]. This is because fiber fractions (NDF, ADF) increase hydrogen availability for methanogenesis, while a higher CP may reduce CH4 due to nitrogen metabolism and lower fermentable carbohydrate provision. Higher levels of NDF and ADF exhibited a strong positive association with increased methane production, which is expected since fiber-rich fractions undergo extensive fermentation in the rumen. This microbial fermentation process not only enhances hydrogen production but also shifts the rumen environment toward conditions favoring methanogenic archaea proliferation. This fermentation process enhances hydrogen production, providing substrates that methanogenic archaea utilize for methane synthesis. This aligns with previous studies indicating that fiber fractions play a pivotal role in rumen fermentation dynamics and methanogenesis pathways [19]. The study emphasizes the multifaceted influences of diet composition and production traits on CH4-em in dairy cattle. Also reflects that larger, high-producing cows consume greater amounts of feed to meet energy demands, resulting in proportionally higher methane output even if efficiency per unit of milk improves. Future research should investigate strategies to manipulate key dietary components particularly protein forms, degradability, and synchronization with carbohydrate sources to synergistically reduce methane emissions while maintaining productivity and animal health.

3.2. ME Based on the Body Weight and Milk Yield Scales

Dairy cows emit high levels of CH4 which is a major source of greenhouse gas and therefore possesses detrimental effects to the environment [20]. Moreover, methane results in energy loss for ruminants, which is assumed to vary between 2% and 12% of gross energy intake [21,22]. The positive link of BW and MY with methane reflects a higher feed intake and energy turnover, but methane intensity decreases as MY increases due to improved feed efficiency. This can be biologically justified because large cows with high MY consume more feed and ferment more substrate, increasing absolute CH4, but their efficiency improves as more energy is partitioned to milk, lowering methane intensity. Production-related traits, including BW and MY, showed moderate positive correlations with ME, while weak correlations were observed with FAT and protein content, and no significant correlation was observed with lactose content. These insights could be valuable for optimizing cattle farming practices and developing strategies to reduce methane emissions effectively. These results are aligned with other studies, for example, a study on Holstein cows found that methane intensity (CH4-em, g/kg fat- and protein-corrected milk) was negatively correlated with MY, with correlations stronger than those with body weight. This suggests that higher-producing cows emit less methane per kilogram of milk, regardless of their body size [23].

3.3. Bayesian Network Structure Learning for the Diet Chemical Components and Production Traits

Bayesian network analysis offered a valuable insight into the causal relationships among diet components, production variables, and methane emissions, which contributed to a comprehensive understanding of the system’s dynamics. Using BN causality analysis, DM was identified as a key variable directly associated with methane production, while OM and STR exhibited indirect relationships mediated by ADF and NDF. EE was the only variable that did not show a causal effect on methane emission. These causal links reflect rumen microbial processes, where DM intake regulates fermentation, while OM and STR effects are channeled through fiber digestibility and hydrogen balance. This is consistent with established rumen microbiology, where fiber fermentation generates hydrogen that methanogenic archaea use for CH4 synthesis, and higher dry matter intake increases total fermentation substrate, whereas starch and protein can alter fermentation patterns and reduce hydrogen availability [23,24]. To further evaluate the structure and reliability of the Bayesian network, we examined the BIC scores and arc strengths. The BIC score is a measure of model complexity and goodness of fit, where lower values indicate better fitting models. Arc strength, in contrast, quantifies how often a causal link appears across bootstrap samples, providing a measure of confidence in edge direction and stability. Together, these metrics validate both statistical strength and reliability of causal links. Examining the specific arcs in the network, we observed the strengths of the causal relationships between variables. The BIC values in Table 1 illustrate the significance and relevance of various pairs of variables within the Bayesian network. Additionally, the strengths of the arcs provide insights into the causal relationships within the network. These findings provide a system-level view of how dietary composition and production variables are interconnected with methane emission, thereby enhancing our understanding of the factors shaping methane variability in dairy cows.

3.4. Quantifying the Influence of Key Factors on CH4-em

Mitigation of non-CO2 greenhouse gas emissions in livestock production increasingly focuses on nutritional strategies, as diet composition strongly influences enteric methane output and offers practical options for emission reduction [16]. Our findings are consistent with those of ref. [25] and ref. [26], which revealed a significant relationship between dietary neutral detergent fiber (NDF) levels and methane emissions (MEs) in lactating dairy cows. Increasing the NDF to non-fiber carbohydrate ratios (NDF/NFC) led to decreased DMI, nutrient digestibility, and milk production across different lactation stages. Notably, higher NDF/NFC ratios were associated with elevated methane emissions in cows, demonstrating a significant increase in daily methane production as these ratios rose. This supports the biological principle that high fiber diets increase fermentation gas production and reduce feed conversion efficiency. This is consistent with evidence that fiber-rich diets increase ruminal acetate production and hydrogen generation, which methanogenic archaea convert to methane, leading to greater CH4 output and reduced energy conversion efficiency [15]. However, it is important to note that the non-significant relationships observed for other variables in this study suggest the need for further research to explore additional factors and potential interactions that may contribute to methane emissions in dairy cows. The results of multivariate regression analysis using linear and non-linear models provided valuable insights into the relative importance of the investigated variables in explaining methane emission in dairy cattle. These findings contribute to our understanding of the complex dynamics governing methane production and can inform the development of targeted strategies for mitigating GHG emissions in the livestock industry. Further research is suggested to explore additional factors and refine models for more accurate predictions and comprehensive mitigation measures.

3.5. CH4-em Prediction Using Machine Learning (ML) Models

In the prediction context, overall, the non-linear models, particularly the SPL and GP models, outperformed the linear models in predicting CH4-em based on diet-related variables, highlighting the complex, non-linear relationships between nutritional components and methane emissions. This suggests that linear models may oversimplify the biological interactions involved, whereas non-linear approaches better capture the intricate dependencies and thresholds inherent in rumen fermentation dynamics. This reflects the fact that rumen fermentation and animal physiology follow non-linear responses, such as thresholds and saturation effects, which cannot be captured by linear models. Similar studies have shown that methane emissions exhibit non-linear relationships with diet composition due to rumen fermentation kinetics, microbial growth dynamics, and nutrient passage rates, demonstrating that advanced models such as Gaussian process regression or mechanistic approaches outperform traditional linear models in capturing these biological complexities [27,28]. From a practical perspective, implementing GP- and SPL-based predictive systems in nutrition software and farm management platforms could allow real-time diet optimization and methane monitoring, helping producers adjust feeding strategies proactively. These models can also guide genetic selection and environmental benchmarking programs by providing accurate methane predictions at the individual cow level. This implies that non-linear models can better capture the underlying complexities and non-linearities present in the relationship between diet and methane emissions. The GP model showed the lowest MSE and a relatively high R2, suggesting that it provides a flexible approach for modeling the non-linear associations in the data. The results highlight the importance of considering non-linear relationships when studying the impact of diet-related variables on methane emissions in dairy cows. However, it is essential to interpret the models in the context of the specific domain and potential underlying biological processes, as the predictive performance alone may not be sufficient for drawing conclusive insights. Further investigations and validation of the models’ results could offer valuable insights for cattle farming practices and methane reduction strategies. For production-related traits, the GP model emerged as the best-performing model, indicating its remarkable ability to capture the intricate relationships between production traits and methane emissions. The results underscore the importance of considering non-linear associations when examining the impact of production-related variables on methane emissions in dairy cows.

3.6. Study Limitations and Generalizability

A limitation of this study was that the dataset combined trials differing in breed, lactation stage, parity, housing, climate, management, and diets. Such variation inflates residual variance and may obscure true effects of diet components. Therefore, the findings should be interpreted as general trends across production systems rather than precise estimates for specific contexts.

4. Materials and Methods

4.1. Meta Data

In this study, we utilized a publicly available large meta dataset collected by Donadia & Oliveira [9,10] and Donadia et al. [10] from a total of 225 peer-reviewed papers. These papers and research works were initially found by searching the keywords “dairy cows” and “methane” in the Science Direct and Web of Science data bases. The dataset comprised 303 observations with methane emission (CH4-em, n = 301) measurements and multiple diet-related variables, including neutral detergent fiber (NDF, n = 209), acid detergent fiber (ADF, n = 147), dry matter (DM, n = 134), organic matter (OM, n = 190), crude protein (CP, n = 217), ether extract (EE, n = 133), and starch (STR, n = 141). Production-related variables included body weight (BW, n = 270), milk yield (MY, n = 273), milk protein (PRO, n = 216), milk fat (FAT, n = 226), lactose (LAC, n = 184), and dry matter intake (DMI, n = 255), all measured in dairy cows across multiple studies. Prior to analysis, the dataset underwent data preprocessing to handle missing values and ensure data integrity. The response variable, ME, was measured in grams of methane per kilogram of diet intake. Our primary focus was to understand how CH4-em was affected by the feed components and how it could impact production traits. This dataset was chosen to capture the diversity of feeding systems, nutrient compositions, and production levels observed in dairy systems, thereby enabling a robust evaluation of diet–methane relationships that are central to ruminant nutrition research. Also, through statistical analyses and modeling techniques, we aimed to discern the relationship between these feed variables, production features, and methane emissions. Understanding these relationships could provide valuable insights into agricultural sustainability and the environmental impact of dairy farming practices.

4.2. Variable Importance Quantification

We conducted likelihood ratio tests (LRTs) to quantify the importance of each variable when predicting CH4-em based on the production and diet-related variables [25]. The LRT was performed by comparing the full model, where all variables were included, to reduced models, where one variable at a time was removed while keeping the rest of the variables.
L R T = 2 ln L R e d u c e d   m o d e l L F u l l   m o d e l = 2 ( l o g L F u l l   m o d e l l o g L ( R e d u c e d   m o d e l ) )
For each scenario, we used the lm() function in R to fit the full model and the reduced models. The lrtest() function from the “lmtest” package was then used to perform the likelihood ratio test and obtain the Chi-square test statistics. Additionally, the cor() function in R was implemented to estimate the Pearson’s correlation coefficients, which quantify the linear relationship between pairs of variables. Correlation is a powerful tool that provides valuable insights into the degree of relationship and association between continuous variables. We applied LRTs and correlation analysis to identify which nutrients and production traits had the greatest influence on methane emissions, helping to prioritize dietary strategies that could mitigate methane output while supporting ruminant productivity.

4.3. Learning Interrelationship Structures Among Variables Using Bayesian Network

We inferred the causal relationships between feed components and production-related variables using Bayesian networks (BNs). BNs are probabilistic graphical models that represent dependencies among variables through directed acyclic graphs (DAGs) [26]. The “bnlearn” R package version 5.1 was utilized for the inference process [27]. Prior to inference, we performed data preprocessing, including centering and scaling the datasets using the scale() function in R. For the feed component variables, we conducted the inference using the growth shrinkage (GS) algorithm and for the production-related traits, the hybrid two-phase constraint (H2PC) algorithm was used. We selected the best-performing algorithm for each set of variables, which produced networks consistent with known biological relationships among each pair of variables. Also, we considered 500 bootstrap iterations (R = 500) to obtain reliable estimates for each network. The boot.strength() function was used to compute the bootstrapped edge strength for each variable pair based on the GS and H2PC algorithms. The averaged.network() function was then used to obtain the average network from the bootstrapped results, by setting a threshold of 0.05. The graphviz.plot() function was used to visualize the resulting Bayesian network with nodes. Additionally, the Bayesian information criterion (BIC) with Gaussian priors (bic-g) was employed to score the model’s fit, and the arc strength was calculated using the same criterion [27,28]. We applied Bayesian networks to explore complex interdependencies among feed nutrients, intake levels, and production outcomes, allowing us to uncover conditional relationships and potential causal pathways that may explain how diet formulations affect methane emissions and milk composition. This approach enables nutritionists to visualize nutrient trade-offs and better understand indirect effects that are not apparent from simple regression models.

4.4. Machine Learning Predictive Models

In our study, we utilized a range of machine learning models to examine the influence of dietary and production-related variables on methane emissions. These models were categorized into linear and non-linear types based on their characteristics. The following linear models were included: 1—ordinary least squares (OLS), which assumes a linear relationship between predictor variables and methane emissions, aiming to minimize the sum of squared differences between predicted and actual emissions; 2—least absolute shrinkage and selection operator (LASSO), a linear regression model with L1 regularization that adds a penalty term to the OLS objective, promoting some coefficients to be exactly zero and thus performing feature selection; 3—ridge regression (RR), a linear model with L2 regularization, that was employed to prevent multicollinearity and overfitting by introducing a penalty term to the OLS objective; and 4—elastic net (EN), which combines the features of both LASSO and ridge regression by incorporating both L1 and L2 regularization techniques to balance feature selection and regularization. Moreover, we employed four distinct non-linear models, which included the following: 1—partial least squares regression (PLSR), which addresses the multicollinearity among predictor variables by creating latent variables that explain the maximum variance in both diet-related variables and methane emissions; 2—spline regression (SPL), which captures the non-linear relationships between diet-related variables and methane emissions using piecewise polynomials; 3—support vector machine (SVM), which was adapted for regression to identify a hyperplane that best fits the data, minimizing prediction errors for methane emissions based on diet-related variables; and 4—Gaussian process (GP), a probabilistic regression model that captures uncertainty in predictions using Gaussian distributions, making it effective for small datasets and capable of modeling non-linear relationships [29,30]. We implemented this diverse set of machine learning approaches to benchmark predictive accuracy and identify the most effective modeling strategy for methane prediction in dairy systems, which could guide ration formulation and emission monitoring in precision ruminant nutrition.
To evaluate the performance of each machine learning model, we employed two key metrics: mean squared error (MSE) and R-squared (R2). MSE measures the average squared difference between predicted and actual methane emissions, with lower values indicating better predictive accuracy. R2 represents the proportion of variance in methane emissions explained by the model, with higher values indicating a better fit and suggesting that the model captures more variability in methane emissions. The best-fitting model was selected based on the highest R2 and lowest MSE values. The analyses were conducted in the R environment using various packages: “gplm” for Gaussian process regression models, “e1071” for SVM modeling, “glmnet” for regularized linear regression models (LASSO and ridge regression), “pls” for PLSR, “kernlab” for kernel-based methods, and “splines” for SPL [30,31]. By applying these machine learning models and evaluation metrics to our dataset, we aimed to identify the most influential diet-related factors and production traits affecting methane emissions in dairy cows. The results provide valuable insights into the relationships between diet-related variables, production traits, and methane emissions, contributing to a comprehensive understanding of methane production in cattle farming.

5. Conclusions

In conclusion, this study addresses the significant environmental impact of methane emissions from dairy cattle and quantifies the relationships between diet-related factors and production traits. The results highlight the influential role of NDF, ADF, and DM in shaping methane emissions, confirming their importance across diverse production contexts. Correlation analysis and Bayesian network modeling provided a system-level assessment of how diet composition and production traits jointly influence methane dynamics, while non-linear models, particularly SPL and GP, demonstrated superior predictive performances compared with linear approaches.
Beyond methodological insights, these findings carry practical implications for the design of precision feeding strategies. By identifying key dietary factors that consistently influence methane output, the study provides actionable targets for ration formulation and individualized feeding adjustments. Integrating these relationships into decision-support tools and precision nutrition systems can help producers optimize diets to improve productivity while reducing methane emissions. Such approaches align environmental sustainability with herd efficiency, offering a pathway toward climate-smart livestock management. However, limitations include the reliance on observational data and the need for validation across different herd environments. Future research should explore intervention-based trials and microbial-level analyses to refine predictive models and deepen understanding of diet–emission mechanisms. Overall, this study identifies key dietary drivers of methane emissions and demonstrates the value of advanced predictive modeling, offering clear, actionable strategies for precision feeding and climate-smart dairy management.

Author Contributions

M.M. (Mohammadreza Mohammadabadi) and M.M. (Mehdi Momen) conceived and designed the study. M.A.R. and M.M. (Moslem Momen) were responsible for methodology, software, and formal analysis. M.A.R. and S.F.M. conducted the visualization. M.A.R. and M.M. (Mehdi Momen) wrote the original draft. M.M. (Moslem Momen) and S.F.M. conducted data gathering, quality control, and model evaluations. M.M. (Moslem Momen) and S.F.M. contributed to the study by reviewing and editing the report. M.M. (Mohammadreza Mohammadabadi) was responsible for project administration, investigation, and supervision. All authors have read and agreed to the published version of the manuscript.

Funding

This research received no specific grant from any funding agency, commercial, or non-profit sectors.

Data Availability Statement

The datasets utilized in this study are accessible through Donadia et al. (2023) [9] and Donadia and Oliveira (2023) [10].

Conflicts of Interest

The authors declare no conflicts of interest.

References

  1. Maasakkers, J.D.; McDuffie, E.E.; Sulprizio, M.P.; Chen, C.; Schultz, M.; Brunelle, L.; Thrush, R.; Steller, J.; Sherry, C.; Jacob, D.J.; et al. A Gridded Inventory of Annual 2012–2018 U.S. Anthropogenic Methane Emissions. Environ. Sci. Technol. 2023, 57, 16276–16288. [Google Scholar] [CrossRef]
  2. Minx, J.C.; Lamb, W.F.; Andrew, R.M.; Canadell, J.G.; Crippa, M.; Döbbeling, N.; Forster, P.M.; Guizzardi, D.; Olivier, J.; Peters, G.P.; et al. A Comprehensive and Synthetic Dataset for Global, Regional, and National Greenhouse Gas Emissions by Sector 1970–2018 with an Extension to 2019. Earth Syst. Sci. Data 2021, 13, 5213–5252. [Google Scholar] [CrossRef]
  3. Liu, Z. How Much Gas Do Beef or Dairy Cattle Produce? Kansas State University Agricultural Experiment Station and Cooperative Extension Service: Manhattan, KS, USA, 2015. [Google Scholar]
  4. Honan, M.; Feng, X.; Tricarico, J.M.; Kebreab, E. Feed Additives as a Strategic Approach to Reduce Enteric Methane Production in Cattle: Modes of Action, Effectiveness and Safety. Anim. Prod. Sci. 2021, 62, 1303–1317. [Google Scholar] [CrossRef]
  5. Velarde-Guillén, J.; Pellerin, D.; Benchaar, C.; Wattiaux, M.A.; Charbonneau, É. Development of an Equation to Estimate the Enteric Methane Emissions from Holstein Dairy Cows in Canada. Can. J. Anim. Sci. 2019, 99, 792–803. [Google Scholar] [CrossRef]
  6. Beauchemin, K.A.; McAllister, T.A.; McGinn, S.M. Dietary Mitigation of Enteric Methane from Cattle. CABI Rev. 2009, 4, 1–18. [Google Scholar] [CrossRef]
  7. Hammond, K.J.; Humphries, D.J.; Westbury, D.B.; Thompson, A.; Crompton, L.A.; Kirton, P.; Green, C.; Reynolds, C.K. The Inclusion of Forage Mixtures in the Diet of Growing Dairy Heifers: Impacts on Digestion, Energy Utilisation, and Methane Emissions. Agric. Ecosyst. Environ. 2014, 197, 88–95. [Google Scholar] [CrossRef]
  8. Danielsson, R.; Dicksved, J.; Sun, L.; Gonda, H.; Müller, B.; Schnürer, A.; Bertilsson, J. Methane Production in Dairy Cows Correlates with Rumen Methanogenic and Bacterial Community Structure. Front. Microbiol. 2017, 8, 226. [Google Scholar] [CrossRef]
  9. Donadia, A.B.; Oliveira, A.S. Complete Dataset of the Methane Submodel, The Nutrition System for Dairy Cows (NS Dairy Cattle); Dairy Cattle Research Lab, Universidade Federal de Mato Grosso, Campus Sinop: Mato Grosso, Brazil, 2023; Mendeley Data. Mendeley Data 1. Available online: https://data.mendeley.com/datasets/gbrjnh89zj/1 (accessed on 15 September 2025).
  10. Donadia, A.B.; Torres, R.N.S.; Silva, H.M.d.; Soares, S.R.; Hoshide, A.K.; Oliveira, A.S.d. Factors Affecting Enteric Emission Methane and Predictive Models for Dairy Cows. Animals 2023, 13, 1857. [Google Scholar] [CrossRef]
  11. Knapp, J.R.; Laur, G.L.; Vadas, P.A.; Weiss, W.P.; Tricarico, J.M. Invited Review: Enteric Methane in Dairy Cattle Production: Quantifying the Opportunities and Impact of Reducing Emissions. J. Dairy Sci. 2014, 97, 3231–3261. [Google Scholar] [CrossRef]
  12. Gerber, P.J.; Henderson, B.; Makkar, H.P.S. Mitigation of Greenhouse Gas Emissions in Livestock Production: A Review of Technical Options for Non-CO2 Emissions; Food and Agriculture Organization of the United Nations: Roma, Italy, 2013; ISBN 9789251076583. [Google Scholar]
  13. Hristov, A.N.; Oh, J.; Firkins, J.L.; Dijkstra, J.; Kebreab, E.; Waghorn, G.; Makkar, H.P.S.; Adesogan, A.T.; Yang, W.; Lee, C.; et al. SPECIAL TOPICS—Mitigation of Methane and Nitrous Oxide Emissions from Animal Operations: I. A Review of Enteric Methane Mitigation Options1. J. Anim. Sci. 2013, 91, 5045–5069. [Google Scholar] [CrossRef]
  14. Patra, A.K. Recent Advances in Measurement and Dietary Mitigation of Enteric Methane Emissions in Ruminants. Front Vet. Sci. 2016, 3, 39. [Google Scholar] [CrossRef]
  15. Rymer, C.; Huntington, J.A.; Williams, B.A.; Givens, D.I. In Vitro Cumulative Gas Production Techniques: History, Methodological Considerations and Challenges. Anim. Feed Sci. Technol. 2005, 123–124, 9–30. [Google Scholar] [CrossRef]
  16. Scoones, I. Livestock, Methane, and Climate Change: The Politics of Global Assessments. Wiley Interdiscip Rev. Clim. Change 2023, 14, e790. [Google Scholar] [CrossRef] [PubMed]
  17. Huhtanen, P.; Krizsan, S.J.; Ramin, M. A Meta-Analysis of Faecal Output and Nutrient Composition, and Potential Methane Emission from Manure of Dairy Cows. Anim. Feed Sci. Technol. 2021, 282, 115120. [Google Scholar] [CrossRef]
  18. Gislon, G.; Colombini, S.; Borreani, G.; Crovetto, G.M.; Sandrucci, A.; Galassi, G.; Tabacco, E.; Rapetti, L. Milk Production, Methane Emissions, Nitrogen, and Energy Balance of Cows Fed Diets Based on Different Forage Systems. J. Dairy Sci. 2020, 103, 8048–8061. [Google Scholar] [CrossRef] [PubMed]
  19. Fresco, S.; Boichard, D.; Fritz, S.; Lefebvre, R.; Barbey, S.; Gaborit, M.; Martin, P. Comparison of Methane Production, Intensity, and Yield throughout Lactation in Holstein Cows. J. Dairy Sci. 2023, 106, 4147–4157. [Google Scholar] [CrossRef]
  20. Janssen, P.H.; Kirs, M. Structure of the Archaeal Community of the Rumen. Appl. Environ. Microbiol. 2008, 74, 3619–3625. [Google Scholar] [CrossRef]
  21. Pszczola, M.; Calus, M.P.L.; Strabel, T. Genetic Correlations between Methane and Milk Production, Conformation, and Functional Traits. J. Dairy Sci. 2019, 102, 5342–5346. [Google Scholar] [CrossRef]
  22. Dong, L.-F.; Jia, P.; Li, B.-C.; Wang, B.; Yang, C.-L.; Liu, Z.-H.; Diao, Q.-Y. Quantification and Prediction of Enteric Methane Emissions from Chinese Lactating Holstein Dairy Cows Fed Diets with Different Dietary Neutral Detergent Fiber/Non-Fibrous Carbohydrate (NDF/NFC) Ratios. J. Integr. Agric. 2022, 21, 797–811. [Google Scholar] [CrossRef]
  23. Ellis, J.L.; Dijkstra, J.; Kebreab, E.; Bannink, A.; Odongo, N.E.; McBRIDE, B.W.; France, J. Aspects of Rumen Microbiology Central to Mechanistic Modelling of Methane Production in Cattle. J. Agric. Sci. 2008, 146, 213–233. [Google Scholar] [CrossRef]
  24. Janssen, P.H. Influence of Hydrogen on Rumen Methane Formation and Fermentation Balances through Microbial Growth Kinetics and Fermentation Thermodynamics. Anim. Feed Sci. Technol. 2010, 160, 1–22. [Google Scholar] [CrossRef]
  25. Berger, R.L. Likelihood Ratio Tests and Intersection-Union Tests. In Advances in Statistical Decision Theory and Applications; Birkhäuser Boston: Boston, MA, USA, 1997; pp. 225–237. [Google Scholar]
  26. Heckerman, D. A Tutorial on Learning with Bayesian Networks. In Innovations in Bayesian Networks: Theory and Applications; Springer: Berlin/Heidelberg, Germany, 2008; pp. 33–82. [Google Scholar]
  27. Scutari, M. Learning Bayesian Networks with the Bnlearn R Package. arXiv 2009, arXiv:0908.3817. [Google Scholar]
  28. Scutari, M.; Denis, J.-B. Bayesian Networks: With Examples in R; CRC Press: Boca Raton, FL, USA, 2021; ISBN 1000410382. [Google Scholar]
  29. Hastie, T.; Tibshirani, R.; Friedman, J. The Elements of Statistical Learning: Data Mining, Inference, and Prediction, 2nd ed.; Springer: New York, NY, USA, 2009. [Google Scholar] [CrossRef]
  30. Tibshirani, R. Regression Shrinkage and Selection via the Lasso. J. R. Stat. Soc. Ser. B 1996, 58, 267–288. [Google Scholar] [CrossRef]
  31. Rasmussen, C.E.; Williams, C.K.I. Gaussian Processes for Machine Learning; MIT Press: Cambridge, MA, USA, 2006. [Google Scholar] [CrossRef]
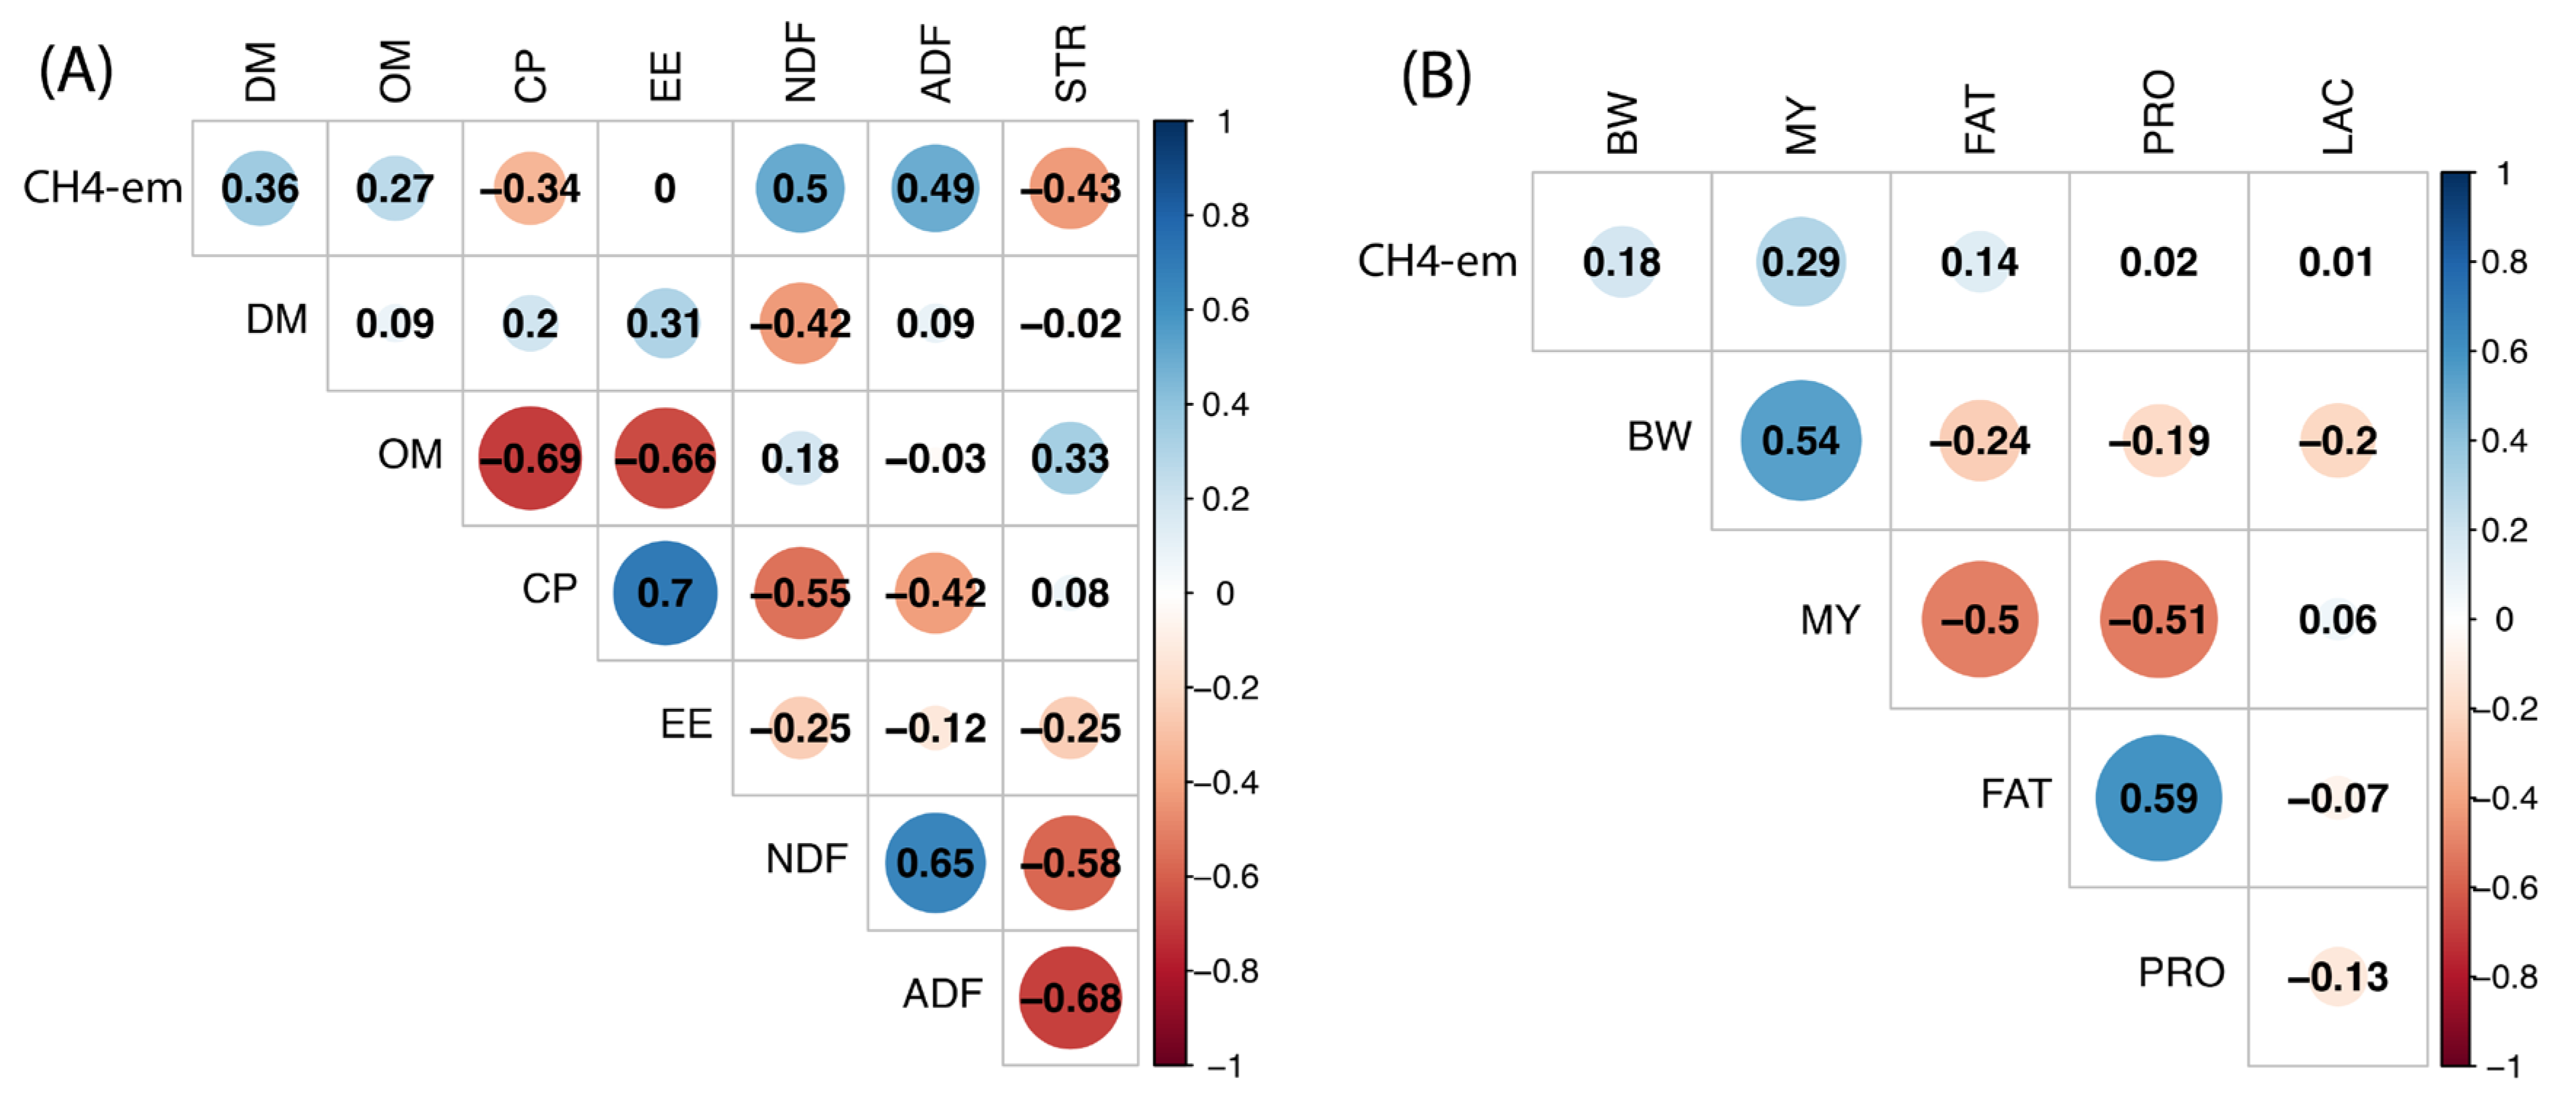
Figure 1. Correlation heatmap of factors affecting methane production in dairy cattle. (A) Diet chemical ingredients; (B) production traits. acid detergent fiber (ADF, n = 147), neutral detergent fiber (NDF, n = 209), dry matter (DM, n = 134), organic matter (OM, n = 190), crude protein (CP, n = 217), ether extract (EE, n = 133), starch (STR, n = 141), methane emissions (Ch4-em, n = 301), milk yield (MY, n = 273), milk fat (FAT, n = 226), milk protein (PRO, n = 216), lactose (LAC, n = 184), and body weight (BW, n = 270).
Methane 04 00021 g001
Figure 2. Methane emission metrics across body weight and milk yield categories. Total methane emissions (g/day), methane yield (g/kg DMI), and methane intensity (g/kg milk) are presented as mean ± standard deviation for each group classified by body weight (Large, Medium, Small) and milk yield (High, Medium, Low).
Methane 04 00021 g002
Figure 3. The inferred Bayesian network for diet chemical components (plot A) and production variables (plot B). ADF: acid detergent fiber (n = 147); NDF: neutral detergent fiber (n = 209); DM: dry matter (n = 134); OM: organic matter (n = 190); CP: crude protein (n = 217); EE: ether extract (n = 133); STR: starch (n = 141); CH4-me: methane emissions (n = 301); MY: milk yield (n = 273); FAT (n = 226); PRO: protein (n = 216); LAC: lactose (n = 184); BW: body weight (n = 270).
Methane 04 00021 g003
Table 1. Strengths of interactions among nutritional factors and production variables with methane emission (ME) derived from BN analysis using bootstrapping technique.
GroupFrom 1ToBICStrength 2Direction 3
Nutritional factorsDMME−8.1860.9800.700
DMEE−0.4170.5700.770
DMNDF−5.3551.0000.820
OMCP−10.3421.0000.840
OMEE−1.0650.7400.910
OMSTR0.1300.8800.580
CPEE0.0330.8900.650
NDFME−7.4000.9400.650
ADFME0.9030.8500.570
ADFCP−4.2840.8000.880
ADFNDF−3.6370.7500.970
STRNDF0.7440.9500.620
Production traitsMEMY−14.8790.8150.662
MEFAT0.9350.3210.634
MYBW−32.2871.0000.610
FATMY−10.3760.9370.597
FATPRO−36.4181.0000.583
PROMY−6.2890.9660.502
PROLAC1.1640.1630.654
PROBW−4.7870.7280.636
1 ADF: acid detergent fiber; NDF: neutral detergent fiber; DM: dry matter; OM: organic matter; CP: crude protein; EE: ether extract; STR: starch; PRO: milk protein; FAT: milk fat content; LAC: lactose and MY: milk yield. 2 The strength indicates the frequency of the edge is present. 3 The direction measures the frequency of the direction conditioned on the presence of edge.
Table 2. Regression estimates and model fit statistics for methane emission predictors and likelihood ratio test (LRT) results.
GroupVariable 1 b (SE)Chisq. ( χ 2 )LRT Pr (>Chisq)
Nutritional factorsDM0.216 (0.115)1.0250.598
OM2.101 (1.55)1.2490.535
CP−1.69 (0.968)0.7010.704
EE0.021 (2.69)0.720.868
NDF0.827 (0.289)12.1660.002281 **
ADF1.80 (0.648)2.4370.295
STR−0.612 (0.265)0.6970.705
Production traitsBW2.106 (0.84)0.03720.847
MY3.892 (0.95)25.1875.20 × 10−7 ***
FAT2.572 (1.41)14.9541.10 × 10−4 ***
PRO0.862 (2.92)0.76120.383
LAC0.301 (3.49)0.02620.8715
1 DMI: dry matter intake; OM: organic matter; EE: ether extract (g/kg DM); NDF: neutral detergent fiber (g/kg DM); ADF: acid detergent fiber of diet (g/kg DM); FAT: milk fat (g/kg); LAC: milk lactose (g/kg); DM: dry matter intake (kg/day); MY: milk yield (kg/day); BW: body weight (kg). **, and *** denote significance at p < 0.05, p < 0.01, and p < 0.001, respectively.
Table 3. Comparison of predictive performance of machine learning (ML) models for diet and production-related variables in methane emission using mean squared error (MSE) and R-squared (R2).
Model 1Diet VariablesProduction Variables
MSE R 2 MSE R 2
Linear OLS2826.5510.6827104.9720.196
LASSO2826.9070.6827105.0470.196
RR3000.0520.6667110.4950.196
EN2826.850.6827105.0530.196
Non-linearPLSR2826.9630.6827104.9720.196
SPL1494.5790.8325764.4160.348
SVM3011.7160.7313652.1750.595
GP2242.790.8441969.9750.861
1 OLS: ordinary least squares; LASSO: least absolute shrinkage and selection operator; RR: ridge regression; EN: elastic net; PLSR: partial least squares regression; SPL: spline Regression; SVM: support vector machine; GP: Gaussian process.
Disclaimer/Publisher’s Note: The statements, opinions and data contained in all publications are solely those of the individual author(s) and contributor(s) and not of MDPI and/or the editor(s). MDPI and/or the editor(s) disclaim responsibility for any injury to people or property resulting from any ideas, methods, instructions or products referred to in the content.