
Biogas Energy Usage Through the Co-Digestion of the Organic Fraction of Urban Solid Waste with Lime Mud: An Environmental Impact Analysis

 ,
,  , ,
, ,  , , ,
, , ,
Abstract
1. Introduction
2. Results and Discussion
2.1. Guidelines for the Implementation of Public Policies
2.2. Final Remarks
3. Methodology
3.1. Life Cycle Assessment
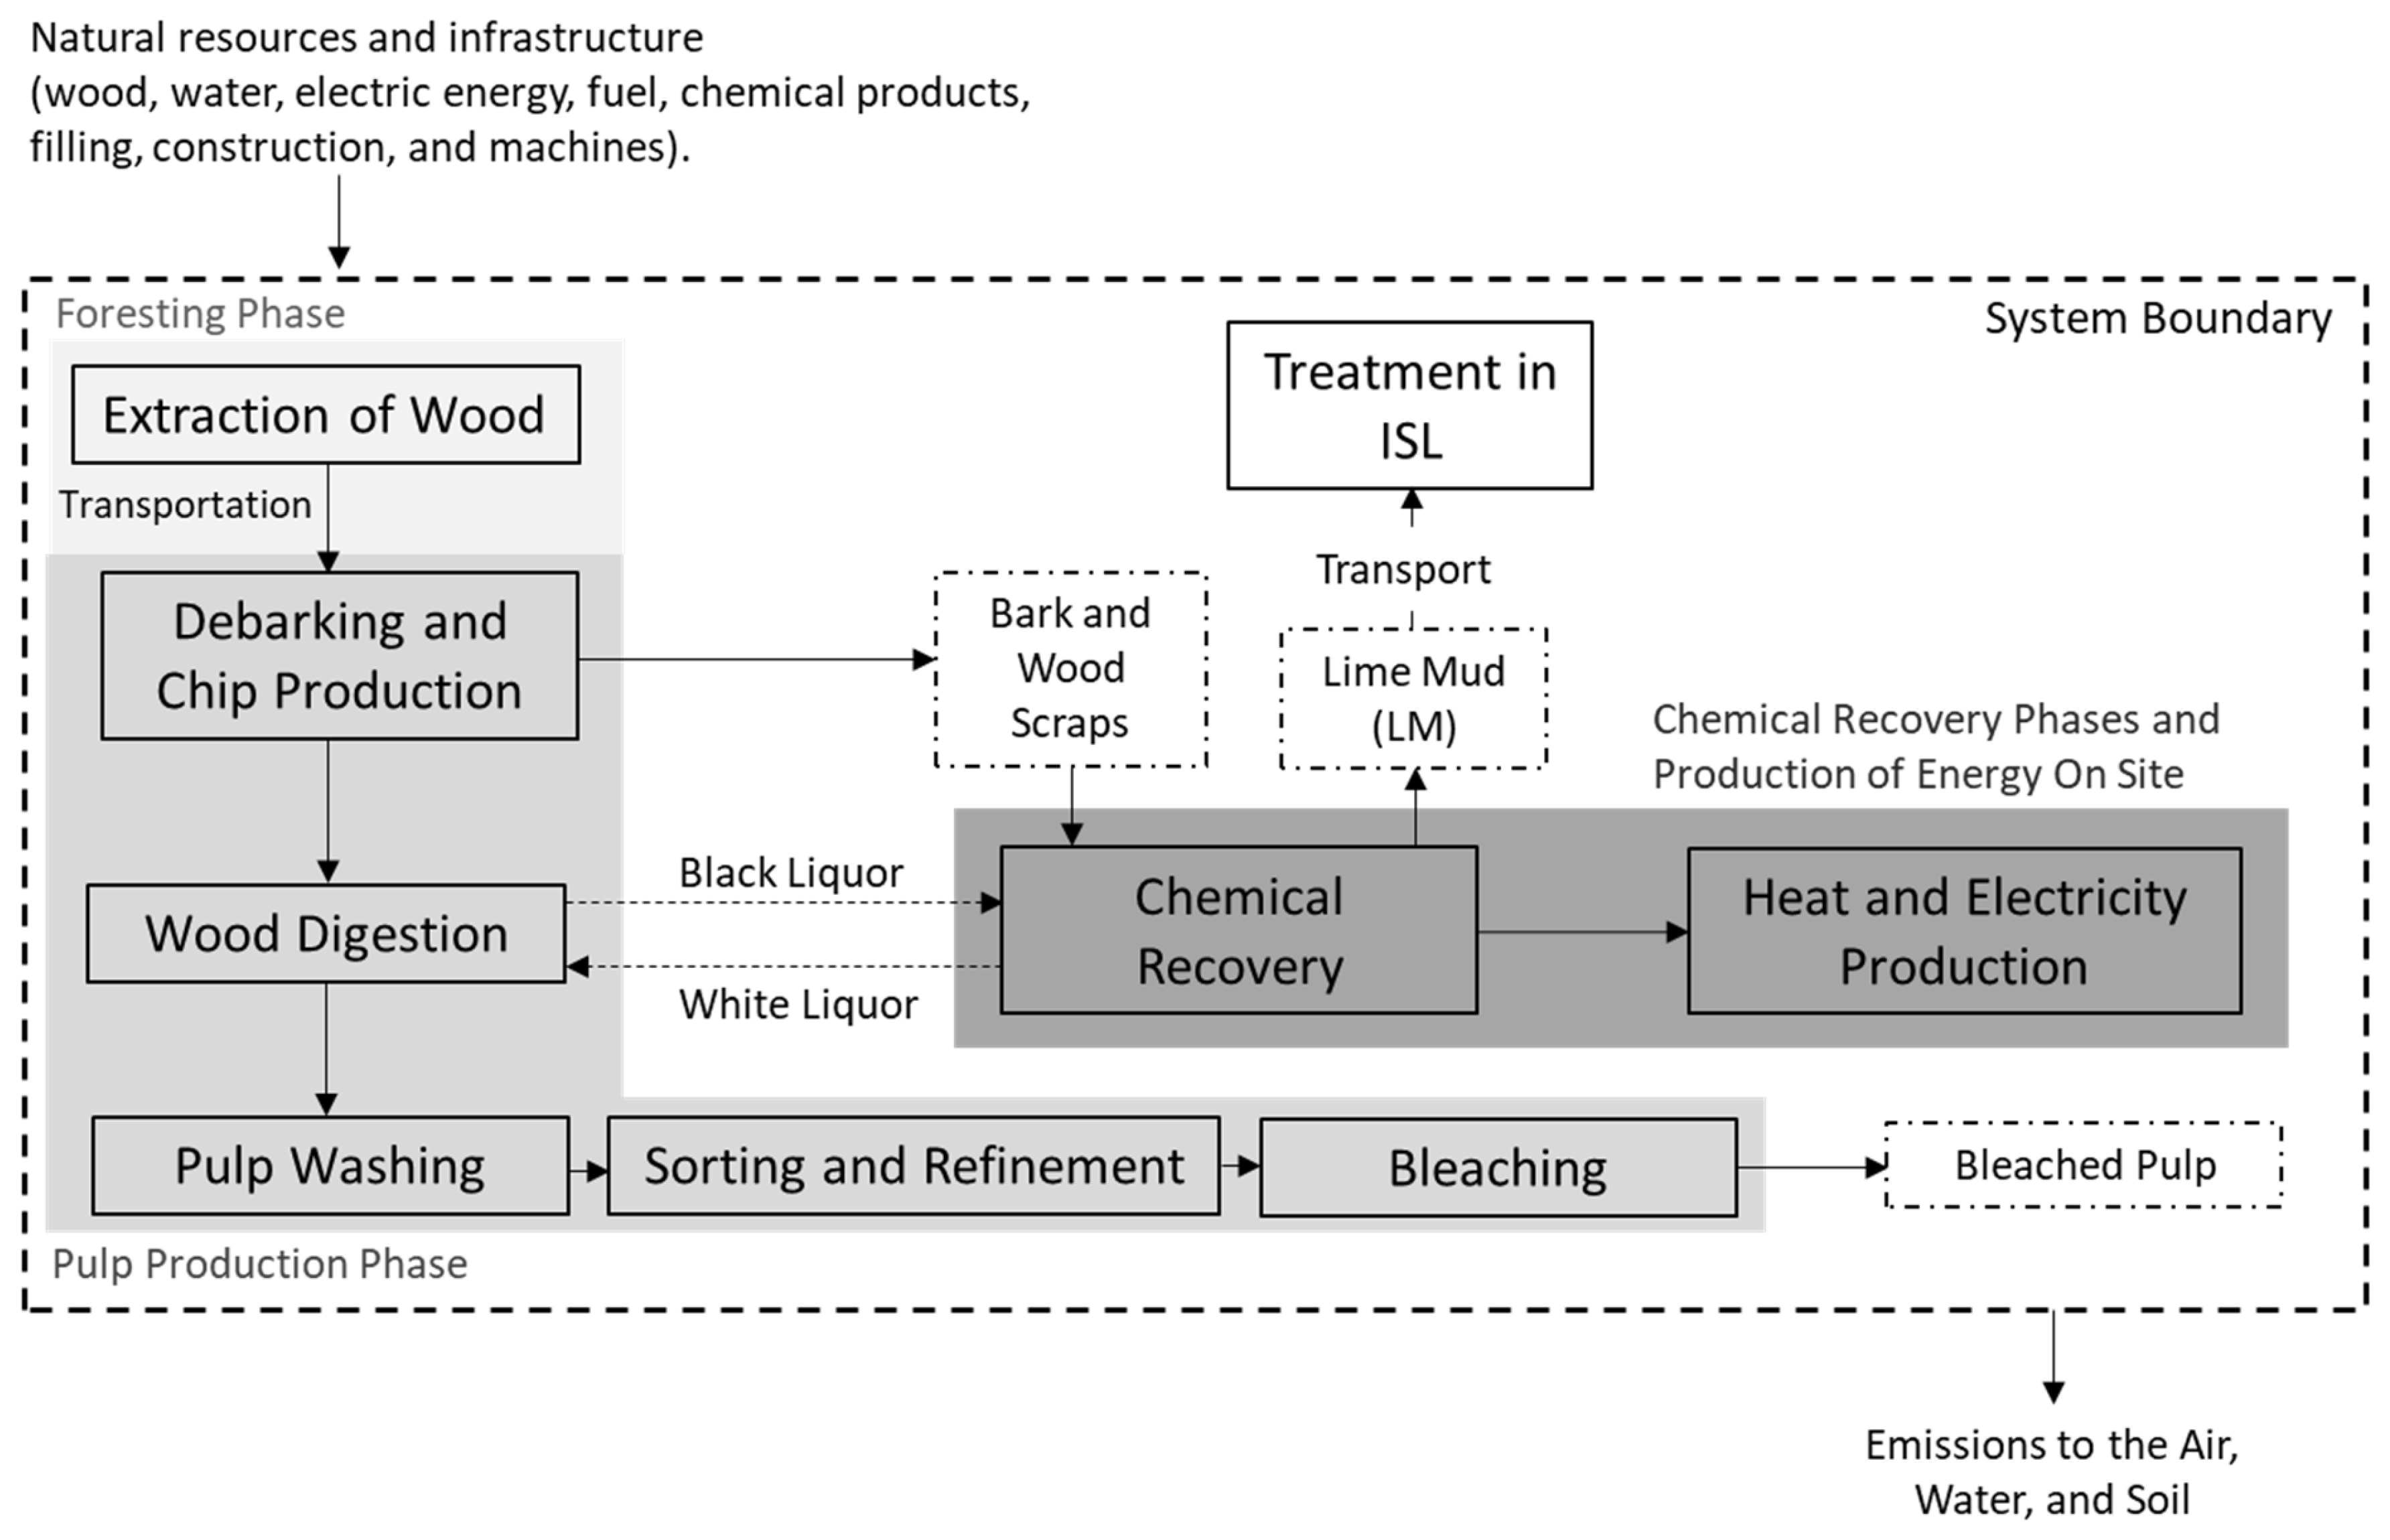
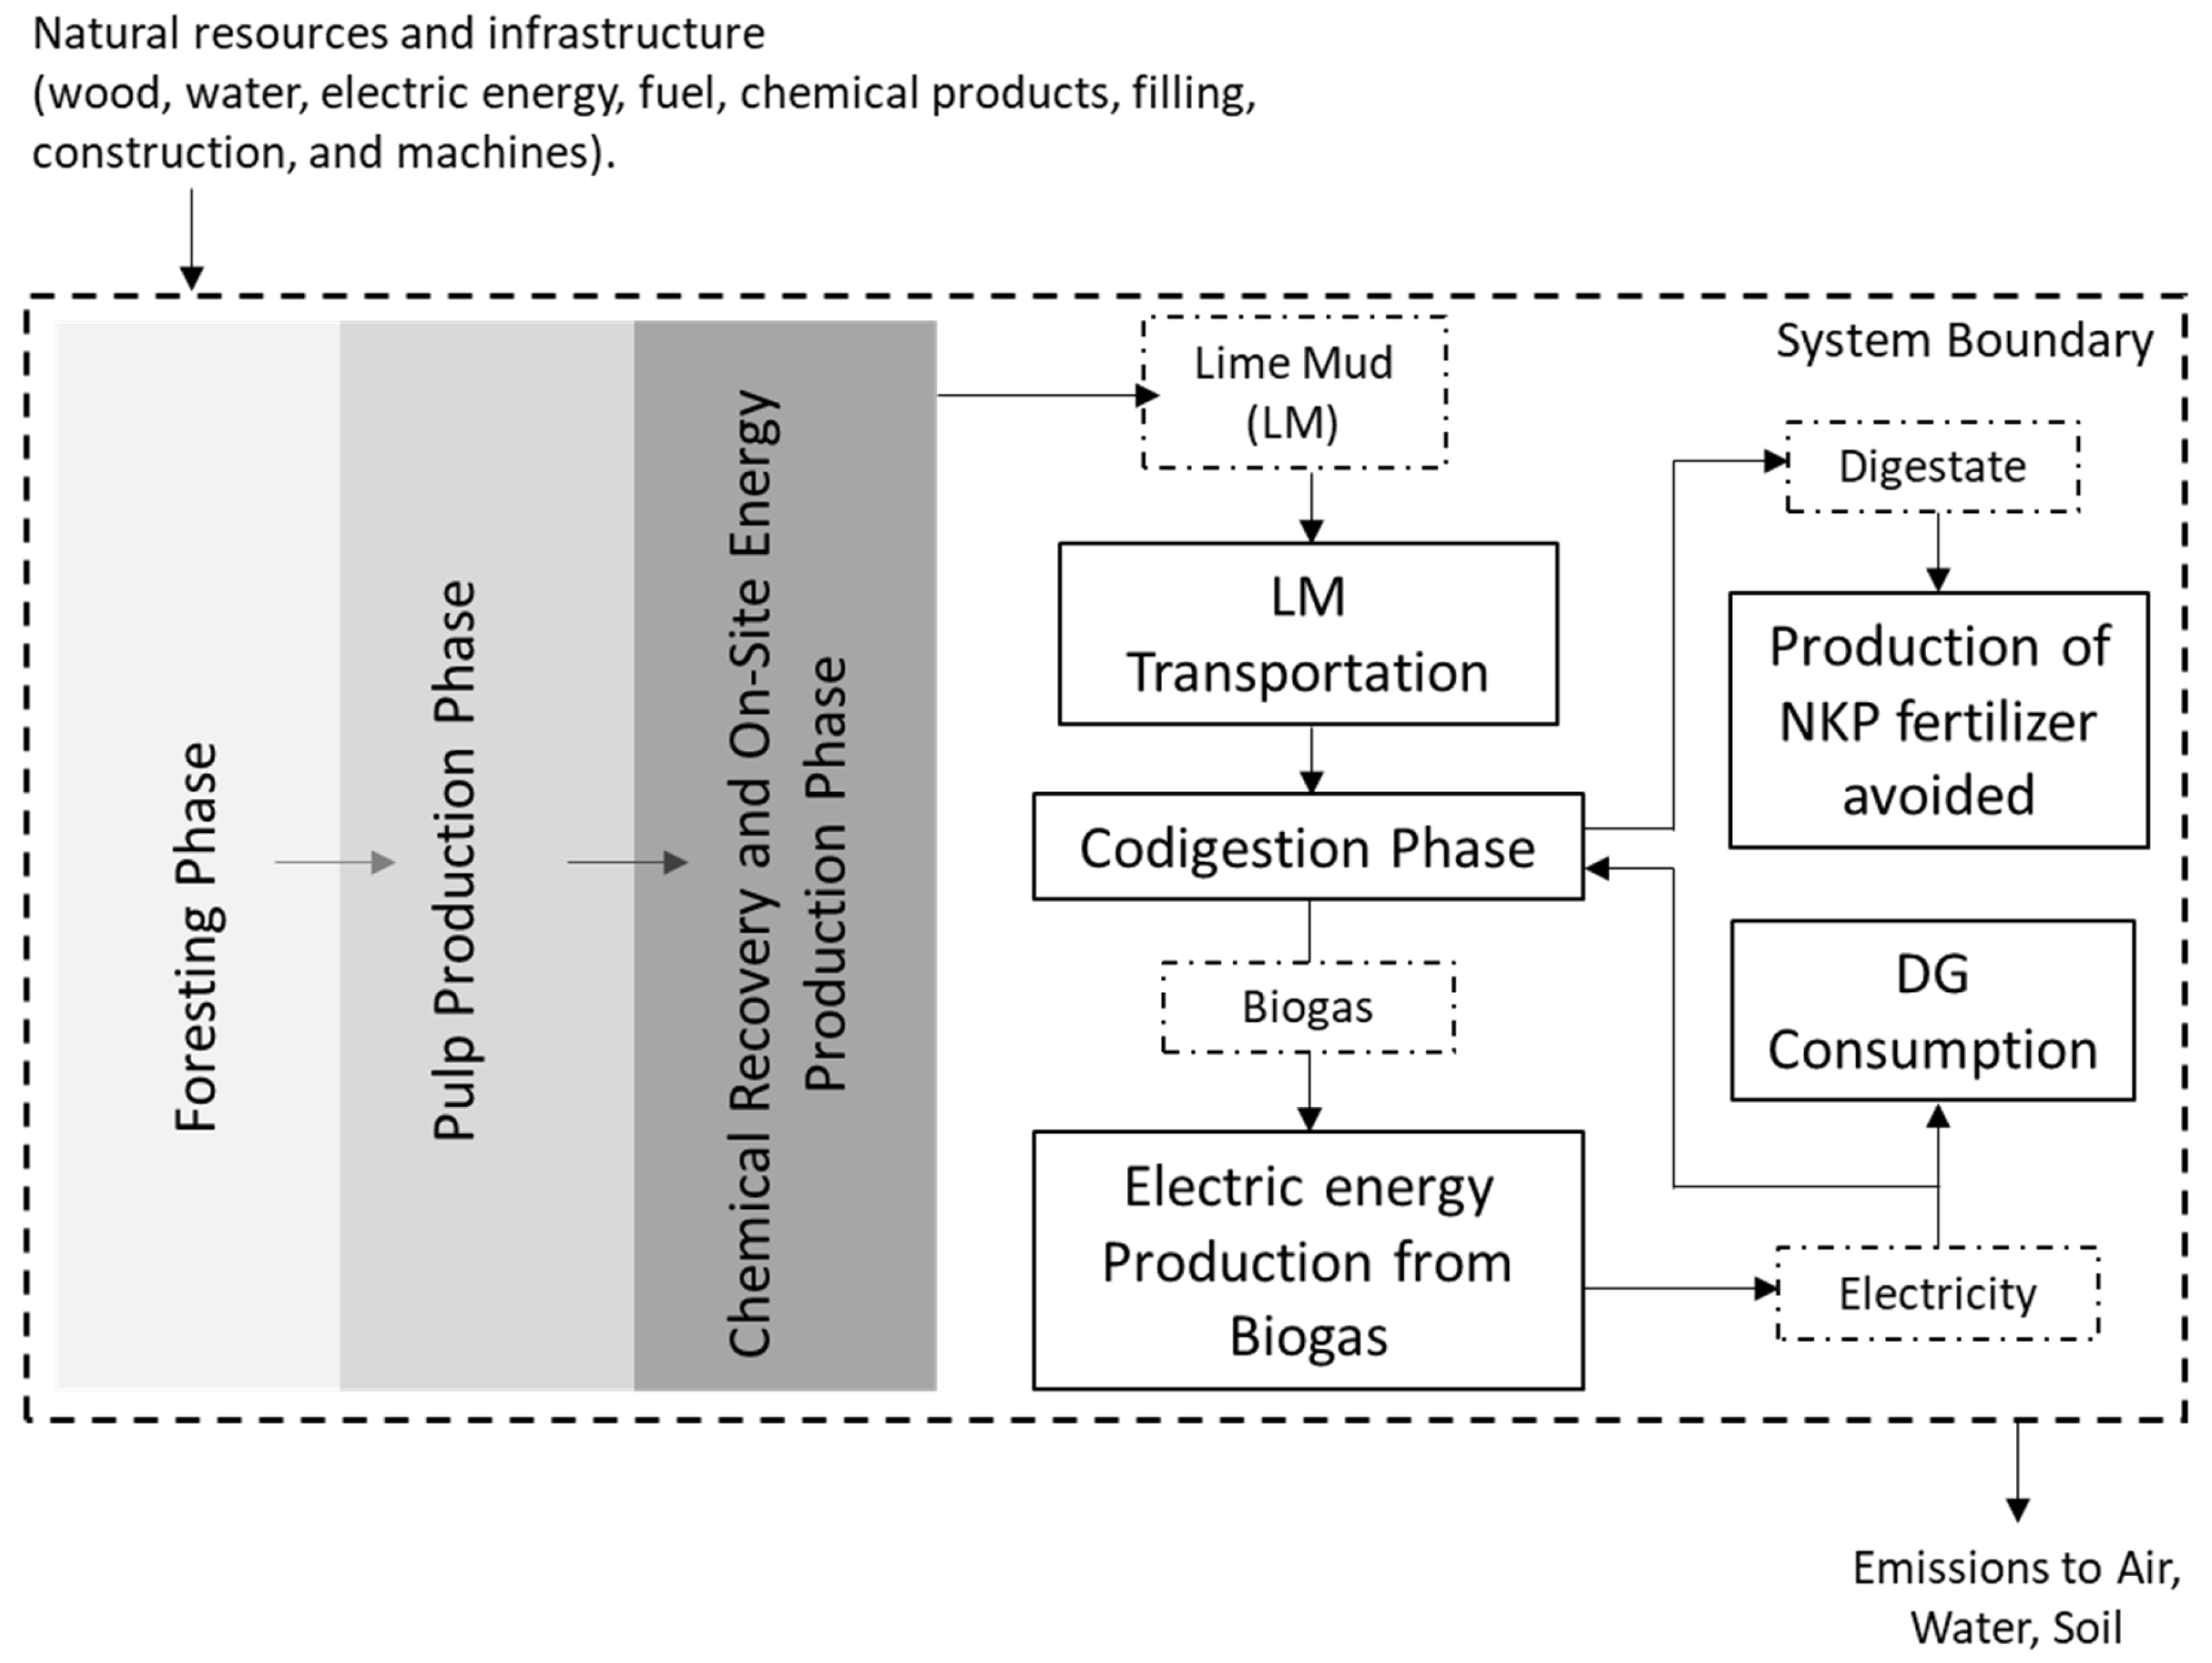
3.1.1. Objective and Scope
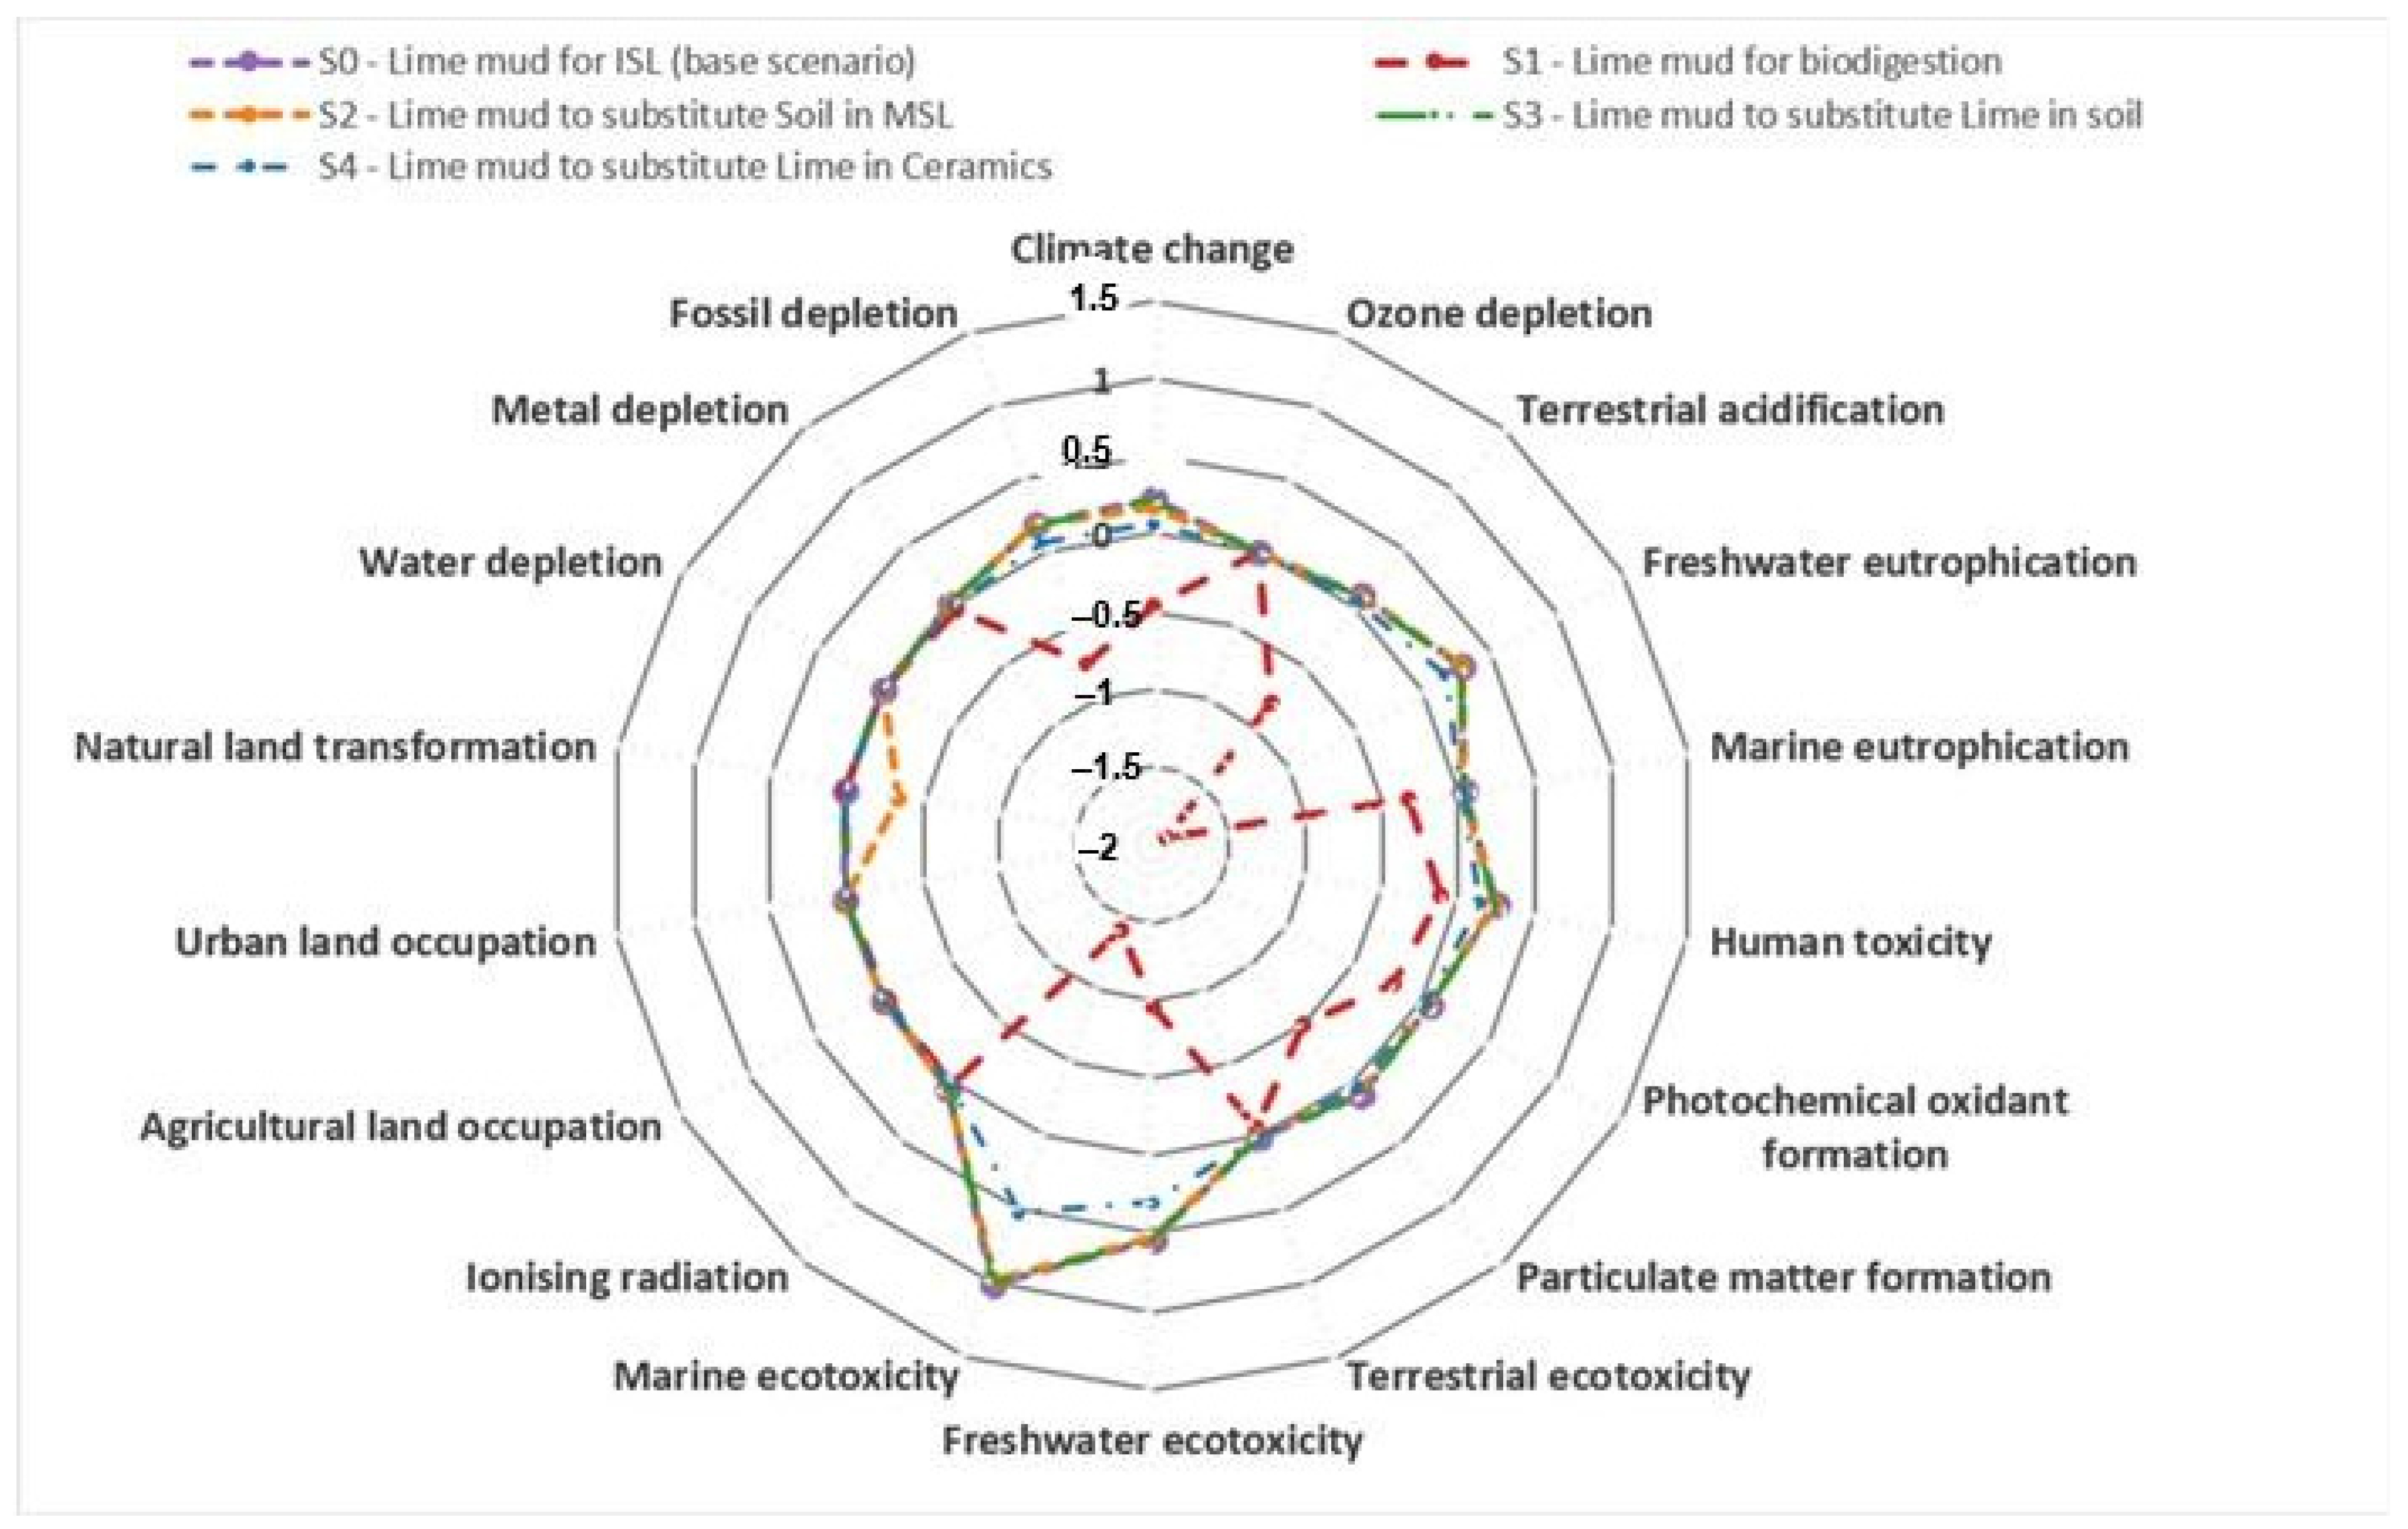
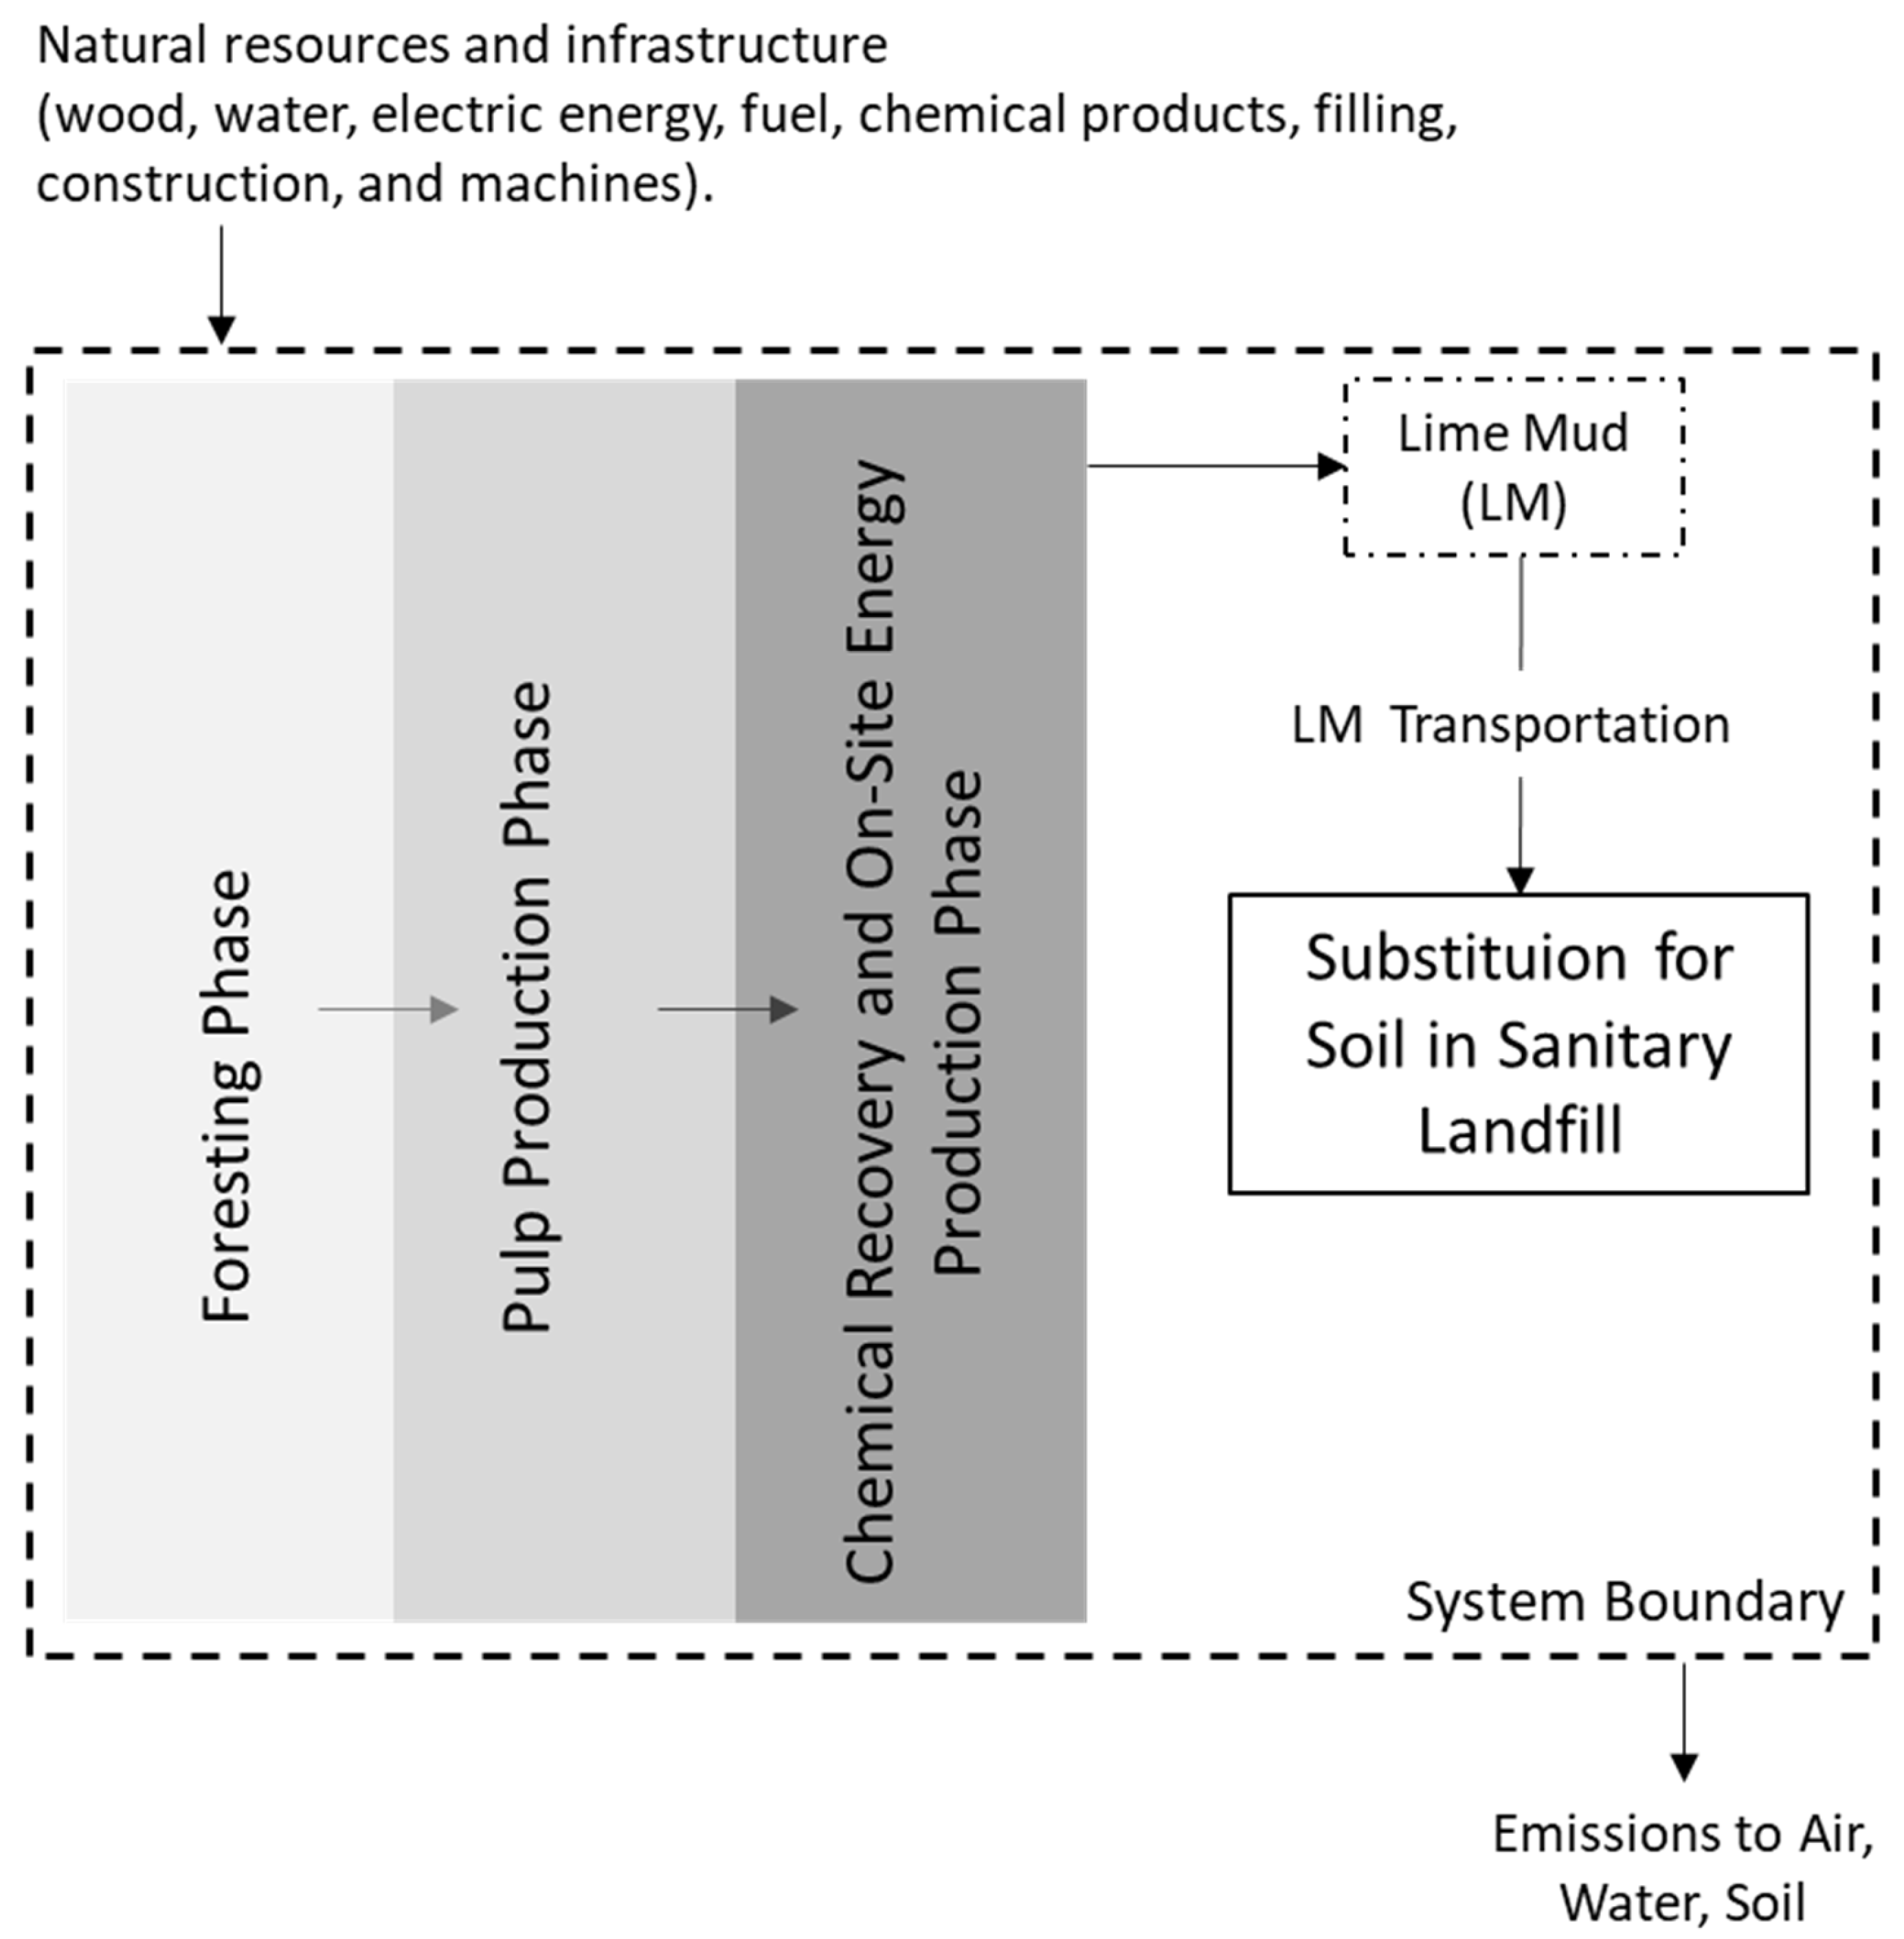
- S2: Final disposal of lime mud is in a sanitary landfill, where it will be used as an intermediate covering, substituting soil (Figure 9).
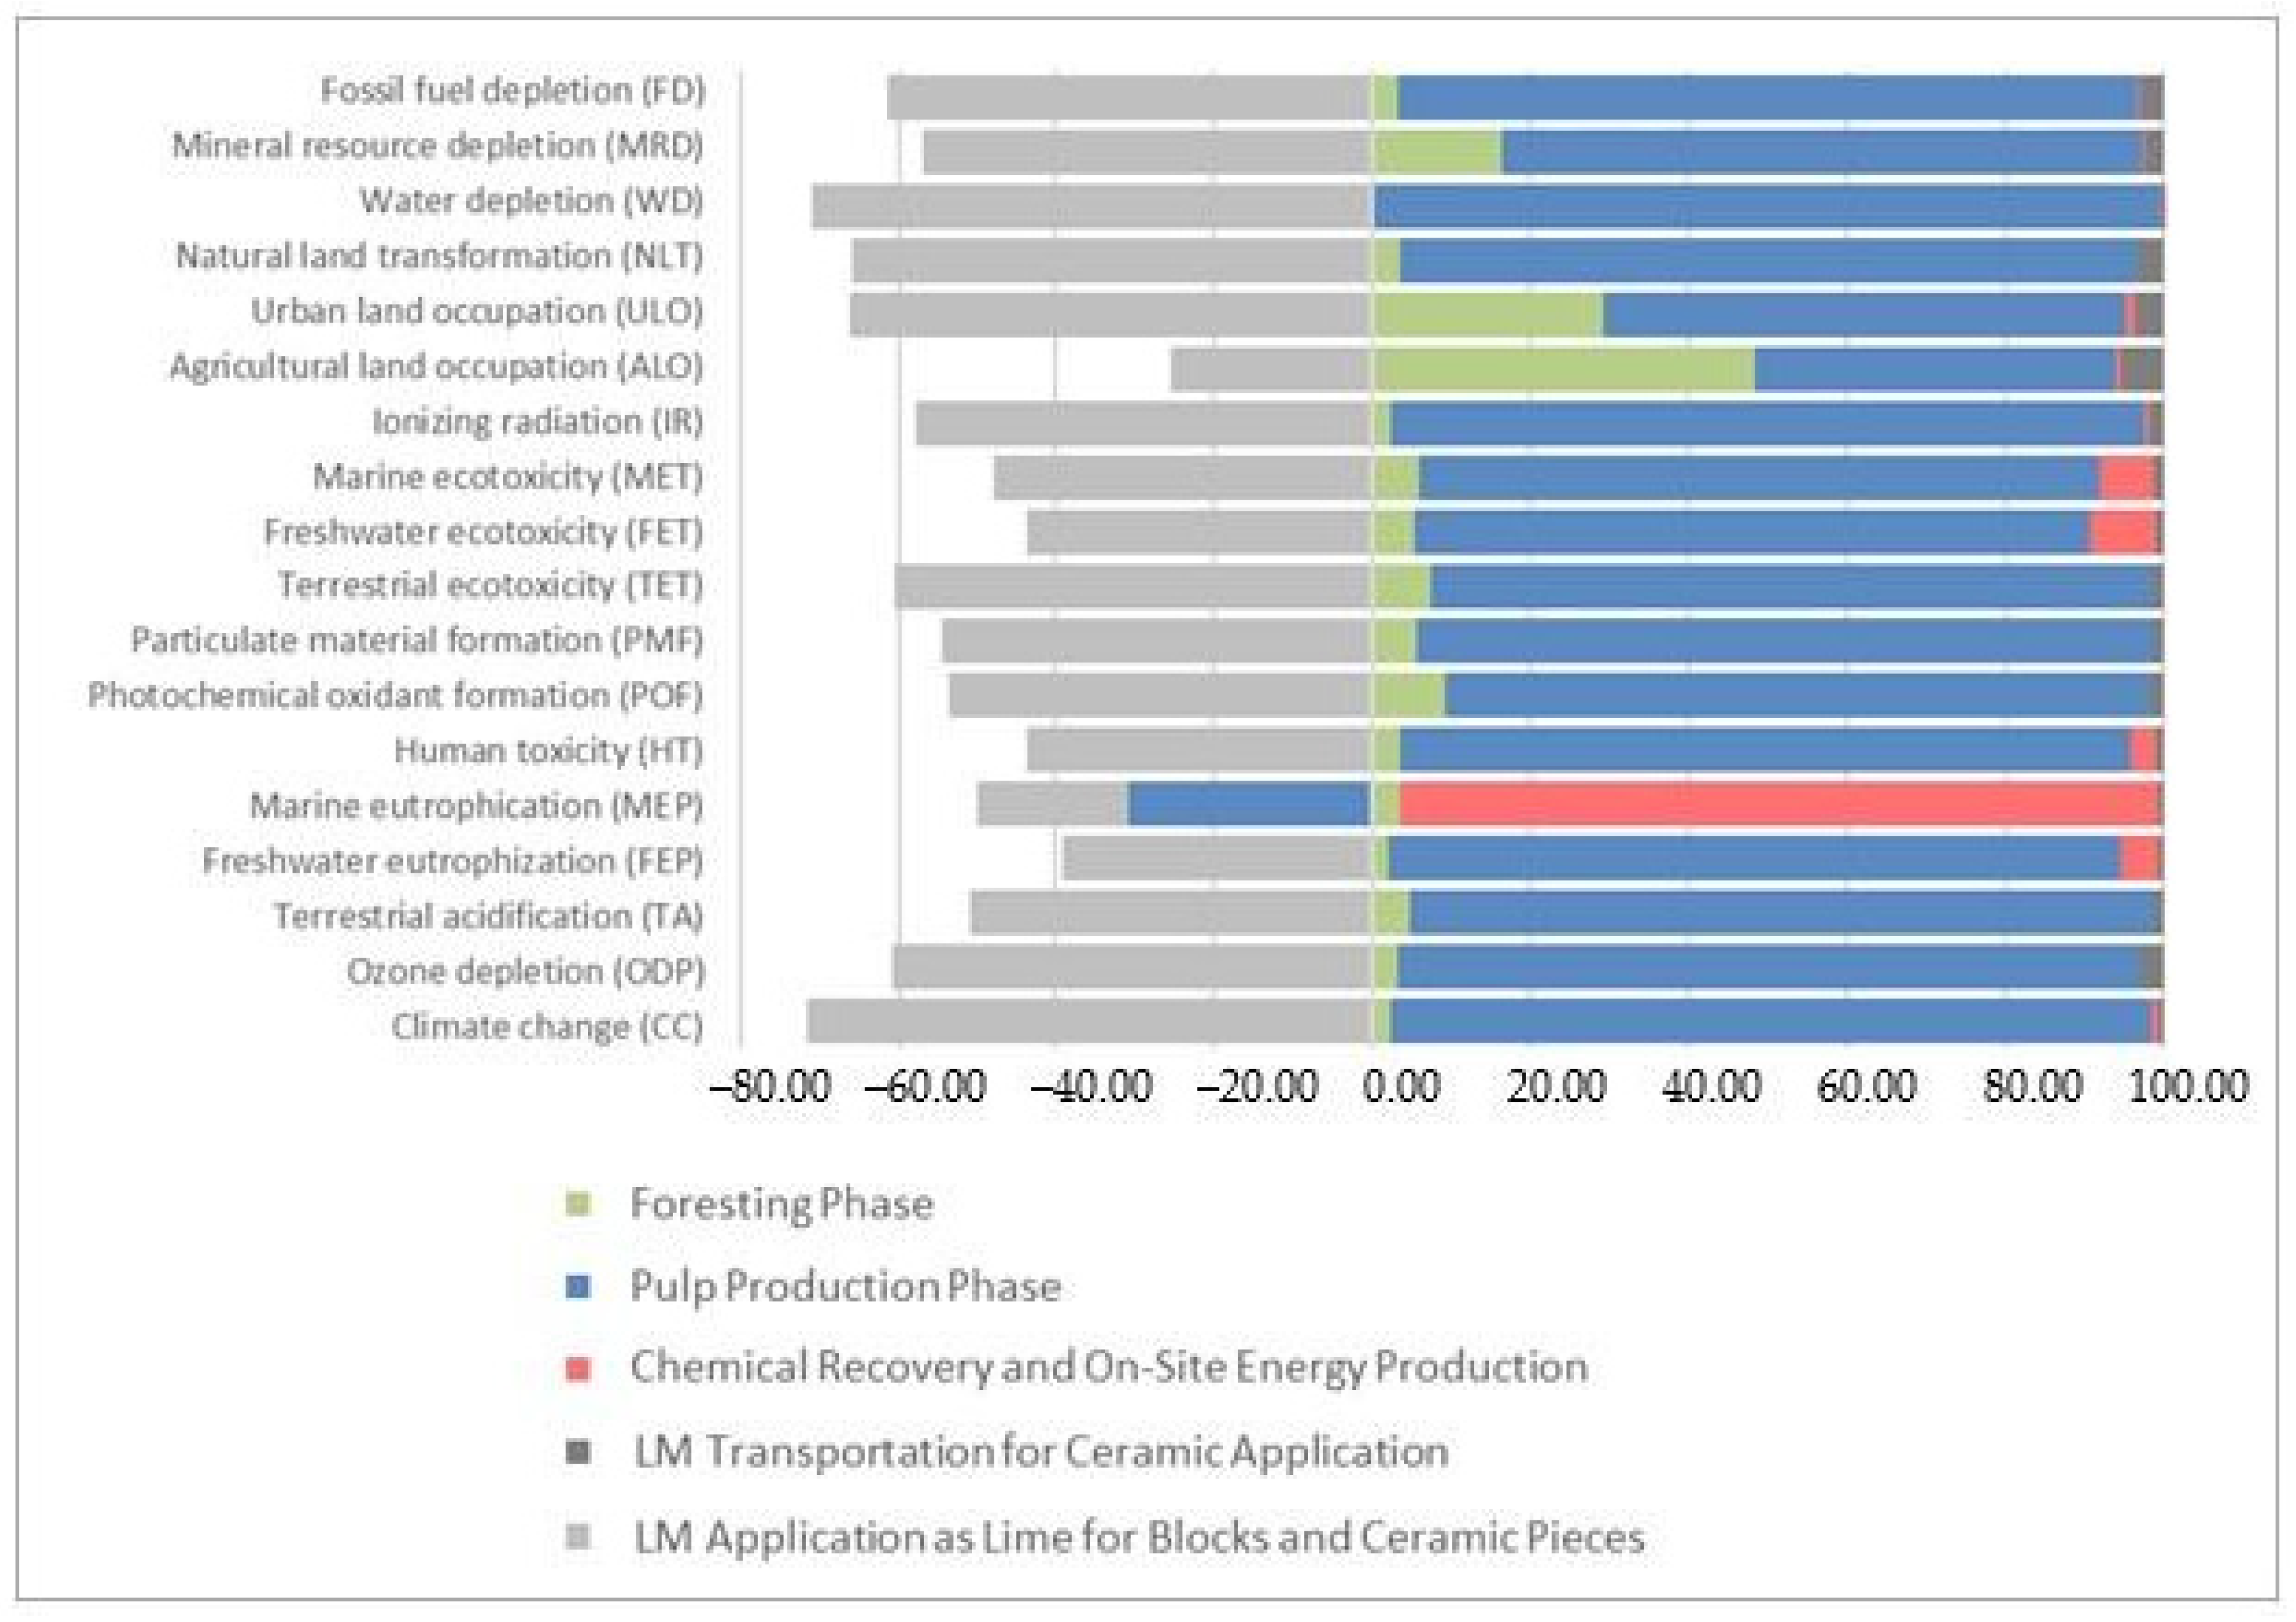
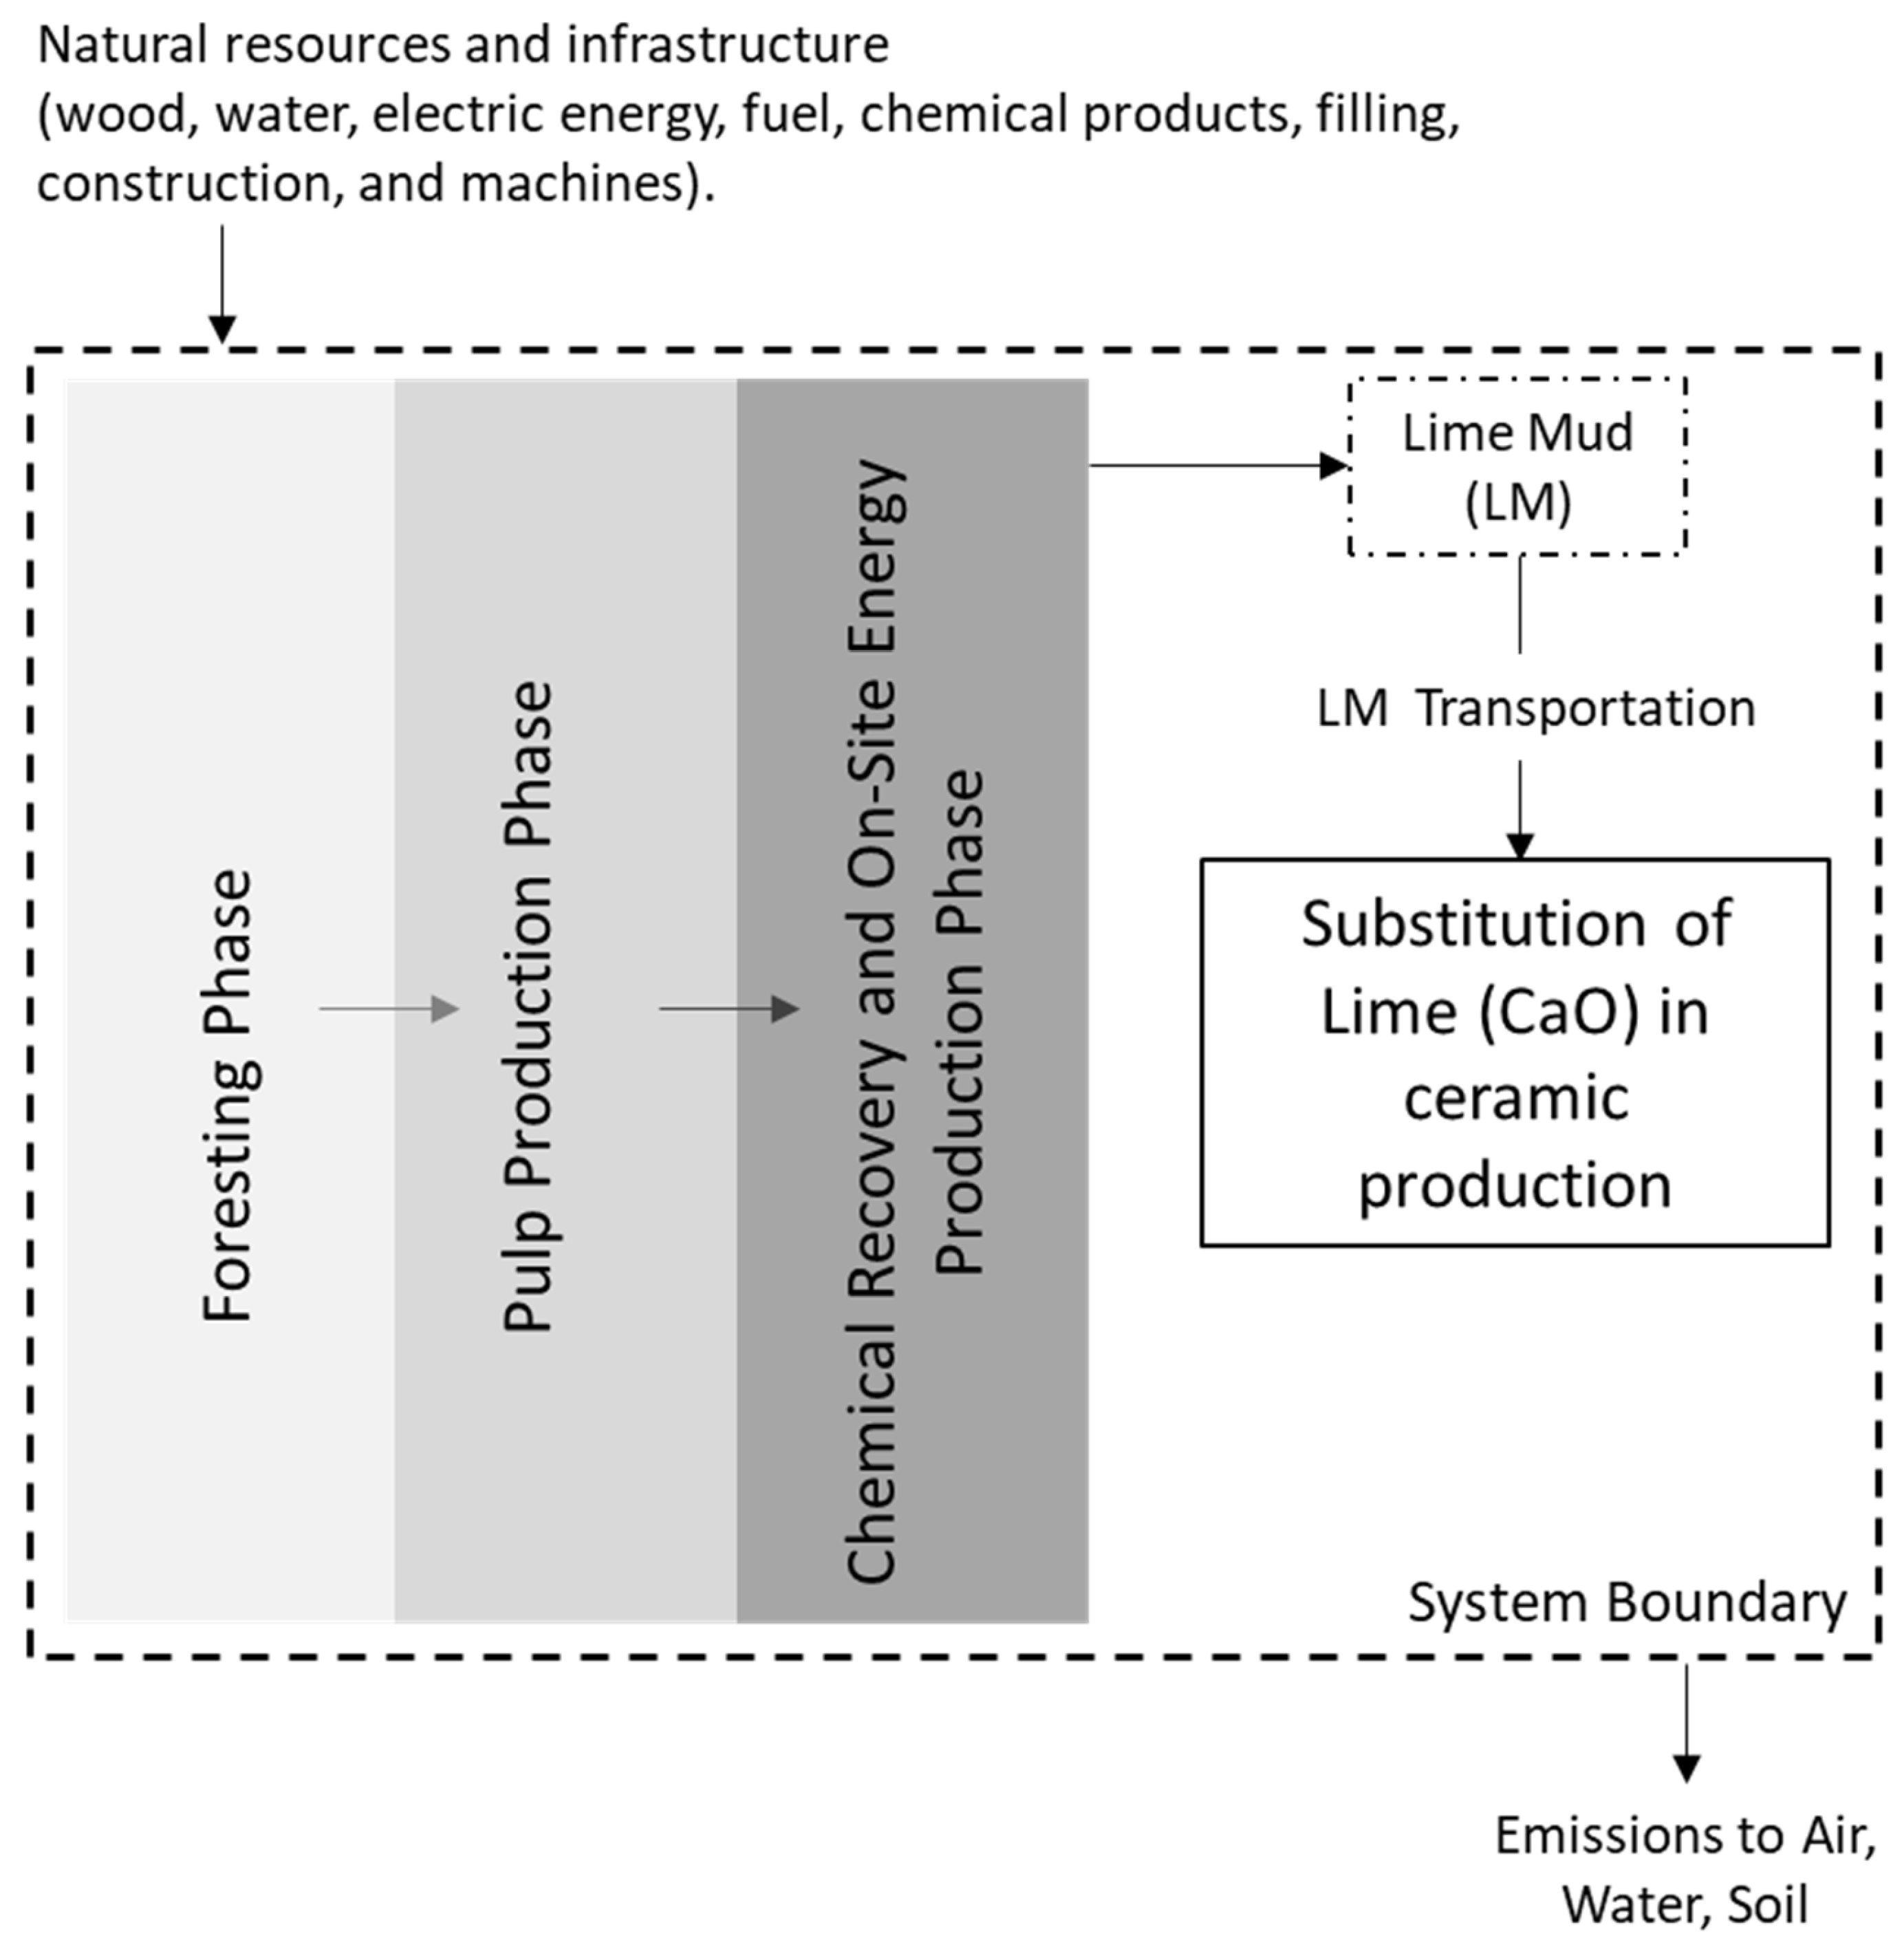
- S4: Lime mud is used for the production of bricks and ceramic pieces, substituting lime (Figure 11).
3.1.2. Life Cycle Inventory Analysis
S0 Inventory
S1 Inventory
- C: heat (energy) necessary for heating the mass, kJ·d−1;
- QL: influent mass to the digestor, kgST·d−1;
- CE: heat transfer coefficient by area, 4.2 kJ·kg−1·°C;
- TD: biodigester interior temperature, °C;
- TL: biodigester tributary mass temperature, °C.
- P: available power (kW);
- QCH4: methane flow (m3CH4);
- PCH4: methane calorific power (equal to 35.53·106 J/m3CH4);
- Ec: biogas collection efficiency (%);
- E: motor/turbine efficiency (%);
- 31,536,000: seconds in a year (s/year);
- 1/1000: conversion from J/s to kW.
Inventories of S2, S3, and S4
3.1.3. Impact Assessment
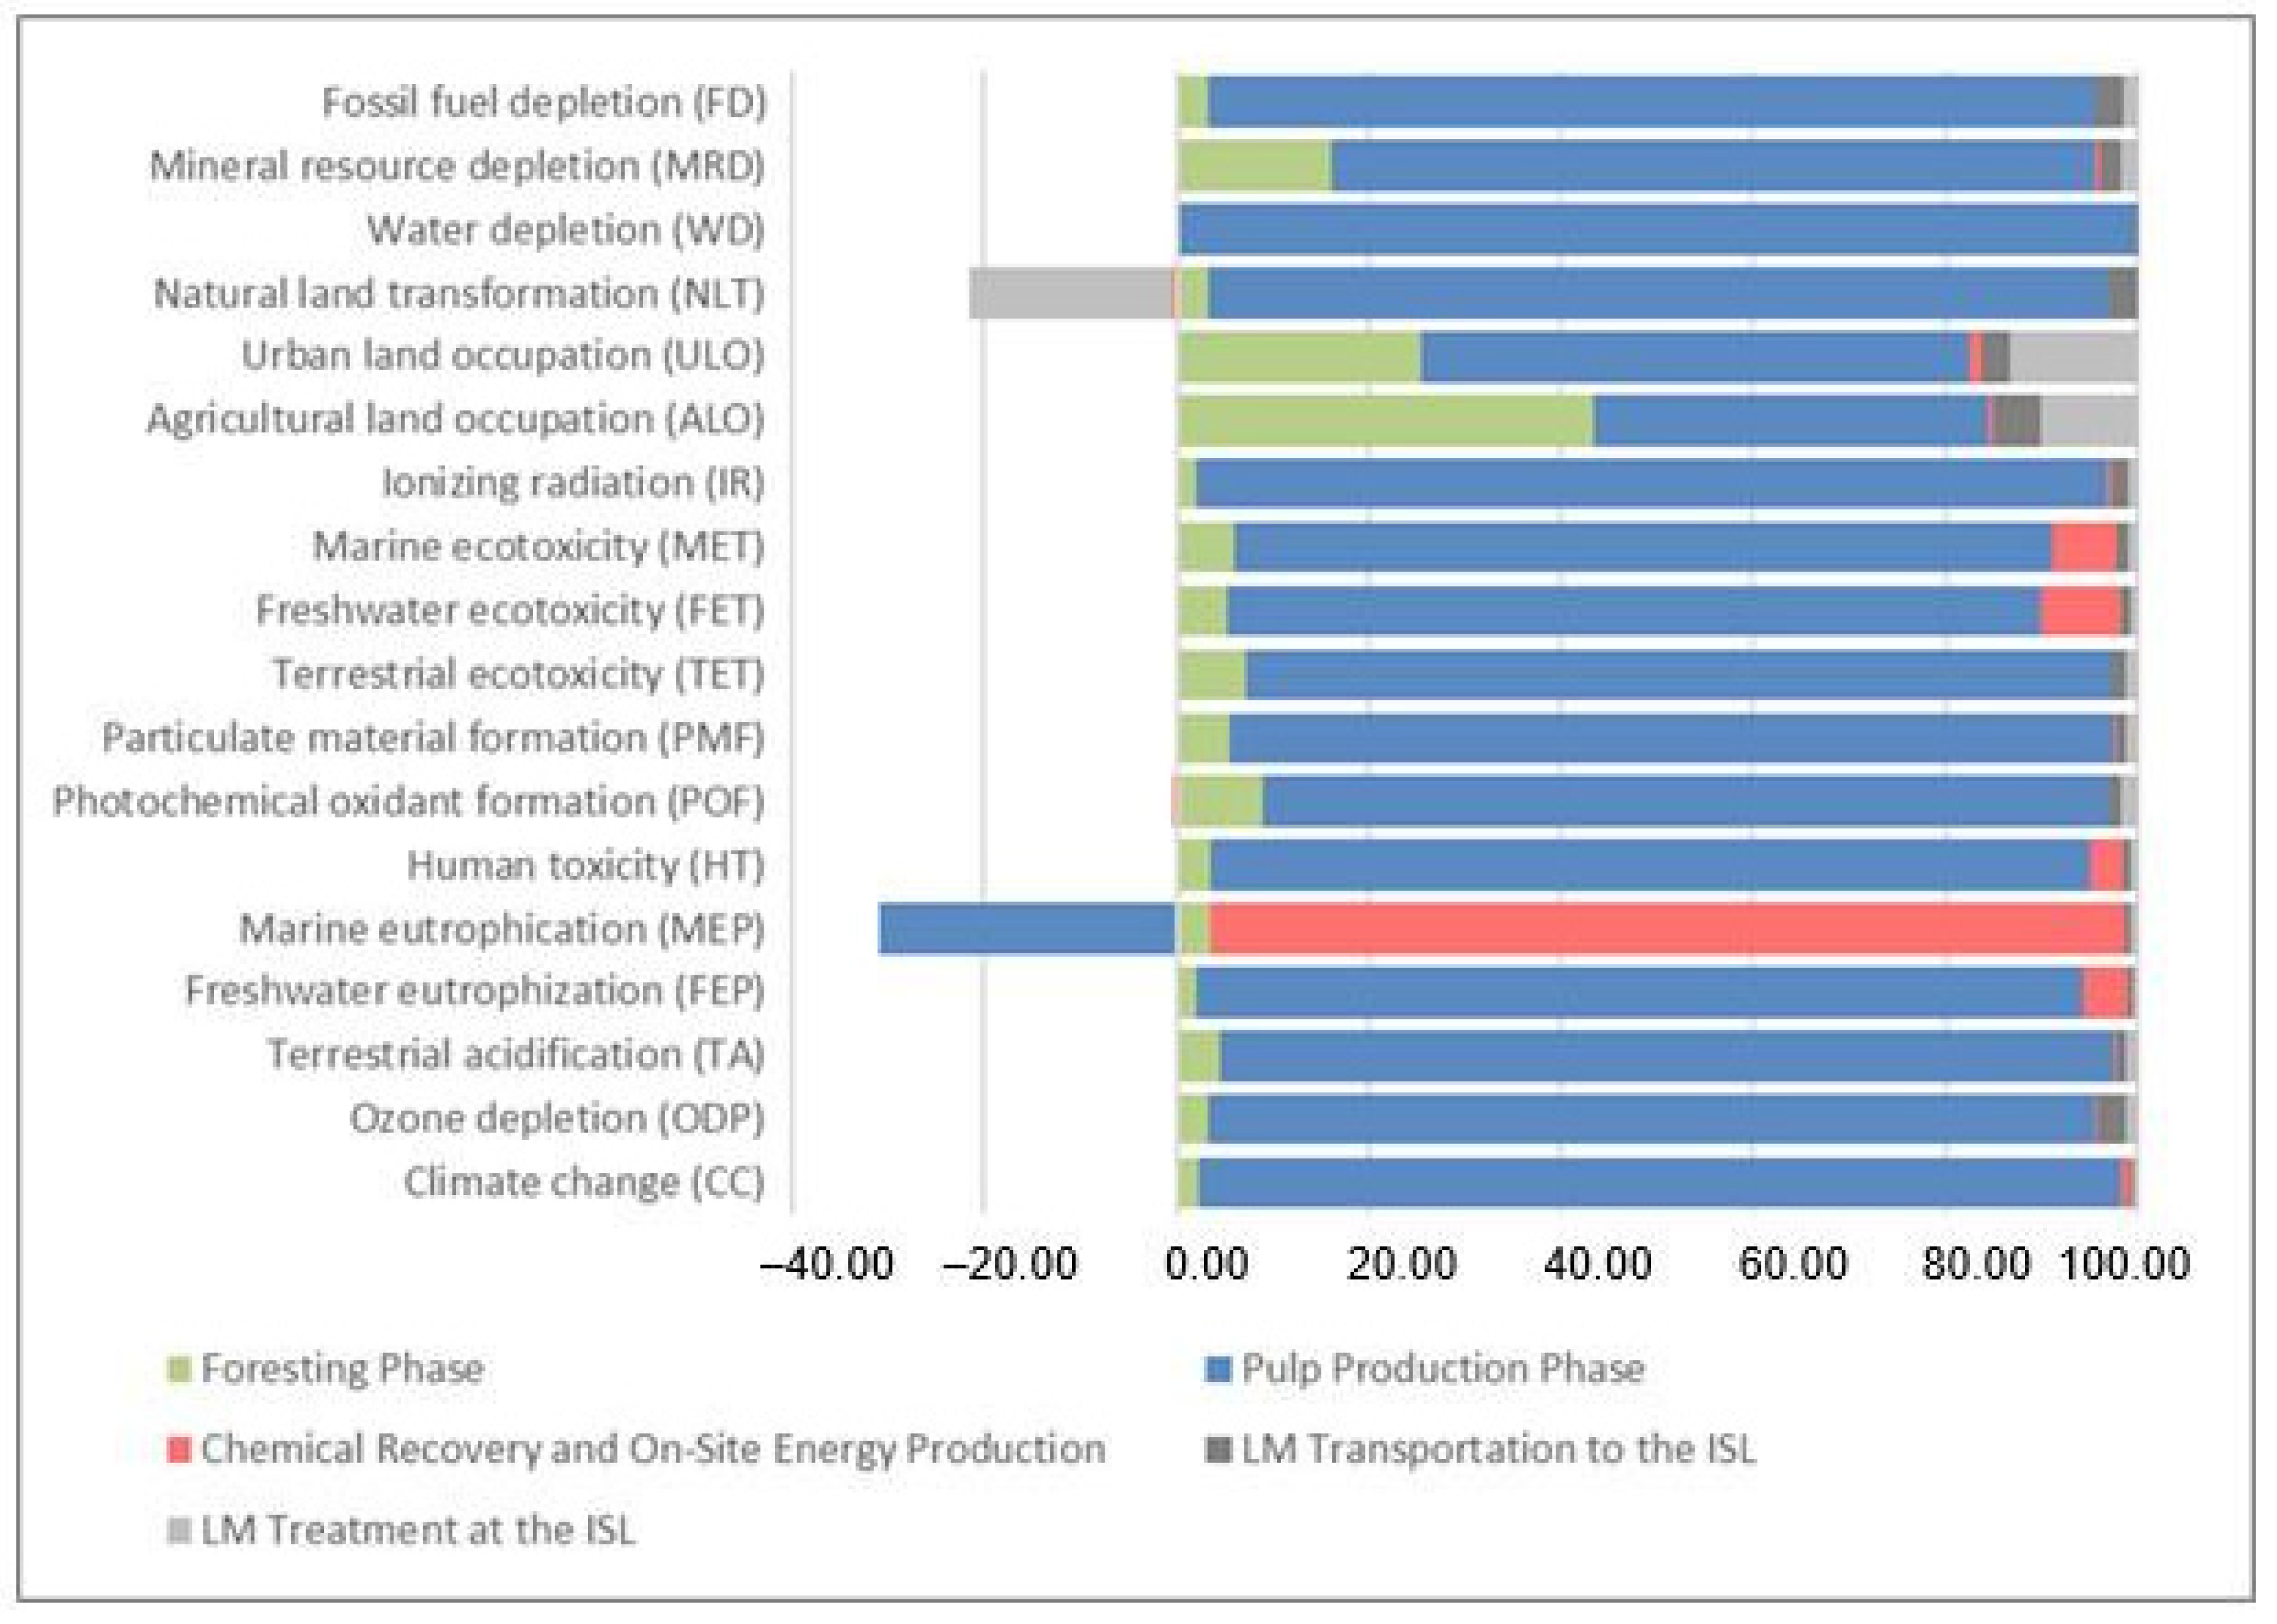
- Climate change (CC), ozone depletion (ODP), terrestrial acidification (TA), freshwater eutrophication (FEP), marine eutrophication (MEP), human toxicity (HT), photochemical oxidant formation (POF), particulate material formation (PMF), terrestrial ecotoxicity (TET), freshwater ecotoxicity (FET), marine ecotoxicity (MET), ionizing radiation (IR), agricultural land occupation (ALO), urban land occupation (ULO), natural land transformation (NLT), water depletion (WD), mineral resource depletion (MRD), and fossil fuel depletion (FD).
4. Conclusions
Supplementary Materials
Author Contributions
Funding
Institutional Review Board Statement
Informed Consent Statement
Data Availability Statement
Acknowledgments
Conflicts of Interest
Abbreviations
| AD-Co | Anaerobic Co-digestion |
| AD | Anaerobic Digestion |
| ALO | Agricultural Land Occupation |
| AF | Allocation Factor |
| CF | Capacity Factor |
| CB | Cardboard |
| CC | Climate Change |
| COD | Chemical Oxygen Demand |
| CSTR | Continuous Stir-Tank Reactor |
| E | Motor Efficiency |
| FD | Fossil Fuel Depletion |
| FEP | Freshwater Eutrophication |
| FET | Freshwater Ecotoxicity |
| FW | Food Waste |
| FU | Functional Unit |
| GHG | Greenhouse Gas |
| HT | Human Toxicity |
| ICE | Internal Combustion Engine |
| IR | Ionizing Radiation |
| ISL | Industrial Sanitary Landfill |
| ISW | Industrial Solid Waste |
| LC | Life Cycle |
| LCA | Life Cycle Assessment |
| LCV | Lower Calorific Value |
| LM | Lime Mud |
| MEP | Marine Eutrophication |
| MET | Marine Ecotoxicity |
| Mono-AD | Mono Anaerobic Digestion |
| MRD | Mineral Resource Depletion |
| MSL | Municipal Sanitary Landfill |
| NLT | Natural Land Transformation |
| NMVOC | Non-Methane Volatile Organic Compounds |
| NSWP | Natural Solid Waste Policy |
| ODP | Ozone Depletion |
| OFUSW | Organic Fraction of Urban Solid Waste |
| OM | Organic Material |
| PMF | Particulate Matter Formation |
| POF | Photochemical Ozone Formation |
| SS | Sewage Sludge |
| TA | Terrestrial Acidification |
| TET | Terrestrial Ecotoxicity |
| USW | Urban Solid Waste |
| ULO | Urban Land Occupation |
| VSs | Volatile Solids |
| WD | Water Depletion |
References
- United Nations Environment Programme; International Solid Waste Association. Global Waste Management Outlook 2024—Beyond an Age of Waste: Turning Rubbish into a Resource. 2024. Available online: https://wedocs.unep.org/20.500.11822/44939 (accessed on 5 May 2024).
- Cheng, H.; Li, Y.; Hu, Y.; Guo, G.; Cong, M.; Xiao, B.; Li, Y.-Y. Bioenergy recovery from methanogenic co-digestion of food waste and sewage sludge by a high-solid anaerobic membrane bioreactor (AnMBR): Mass balance and energy potential. Bioresour. Technol. 2021, 326, 124754. [Google Scholar] [CrossRef] [PubMed]
- ABREMA (ASSOCIAÇÃO BRASILEIRA DE RESÍDUOS E MEIO AMBIENTE). Overview of Solid Waste in Brazil 2023; Overview ABREMA; ABREMA: São Paulo, Brazil, 2023. [Google Scholar]
- ABRELPE (ASSOCIAÇÃO BRASILEIRA DE LIMPEZA PÚBLICA E RESÍDUOS ESPECIAIS). Overview of Solid Waste in Brazil 2021; Panorama ABRELPE; ABRELPE: Brasília, Brazil, 2021. [Google Scholar]
- BRASIL. Law Number 14.026, DE 15 DE JULHO DE 2020. Updates the Legal Framework for Basic Sanitation and Amends Law No. 9984, of 17 July 2000. Available online: https://www.in.gov.br/web/dou/-/lei-n-14.026-de-15-de-julho-de-2020-267035421 (accessed on 3 March 2021).
- Dos Santos, I.F.S.; Gonçalves, A.T.T.; Borges, P.B.; Barros, R.M.; da Lima, R.S. Combined use of biogas from sanitary landfill and wastewater treatment plants for distributed energy generation in Brazil. Resour. Conserv. Recycl. 2018, 136, 376–388. [Google Scholar] [CrossRef]
- Barros, R.M. Treaty on Solid Waste: Management, Use and Sustainability; [s.n.]: Rio de Janeiro, Brazil, 2012. [Google Scholar]
- ABRELPE (ASSOCIAÇÃO BRASILEIRA DE LIMPEZA PÚBLICA E RESÍDUOS ESPECIAIS). Overview of Solid Waste in Brazil 2020; Overview ABRELPE; ABRELPE: Brasília, Brazil, 2020; p. 51. [Google Scholar]
- Leonzio, G. Upgrading of biogas to bio-methane with chemical absorption process: Simulation and environmental impact. J. Clean. Prod. 2016, 131, 364–375. [Google Scholar] [CrossRef]
- USEPA. Understanding Global Warming Potentials. Available online: https://www.epa.gov/ghgemissions/understanding-global-warming-potentials (accessed on 6 June 2023).
- Avellar, L.H.N. The Valorization of Agro-Industrial By-Products Aiming at Cogeneration and Environmental Pollution Reduction; Universidade Estadual Paulista “Júlio de Mesquita Filho”: São Paulo, Brazil, 2001. [Google Scholar]
- Weiland, P. Biogas production: Current state and perspectives. Appl. Microbiol. Biotechnol. 2010, 85, 849–860. [Google Scholar] [CrossRef]
- Xiao, H.; Zhang, D.; Tang, Z.; Li, K.; Guo, H.; Niu, X.; Yi, L. Comparative environmental and economic life cycle assessment of dry and wet anaerobic digestion for treating food waste and biogas digestate. J. Clean. Prod. 2022, 338, 130674. [Google Scholar] [CrossRef]
- Joensuu, T.; Edelman, H.; Saari, A. Circular economy practices in the built environment. J. Clean. Prod. 2020, 276, 124215. [Google Scholar] [CrossRef]
- Singh, J. A roadmap for production of sustainable, consistent and reliable electric power from agricultural biomass—An Indian perspective. Energy Policy 2016, 92, 246–254. [Google Scholar] [CrossRef]
- EPE (EMPRESA DE PESQUISA ENERGÉTICA). 1st Quarterly Review of the Electricity Demand Projections for the National Interconnected System. 2019–2023; Demand Studies; EPE: Rio de Janeiro, Brazil, 2019; p. 36. [Google Scholar]
- EPE (EMPRESA DE PESQUISA ENERGÉTICA). National Energy Plan 2050—Energy Demand; National Energy Plan; EPE: Rio de Janeiro, Brazil, 2020; pp. 1–232. [Google Scholar]
- Monteiro, E.; Mantha, V.; Rouboa, A. Prospective application of farm cattle manure for bioenergy production in Portugal. Renew. Energy 2011, 36, 627–631. [Google Scholar] [CrossRef]
- Amaral, A.C.; Steinmetz, R.L.R.; Kunz, A. Chapter III. Fundamentals of Anaerobic Digestion, Biogas Purification, and Use and Treatment of Digestate. In The Biogas Digesters; Sbera Embrapa Suínos e Aves: Concordia, Brazil, 2019; pp. 41–68. [Google Scholar]
- Li, L.; Peng, X.; Wang, X.; Wu, D. Anaerobic digestion of food waste: A review focusing on process stability. Bioresour. Technol. 2018, 248, 20–28. [Google Scholar] [CrossRef]
- Mata-Alvarez, J.; Dotas, J.; Romero-Güiza, M.S.; Fonoll, X.; Peces, M.; Astals, S. A critical review on anaerobic co-digestion achievements between 2010 and 2013. Renew. Sustain. Energy Rev. 2014, 36, 412–427. [Google Scholar] [CrossRef]
- Neshat, S.A.; Mohammadi, M.; Najafpour, G.D.; Lahijani, P. Anaerobic co-digestion of animal manures and lignocellulosic residues as a potent approach for sustainable biogas production. Renew. Sustain. Energy Rev. 2017, 79, 308–322. [Google Scholar] [CrossRef]
- Zahan, Z.; Georgiou, S.; Muster, T.H.; Othman, M. Semi-continuous anaerobic co-digestion of chicken litter with agricultural and food wastes: A case study on the effect of carbon/nitrogen ratio, substrates mixing ratio and organic loading. Bioresour. Technol. 2018, 270, 245–254. [Google Scholar] [CrossRef] [PubMed]
- Martínez-Ruano, J.A.; Restrepo-Serna, D.L.; Carmona-Garcia, E.; Giraldo, J.A.P.; Aroca, G.; Cardona, C.A. Effect of co-digestion of milk-whey and potato stem on heat and power generation using biogas as an energy vector: Techno-economic assessment. Appl. Energy 2019, 241, 504–518. [Google Scholar] [CrossRef]
- Ahn, Y.; Lee, W.; Kang, S.; Kim, S. Enhancement of Sewage Sludge Digestion by Co-digestion with Food Waste and Swine Waste. Waste Biomass Valorization 2020, 11, 2421–2430. [Google Scholar] [CrossRef]
- Begum, S.; Das, T.; Anupoju, G.R.; Eshtiaghi, N. Solid-state anaerobic co-digestion of food waste and cardboard in a pilot-scale auto-fed continuous stirred tank reactor system. J. Clean. Prod. 2021, 289, 125775. [Google Scholar] [CrossRef]
- de Castro e Silva, H.L.; Silva, A.M.L.; Barros, R.M.; dos Santos, I.F.S.; de Freitas, J.V.R. Addition of iron ore tailings to increase the efficiency of anaerobic digestion of pig manure: A technical and economic analysis. Biomass Bioenergy 2021, 148, 106013. [Google Scholar] [CrossRef]
- Nadaleti, W.C.; Martins, R.; Lourenço, V.; Przybyla, G.; Bariccatti, R.; Souza, S.; Manzano-Aguliaro, F.; Sunny, N. A pioneering study of biomethane and hydrogen production from the wine industry in Brazil: Pollutant emissions, electricity generation and urban bus fleet supply. Int. J. Hydrogen Energy 2021, 46, 19180–19201. [Google Scholar] [CrossRef]
- IBA, (INDUSTRIA BRASILEIRA DE ÁRVORES). Annual Report 2020. [s.l: S.n.]. 2020. Available online: http://abpa-br.org/relatorios/ (accessed on 24 August 2022).
- Modolo, R.C.E.; Senff, J.A.; Ferreira, V.M.; Tarelho, L.A.C. Lime mud from cellulose industry as raw material in cement mortars. Mater. Constr. 2014, 64, e033. [Google Scholar] [CrossRef]
- Benini, G.L.; Fröhlich, J.; Brehm, F.A.; Kulakowski, M.P.; Miranda, L.A.S. Assessment of the valorization potential of calcium carbonate sludge as a co-product in different sectors. O Papel 2019, 80, 90–97. [Google Scholar]
- Farage, R.M.P.; Silva, C.M.; Rezende, A.A.P.; Souza, J.J.L.L.; Matos, A.T.; Zanuncio, A.J.V. Intermediate covering of municipal solid waste landfills with alkaline grits, dregs and lime mud by-products of kraft pulp production. J. Clean. Prod. 2019, 239, 117985. [Google Scholar] [CrossRef]
- Farage, R.M.P. Application of Alkaline by-Products From the Kraft Pulp Industry in Sanitary Landfills and Acid Drainage Remediation; Universidade Federal de Viçosa (UFV): Viçosa, Brazil, 2018. [Google Scholar]
- Zhang, J.; Wang, Q.; Zheng, P.; Wang, Y. Anaerobic digestion of food waste stabilized by lime mud from papermaking process. Bioresour. Technol. 2014, 170, 270–277. [Google Scholar] [CrossRef] [PubMed]
- Chen, S.; Zhang, J.; Wang, X. Effects of alkalinity sources on the stability of anaerobic digestion from food waste. Waste Manag. Res. 2015, 33, 1033–1040. [Google Scholar] [CrossRef] [PubMed]
- Coelho, U.R.d.S.; Crispim, A.M.d.C.; Martins, M.A.d.B.; Barros, R.M.; Reno, M.L.G.; Tiago Filho, G.L.; Santos, I.F.S. Evaluation of Biogas Energy from Co-Digestion of Organic Urban Solid Waste with Lime Mud. Recycling 2023, 8, 57. [Google Scholar] [CrossRef]
- Panigrahi, S.; Dubey, B.K. A critical review on operating parameters and strategies to improve the biogas yield from anaerobic digestion of organic fraction of municipal solid waste. Renew. Energy 2019, 143, 779–797. [Google Scholar] [CrossRef]
- Papong, S.; Rotwinroon, P.; Chatchupong, T.; Malakul, P. Life cycle energy and environmental assessment of bio-CNG utilization from cassava starch wastewater treatment plants in Thailand. Renew. Energy 2014, 65, 64–69. [Google Scholar] [CrossRef]
- Henríquez, A.I.M. Life Cycle Assessment (LCA) of Integrated Systems for the Treatment and Final Disposal of Urban Solid Waste in Medium-Sized Cities; Universidade Federal de Itajubá: Itajubá, Brazil, 2016. [Google Scholar]
- Tong, H.; Tong, Y.W.; Peng, Y.H. A comparative life cycle assessment on mono- and co-digestion of food waste and sewage sludge. Energy Procedia 2019, 158, 4166–4171. [Google Scholar] [CrossRef]
- Bartocci, P.; Zampilli, M.; Liberti, F.; Pistolesi, V.; Massoli, S.; Bidini, G.; Fantozzi, F. LCA analysis of food waste co-digestion. Sci. Total Environ. 2020, 709, 136187. [Google Scholar] [CrossRef]
- Corcelli, F.; Fiorentino, G.; Vehmas, J.; Ulgiati, S. Energy efficiency and environmental assessment of papermaking from chemical pulp—A Finland case study. J. Clean. Prod. 2018, 198, 96–111. [Google Scholar] [CrossRef]
- Tyagi, V.K.; Fedez-Güelfo, L.A.; Zhou, Y.; Álvarez-Gallego, C.J.; Garcia, L.I.R.; Ng, W.J. Anaerobic co-digestion of organic fraction of municipal solid waste (OFMSW): Progress and challenges. Renew. Sustain. Energy Rev. 2018, 93, 380–399. [Google Scholar] [CrossRef]
- Pin, B.V.d.R.; Barros, R.M.; Silva Lora, E.E.; Olmo, O.A.; dos Santos, I.F.S.; Ribeiro, E.M.; Rocha, J.V.F. Energetic use of biogas from the anaerobic digestion of coffee wastewater in southern Minas Gerais, Brazil. Renew. Energy 2019, 146, 2084–2094. [Google Scholar] [CrossRef]
- Gutiérrez, A.S.; Caneghem, J.V.; Martínez, R.B.C.; Vandecasteele, C. Evaluation of the environmental performance of lime production in Cuba. J. Clean. Prod. 2012, 31, 126–136. [Google Scholar] [CrossRef]
- Huttunen, S.; Manninen, K.; Leskinen, P. Combining biogas LCA reviews with stakeholder interviews to analyse life cycle impacts at a practical level. J. Clean. Prod. 2014, 80, 5–16. [Google Scholar] [CrossRef]
- Vega, G.C.C.; Hoeve, M.; Birkved, M.; Sommer, S.G.; Bruun, S. Choosing co-substrates to supplement biogas production from animal slurry—A life cycle assessment of the environmental consequences. Bioresour. Technol. 2014, 171, 410–420. [Google Scholar] [CrossRef] [PubMed]
- Møller, J.; Boldrin, A.; Christensen, T.H. Anaerobic digestion and digestate use: Accounting of greenhouse gases and global warming contribution. Waste Manag. Res. J. Sustain. Circ. Econ. 2009, 27, 813–824. [Google Scholar] [CrossRef]
- Giuliano, A.; Catizzone, E.; Freda, C.; Cornacchia, G. Valorization of OFMSW Digestate-Derived Syngas toward Methanol, Hydrogen, or Electricity: Process Simulation and Carbon Footprint Calculation. Processes 2020, 8, 526. [Google Scholar] [CrossRef]
- ABNT (ASSOCIAÇÃO BRASILEIRA DE NORMAS TÉCNICAS). NBR ISO 14040: Environmental Management—Life Cycle Assessment—Principles and Framework; ABNT: São Paulo, Brazil, 2009. [Google Scholar]
- ABNT (ASSOCIAÇÃO BRASILEIRA DE NORMAS TÉCNICAS). ABNT NBR ISO 14044—Environmental Management—Life Cycle Assessment—Requirements and Guidelines; ABNT: São Paulo, Brazil, 2009. [Google Scholar]
- IES (INSTITUTE FOR ENVIRONMENT AND SUSTAINABILITY). International Reference Life Cycle Data System (ILCD) Handbook: Specific Guide for Life Cycle Inventory Data Sets; IES: Ispra, Italy, 2010. [Google Scholar]
- Paim, R.M. Effect of the Use of Lime Mud and Potassium Chloride on Soil, Nutritional Status, and Growth of Pinus taeda L. on Oxisol; Federal University of Paraná: Curitiba, Brazil, 2007; 170p. [Google Scholar]
- Izidio, L.L.; Subtil, G.W.; Andrade, A.A. Utilization of Solid Waste from the Paper Industry as Raw Material for Brick Manufacturing. Fórum Ambient. Alta Paul. Electron. J. 2013, 9, 200–209. [Google Scholar]
- IMASUL (INSTITUTO DE MEIO AMBIENTE DO MATO GROSSO DO SUL). Criteria for Pre-Selection of Areas for the Implementation of Sanitary Landfills; Institute of Environment of Mato Grosso do Sul: Mato Grosso do Sul, Brazil, 2016. [Google Scholar]
- Velásquez Piñas, J.A.; Venturini, O.J.; Silva Lora, E.E.; Olmo, O.A.; Roalcaba, O.D.C. An economic holistic feasibility assessment of centralized and decentralized biogas plants with mono-digestion and co-digestion systems. Renew. Energy 2019, 139, 40–51. [Google Scholar] [CrossRef]
- Costa, Y.J.R. Energy and Exergy Analyses of an Internal Combustion Engine Operating with Diesel and Natural Gas Mixture; Federal University of Campina Grande: Campina Grande, Brazil, 2007; 209p. [Google Scholar]
- BNDES (BANCO NACIONAL DO DESENVOLVIMENTO). Market Overview: Pulp. BNDES Setorial 2010, 32, 311–370. [Google Scholar]
- SCANIA. Scania Brasil. Available online: https://www.scania.com/br/pt/home.html (accessed on 17 January 2022).
- ANEEL (AGÊNCIA NACIONAL DE ENERGIA ELÉTRICA). Normative Resolution No. 786, of 17 October 2017. Amends Normative Resolution No. 482, of 17 April 2012; Brazilian National Press: Brasília, Brazil, 2017.
- Salomon, K.R.; Lora, E.E.S. Estimate of the electric energy generating potential for different sources of biogas in Brazil. Biomass Bioenergy 2009, 33, 1101–1107. [Google Scholar] [CrossRef]
- Santos, R.E.; Santos, I.F.; Barros, R.M.; Bernal, A.P.; Tiago Filho, G.L.; Silva, F.G.B. Generating electrical energy through urban solid waste in Brazil: An economic and energy comparative analysis. J. Environ. Manag. 2019, 231, 198–206. [Google Scholar] [CrossRef]
- Timonen, K.; Sinkko, T.; Luostarinen, S.; Tampio, E.; Joensuu, K. LCA of anaerobic digestion: Emission allocation for energy and digestate. J. Clean. Prod. 2019, 235, 1567–1579. [Google Scholar] [CrossRef]
- Jordão, E.P.; Pessôa, C.A. Treatment of Domestic Sewage, 7th ed.; ABES: Rio de Janeiro, Brazil, 2014. [Google Scholar]
- Machado, L. Aspectos Técnicos Relacionados à Geração de Energia Elétrica Apartir do Lodo de Esgoto. Master’s Thesis, Universidade Federal do Rio de Janeiro, Rio de Janeiro, Brazil, 2011; p. 107. [Google Scholar]
- Ribeiro, E.; Barros, R.M.; Tiago Filho, G.L.; dos Santos, I.F.; Sampaio, L.C.; dos Santos, T.V.; da Silva, A.P.M.; de Freitas, J.V. Feasibility of biogas and energy generation from poultry manure in Brazil. Waste Manag. Res. 2018, 36, 221–235. [Google Scholar] [CrossRef] [PubMed]
- CETESB (THE ENVIRONMENTAL COMPANY OF SAO PAULO). Biogas: Generation and Energy Use v. 1.0/CETESB; CETESB: São Paulo, Brazil, 2006. [Google Scholar]
- Amini, H.R.; Reinhart, D.R.; Mackie, K.R. Determination of first-order landfill gas modeling parameters and uncertainties. Waste Manag. 2012, 32, 305–316. [Google Scholar] [CrossRef] [PubMed]
- Agamuthu, P. Landfilling in developing countries. Waste Manag. Res. 2013, 31, 1–2. [Google Scholar] [CrossRef]
- Santos, I.F.S.; Barros, R.M.; Tiago Filho, G.L. Biogas Production from Solid Waste Landfill. In Encyclopedia of Renewable and Sustainable Materials; Elsevier: Amsterdam, The Netherlands, 2020; pp. 11–19. [Google Scholar]
- Souza Ribeiro, N.; Barros, R.M.; dos Santos, I.F.S.; Tiago Filho, G.L.; da Silva, S.P.G. Electric energy generation from biogas derived from municipal solid waste using two systems: Landfills and anaerobic digesters in the states of São Paulo and Minas Gerais, Brazil. Sustain. Energy Technol. Assess. 2021, 48, 101552. [Google Scholar] [CrossRef]
- Beylot, A.; Villeneuve, J.; Bellenfant, G. Life Cycle Assessment of landfill biogas management: Sensitivity to diffuse and combustion air emissions. Waste Manag. 2013, 33, 401–411. [Google Scholar] [CrossRef]
- PRE (PRÉ CONSULTS). RECIPE Method. 2017. Available online: https://pre-sustainability.com/articles/recipe/ (accessed on 24 February 2021).
- Cañote, S.J.B.; Barros, R.M.; Silva Lora, E.E.; Santos, I.F.S.; Mini Silva, A.P.; Piñas, J.A.V.; Cañote, L.B.; Castro e Silva, H.L. Life cycle assessment of upflow anaerobic sludge blanket sludge management and activated sludge systems aiming energy use in the municipality of Itajubá, Minas Gerais, Brazil. J. Mater. Cycles Waste Manag. 2021, 23, 1810–1830. [Google Scholar] [CrossRef]
- Goedkoop, M.J.; Heijungs, R.; Huijbregts, M.A.J.; De Schryver, A.; Struijs, J.; Van Zelm, R. Category Indicators at the Midpoint and the Endpoint Level ReCiPe 2008; Ministry of Housing and Spatial Planning: The Hague, The Netherlands, 2013; p. 126.
- Tolle, D.A. Regional Scaling and Normalization in LCIA Development. Life Cycle Assess. 1997, 2, 197–208. [Google Scholar] [CrossRef]
- Vezzoli, C.; Manzini, E. Design for Environmental Sustainability; Springer: Berlin/Heidelberg, Germany, 2008; Volume 48. [Google Scholar]


| Impact Category | Unit | S0 (LM—ASI) | S1 (LM—Biogas) | S2 (LM—MSL) | S3 (LM—Soil) | S4 (LM—Ceramic) |
|---|---|---|---|---|---|---|
| CC | kg CO2 eq | 1519.35 | −3270.45 | 1228.99 | 1482.06 | 429.17 |
| ODP | kg CFC-11 eq | 0.00005 | 0.000006 | 0.00005 | 0.00005 | 0.00002 |
| TA | kg SO2 eq | 3.40 | −28.91 | 3.25 | 3.20 | 1.66 |
| FEP | kg P eq | 0.09 | −0.52 | 0.08 | 0.08 | 0.05 |
| MEP | kg N eq | 0.21 | −2.06 | 0.21 | 0.21 | 0.15 |
| HT | kg 1,4-DB eq | 78.65 | −17.76 | 76.10 | 77.42 | 44.00 |
| POF | kg NMVOC | 3.69 | −9.29 | 3.35 | 3.46 | 1.69 |
| PMF | kg PM10 eq | 1.36 | −6.18 | 0.91 | 1.28 | 0.61 |
| TET | kg 1,4-DB eq | 0.02 | −0.28 | 0.003 | 0.02 | 0.01 |
| FET | kg 1,4-DB eq | 2.31 | −2.74 | 2.28 | 2.28 | 1.29 |
| MET | kg 1,4-DB eq | 2.49 | −2.28 | 2.42 | 2.46 | 1.29 |
| IR | kBq U235 eq | 65.45 | 28.44 | 64.72 | 60.92 | 27.43 |
| ALO | m2a | 9.33 | −43.13 | 4.02 | 8.39 | 6.24 |
| ULO | m2a | 7.81 | 1.24 | 6.60 | 6.78 | 2.29 |
| NLT | m2 | 0.15 | 0.13 | −3.98 | 0.19 | 0.07 |
| WD | m3 | 4345.52 | 4408.28 | 4341.04 | 4340.51 | 1260.71 |
| MRD | kg Fe eq | 13.89 | −6.99 | 13.58 | 13.62 | 5.86 |
| FD | kg oil eq | 252.19 | −970.06 | 247.96 | 236.29 | 95.98 |
| Gas Emission Factors (kg/t-km) on the Highway | |
|---|---|
| CO2 | 0.083008 |
| N2O | 0.000002 |
| CO | 0.000671 |
| CH4 | 0.000006 |
| NOx | 0.001014 |
| Non-methane volatile organic compound | 0.000145 |
| Gas | Biogas Participation (%) |
|---|---|
| CH4 | 65.00% |
| CO2 | 30.35% |
| N2 | 1.50% |
| H2S | 0.30% |
| O2 | 0.55% |
| NH3 | 0.30% |
| H2 | 2.00% |
| Total | 100.00% |
Disclaimer/Publisher’s Note: The statements, opinions and data contained in all publications are solely those of the individual author(s) and contributor(s) and not of MDPI and/or the editor(s). MDPI and/or the editor(s) disclaim responsibility for any injury to people or property resulting from any ideas, methods, instructions or products referred to in the content. |
© 2025 by the authors. Licensee MDPI, Basel, Switzerland. This article is an open access article distributed under the terms and conditions of the Creative Commons Attribution (CC BY) license (https://creativecommons.org/licenses/by/4.0/).
Share and Cite
Coelho, U.R.d.S.; Crispim, A.M.d.C.; Martins, M.A.d.B.; Barros, R.M.; Reno, M.L.G.; Filho, G.L.T.; dos Santos, I.F.S.; Pontes, A.J.M.d.O. Biogas Energy Usage Through the Co-Digestion of the Organic Fraction of Urban Solid Waste with Lime Mud: An Environmental Impact Analysis. Methane 2025, 4, 7. https://doi.org/10.3390/methane4010007
Coelho URdS, Crispim AMdC, Martins MAdB, Barros RM, Reno MLG, Filho GLT, dos Santos IFS, Pontes AJMdO. Biogas Energy Usage Through the Co-Digestion of the Organic Fraction of Urban Solid Waste with Lime Mud: An Environmental Impact Analysis. Methane. 2025; 4(1):7. https://doi.org/10.3390/methane4010007
Chicago/Turabian StyleCoelho, Ulisses Raad da Silva, Adriele Maria de Cássia Crispim, Maria Auxiliadora de Barros Martins, Regina Mambeli Barros, Maria Luiza Grillo Reno, Geraldo Lucio Tiago Filho, Ivan Felipe Silva dos Santos, and Aylla Joani Mendonça de Oliveira Pontes. 2025. "Biogas Energy Usage Through the Co-Digestion of the Organic Fraction of Urban Solid Waste with Lime Mud: An Environmental Impact Analysis" Methane 4, no. 1: 7. https://doi.org/10.3390/methane4010007
APA StyleCoelho, U. R. d. S., Crispim, A. M. d. C., Martins, M. A. d. B., Barros, R. M., Reno, M. L. G., Filho, G. L. T., dos Santos, I. F. S., & Pontes, A. J. M. d. O. (2025). Biogas Energy Usage Through the Co-Digestion of the Organic Fraction of Urban Solid Waste with Lime Mud: An Environmental Impact Analysis. Methane, 4(1), 7. https://doi.org/10.3390/methane4010007