Article

Response and Damage Characteristics of Roadway Wall Under Impact Load Action of Methane Explosion

by
Qing Ye
1,2,3,*,
Jialin Liu
1 and
Zhenzhen Jia
1,2,3
1
School of Resource, Environment and Safety Engineering, Hunan University of Science and Technology, Xiangtan 411201, China
2
Hunan Engineering Research Center for Fire and Explosion Prevention Materials and Equipment in Underground Spaces, Xiangtan 411201, China
3
Key Laboratory of Fire and Explosion Prevention and Emergency Technology in Hunan Province, Xiangtan 411201, China
*
Author to whom correspondence should be addressed.
Submission received: 13 September 2024 / Revised: 9 October 2024 / Accepted: 13 January 2025 / Published: 5 February 2025

Abstract

:
In order to solve the wall damage problem of roadways with deep and high stress in methane explosion accidents, mathematical-physical analysis models for the dynamic response damage of roadway walls were established by LS-Dyna software in this paper, and the models were validated to be effective. The roadway wall displacement, stress, and deformation characteristics under the methane explosion impact load were numerical simulated and the response and damage evolution process of the roadway wall was studied. The results indicate that the model established in this study can reflect the dynamic response damage characteristics of the roadway wall. The damage of the roadway wall caused by the methane explosion impact load was mainly concentrated in the methane accumulation section, but the maximum principal stress of the roadway wall near the methane accumulation section was still high, and the damage possibility was also high. The dynamic response damage of the roadway wall decreased with the increase in the distance from the initiation explosion point. The stress response of the curved part of the roadway roof was the most severe, and the stress response of the side part was second to that of the roof. The stress changes at the corners were significant, but the deformation was small. The bottom plate was minimally affected by the methane explosion impact loads. The arch top and two sides of the roadway were first subjected to significant impact, resulting in a high-pressure zone. The peak pressure of the side part was relatively high, and the difference in peak pressure between the corner and the bottom plate was not significant.

1. Introduction

Coal is the main energy source in China and plays a crucial role in ensuring energy security, which is an important cornerstone for safeguarding China’s energy security. However, in the mining process of underground coal, methane explosions in coal mines often cause casualties and serious damage to roadway facilities [1,2], which seriously threaten the safe mining of coal resources. Therefore, studying the damage characteristics of methane explosions is of great significance for the prevention and emergency rescue of methane explosion disasters in coal mines [3,4,5].
In order to master the response and damage characteristics of roadway walls by methane explosion impact loads, many scholars have conducted extensive research and achieved fruitful research results. For example, Gao et al. [6] conducted experimental research on the relationship between methane explosion overpressure and methane concentration and found that methane concentration is a quadratic function of the maximum explosion pressure of the methane constant volume explosion. Jia Zhenzhen et al. [7] conducted theoretical analysis and experimental research on the suppression effect of the wall heat effect during methane explosion and its propagation process, and their results showed that wall heat loss had a significant effect on the methane explosion intensity, flame propagation velocity, peak overpressure. Zhao et al. [8] studied the disaster mechanism of explosion wave propagation and obtained the methane explosion characteristics under different equivalence ratios as well as the main reasons of casualties caused by methane explosions. Yang et al. [9] studied the destructive characteristics of methane explosions and found that the shock wave pressure and high-speed airflow were the main causes of destruction to mine facilities. Xue et al. [10,11] used a numerical simulation method to study the dynamic response (damage) characteristics of roadway walls under methane explosion and found that the explosion pressure, damage degree, displacement deformation, and effective stress of roadway walls all increased with the increase in methane volume. Gao Weiliang et al. [12] studied the distribution characteristics of the vibration velocity, stress, and bending moment of mountain tunnel lining under a bottom dynamic load, where it was obtained that the peak vibration velocity at the bottom of the tunnel lining arch was the largest, followed by the two sides, and the peak vibration velocity in vault was the smallest. Zhou et al. [13]. tested the dynamic mechanical properties and static mechanical properties of coals and found that the dynamic compression intensity and the elastic modulus were obviously larger than those obtained in the static mechanical properties. Tianyuan et al. [14]. established an underground tunnel numerical model by FLAC3D software to analyze the response characteristics of underground tunnels under the action of blasting vibration and obtained the variation characteristics of the velocity and displacement. Zhu Chuanjie et al. [15] applied AutoReaGas to study the impact and oscillation characteristics of shock waves of methane explosions in closed pipes as well as the variation in characteristic parameters. Li Zhipeng et al. [16] used LS-Dyna to compare the damage characteristics of tunnel lining structures by two methane explosion modeling methods (TNT equivalent method and methane filling method). They found that the simulated damage characteristics modeled by the methane filling method were more in line with the actual damage situation on the tunnel site. The above research on the explosion impact load on structural response and structural damage mainly focused on the explosion of solid explosives, however, research on the response and damage characteristics of roadway wall structures by the methane explosion impact load in coal mines is still limited.
In light of this, the LS-Dyna numerical simulation software was used to establish a mathematical-physical model of methane explosions in roadways, and the dynamic response and damage deformation characteristics of the roadway walls were explored by measuring the changes in the overpressure, displacement, and equivalent stress of the roadway wall under the impact load of a methane explosion.

2. Establishment of Numerical Model

2.1. Mathematical Model

In order to carry out reasonable and effective numerical calculations, the basic assumptions were as follows: methane was mixed evenly (CH4 volume fraction of 9.5%) in a normal temperature and pressure state; there was only one heat source in the roadway, namely the methane explosion; the surrounding rock of the roadway was uniform and continuous; roadway walls were smooth and insulated; the wall heat effect was not considered; and the intermediate process of the methane explosion reaction was ignored. Based on the above assumptions, the basic control equations (mass, momentum, and energy equations) can be expressed as follows:
M = Δ ε ρ ε d v ε = Δ x ρ x d v x = Δ X ρ X d v X
t X Δ ε ρ ε v ε d v ε = Δ ε t i d s ε + Δ ε ρ ε f i d v ε
E = V s i j ε i j p + q V ˙
where ε is a position vector that represents the position of each point in the coordinate system; v is the motion velocity in space, m/s; ∆X, ∆x, and ∆ε are the boundaries of the material domain, the spatial domain, and the reference domain of any continuum, respectively; ρ X , ρ x , and ρ ε are the density of each substance in the continuum, kg/m3; t i is the force acting on the unit surface on the boundary, N; f i is the volume force per unit mass, m/s2; V is the relative volume; V ˙ is the relative volume deformation velocity of the current configuration; s i j is the partial stress tensor; p is the hydrostatic pressure, Pa; ε i j is the strain rate tensor; q is the volume viscous resistance, N.

2.2. Physical Model

The physical model was established as shown in Figure 1 and Figure 2. A 1/4 model was carried out for calculation, and the filling length of methane was set as 10 m. The model consisted of three parts: surrounding rock, air, and TNT explosive (equivalent methane quantity). The same five TNT explosives were evenly distributed on the roadway axis, which was located at a distance of h = 1 m from the bottom of the roadway. The axial coordinates were 0.5, 1.6, 2.7, 3.8, and 4.9 m respectively, and the initiation explosion point was set as the first TNT on the left end of the model. The coordinates of the initiation explosion point were (0, 0, 0.5). The length, width, and height of the physical model were 15 m, 7.5 m, and 15 m, respectively. Both the height and the width of roadway are 2 m; the crown radius is 1 m. The model was meshed by a solid 164 eight-node hexahedron mesh, and the node information in each part was transmitted by a common node. The Lagrange algorithm was used for the roadway wall, while the ALE algorithm was used for methane, TNT, and air. The right end of the roadway was open. Non-reflective boundary is set in right end to reduce boundary pressure reflection. The minimum mesh size near the initiation explosion point was set to 3 cm. The total number of meshes was about 590,000. Lagrange elements were used to observe the deformation and damage in the surrounding rock, while Euler elements were used for TNT and air to better simulate the propagation of explosion shock waves. The model was established by using the ALE method to align the fluid mesh with the solid mesh and control the fluid solid coupling behavior through the keyword of Constrained-Lagrange in-Solid.
To reduce the boundary reflection effect, a non-reflection boundary was set at the top, both sides, and rear of the physical model. In order to prevent unreasonable displacement and deformation in the Y direction under the gravity effect, a rigid boundary was set at the bottom of the physical model. The symmetrical boundary was set on the Y-Z plane and X-Y plane.
In order to observe the dynamic response laws of the roadway wall, four sections (A, B, C, D) were set along the roadway axis, and four measuring points (A, A1, A2, A3) were set on the roadway wall of each section. The positions of the measuring points are shown in Figure 3. The positions of each point on the roadway axis in Z coordinates were 0, 2.5 m, 5 m, and 7.5 m, respectively.

2.3. Material Model

The nonlinear material model and state equation adopted in the numerical model are described as follows. (1) The JWL state equation and the HIGH-EXPLOSIVE-BURN material were adopted in the TNT material model; specific parameters are shown in reference [16]. (2) The NULL material and the LINEAR-POLYNOMIAL state equation were adopted in the air model; specific parameters are shown in [16]. (3) The surrounding rock was described by the HJC material model. The material parameters of the surrounding rock are shown in [17,18].

3. Results Analysis and Discussion

After a methane explosion in the roadway, the generated energy will spread around and ignite the remaining methane in the roadway along the axial direction, which makes the shock wave spread farther. The radial explosion load has an impact effect on the roadway wall, causing the wall to be deformed under tension and compression. A large amount of energy is transmitted to the roadway wall, causing the wall to fall off and even collapse. Figure 4 shows the pressure–time–history curve in the air at the origin coordinate (0, 0, 0), where the peak pressure was 1.738 MPa. It shows that the maximum pressure of methane explosion in the model was about 1.738 MPa, which is consistent with the maximum explosion pressure produced by the methane explosion in an actual roadway [18]. Therefore, the simulation results could verify the feasibility and reliability of the numerical model.

3.1. Propagation Characteristics of Methane Explosion

Figure 5, Figure 6 and Figure 7 show the propagation process of the methane explosion shock wave in surrounding rock. It can be seen in Figure 5 and Figure 6 that the shock waves with high temperature and high pressure propagated rapidly to the surrounding area after the explosion, part of the shock waves propagated along the axial direction, the kinetic energy and heat energy were transferred to the surrounding air and wall surface, and the shock wave intensity was gradually weakened. The other part of shock waves propagated radially along the roadway, and was reflected or transmitted into the surrounding rock of the roadway after they arrived at the wall. Compared with Figure 5 and Figure 7, the vault and two sides of the roadway were first impacted obviously, and a high pressure region appeared. The cause is that the curved shape is conducive to the reflection of the shock wave, and the effect of the shock wave is enhanced. After that, the explosion load continued to impact the wall, and a high pressure region appeared at the floor. Since the distance from the lower corner to the explosion center was relatively large, the pressure appeared last.
As can be seen from Figure 7, the relationship between the pressure peaks at the section of the roadway was A1 > A > A2 > A3, and the duration of shock wave overpressure was similar. The pressure curve at the roof of the roadway had multiple peaks, and the shock wave was easier to reflect when it arrived at the roof, and the direction change of the reflected shock wave made it easier to cause serious damage to the wall that had been damaged by the first impact. The pressure peaks on two sides were also large, reaching 5.48 MPa. After the positive shock wave, the pressure dropped to negative pressure and then gradually returned to normal pressure. The difference in the pressure peaks between the corner and the floor was small, but the pressure peak at the corner was negative. This shows that the surrounding rock was mainly affected by the reflected shock wave and tensile force, while the tensile strength of the surrounding rock was generally low, so the surrounding rock was easier to fracture under tensile stress.

3.2. Change Law of Wall Stress

Figure 8 shows the stress change process of the surrounding rock under the impact of methane explosion. The impact velocity of methane explosion is very fast. At 0.35 ms, a high stress region appeared at the side and roof of the roadway, and the maximum stress between the side and the vault reached 14.8 MPa. Subsequently, high stress regions appeared successively at the floor and corner. At 0.65 ms, the maximum stress caused by methane explosion occurred at the roof, and the maximum stress was 29.02 MPa. After that, the shock wave gradually weakened, and the stress of the surrounding rock gradually decreased and then stabilized. The maximum stress at the floor and corner changed little between 10.35 ms and 50 ms, which shows that plastic damage occurred at the two wall surfaces and certain residual stress occurred at the deformation place. Therefore, attention should be paid to the protection of the roof and corner in roadway designs.
Figure 9 and Figure 10 show the stress change curve of each measuring point in the roadway. It can be seen in Figure 9 that with the increase in the distance from the initiation explosion point, the stress at the measuring point caused a time delay. The equivalent stress response of point B in the methane section was more severe than that of point A, and the peak difference was about 1.58 MPa. The dynamic response of the outer wall of the explosion region attenuated rapidly, and the attenuation amplitudes of equivalent stress at points C and D reached 68% and 73%, respectively. The peak difference at point C and the wall surface of the methane region was small, and the attenuation of the maximum main stress in the wall surface in the air region was fast. This shows that the damage caused by methane explosion was concentrated in the methane region, but the maximum main stress of the wall near the methane region was still high, and the damage possibility was also large. It can be seen in Figure 10 that the stress variation amplitude and peak at the roof and corner of the roadway were significantly greater than those at the other two places. The equivalent stress peak at the roof was the largest, reaching 14.5 MPa, and the equivalent stress peak at the floor was only 6.88 MPa. The maximum main stress peak at the corner was the largest, followed by the roof, with a difference of 33.6%. The maximum main stress peak of the upper part and the floor was close, about 1.9 MPa. The duration of high stress in the roof and corner was longer, and the deformation time of the surrounding rock was longer, so the damage was also larger.

3.3. Wall Deformation Characteristics

As shown in Figure 11a, under the impact load action of methane explosion, each measuring point on the roadway wall expanded, the peak displacement relationship of the measuring point was A > B > C > D, and the expansion deformation peak of the measuring point in the methane region was the largest. After the displacement of each measuring point reached the peak, it continued to oscillate and decrease, and finally tended to a non-zero stable value, which indicates that the wall structure suffered certain damage. However, the final displacement magnitude was small, only at the μm level, so the wall deformation was almost negligible. Figure 11b shows the velocity time–history curve of the axial measuring point of the roadway. Under the explosion load, the wall first expanded outward. With the shock wave propagating along the axial direction, the expansion velocity of each measuring point reached the peak successively. Subsequently, under the action of internal force, the wall began to rebound to its original state, and then became stable in the process of dynamic oscillation.
As shown in Figure 12a, after the shock wave reached the wall, all positions of the roadway section were in continuous vibration deformation, and the largest vibration amplitude was on the side and roof, followed by the floor, and the lowest was in the corner. The reason is that the shock wave reached the corner last. When the shock wave reached the corner, the side and floor had expanded (deformed) and were squeezed there, which increased the density and rigidity of this place making it difficult to vibrate and deform without damage. Figure 12b shows the time history of the deformation velocity at each section. The side expanded rapidly at a velocity of about 53 cm/s and then rebounded at a large velocity, with a long rebound time. Multiple velocity peaks appeared at the expansion of the arch crown, indicating that there were multiple reflected shock waves acting on the arch crown, and then rebounded rapidly with a large velocity. The expansion velocity of the measuring point at the floor was the smallest, and the rebound velocity was also slow.

3.4. Damage Evolution Process of Wall Under Methane Explosion Load

In order to make the change part of the surrounding rock more intuitive and clearer, the surrounding rock part of 2 m around the roadway was intercepted for demonstration. Figure 13 shows the evolution of wall damage. At 0.35 ms, the side and lower part of the roof were damaged under the positive shock wave. Subsequently, the damaged region spread to the axial and corner of the roadway, and the floor was also damaged. At 0.9 ms, the damage region diffused to the corner, where the explosion shock wave arrived at 0.5 ms, and high stress occurred at 0.65 ms, indicating that the wall damage is not only determined by the two parameters of pressure and stress peak, but is also affected by the action time of the explosion shock wave. Subsequently, with the propagation of the shock wave, the damage region gradually spread along the roadway axis. At 1.80 ms, the complete damage region was formed and the wall was no longer damaged. As shown in Figure 14, under the methane explosion load, the roadway wall had been damaged, the damage of the methane accumulation region was relatively serious, and the damage depth at the corner reached 0.25 m. The simulation results were similar to the actual methane explosion wall damage effect [18].

4. Conclusions

In this paper, a numerical model of methane explosion in underground arched roadways was established and numerical simulations were carried out. The dynamic response and damage characteristics of wall structure were analyzed from the aspects of the methane explosion propagation characteristics, wall stress variation law, wall deformation characteristics, and wall damage evolution process under a methane explosion load. The following conclusions were obtained:
(1)
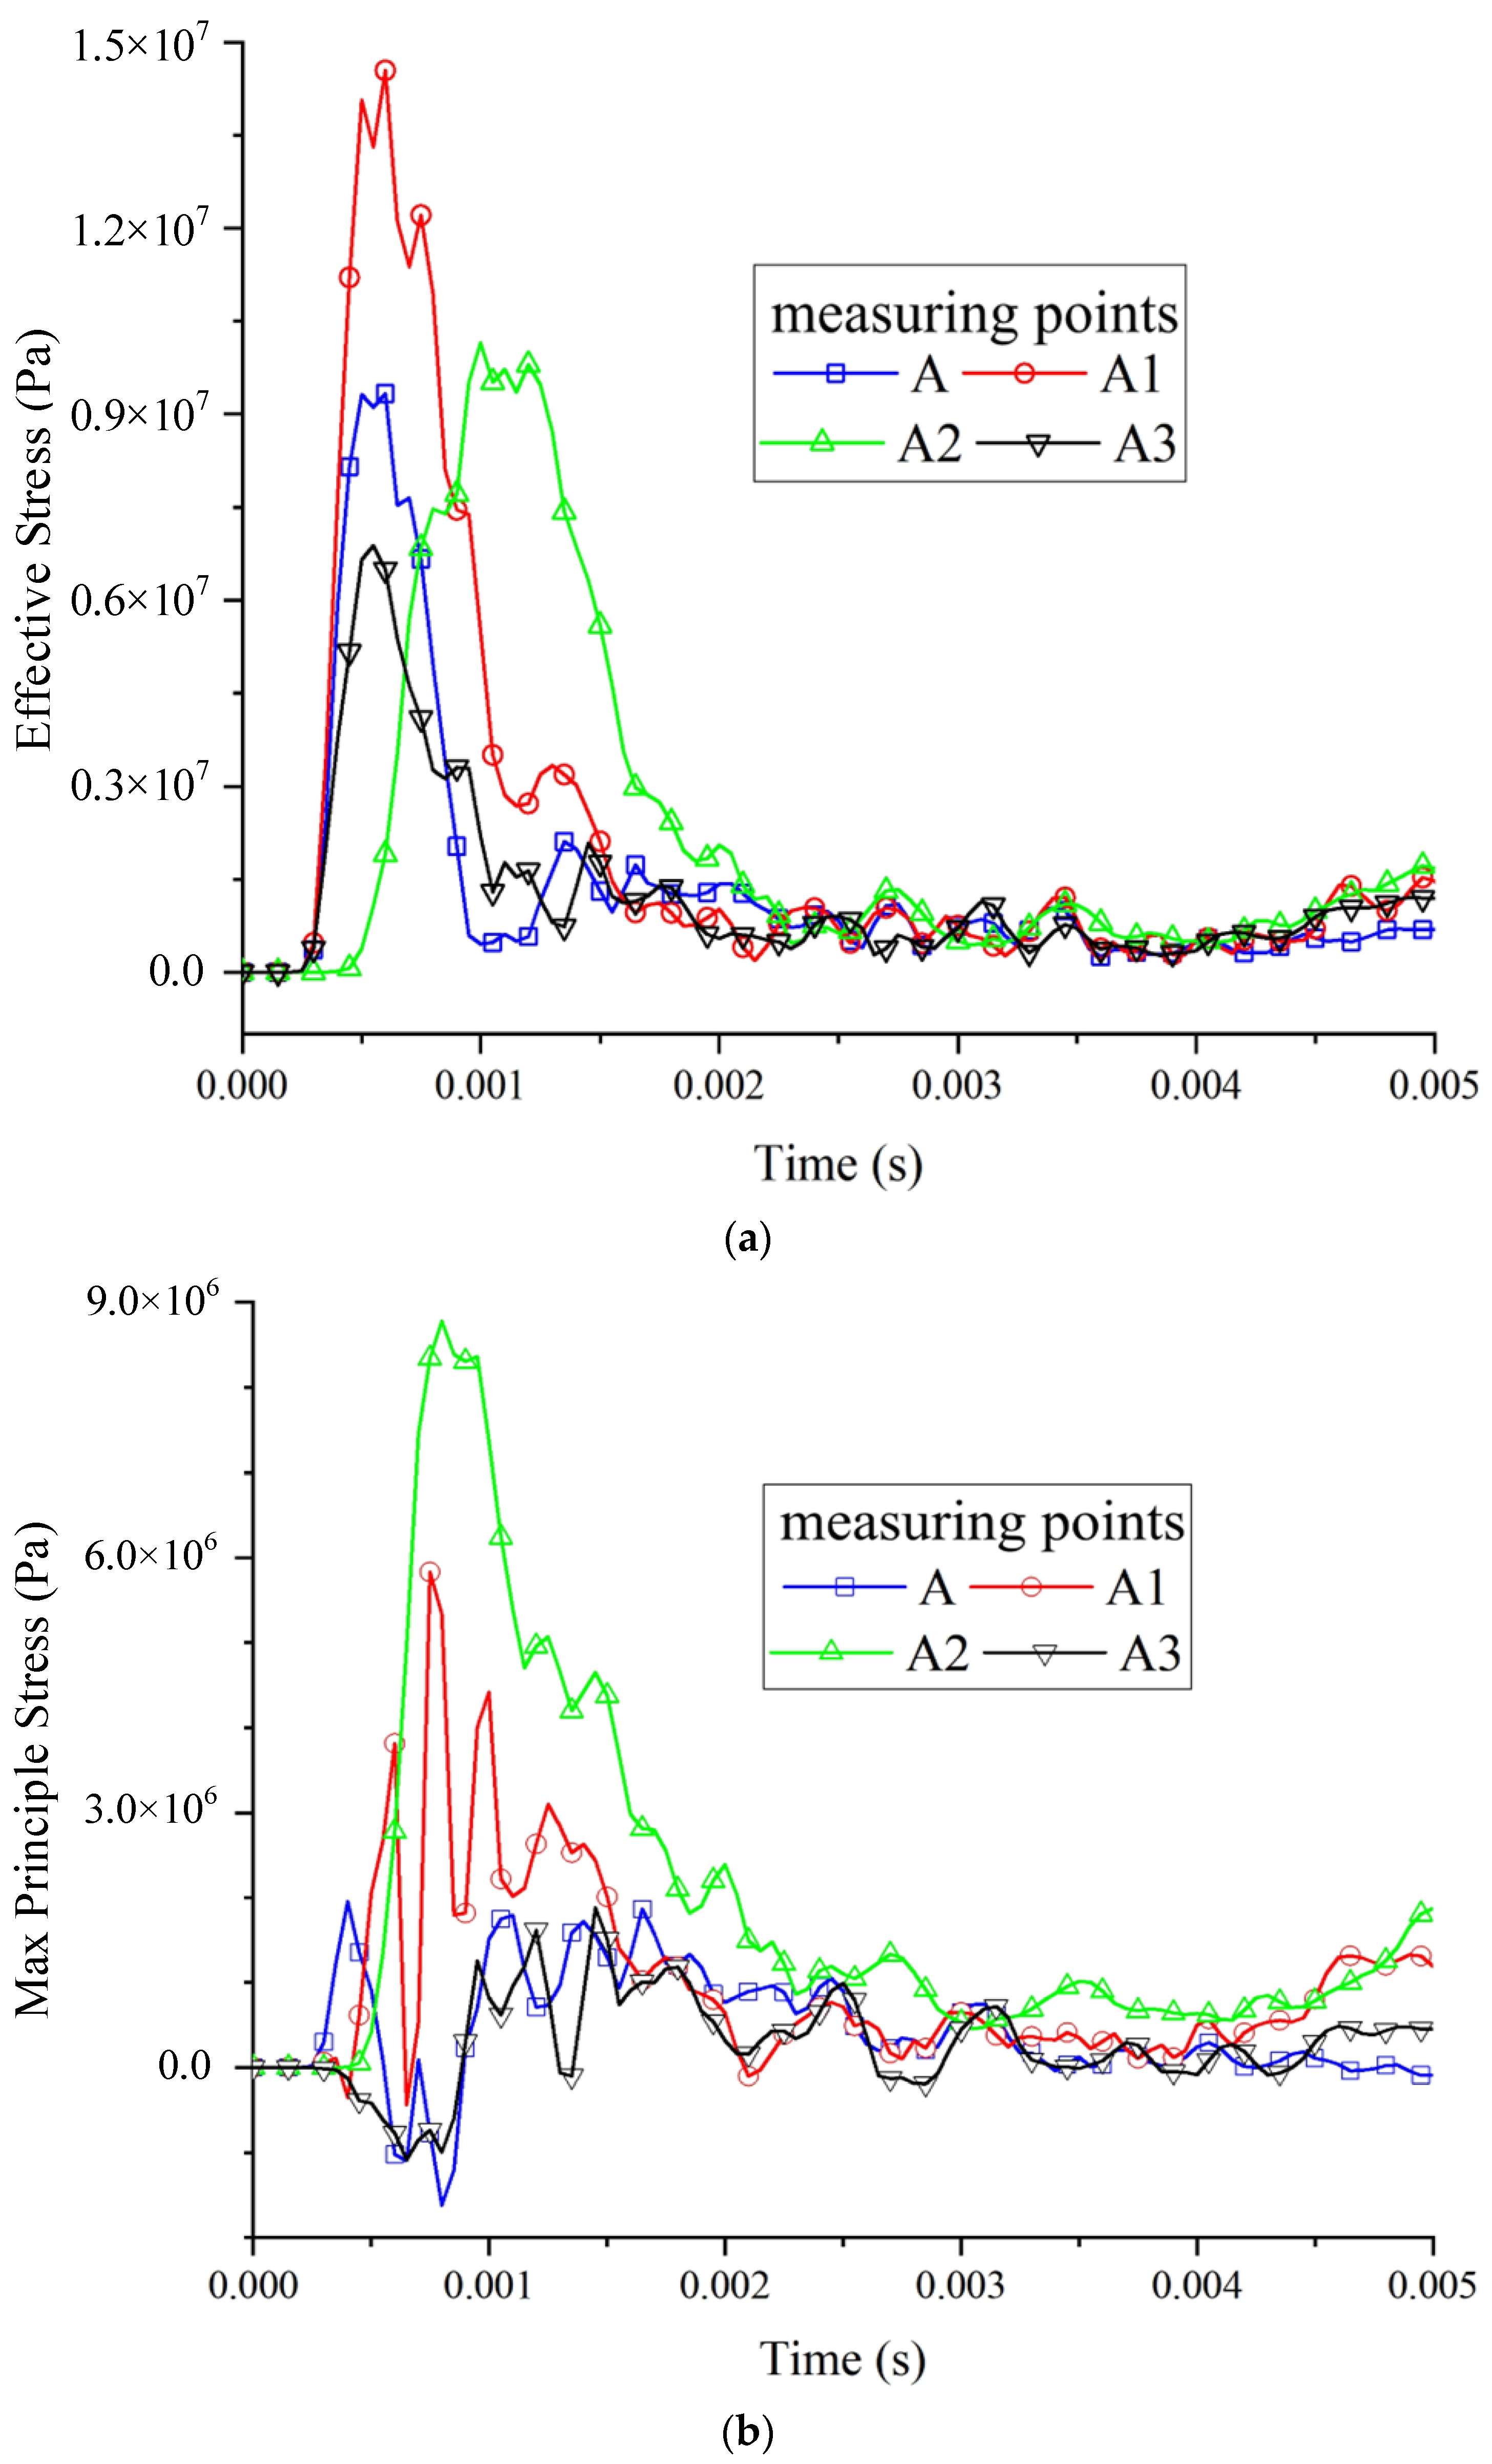
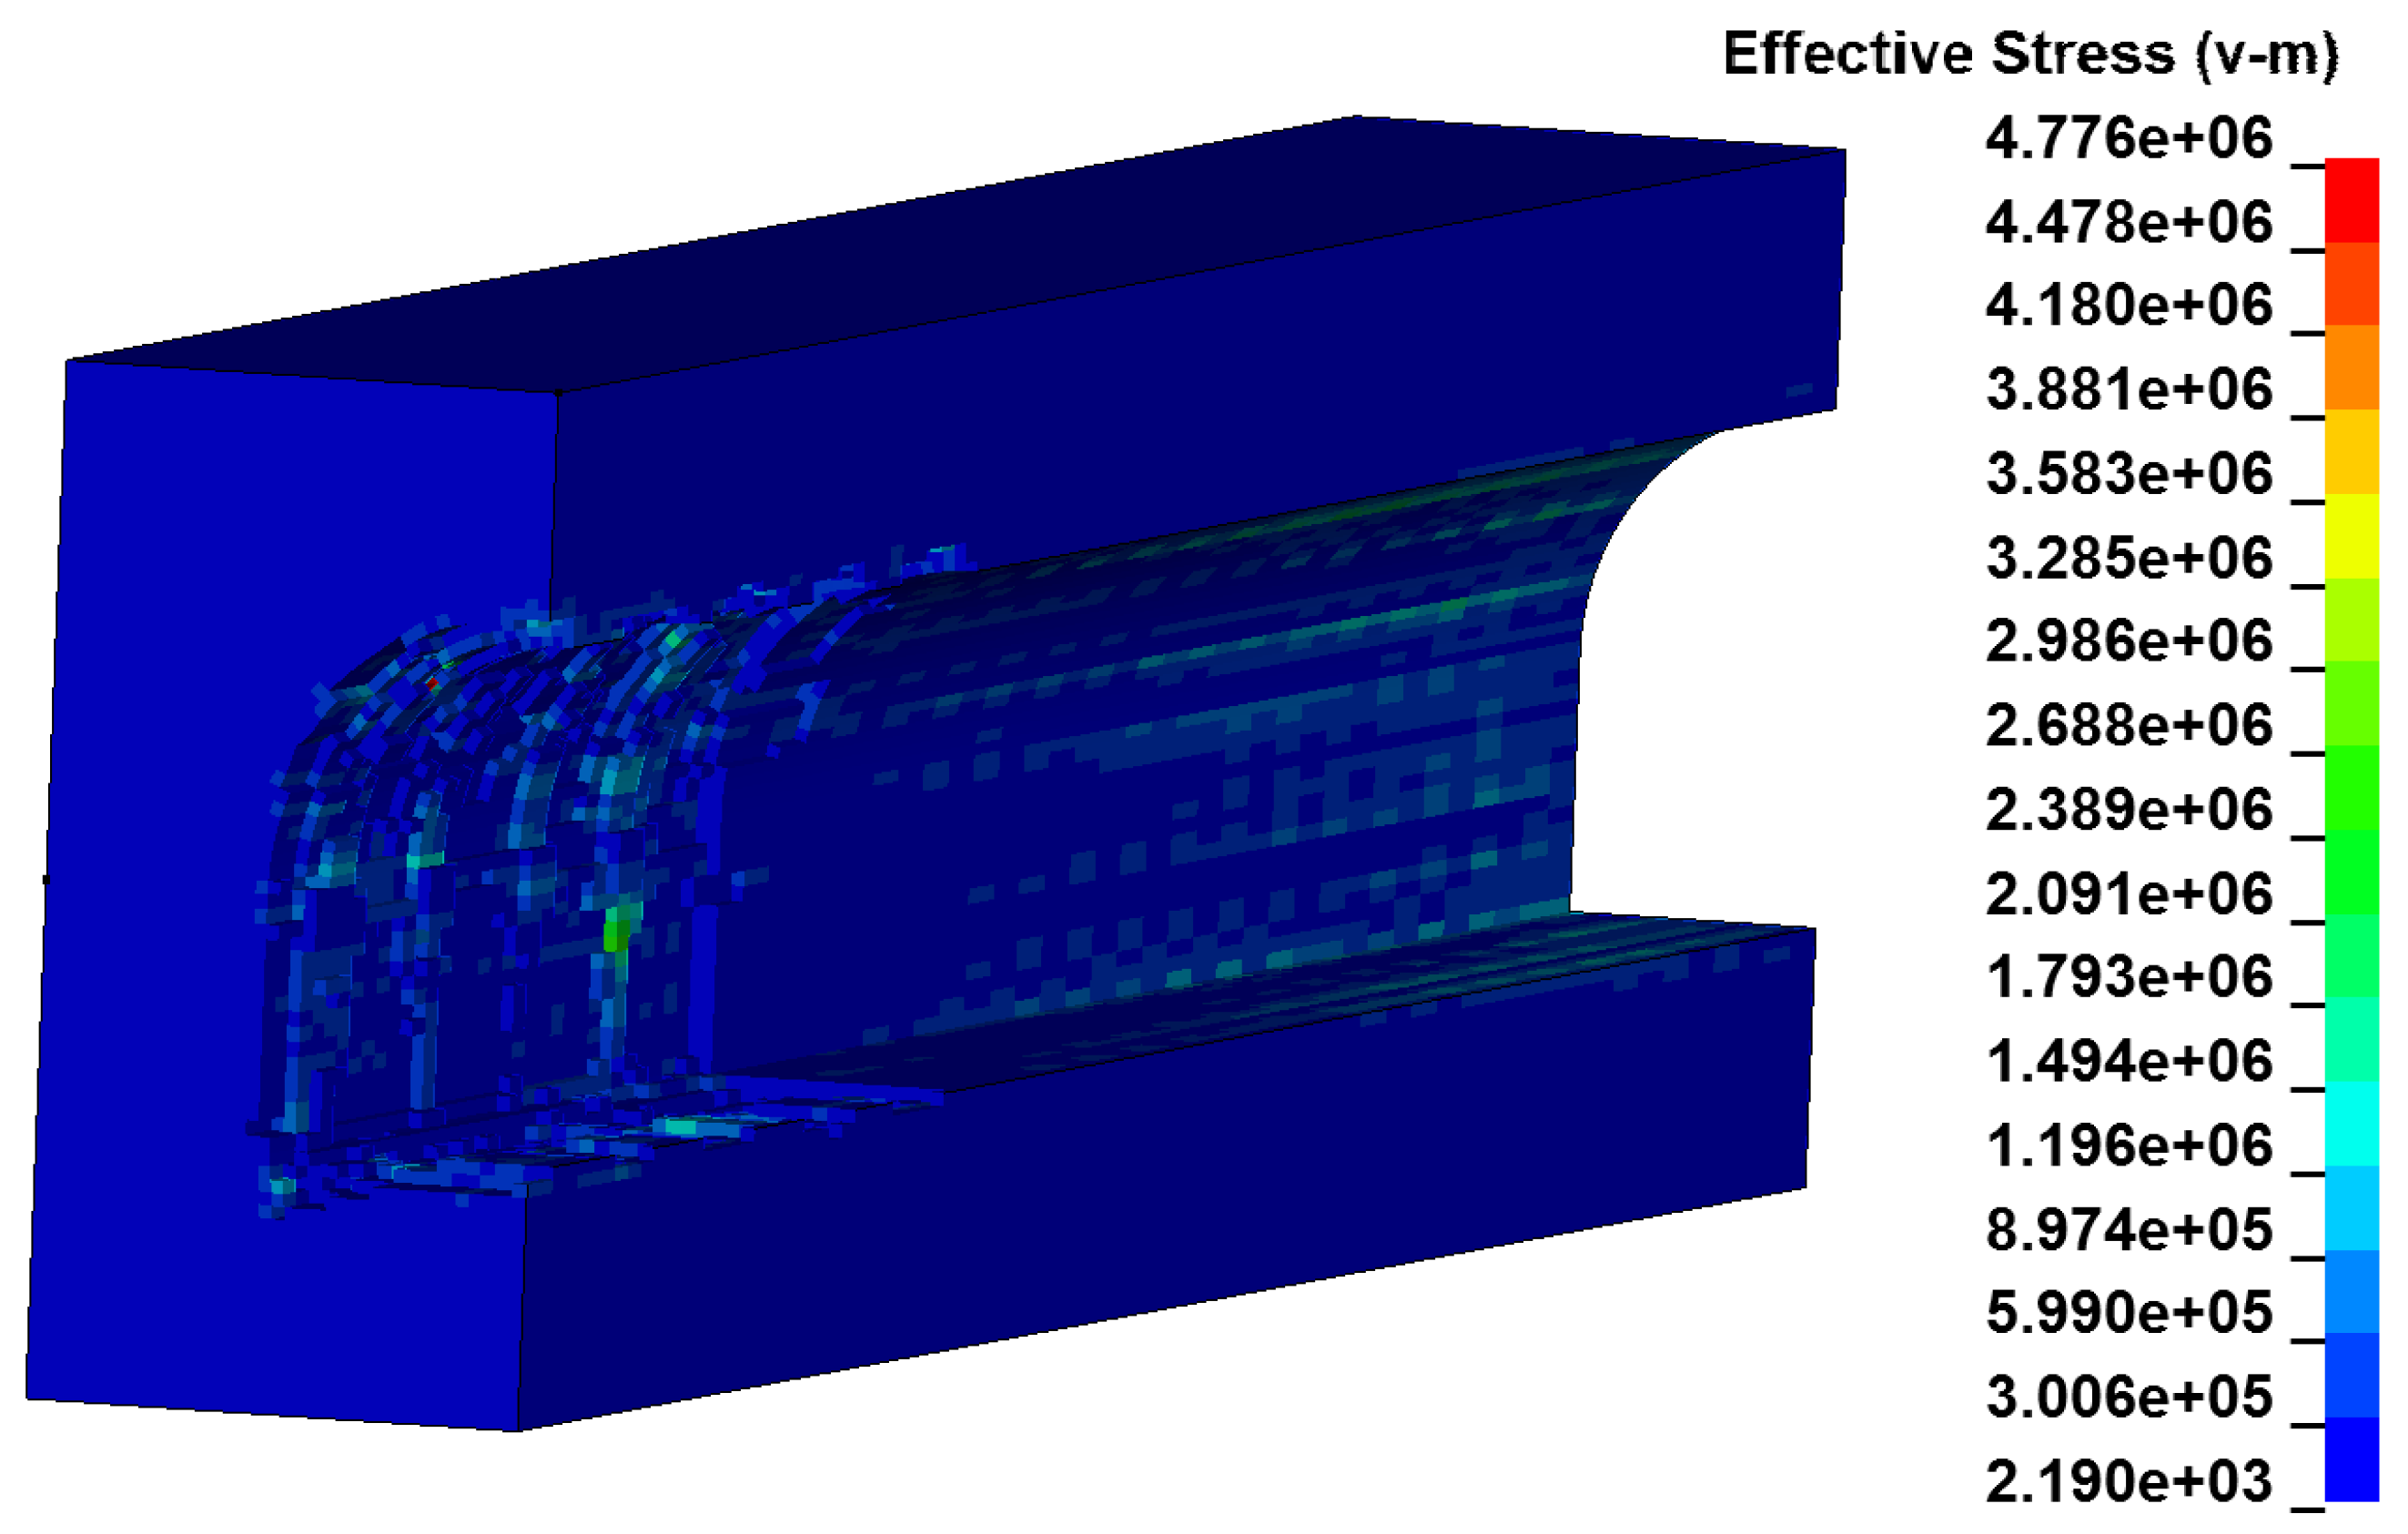
The wall damage caused by the load action of the methane explosion was mainly concentrated in the methane accumulation region, in which the stresses at the roof and corner were the most concentrated and the damage was the most serious. The maximum peak principal stress of the upper and lower plates was close to the peak stress of the top plate, reaching 1.9 MPa. The duration of high stress at the roof and corners was longer, and the deformation time of the surrounding rock was longer. Under the methane explosion load, the dynamic response of the roadway wall decreased with the increase in the distance from the initiation explosion point.
(2)
The pressure and stress response at the curved part of the roadway roof were the most severe; the pressure and stress response of the upper part were secondary to that of the top plate, and the degree of deformation and damage was the highest. The stress change at the corners was significant, but the deformation was relatively small, and the bottom plate was minimally affected by the methane explosion loads.
(3)
The arch top and two sides of the roadway were first subjected to significant impact, resulting in a high-pressure zone. Subsequently, the explosion load continued to impact the walls, and a high-pressure zone appeared at the bottom plate. The distance from the explosion center at the lower corner was relatively larger, and the pressure appeared last.
(4)
The peak pressure of the upper part was relatively high, and there was not much difference in the peak pressures between the corner and the bottom plate, which was about 4 MPa. Plastic damage occurred on the top plate and corner walls, resulting in residual stress at the deformation site.
(5)
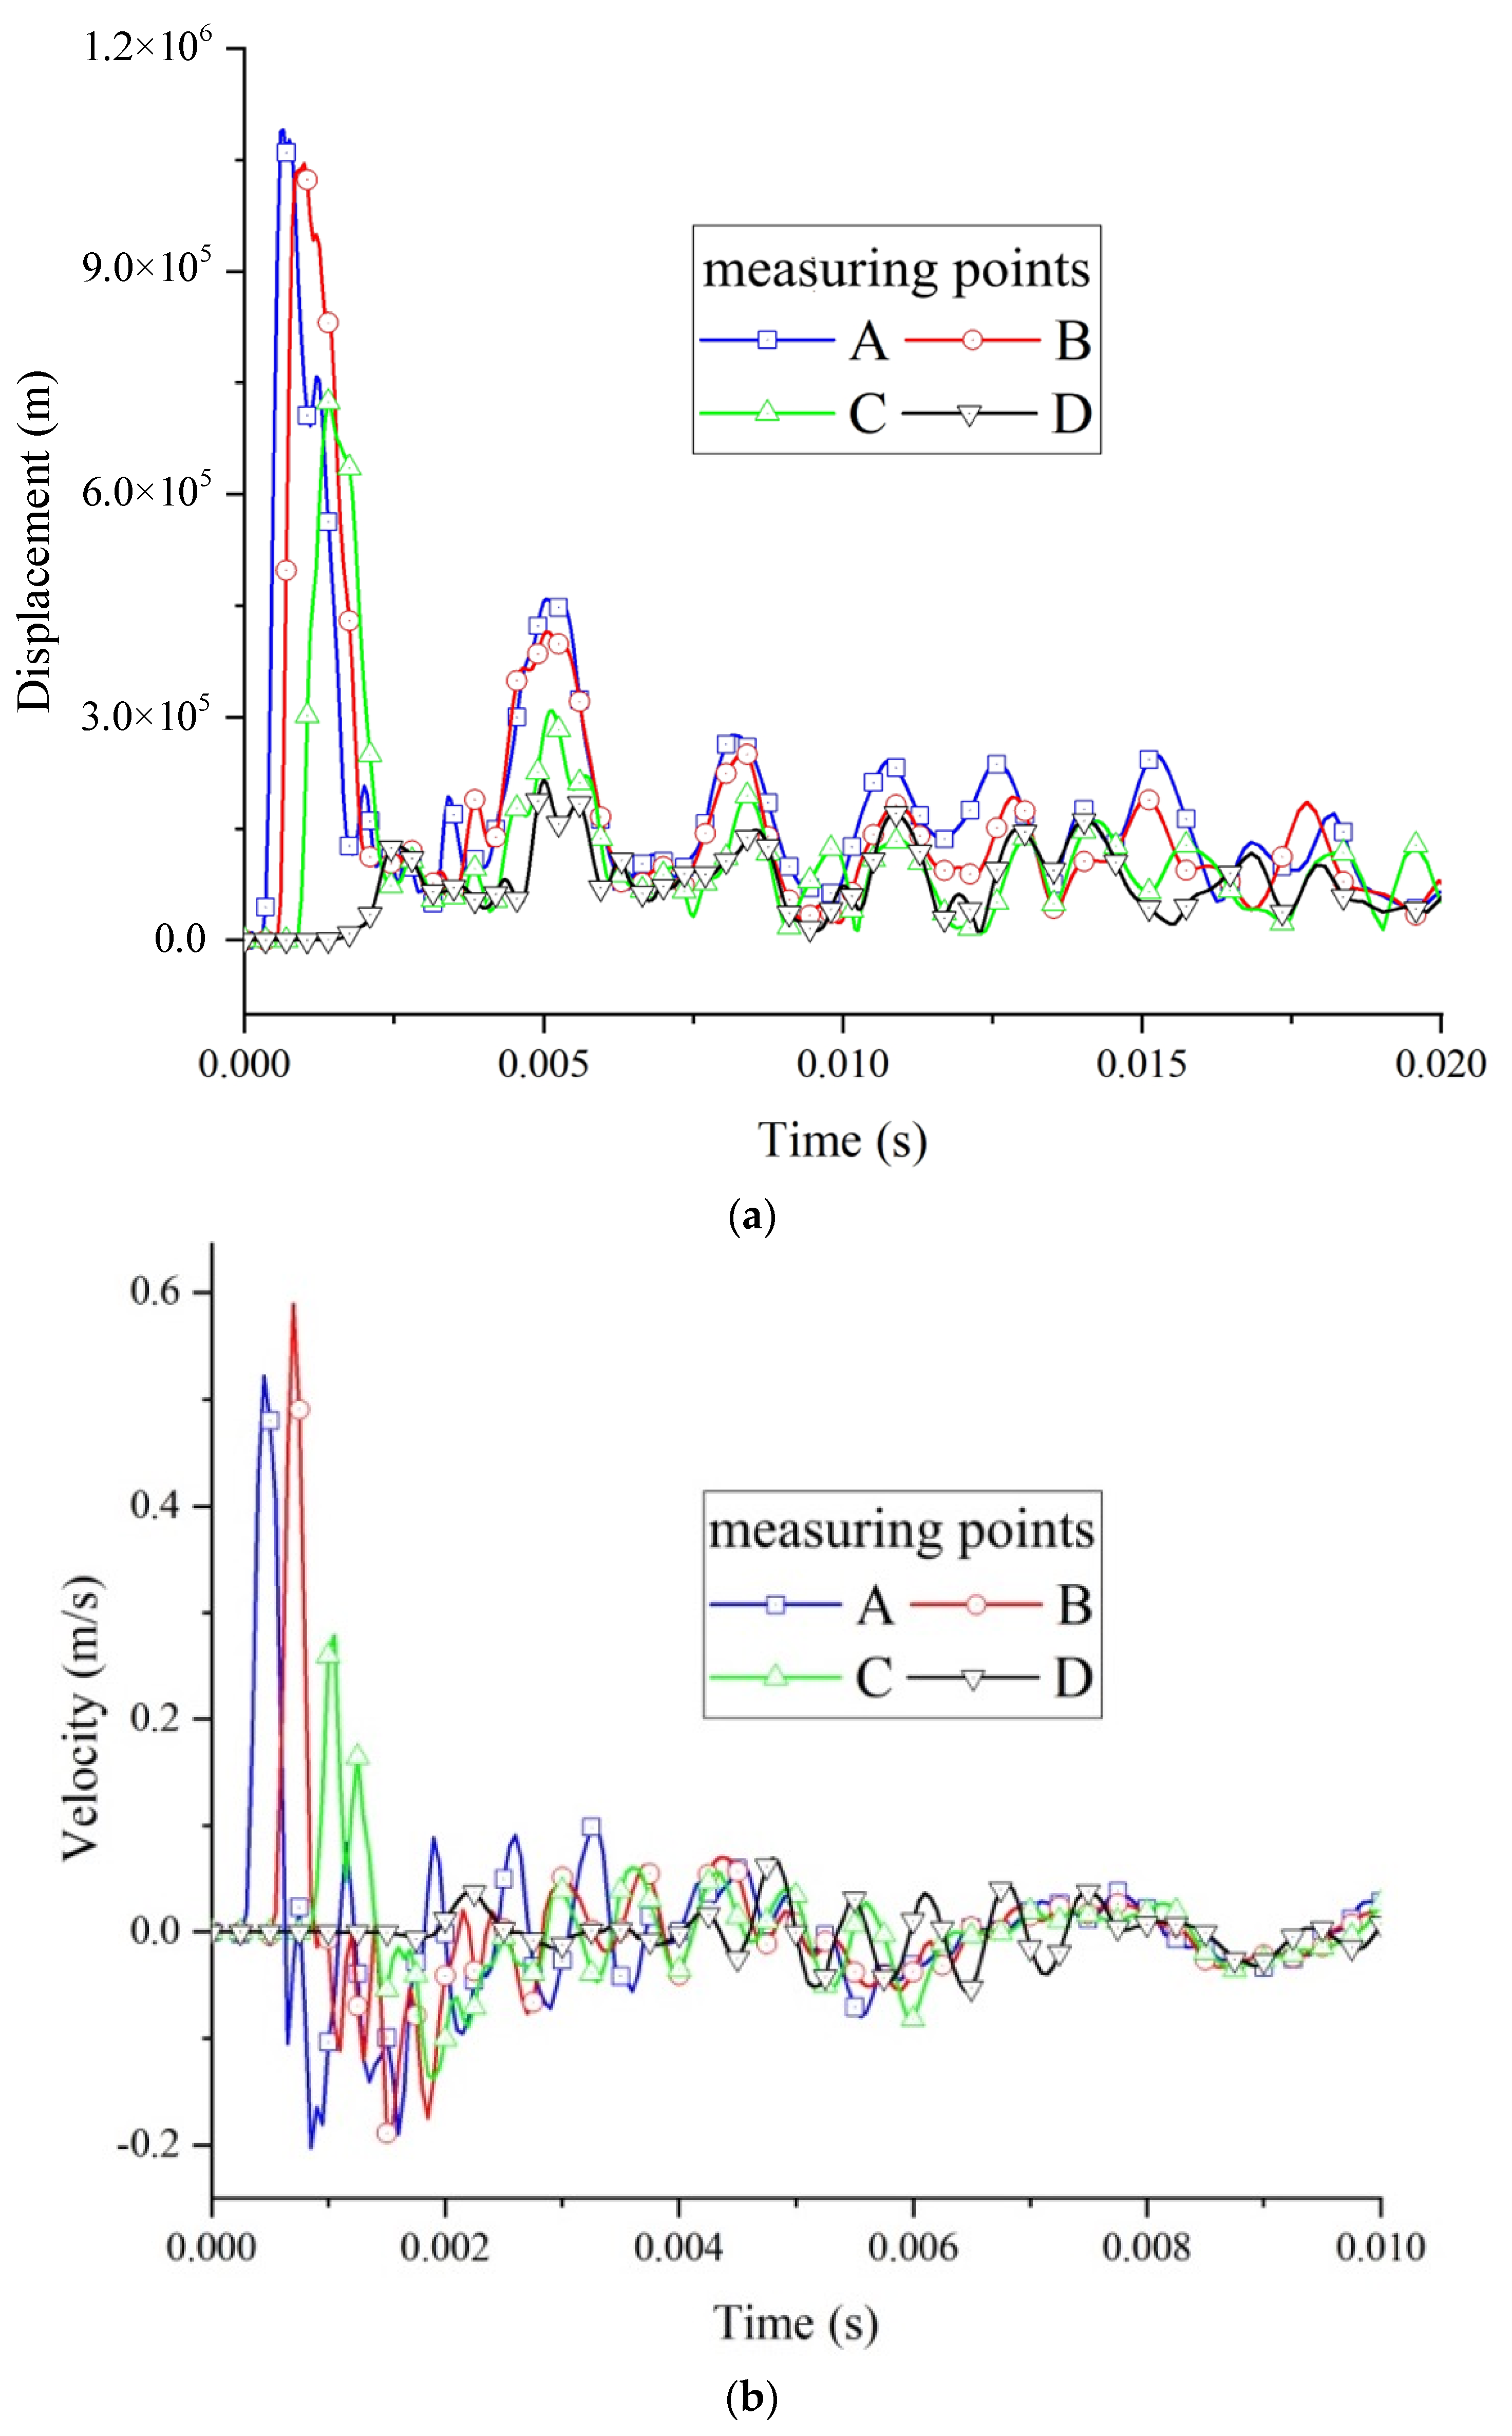
Under the load action of explosion, the wall first expanded outward, with the shock wave propagating along the axial direction, and the expansion velocity of each measuring point reached its peak successively.
(6)
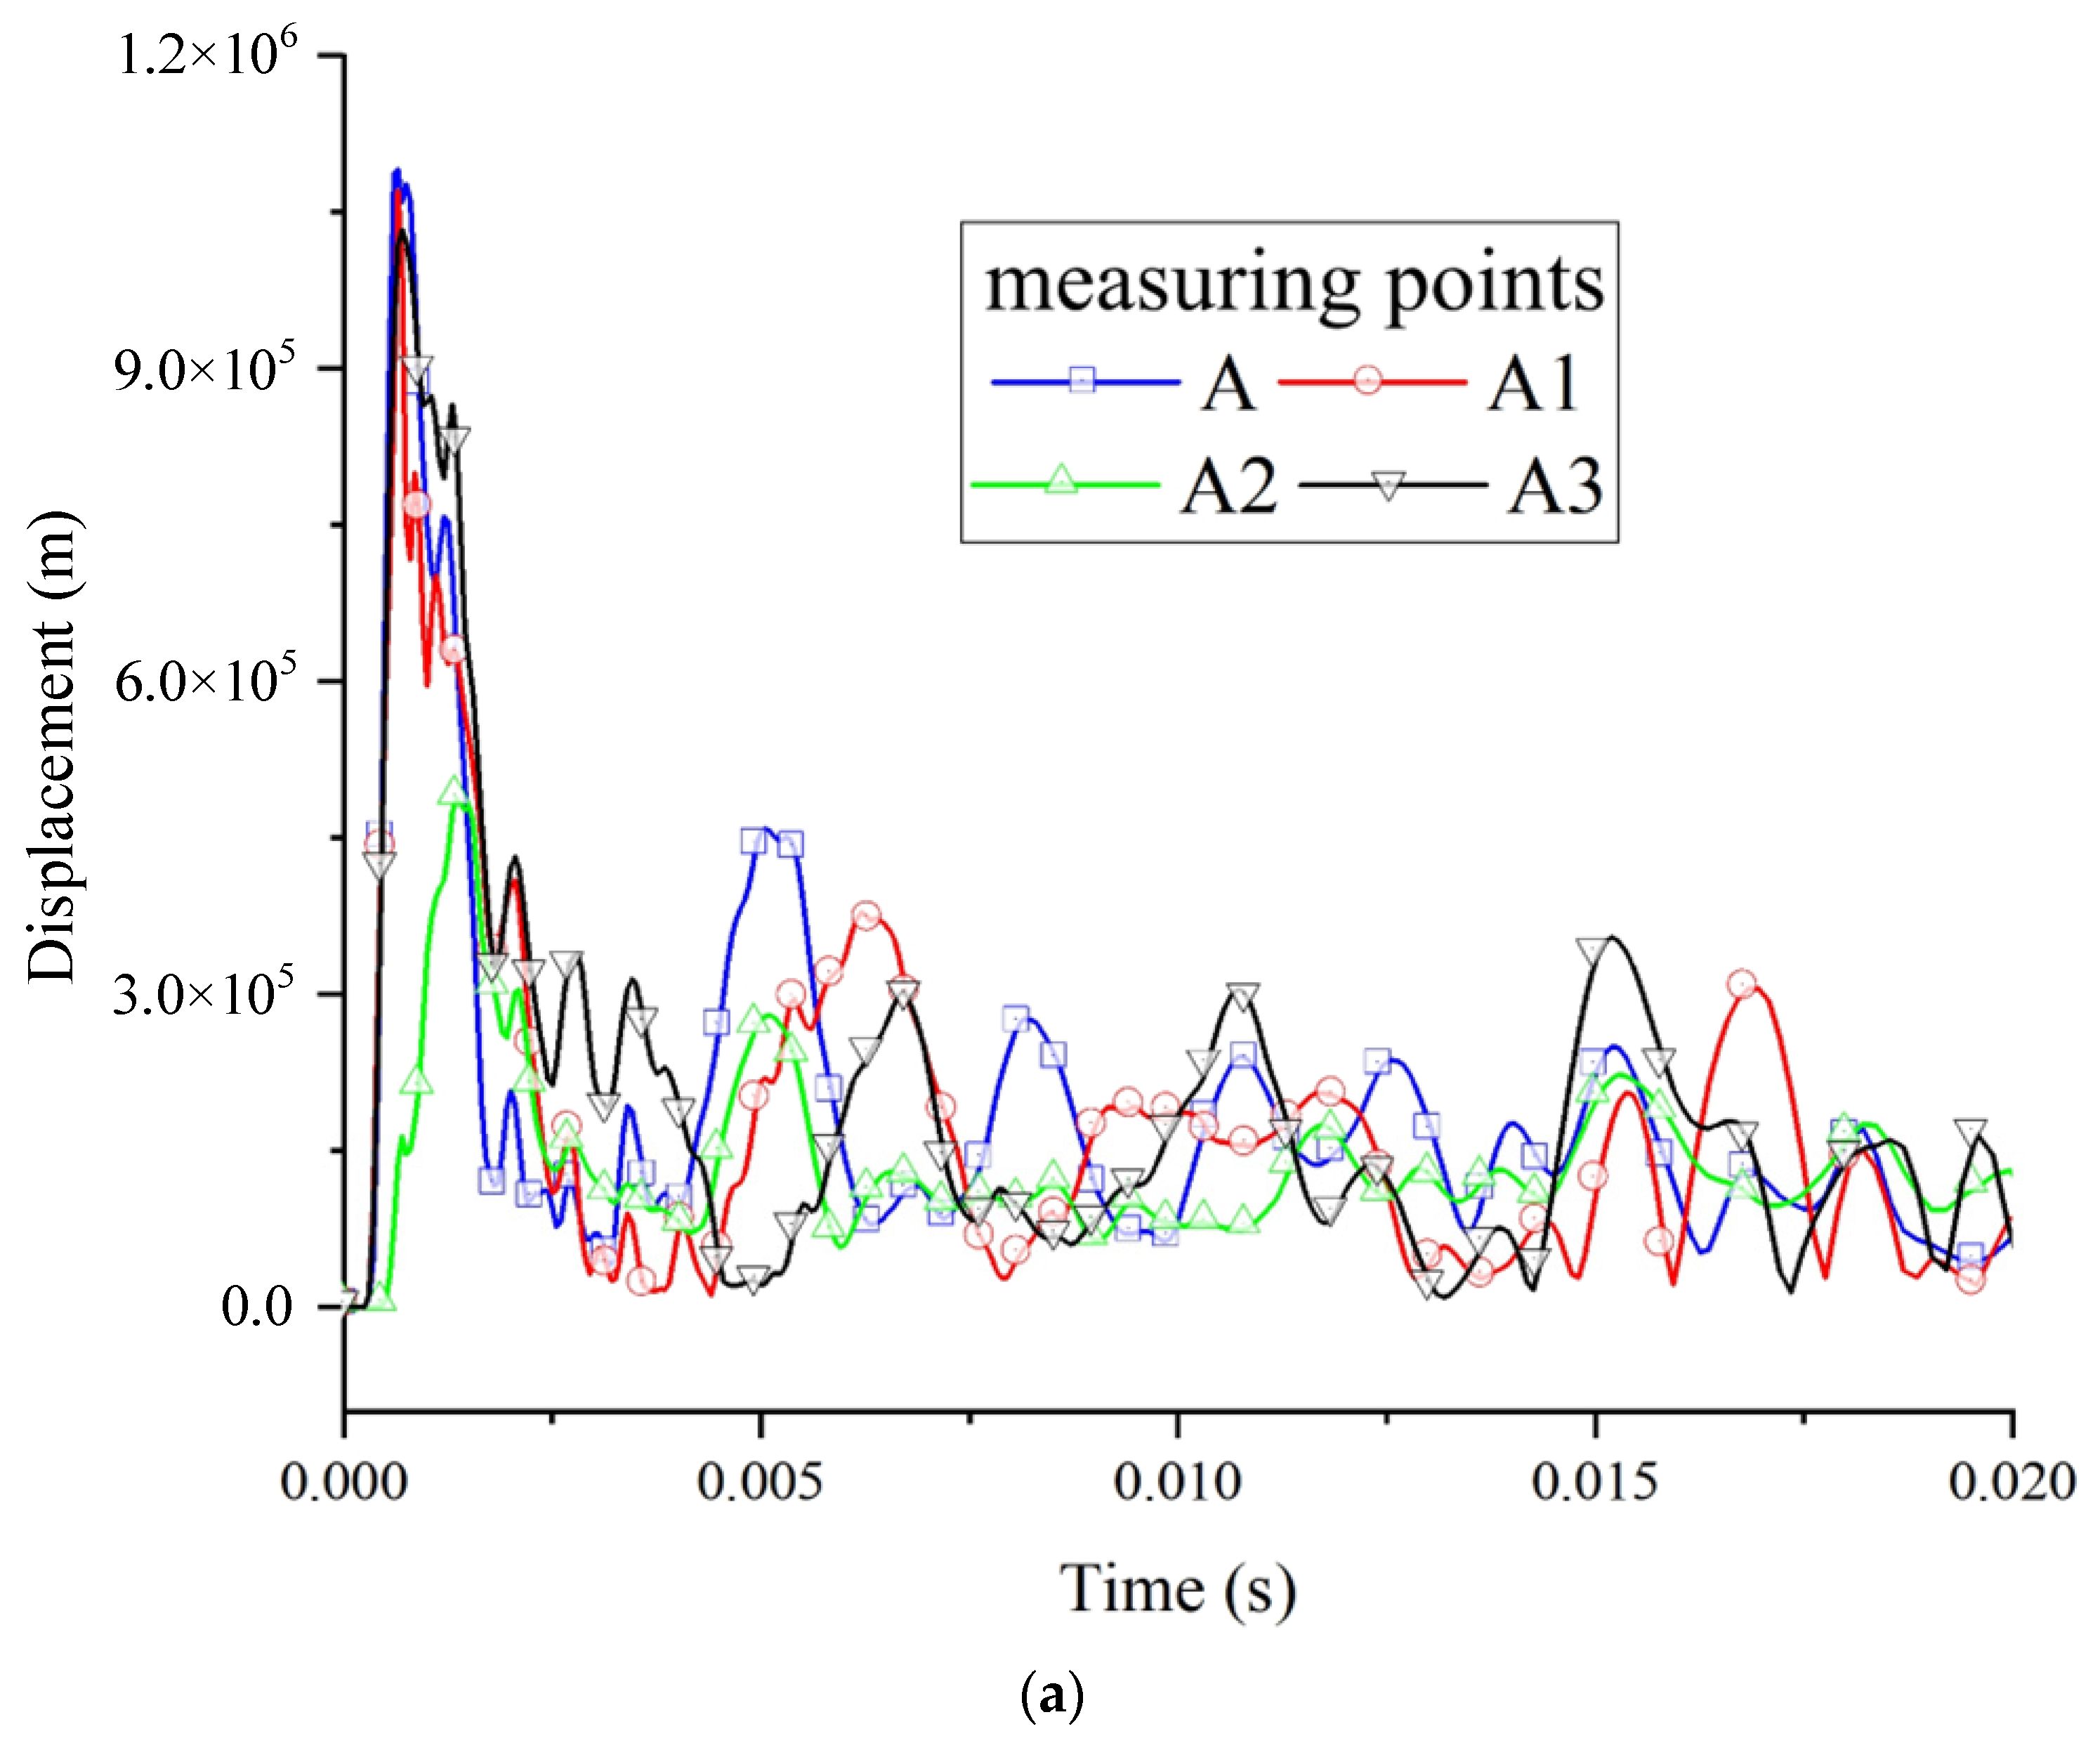
After the shock wave reached the wall, various positions of the roadway section were constantly vibrating and deforming. The vibration amplitude of the support and roof was the largest, followed by the bottom plate, and the vibration amplitude at the corner was the smallest.

Author Contributions

Conceptualization, Z.J. and Q.Y.; Methodology, Z.J. and Q.Y.; Software, Z.J. and J.L.; Investigation, Z.J.; Writing—original draft preparation, Q.Y. and J.L.; Writing—review and editing, Q.Y. and J.L. All authors have read and agreed to the published version of the manuscript.

Funding

This work was financially supported by the National Natural Science Foundation Project of China (52174178, 52174177). This support is gratefully acknowledged.

Institutional Review Board Statement

Not applicable.

Informed Consent Statement

Not applicable.

Data Availability Statement

Data are contained within the article.

Conflicts of Interest

The authors declare no conflicts of interest.

References

  1. Zhang, L.; Wang, H.; Chen, C.; Wang, P.; Xu, L. Experimental study to assess the explosion hazard of CH4/coal dust mixtures induced by high-temperature source surface. Process Saf. Environ. Prot. 2021, 154, 60–71. [Google Scholar] [CrossRef]
  2. Li, R.; Zhang, Z.; Si, R.; Wang, L.; Li, S.; Wu, W.; Cao, J.; Ren, W. Experimental study on injuries to animals caused by a gas explosion in a large test laneway. Shock Vib. 2021, 2021, 6632654. [Google Scholar] [CrossRef]
  3. Luo, Z.; Kang, X.; Wang, T.; Su, B.; Cheng, F.; Deng, J. Effects of an obstacle on the deflagration behavior of premixed liquefied petroleum gas-air mixtures in a closed duct. Energy 2021, 234, 121291. [Google Scholar] [CrossRef]
  4. Yang, W.; Zheng, L.; Wang, C.; Wang, X.; Jin, H.; Fu, Y. Effect of ignition position and inert gas on hydrogen/air explosions. Int. J. Hydrogen Energy 2021, 46, 8820–8833. [Google Scholar] [CrossRef]
  5. Cui, C.; Shao, H.; Jiang, S.; Zhang, X. Experimental study on gas explosion suppression by coupling CO2 to a vacuum chamber. Powder Technol. 2018, 335, 42–53. [Google Scholar] [CrossRef]
  6. Gao, K.; Liu, Z.; Wu, C.; Li, J.; Liu, K.; Liu, Y.; Li, S. Effect of low gas concentration in underground return tunnels on characteristics of gas explosions. Process Saf. Environ. Prot. 2021, 152, 679–691. [Google Scholar] [CrossRef]
  7. Jia, Z.; Ye, Q.; Yang, Z. Influence of wall heat effect on gas explosion and its propagation. Processes 2023, 11, 1326. [Google Scholar] [CrossRef]
  8. Zhao, Y.; Zhang, Y.; Hu, W. Numerical simulation study on the propagation and disaster mechanism of coal mine gas explosion waves. J. North China Univ. Nat. Sci. Ed. 2020, 41, 73–78+90. [Google Scholar]
  9. Yang, Z.; Ye, Q.; Jia, Z.; Li, H. Numerical simulation of pipeline-pavement damage caused by explosion of leakage gas in buried pe pipelines. Adv. Civ. Eng. 2020, 10, 4913984. [Google Scholar] [CrossRef]
  10. Xue, Y.; Chen, G.; Zhang, Q.; Xie, M.; Ma, J. Simulation of the dynamic response of an urban utility tunnel under a natural gas explosion. Tunn. Undergr. Space Technol. 2021, 108, 103713. [Google Scholar] [CrossRef]
  11. Jia, Z.; Ye, Q. Analysis of the response characteristics of a roadway wall under the impact of gas explosion. Energy Sci. Eng. 2023, 11, 2486–2504. [Google Scholar] [CrossRef]
  12. Gao, W.; Wang, G.; Zhang, Y. Dynamic response of mountain tunnel lining under blasting. Chin. J. Appl. Mech. 2020, 37, 1737–1744. [Google Scholar]
  13. Zhou, J.X.; Zhu, C.J.; Lu, X.M.; Ren, J.; Si, R.J.; Ye, Q. Experimental investigation on the mechanical response of coals to uniaxial compression and low-speed dynamic loading. Shock Vib. 2021, 2021, 8871458. [Google Scholar] [CrossRef]
  14. Tian, Y.; Dong, Y. Dynamic response characteristics of underground roadway under blasting vibration. Explos. Mater. 2019, 48, 60–65. [Google Scholar] [CrossRef]
  15. Zhu, C.J.; Gao, Z.S.; Lin, B.Q.; Tan, Z.; Sun, Y.M.; Ye, Q.; Guo, C. Flame acceleration in pipes containing bends of different angles. J. Loss Prev. Process Ind. 2016, 43, 273–279. [Google Scholar] [CrossRef]
  16. Li, Z.; Wu, S.; Yan, Q.; Jiang, Y. Numerical analysis on the tunnel gas explosion and study on the method for determining the type of burst source. J. Vib. Shock 2018, 37, 94–101. [Google Scholar] [CrossRef]
  17. Wu, Y. Analysis on Dynamic Responses and Progressive Collapse of Steel Frame Structure Subject to Internal Gas Explosion. Master’s Thesis, Northeast Forestry University, Harbin, China, 2012. [Google Scholar]
  18. Lu, X. Study on Damage and Failure Mechanism of Roadway Under Coupling Action of Gas Explosion Load and High Stress. Master’s Thesis, China University of Mining and Technology, Beijing, China, June 2019. [Google Scholar]
Figure 1. Sketch of the model.
Methane 04 00004 g001
Figure 2. Meshing diagram of the finite element model.
Methane 04 00004 g002
Figure 3. Position of measuring points. (a) Wall measuring point of the roadway axis; (b) wall measuring point of the roadway section.
Methane 04 00004 g003
Figure 4. Pressure curves at the origin point.
Methane 04 00004 g004
Figure 5. Nephogram of pressure propagation in the surrounding rock.
Methane 04 00004 g005
Figure 6. Pressure curves of the measuring points in the roadway axial direction.
Methane 04 00004 g006
Figure 7. Pressure curves of the measuring points in the roadway section.
Methane 04 00004 g007
Figure 8. Evolution law of effective stress in the roadway.
Methane 04 00004 g008
Figure 9. Stress curves of the axial measuring points. (a) Time history curve of equivalent stress; (b) time history curve of the maximum principal stress.
Methane 04 00004 g009
Figure 10. Stress curves of the measuring points in roadway section. (a) time history curve of equivalent stress; (b) time history curve of the maximum principal stress.
Methane 04 00004 g010
Figure 11. Deformation curves of the axial measuring points. (a) Displacement curve; (b) velocity curve.
Methane 04 00004 g011
Figure 12. Deformation curves of the measuring points in the roadway section. (a) Displacement curve; (b) velocity curve.
Methane 04 00004 g012aMethane 04 00004 g012b
Figure 13. Damage evolution diagram of the roadway wall.
Methane 04 00004 g013
Figure 14. Final damage of the roadway wall.
Methane 04 00004 g014
Disclaimer/Publisher’s Note: The statements, opinions and data contained in all publications are solely those of the individual author(s) and contributor(s) and not of MDPI and/or the editor(s). MDPI and/or the editor(s) disclaim responsibility for any injury to people or property resulting from any ideas, methods, instructions or products referred to in the content.

