1. Introduction
The history of global energy bodies, such as the Organization of Petroleum Exporting Countries (OPEC) [
1] and the International Energy Agency (IEA) [
2], may lead the observer to consider the global energy market as being composed of a neat dichotomy of energy resource producing and exporting countries (such as OPEC members) and countries dependent on energy imports for their economic survival (such as IEA members). The history of the study of energy security and development of policies to enhance it formally originates from the time of the first oil shock in 1973–1974, when a number of major oil producing countries acting together exercised their dominant market position to reduce petroleum production, dramatically increasing the price of their petroleum exports to much of the industrialized world [
3]. Countries that had become economically dependent on cheap and abundant petroleum supplies were suddenly hit with an unexpected major economic impact. In response, the IEA was formed in 1974 by a core group of 17 countries, with the mission to ensure the security of oil supplies [
2]. To this day, energy security remains a central mission of the IEA, along with a number of wider issues in the energy–economic–social–environmental nexus, notably including the decarbonization of global energy systems in response to anthropogenic climate change [
4].
Therefore, it comes as no surprise that the existing body of knowledge on the topic of energy security primarily originates from and is highly focused on the concerns of major energy import-dependent economies, such as Japan [
5] and the European Union [
6].
However, the reality of the global energy market is much more complex than a simplistic supplier–consumer dichotomy. While some countries are almost entirely dependent on energy imports, many countries produce a significant part of their own energy needs, some are net exporters in one or a number of fuels (but not others), and critically for the topic of this paper, every energy exporter is themselves a consumer with a domestic energy system that may be integrated with export operations to varying degrees. Even major energy resource exporting countries themselves are also energy users and their domestic energy systems are potentially also prone to energy security risks.
In this context, the objective of this paper is to conduct a focused analysis of potential energy security blind spots uniquely experienced by net energy resource exporters, and in doing so, to mitigate any such blind spots with fit-for-purpose energy security indicators. This issue has been highlighted in earlier work by the authors but remains an area of significant research need [
7]. This paper, therefore, attempts to add to this under-represented perspective by first of all establishing some of the energy security blind spots that energy resource exporting countries may experience in relation to their own domestic energy systems if they become distracted in becoming an energy superpower [
8]. Then, having established such blind spots and examined specific case studies as validation of the reality of these blind spots, new energy security indicators are proposed as a means of quantitatively evaluating the unique domestic energy security risks of energy resource exporters.
Following this introduction, this paper is structured as follows. In
Section 2, a review of the energy security literature is presented, with particular emphasis on the applicability of evaluation indicators proposed by various authors for energy resource exporters. This is followed by a brief review of some of the literature to capture the key principles of the “resource curse” or “paradox of plenty” to inform this discussion. In
Section 3, the methodology for this research is set out as a systems approach to domestic and export demand linkages on energy production activities, which is then applied, and two exporter energy security blind spots are established. In
Section 4, we examine the first blind spot, actual primary energy self-sufficiency for exporters, for which we propose a new calculation method to reflect exporter conditions, and then we examine the case studies of Australia, Mexico, and Nigeria, comparing primary energy self-sufficiency calculated using the typical method and the new method. In
Section 5 we examine the second blind spot, linkage of the domestic energy system to export markets, and analyze a case study of the commencement of LNG export operations in Queensland and the resultant international linkage of domestic gas and electricity systems. A new indicator is developed to quantify the extent of international exposure of exporters’ domestic energy systems, and the case of Australia before and after the start of LNG exports from Queensland is evaluated. Conclusions are presented in
Section 6.
2. Literature Review
A wide-ranging review of the literature on the topic of energy security [
5,
6,
9,
10,
11,
12,
13,
14,
15,
16,
17,
18,
19,
20,
21,
22,
23,
24,
25,
26,
27,
28,
29] reveals a considerable range of factors and indicators to quantify various dimensions of energy security. In particular, Sovacool and Mukherjee [
13] provide a comprehensive analysis of various methods of energy security analysis and logically organise the myriad specific indicators into five broad dimensions (availability, affordability, technology development, sustainability, and regulation). Additionally, Kruyt et al. [
23] provide a valuable overview of detailed factors for security of energy supply along with a discussion of the strengths and weaknesses of each. Also, Kanchana et al. [
30], for example, set out a matrix of energy dependency index factors and also develop the idea of domestic energy security and energy resource export vulnerability as related issues. These together could be broadly considered as the prevailing energy security framework.
We have combined the factors proposed by Kruyt [
23] and Kanchana [
30] into
Table 1, which are used as a representative set here. We have also added comments on the applicability of each factor in the right hand column.
Broadly speaking, most of these dimensions and factors are found to be applicable to the domestic energy security situation of net energy exporters; however, some are only applicable for import-dependent countries, while a few identified here require deeper consideration of the unique conditions of an energy exporter. Through this review, we have established that there has been limited attention in the literature to energy security issues unique to energy resource exporting countries [
7,
8].
In developing a wider understanding of the domestic implications of energy resource exports, the so called “resource curse” or “paradox of plenty” [
31,
32,
33,
34] is relevant and should be considered. At a high level, the basic premise of the resource curse is that without careful governance and financial management, countries experiencing a significant increase in GDP due to natural resource exports have frequently experienced considerable wider negative economic outcomes. These may include or be related to the increase in exports distorting the foreign currency exchange rate and making local manufacturing suddenly less internationally competitive as an export, and also making imported goods cheaper, thus undermining local employment and manufacturing capacity. Additionally, the capital-intensive nature of natural resource extractive industries tends to suppress economic growth compared to labor-intensive industries that drive employment and skill development. Furthermore, failures in governance related to tax and royalty policies are unfortunately common, with the result being that the exporting country may not receive adequate government revenue to balance the effects on foreign currency and unemployment.
Although there has been considerable depth of analysis of the resource curse, studies typically focus on the broader economic impacts, while there is a definite gap in analysis due to the export of energy resources and impacts on the domestic energy system, which in turn will have their own energy security-related economic risks. Ultimately, if a nation is producing fossils but their own energy security does not improve as a result, this situation is a distributional injustice [
35].
3. Methodology
We have applied a systems approach to establish potential blind spots when the prevailing importer-oriented energy security framework approach is applied to energy exporters. The various combinations of energy system configuration, including the roles of imports and exports, are set out diagrammatically as follows, with discussion of the suitability of the prevailing energy security framework approach as established through the literature review in
Section 1 of this paper.
Table 2 summarises the cases presented. Due to the complexity of cases and potential number of combinations, oil system cases have been separated out and are shown below.
Case 1, shown in
Figure 1, represents the energy system of a completely import-dependent country, with its only domestic energy supply from renewables and nuclear (if present). This case fits the import-dependent country profile of the prevailing energy security framework approach.
Case 2, shown in
Figure 2, represents the energy system of a country with some of its own domestic energy resource production, but that still requires imports due to geographical separation within the country or growth in consumption with fixed or falling local production from declining resource stocks. This case also fits the import-dependent country profile of the prevailing energy security framework approach, as per the introduction to this paper.
Case 3, shown in
Figure 3, represents the energy system of a self-sufficient country that neither requires any imports nor has any exports. In the modern interconnected global energy trading economy, this is an unusual case, perhaps more likely to be found in the early part of the 20th century. With no exports, this case fits the profile of the prevailing energy security framework approach, as per the introduction to this paper.
Case 4, shown in
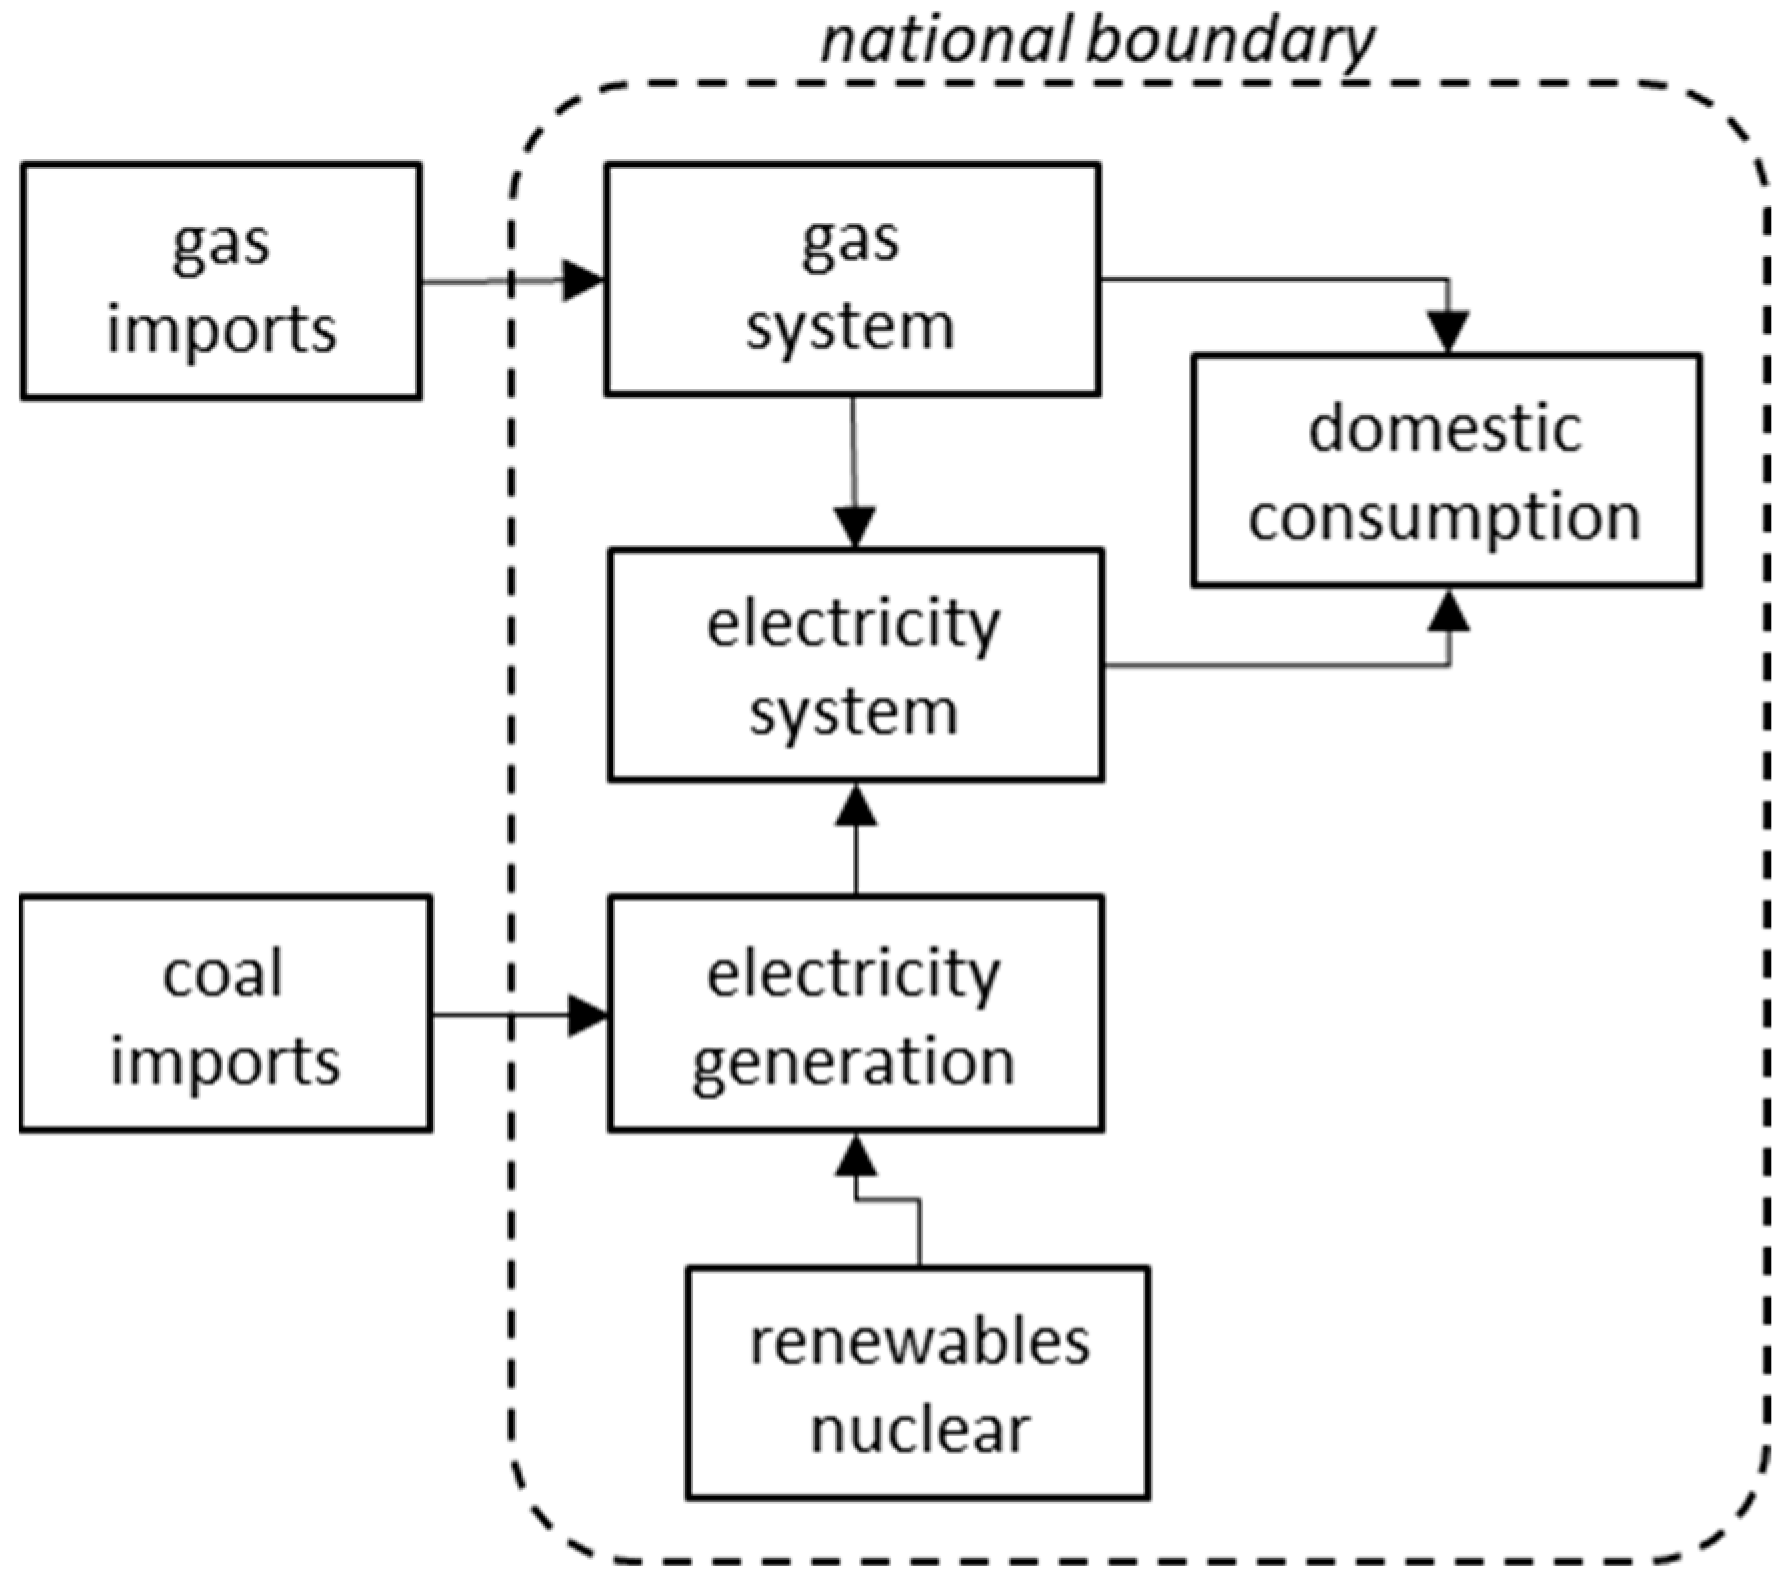
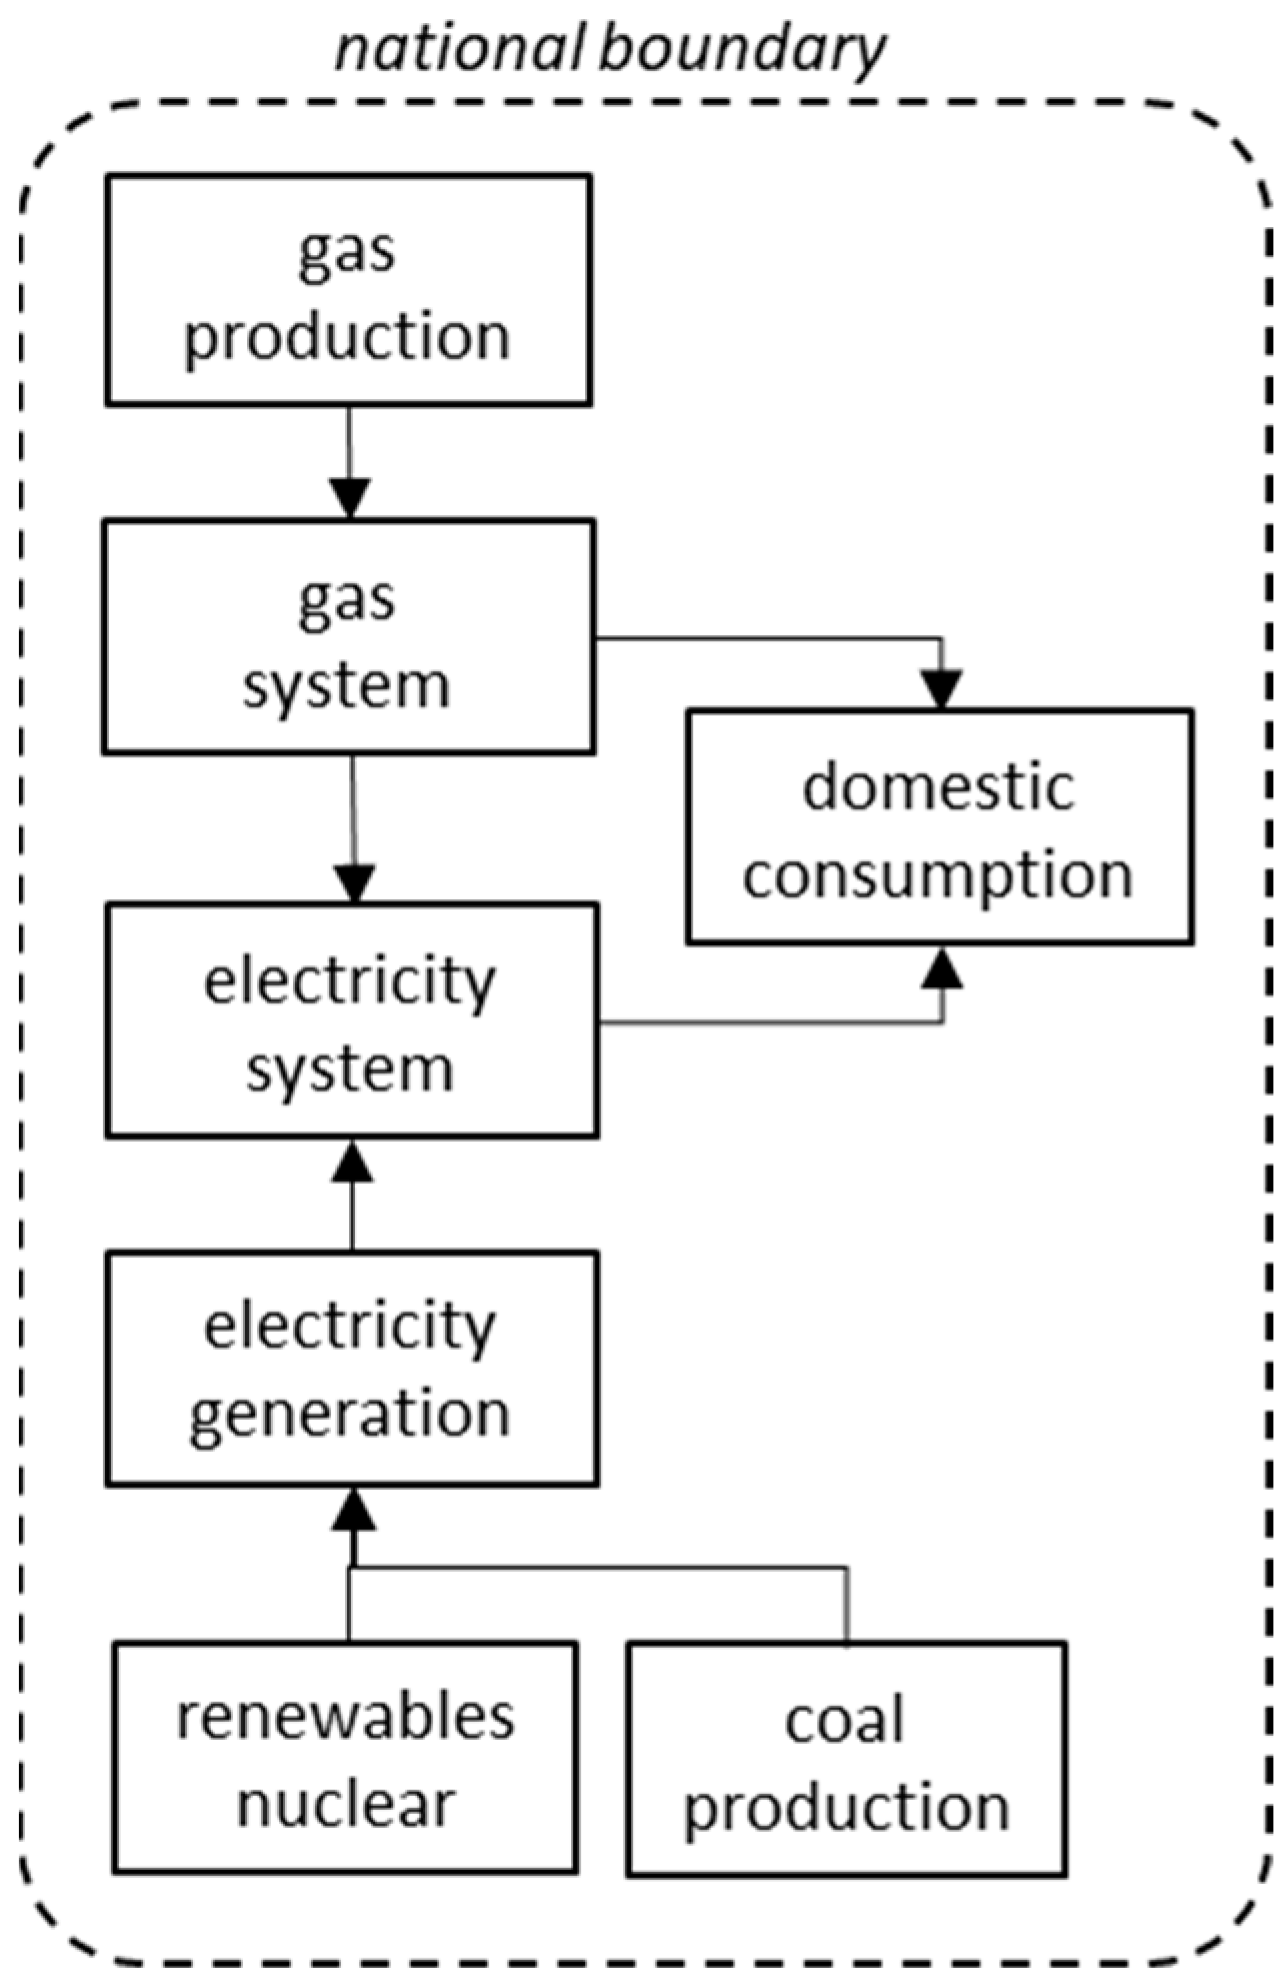
Figure 4, represents the energy system of a country that is self-sufficient in its own primary energy needs and also exports energy resources, but production for export is not physically linked to the domestic energy system, or domestic gas customers are protected by regulatory mechanisms. The prevailing energy security framework approach is well suited to this case, as it applies to the domestic energy system, and exports are treated as any other type of natural resource export.
Case 5, shown in
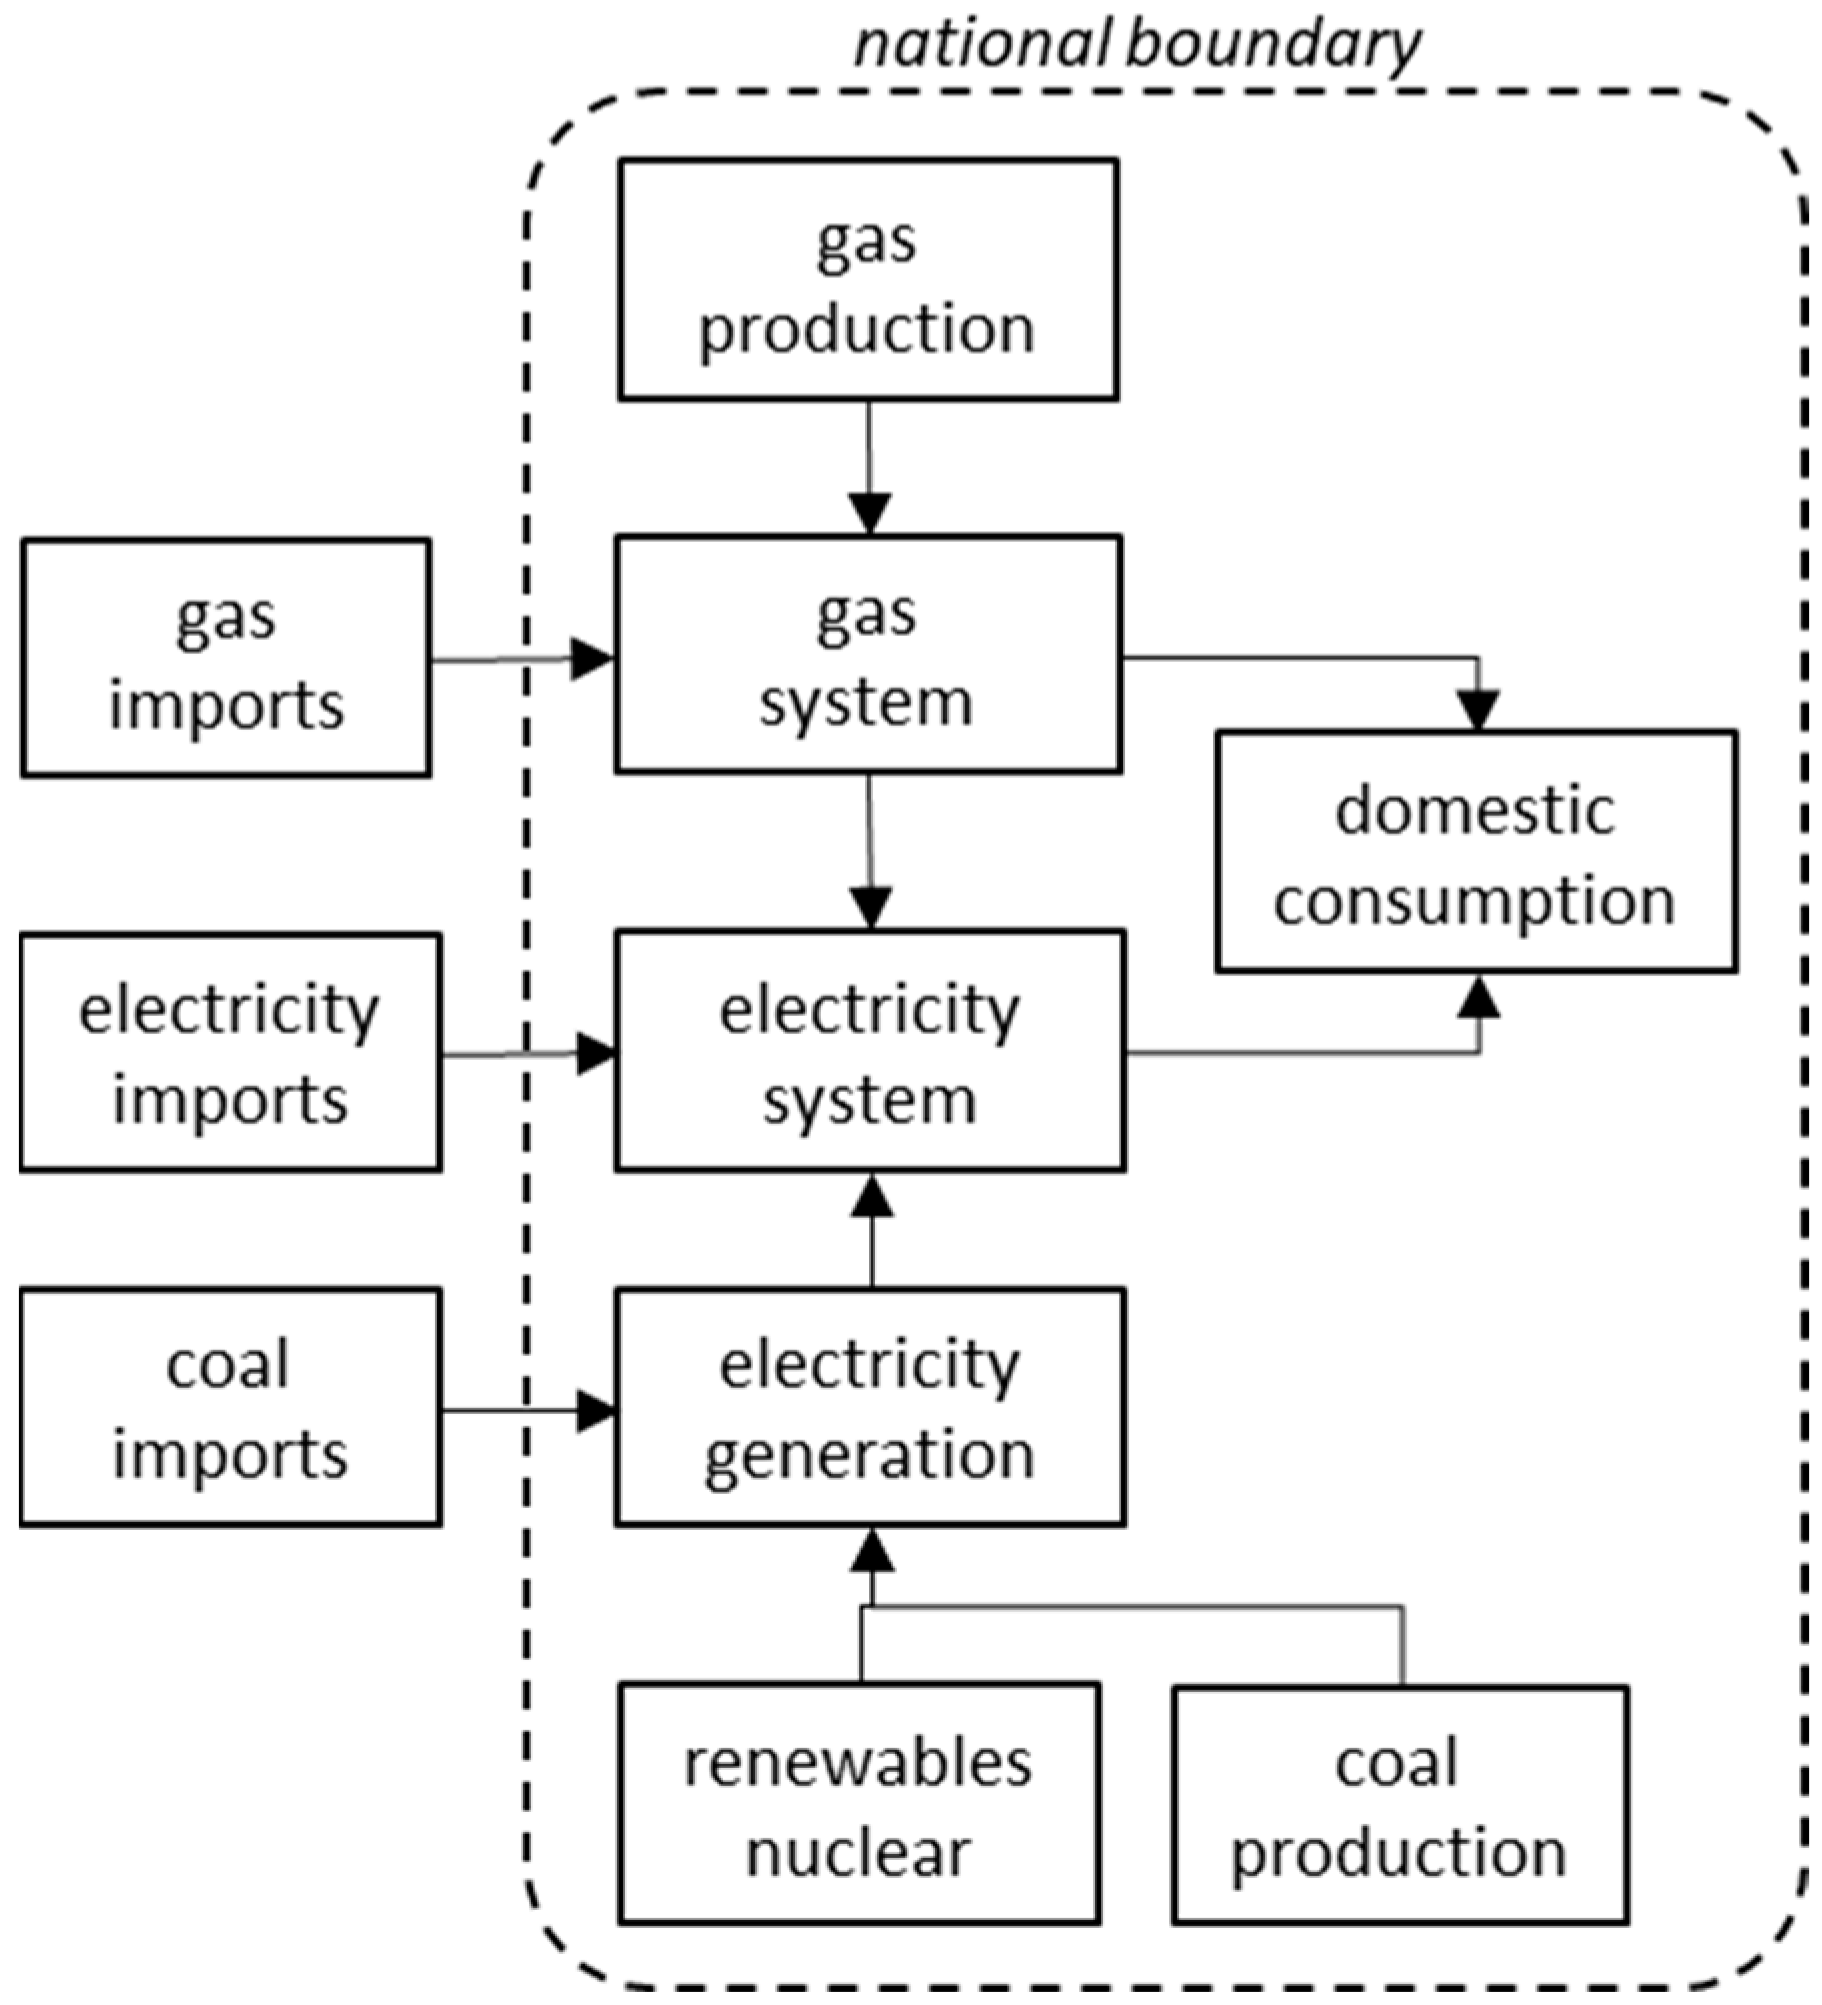
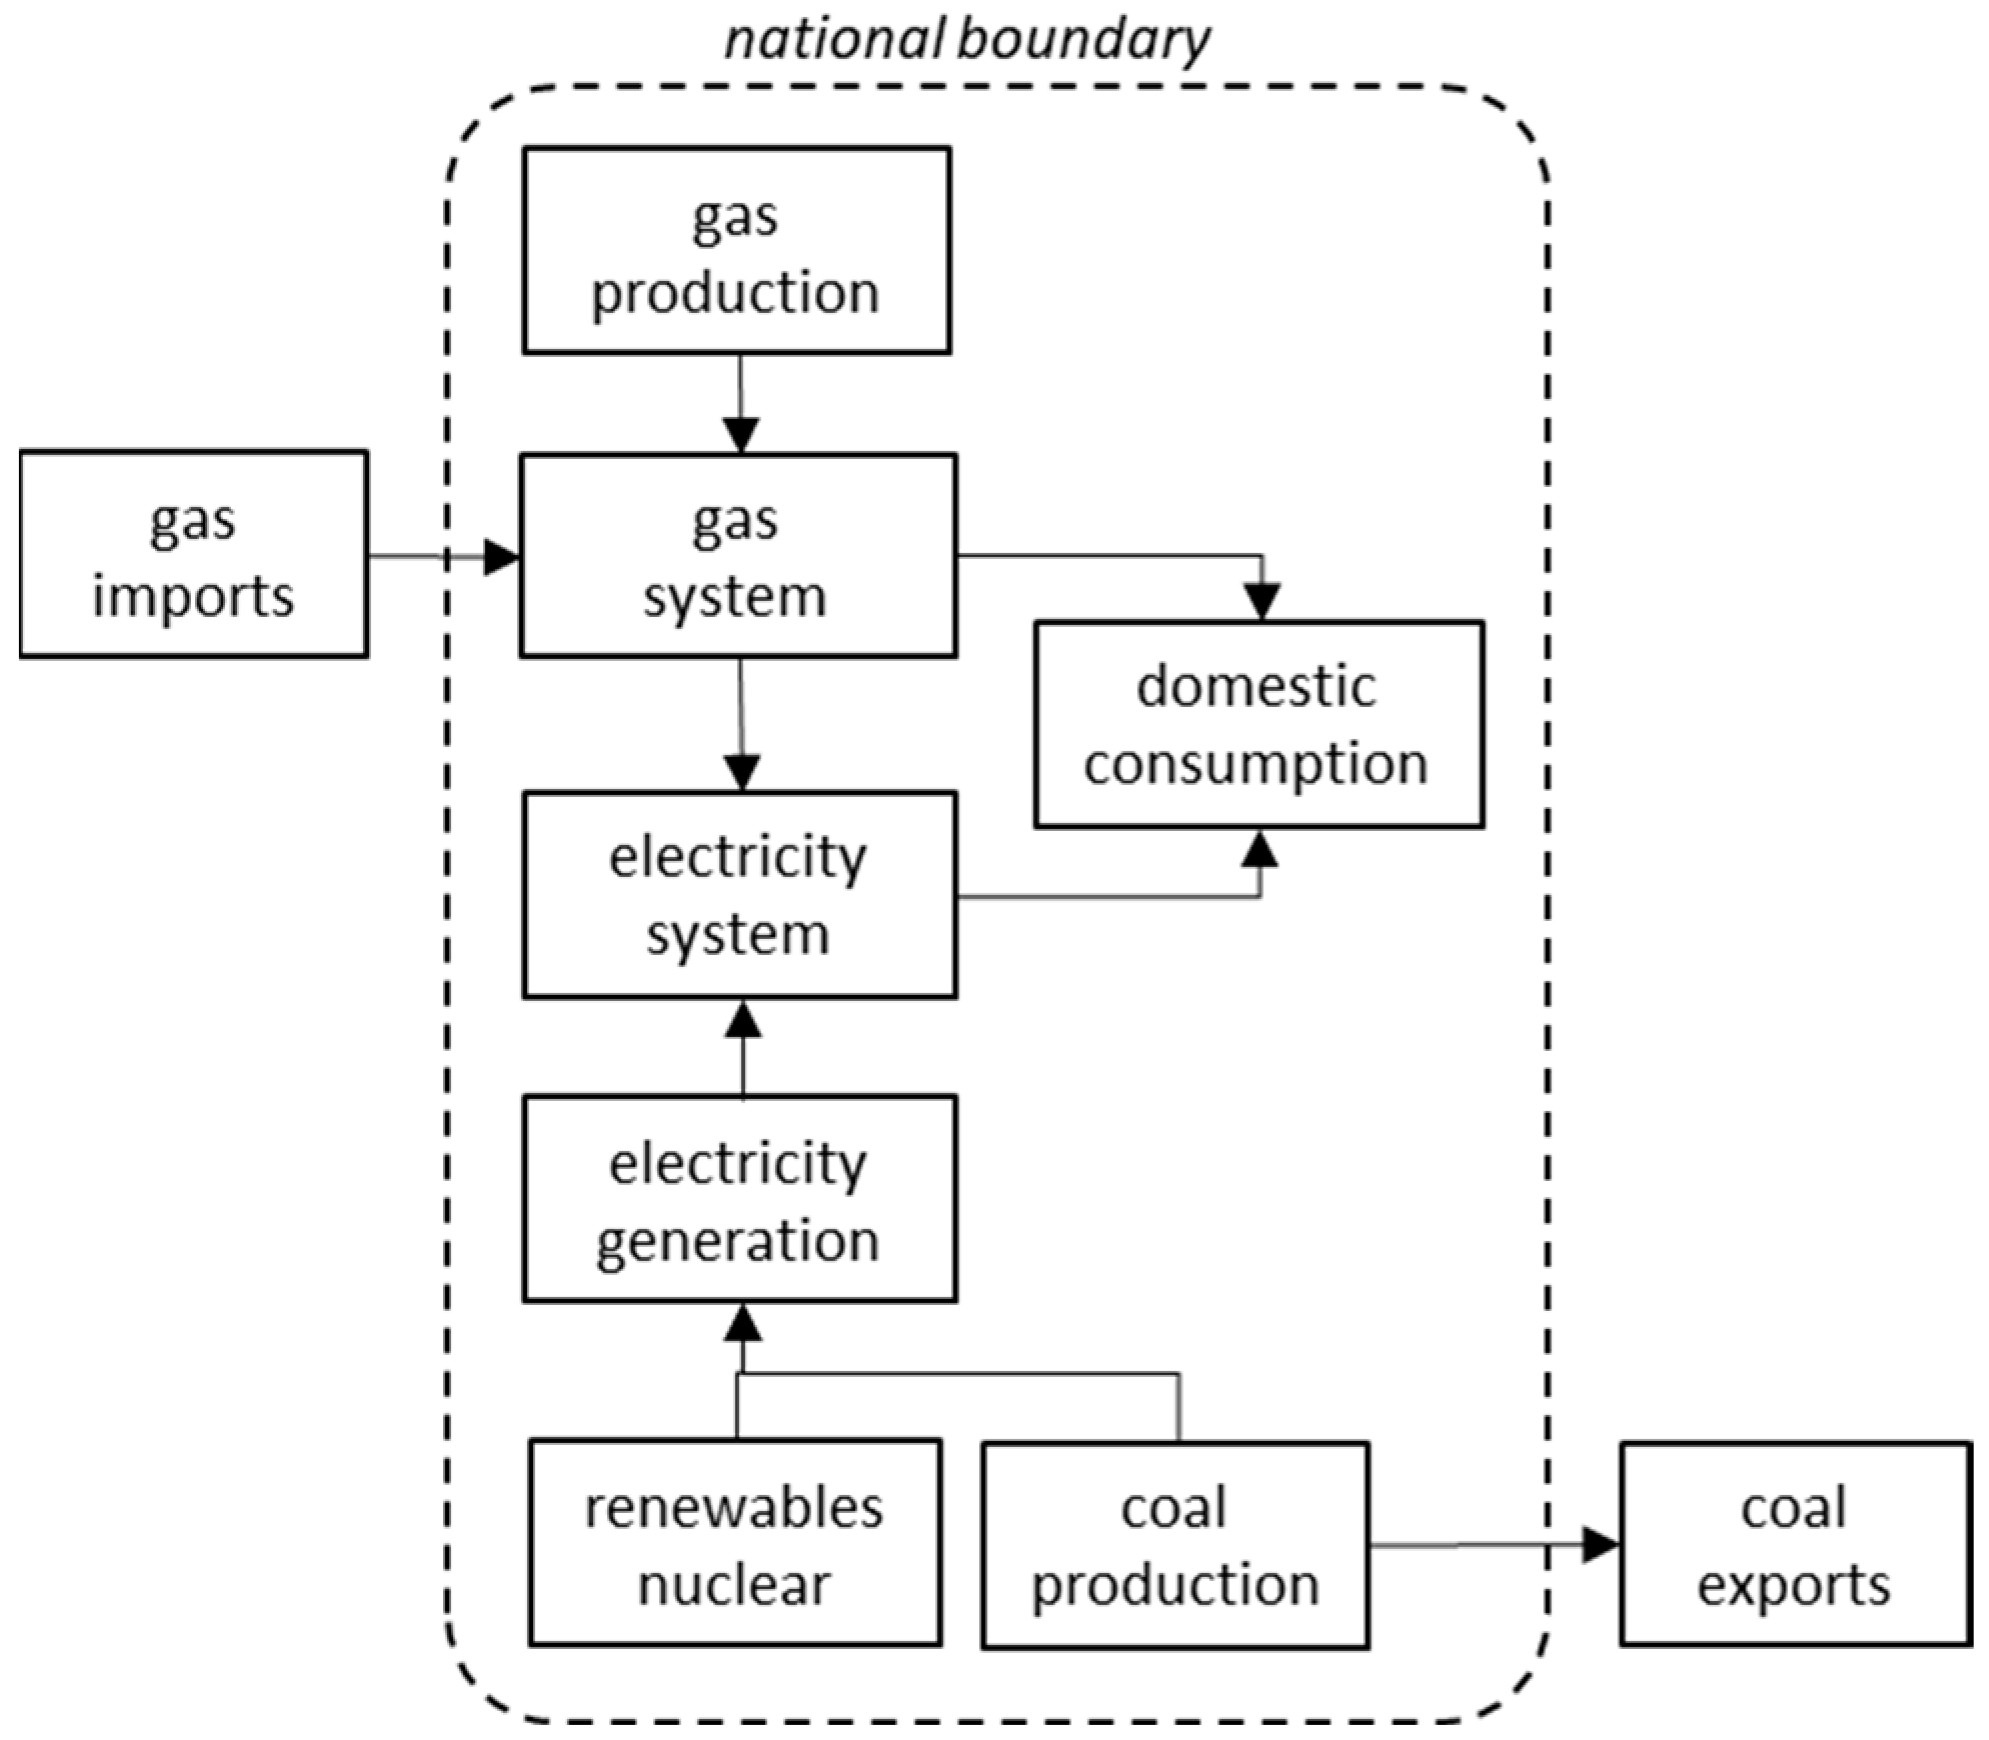
Figure 5, represents an energy system with two complicating features. First, the country imports some of one fuel to supplement domestic shortfall while exporting another fuel of which it has excess production to domestic needs. Second, production for export and for domestic use of the same fuel are physically linked (or have the potential to be linked, thus forming a single energy supply market). The prevailing energy security framework approach breaks down in this case for the following reasons. First, the typical energy security measure of total net primary energy self-sufficiency (the ratio of production to consumption) does not capture the net shortfall in one fuel that cannot necessarily be cross-substituted by another fuel with excess, and also does not recognize export commitments, without which the excess production capacity would potentially not have been developed. Second, the fuel that is both used domestically and exported is subject to a bidirectional demand, which has not been seen in any of the other preceding cases. The exposure of domestic energy supply to export market influence, possibly as a transition case from an earlier state of zero exports, is not considered.
As noted above, oil system cases have been treated separately due to the complexity of representing the various combination cases.
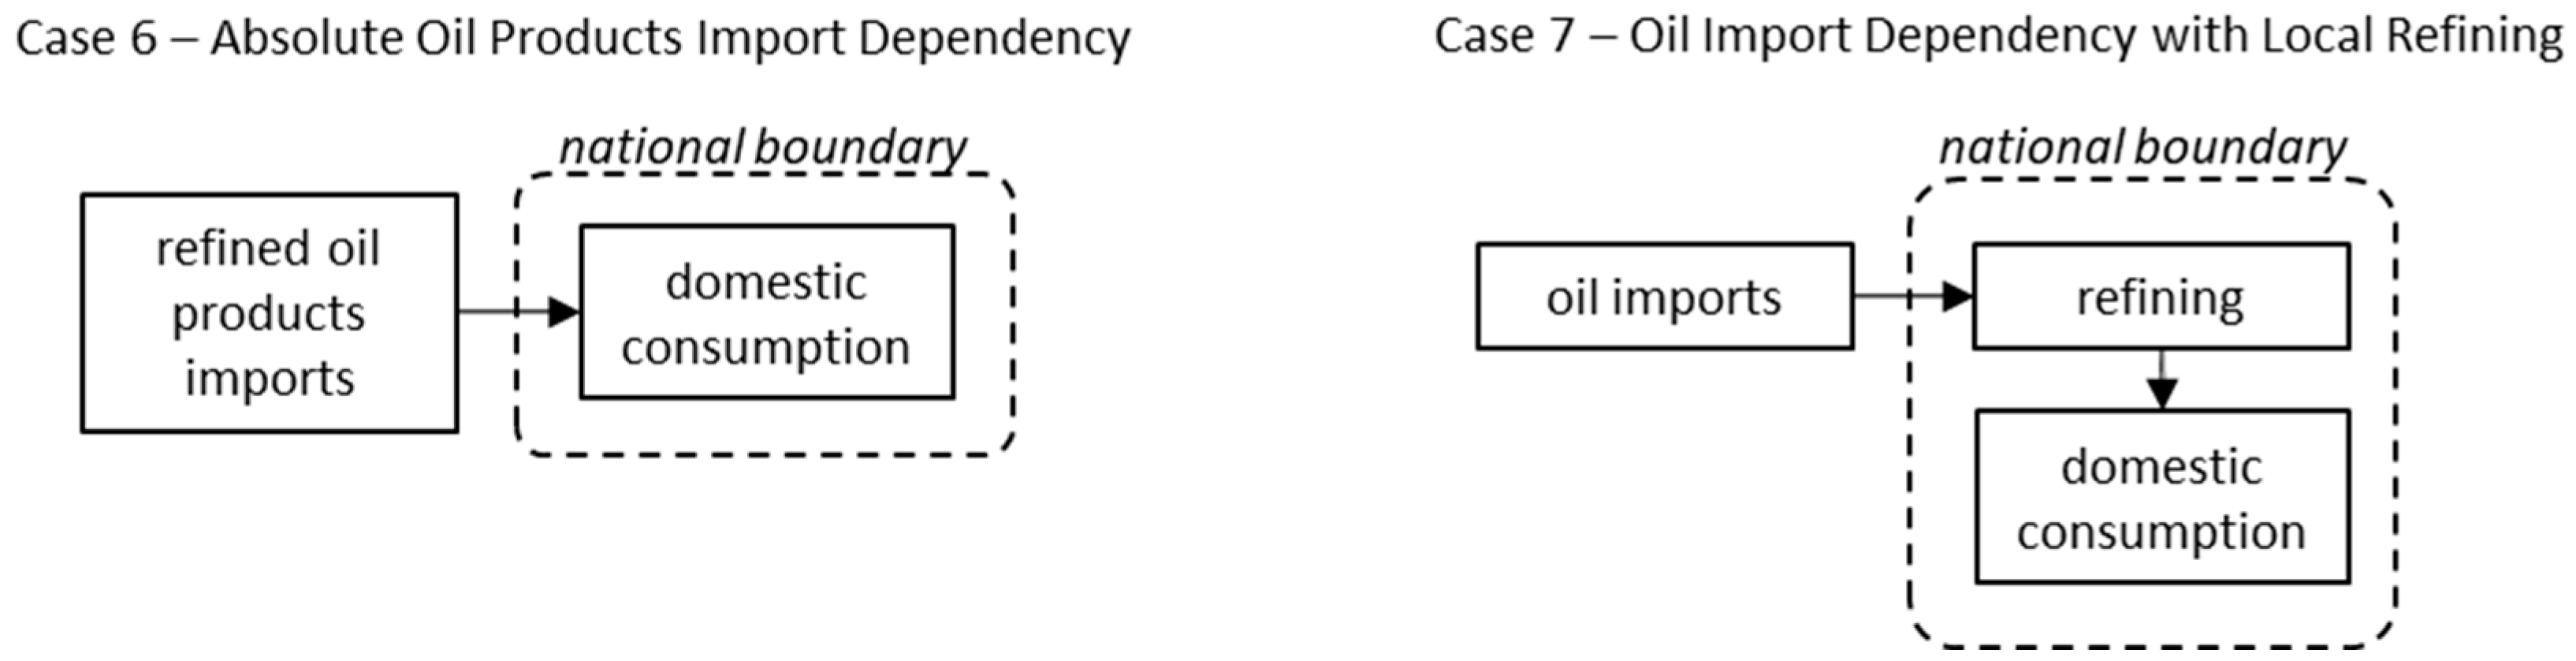
Figure 6 shows the cases of oil import dependence, with complete reliance on imports for the supply of refined oil products in Case 6. Case 7 is a development on Case 6, where a country is able to invest in refining capacity and take some control over supply of refined oil products (and benefit from the added value), while still remaining fully dependent on imports of crude oil. These cases fit the import-dependent country profile of the prevailing energy security framework approach, as per the introduction to this paper.
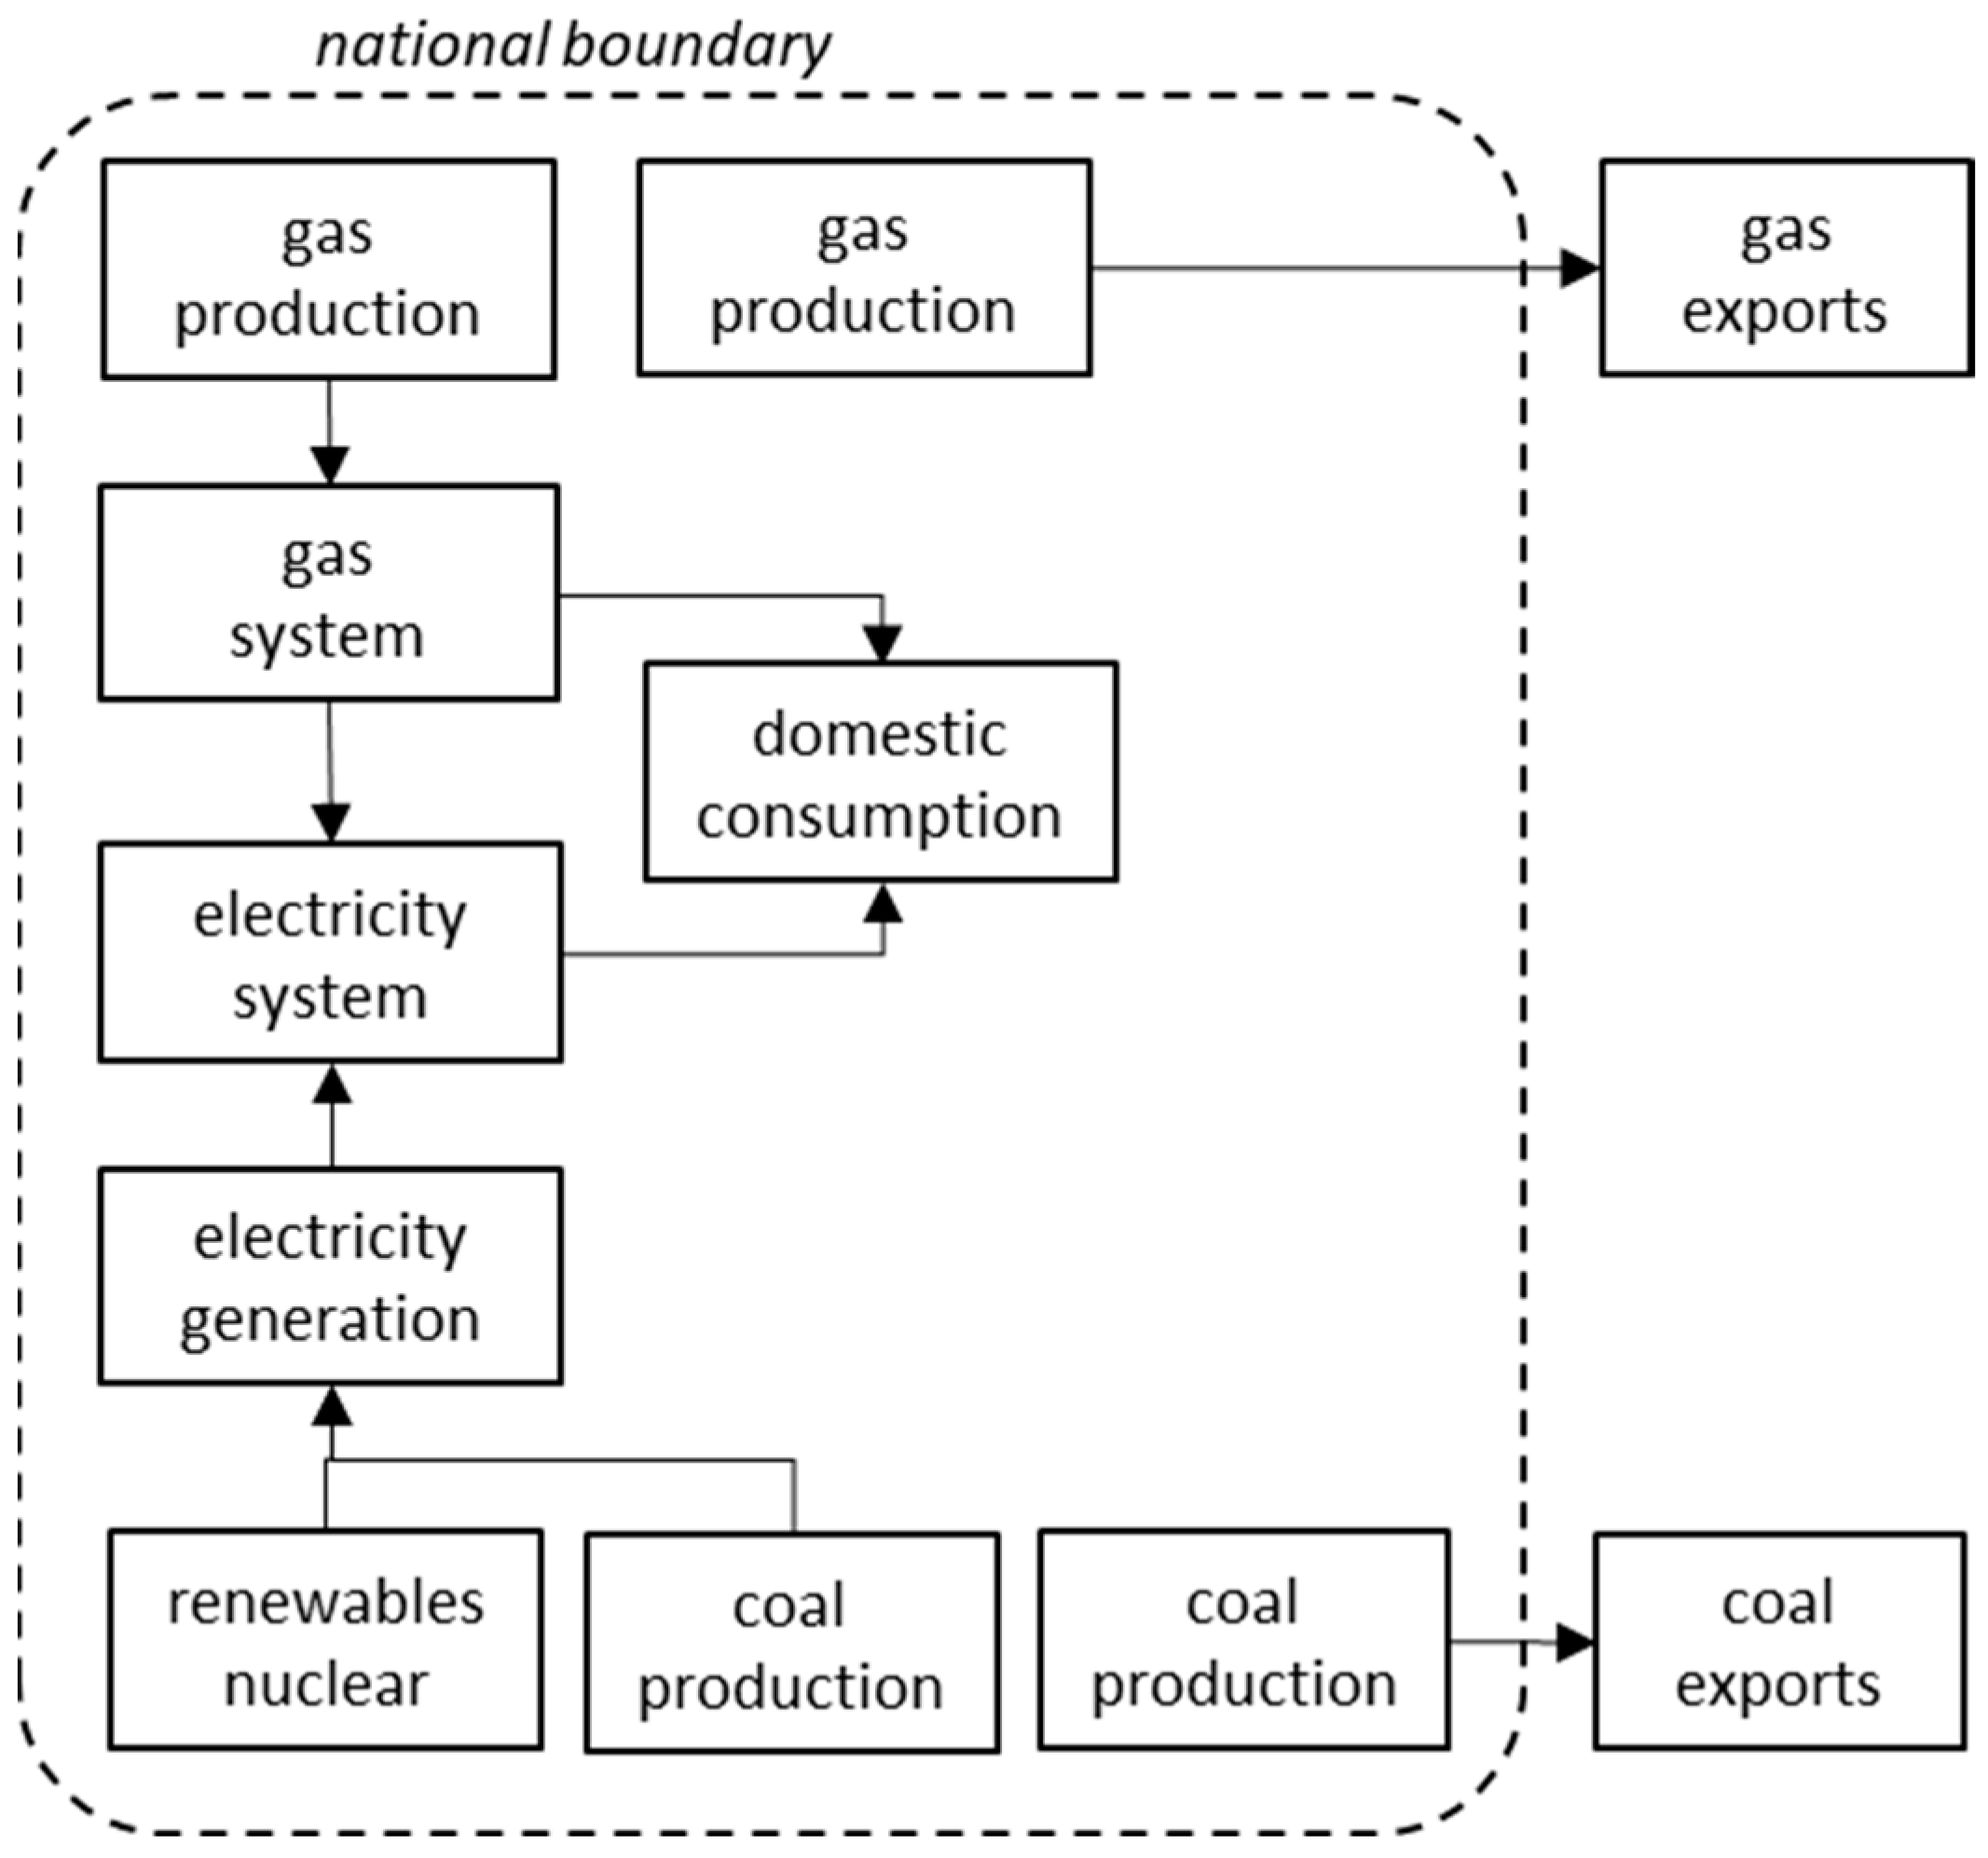
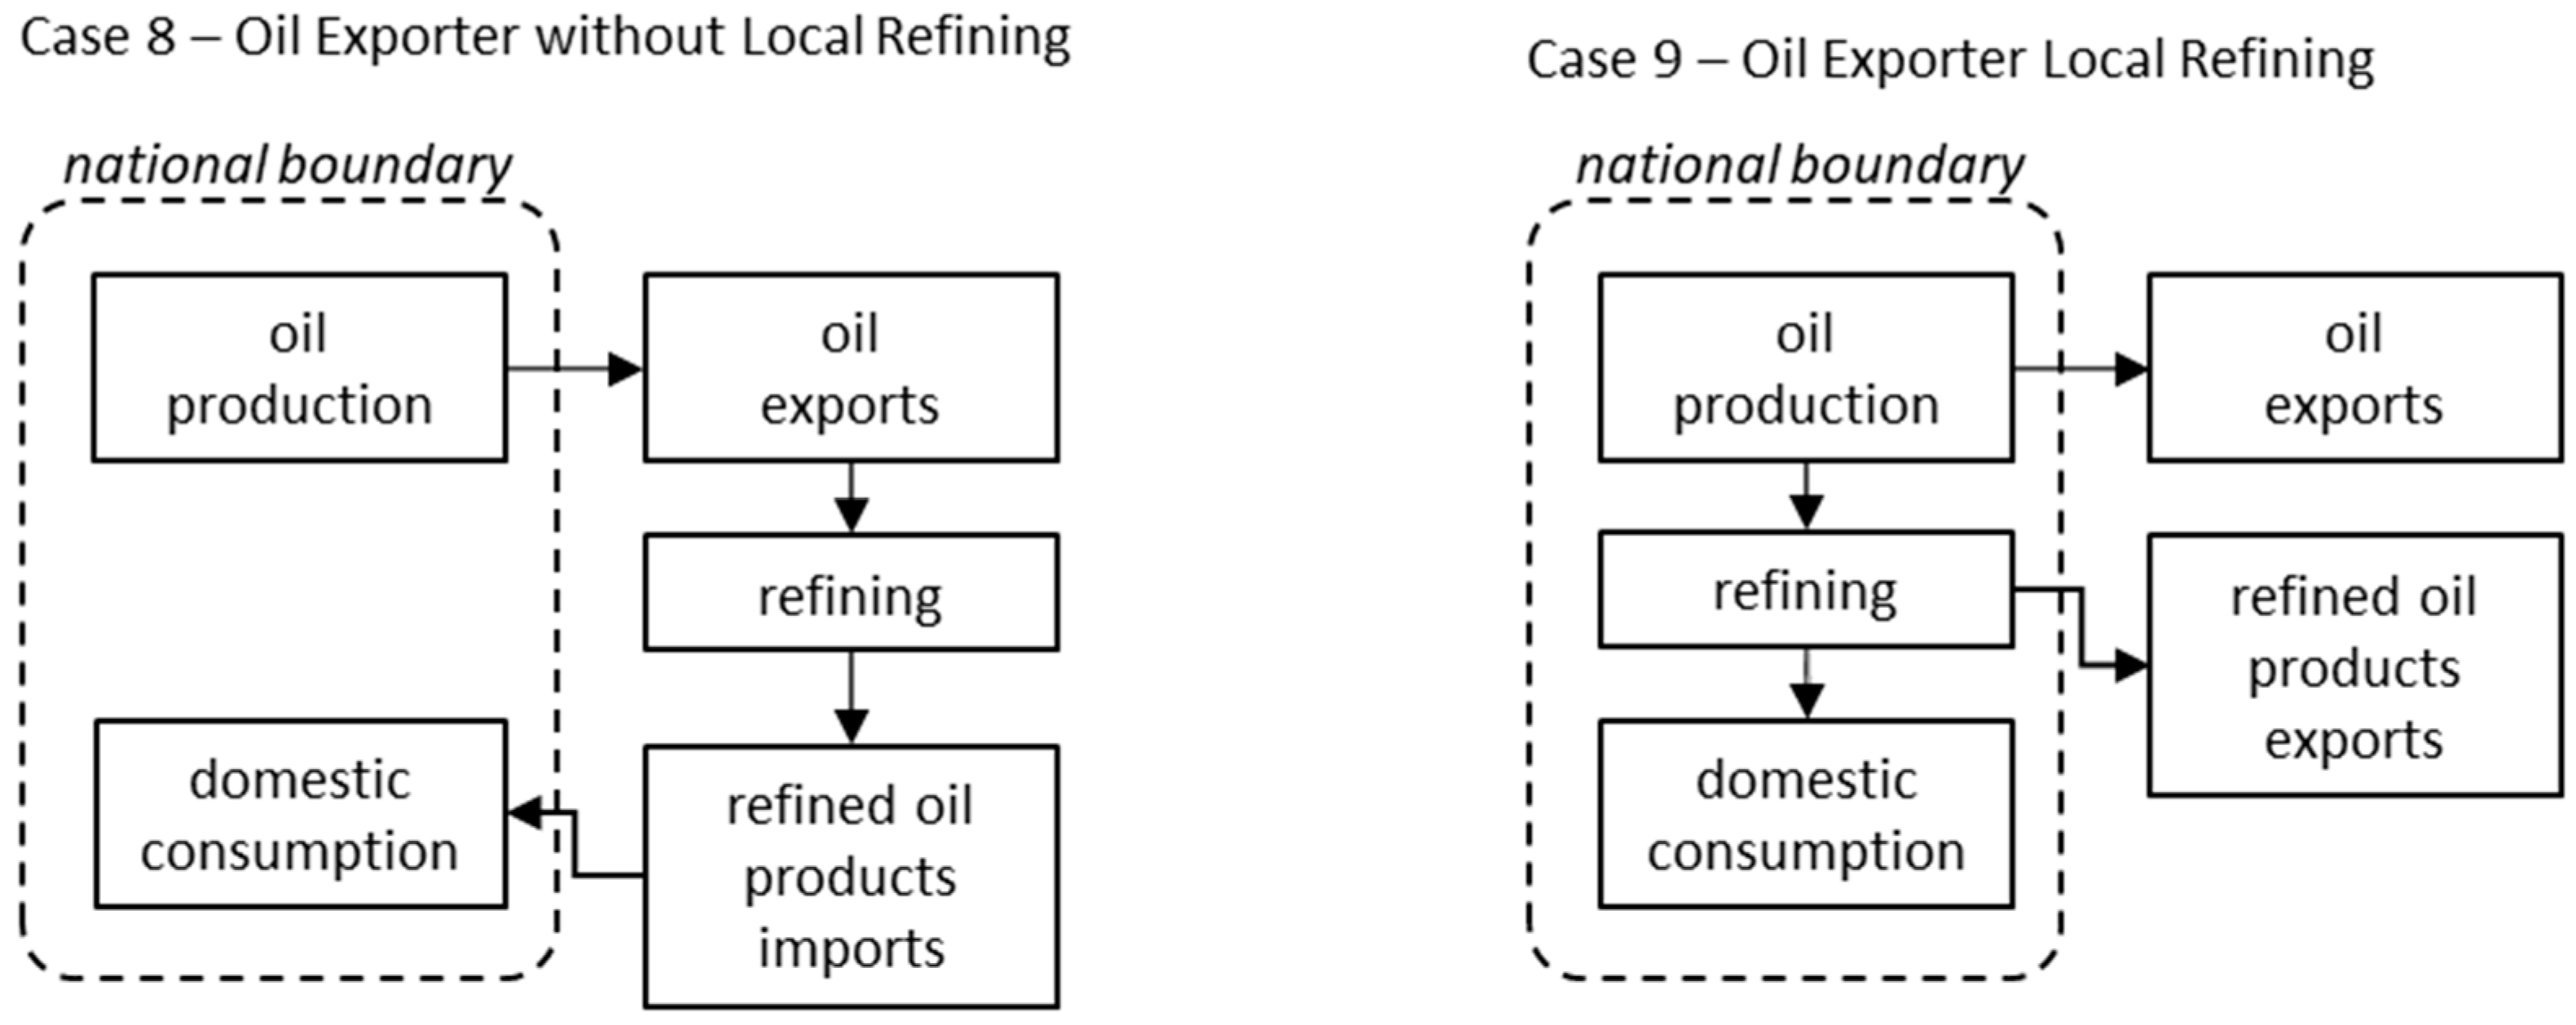
Figure 7 shows the cases of oil production and export. Case 8 represents a country with domestic oil production but that lacks the investment in domestic refining capacity and is, therefore, dependent on external refining of its own oil to supply domestic requirements for refined oil products. The prevailing energy security framework approach breaks down in this case, for a similar reason as given first in Case 5, where the typical energy security measure of total net primary energy self-sufficiency (the ratio of production to consumption) does not capture the absence of refining capacity and subsequent absolute reliance on imports of refined oil products despite the domestic origin of the crude oil.
Case 9 represents a development on Case 8, where a country is able to invest in refining capacity and take control over the supply of refined oil products for domestic needs from its own oil production, as well as exporting both crude oil and refined oil products. The prevailing energy security framework approach breaks down in this case, for a similar reason to that given in Case 5, above, where both the crude oil and refined oil products are subject to a bidirectional demand while being used domestically and exported.
Through the application of this systems approach to the various potential configurations of energy systems, we have established some conditions under which the prevailing energy security framework approach is not effective, summarized as follows:
The total net primary energy self-sufficiency (the ratio of total domestic energy production to total energy supply) which is one of the most common energy security indicators, does not recognize the potential net shortfall in one fuel that can not necessarily be cross-substituted by another fuel with excess. It also does not recognize export commitments without which the excess production capacity would potentially not have been developed, which mean the excess is likely not available for domestic use. It also does not recognize that in the case of oil, both crude oil production and refining capacity need to be considered.
The situation where an energy resource that is both used domestically and exported is subject to a bidirectional demand, and, hence, the domestic energy supply system becomes exposed to export market influence, but this is not recognised in the prevailing energy security framework approach. That such a situation may arise as a transition case from an earlier state of zero exports introduces further unaddressed energy security risks for the domestic energy system.
These two critical blind spots in the domestic energy security of energy exporting countries are addressed in
Section 4 and
Section 5.
4. Blind Spot #1: Actual Primary Energy Self-Sufficiency
Primary energy self-sufficiency, or its inverse, import dependence rate, is considered among one the main measures of energy supply security for countries that depend on energy imports [
5,
11,
13,
23,
27,
28,
29]. The basic definition of this measure is shown in Equation (1).
Equation (1): the basic definition of primary energy self-sufficiency.
where:
PESS = primary energy self-sufficiency;
TDEP = total domestic (and quasi-domestic) energy production;
TPES = total primary energy supply.
This measure is of particular interest to countries heavily dependent on energy resource imports, such as Japan.
For example, in 2019, Japan’s total primary energy supply (production and imports) was 18.6 TJ, of which 16.5 TJ was in imported fuels. The balance of 2.1 TJ was provided from domestic sources (including nuclear). Japan’s primary energy self-sufficiency rate was, thus, 2.1/18.6 = 11.3% [
36].
This measure is clearly a useful means of quantifying primary energy self-sufficiency, or a lack of it. From an energy security policy perspective, the implicit assumption is that countries with a net energy production surplus, hence, those that are net energy exporters, are in a better position with regards to their own domestic energy security. For example, Australia’s primary energy self-sufficiency rate in 2019 was calculated using the same computational method, as follows [
37]:
TDES = 18.7 TJ, TPES = 6.0 TJ
PESS = 18.7/6.0 = 309.1%
Energy import-dependent countries may look at Australia’s PESS with envy; however, it should not be surprising that energy security for major energy resource exporters is somewhat more complex than it may seem.
Here, we will explore some situations where the actual conditions for net energy exporters are considerably less secure than the basic PESS measure might indicate.
4.1. Decomposition of Net Energy Surplus
In order to assess the usefulness of primary energy self-sufficiency as an indicator of energy security for a net energy exporting country, a decomposition analysis of total primary energy into constituent energy types is required.
When a decomposition is applied to Australia’s headline PESS in 2019 of 309.1%, it becomes apparent that significant net exports in gas and coal are overshadowing import dependence on refined oil products, as shown in
Table 3 below [
37].
Exports of coal and gas dominate shares of production over domestic consumption (some of the consequences of which we will address later). However, Australia produces only 32.1% of its domestic oil needs, 80.2% of which is used for transport fuels. Australia’s energy security position is, therefore, much less secure when it comes to transport fuels.
Australia’s massive production surplus in coal and gas, developed for export purposes, also requires examination from a broader energy security perspective. Production capacity of energy resources above 100% of domestic needs has been developed and financed for export customers (often under strict and exclusive contracts) and, as such, may not always be considered of benefit to domestic energy security. There are also further negative implications to domestic energy security from the linking of domestic and export-oriented production of energy resources, which we will explore later in this paper. Accordingly, when calculating PESS, the rate of total domestic energy supply per energy type should be capped at 100%, and ideally should only reflect the production capacity that can practically and contractually be utilized domestically.
4.2. Oil Exporters Lacking Refining Capacity
Even for oil exporting nations, energy security for domestic transport fuel needs is not always assured, since adequate domestic oil refining capacity is required to match domestic demand for refined fuels with domestic oil production. Where this is not true, the crude oil must be exported for refining elsewhere, then ultimately re-imported at higher cost to provide for domestic demand.
For example, in the national energy balance, Mexico achieves a PESS rate of 79.0%. Regarding its net oil supply/demand balance, Mexico produces oil that would account for 114% of its domestic petroleum needs, and, hence, has some excess to export.
Mexico’s net oil supply/demand balance in 2019 is set out in
Table 4, as follows [
38].
However, on closer examination, Mexico’s oil refineries only produced 38% of the domestic refined oil products demand in 2019. Therefore, although it is a net oil exporter, Mexico is dependent on imports for 62% of its refined oil products demand, due to a limitation in refining capacity.
Mexico’s 62% dependence on imported refined oil products can then be analyzed using conventional energy security assessment tools, such as a supply source diversity index. This indicator, represented in the various energy security literature [
5,
23,
39], is typically based on the Herfindahl–Hirschman Index (HHI) method. In the case of Mexico’s fuel imports in 2019, the HHI score for supply source diversity is 0.77, indicating a high degree of supply source concentration. This is borne out by the raw data showing that 88% of Mexico’s fuel imports come from the United States [
40]. Notwithstanding the high degree of economic integration between the United States and Mexico [
41], the existence of frequent trade disputes between the two countries [
42] and even political promises from US elected officers to compel Mexico to pay billions of dollars for a border wall [
43] suggest that supplies of refined petroleum fuels imported into Mexico from the US may not be quite so secure as might be hoped. If the country had sufficient domestic refining capacity to meet domestic needs, the energy security would be higher, and any surplus could provide extra GDP through value added to petroleum production and export of the refined product rather than exporting only unrefined crude oil.
The situation is even worse for major oil producer Nigeria [
44]. With an oil production of 4295 PJ in 2019, and a domestic demand of 978 PJ for refined petroleum products (88% for transport fuel), the country’s net oil self-sufficiency appears to be a very healthy 439% (producing over four times the domestic demand). However, Nigeria’s troubled refineries only produced 22 PJ in 2019 (2% of demand) and were completely out of operation in 2020. Nigeria is, therefore, completely dependent on imports for petroleum transport fuels.
This was not always the case for Nigeria, which was previously self-sufficient in the refining of oil products, with refining production peaking in 1991 at 611 PJ. However, since that time, domestic refining capacity has declined due to under-investment in aging refineries to only 79 PJ by 2015, and to 0 PJ in 2020 [
44].
In Nigeria’s case, notwithstanding a complete reliance on imported refined petroleum products, application of the supply source diversity indicator [
23] based on the HHI method yields a result of 0.19, representing a reasonable level of supply source diversity. The raw trade data [
45] show that Nigeria’s sources of refined fuels are the Netherlands (36%) and Belgium (23%), followed by 11 countries each supplying between 5% and 1%.
Despite the diversity of supply sources from an energy security perspective, lack of maintenance on existing refineries combined with an absence of investment in new refining capacity to keep up with demand growth has meant that in addition to having no domestic security of supply of refined petroleum fuels, Nigeria pays NGN 26 (USD 0.06 as of 15/9/2022) per liter in freight [
46] alone simply to ship its own oil offshore for refining and return shipping of the refined fuels, increasing local petrol prices [
47] by 18%.
The lack of domestic refining capacity is not only a disaster for energy security, but also a clear economic loss. The situation appears hopeful, however, with plans to rehabilitate out-of-service government-owned refineries and private investment in new refining capacity underway [
46].
4.3. A New Method of Calculating Primary Energy Self-Sufficiency
The preceding examples of Australia, Mexico, and Nigeria prompt a reconsideration of the simplistic calculation of primary energy self-sufficiency rate that is common in energy security assessments, but which is primarily suitable for net energy importers. The traditional energy security measure of primary energy self-sufficiency can hide domestic energy security blind spots experienced by energy exporters, notably net exports of some energy resources obscuring import dependence on others and a lack of domestic processing capacity for local needs even while considerable resource production drives increases in net exports.
Decomposition into the main energy uses of transport, electricity generation, industry, and other is proposed as an initial means of matching actual demand types with supply. In this way, energy security can be expressed relative to sectoral demand, with correlation of the primary energy inputs to the specific sector.
A new indicator for exporter primary energy self-sufficiency (Ex.PESS) is proposed, which is designed to accommodate the particular circumstances of energy exporters. In order to capture energy supply to end use and avoid duplication of counting of fuels which can be either used directly or have conversion steps, such as refineries and power stations, prior to end use, the calculation of Ex.PESS is divided into the categories of electricity, oil and oil products, and gas, for which domestic supply self-sufficiency (DSS) is calculated separately, according to the rules set out below.
The new metric is defined in Equation (2).
Equation (2): export primary energy self-sufficiency.
where:
Ex.PESS = exporter primary energy self-sufficiency;
TES = total energy supply in each category;
DSS = domestic supply self-sufficiency, as defined below for each category;
TPES = total primary energy supply (sum of all TES categories: electricity, oil, and gas).
DSS for gas is calculated as the rate of domestic production to domestic demand.
DSS for oil and oil products takes the minimum value of domestic production capacity and domestic refining capacity, divided by domestic demand for petroleum products excluding electricity generation use. Biofuels that are combined into the refined petroleum products supply chain either as blended fuels or direct substitutes are also included in this category, although in most cases the effect is negligible. For clarity, the calculation method is set out in Equation (3).
Equation (3): domestic supply self-sufficiency for oil and oil products.
where:
DPO = domestic production output;
DRO = domestic refinery output;
DD = domestic demand for oil and oil products;
DSS for electricity generation is calculated as the rate of domestic supply in each source of electricity generation, proportionally weighted by the contribution of each electricity generation energy source to the total. Efforts to transition away from fossil fuels and reduce the greenhouse gas emissions intensity of the electricity system by increasing electricity generation from renewables, such as solar, wind and hydro, have the supplementary benefit of reducing reliance on imported fuels and increasing the DSS score for electricity, thus enhancing domestic energy security.
DSS for each energy category is capped at 100%, representing the maximum rate of production that can be applied for domestic use, as discussed above.
A comparison of the energy self-sufficiency rates calculated using the typical importer-perspective measure (PESS) and the newly defined indicator adapted for energy exporters (Ex.PESS) is shown below in
Table 5 [
37,
38,
44].
As with the traditional PESS method, a higher score for Ex.PESS represents a better energy security position, with the range of potential scores being from 0% (no domestic supply of primary energy) to 100% (full domestic supply of primary energy). From an energy security policy perspective, the difference is quite significant, and with this potential blind spot of energy exporter domestic energy security now clear, it is possible to develop policies and undertake appropriate actions.
5. Blind Spot #2: Linkage of the Domestic Energy System to Export Markets
In addition to technical limitations in supplying domestic final energy needs, the commercial pull of export revenue on a resource shared with domestic energy supply can also lead to some perverse energy security outcomes for net energy resource exporting countries.
5.1. Case Study—Commencement of Queensland LNG Exports
Queensland’s domestic gas supply was, for many decades, supplied from conventional sources; then, from the early 2000s, unconventional gas extraction technologies, such as hydraulic fracturing and directional drilling, enabled the development of tight gas deposits associated with coal seams that were previously not economically recoverable (due to depth, thickness, or size) [
48,
49]. Access to this new and abundant gas resource underpinned investment in three new LNG production and export facilities near the central Queensland port city of Gladstone, for which the development of additional unconventional gas production capacity was accelerated [
50]. Coal seam gas (CGS) production requires a relatively large number of small wells for extraction due to the tight coal seam formations within which it is interspersed, compared to the relatively fewer number of gas wells for an equivalent production capacity of conventional gas from a large contiguous gas reservoir [
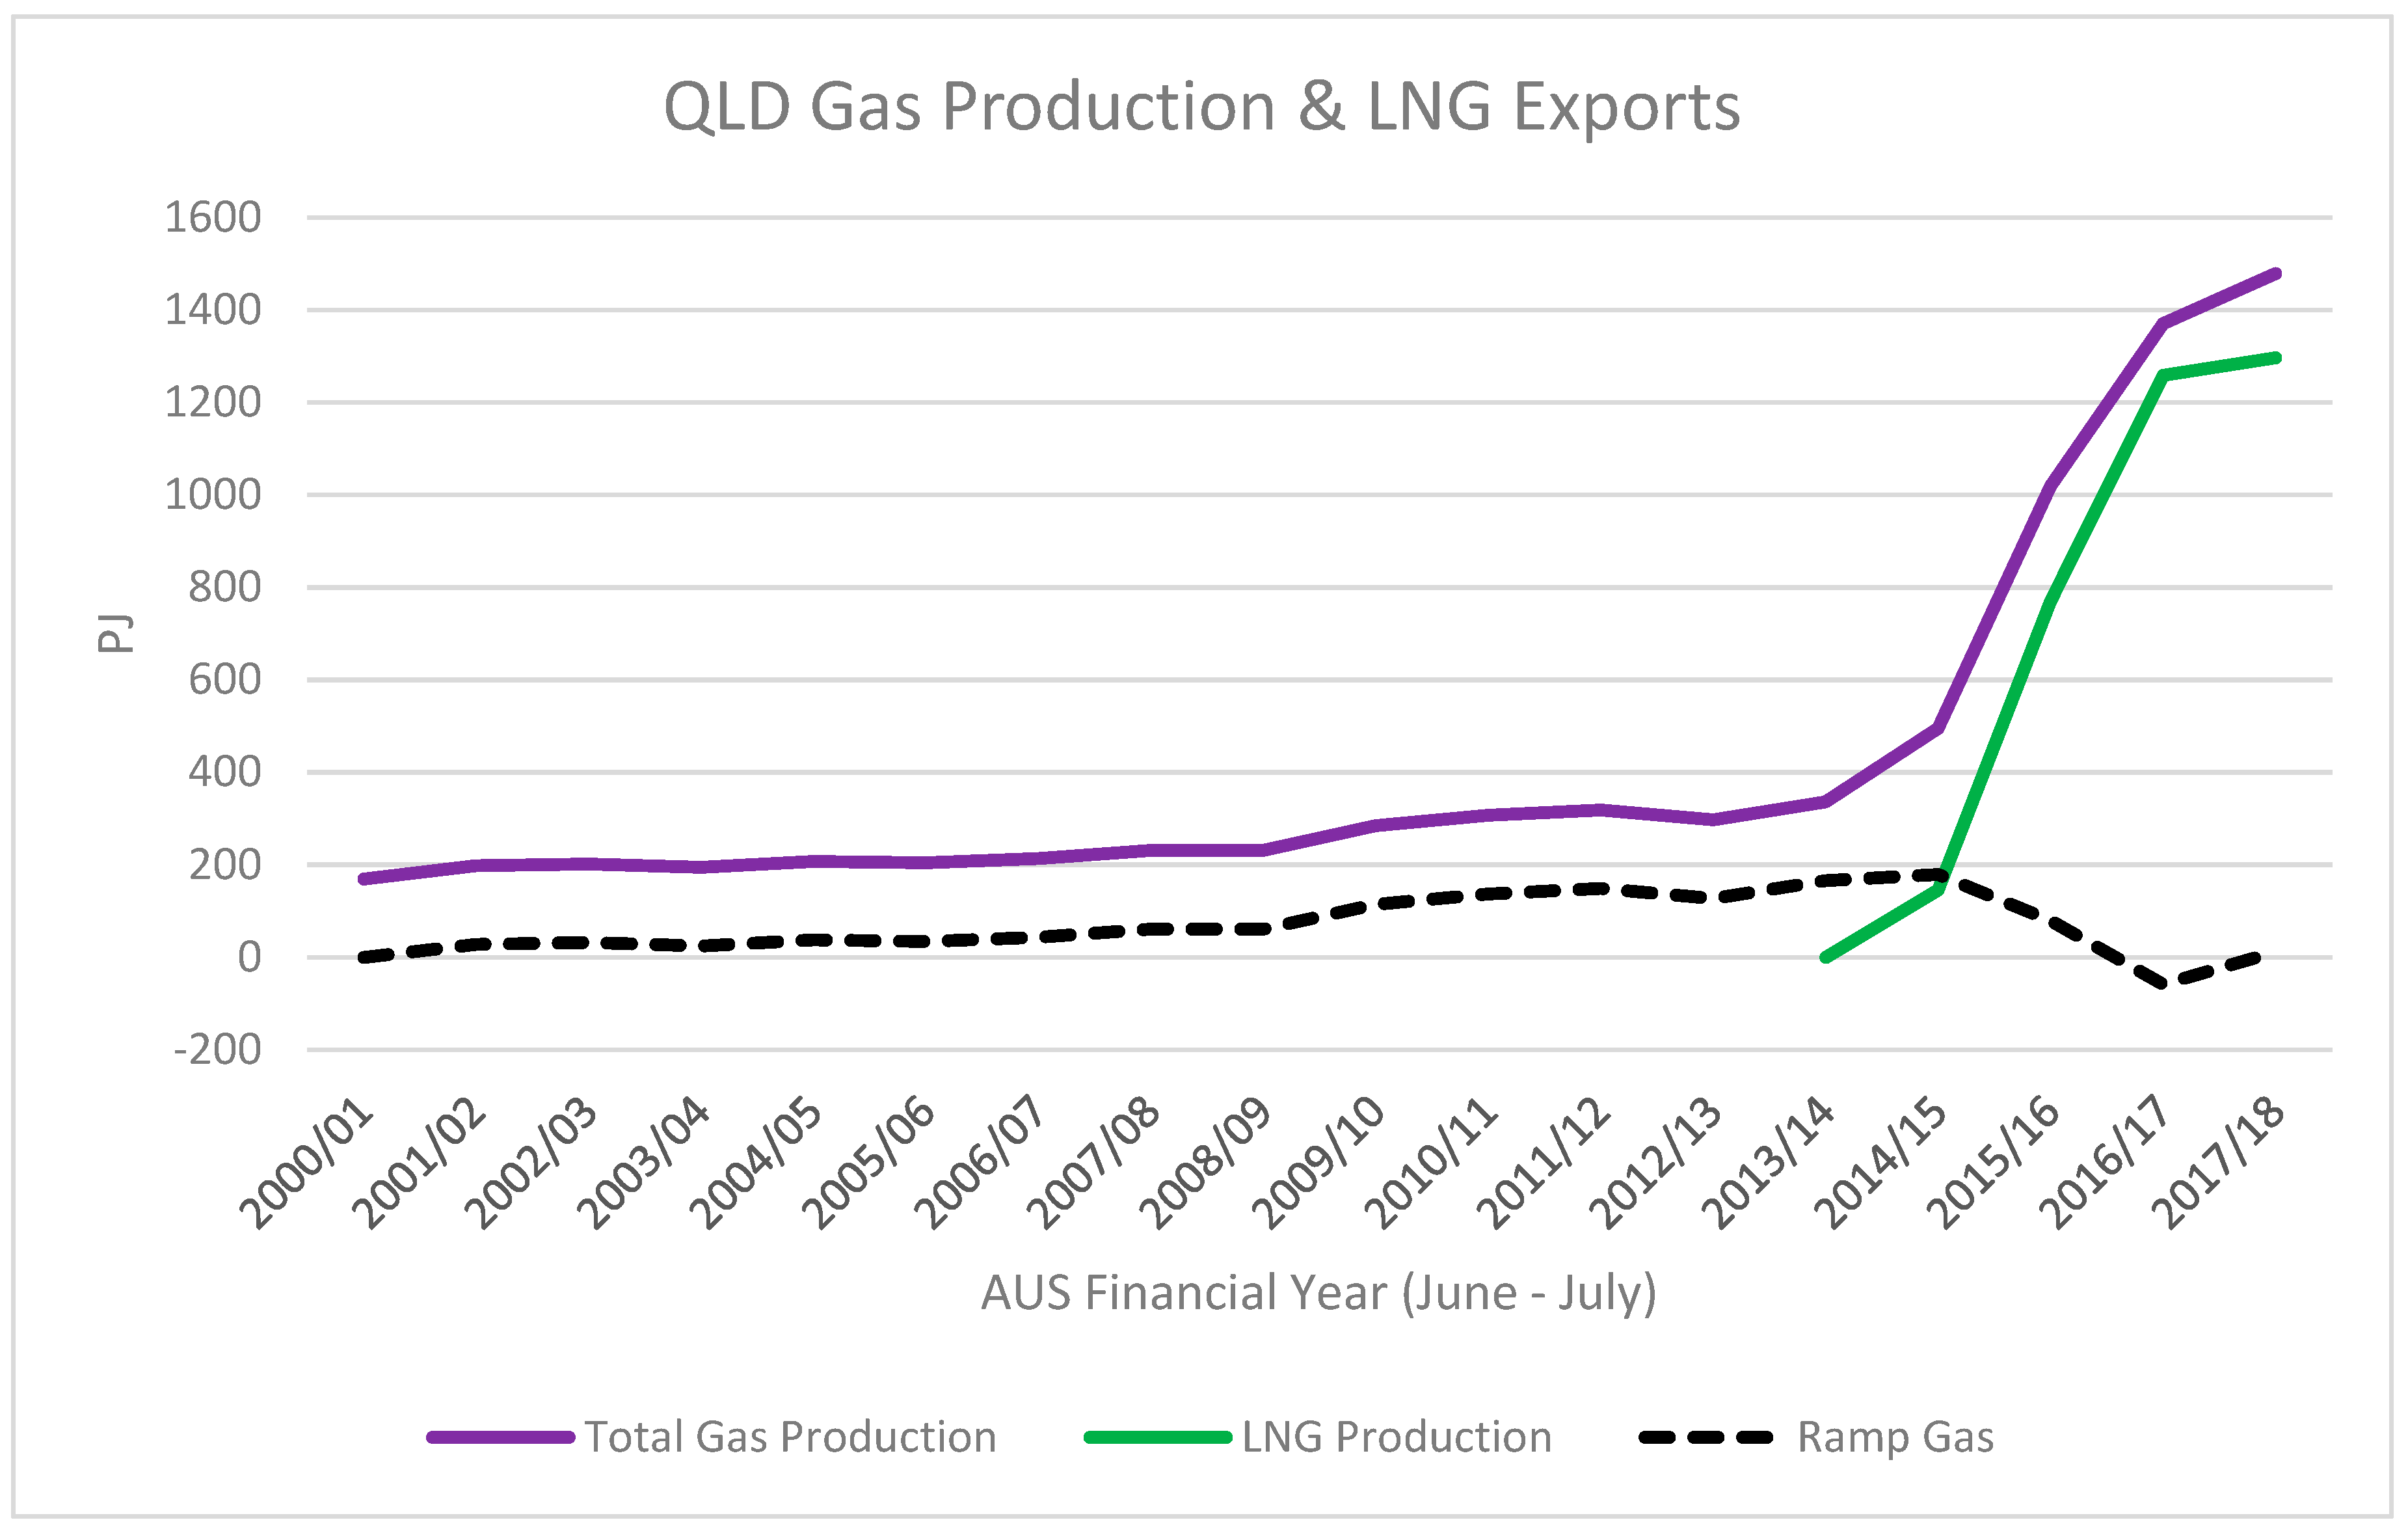
51]. The development of Queensland’s CSG production shows this; in 2004, when CSG contributed only 15% to the state’s total gas production, gas production was achieved with approximately 1.3 wells per PJ of gas produced per year. By 2015, when CSG contributed 92% of gas production, this production was achieved with approximately 7.1 wells per PJ per year [
50,
51,
52].
The time required to develop the CSG production fields, including well bores, hydraulic fracturing of the coal seam, as well as interconnecting pipelines and electrical networks, is an incremental process with production capacity steadily increasing over time as additional wells are brought into production. This process takes considerably longer in the case of CSG due to the larger number of widely distributed small gas wells required to be constructed and commissioned. The CSG production field development is ideally timed to reach full capacity at the same time as the completion of the LNG export facility to allow full LNG production as soon as the LNG production plant is completed. However, CSG wells must be kept in operation by producing gas to prevent flooding from the surrounding water table. The result is steadily increasing production of gas before the LNG facility is ready to take it, ramping up to full production. This “ramp gas” effectively created a gas glut in the Queensland market [
53].
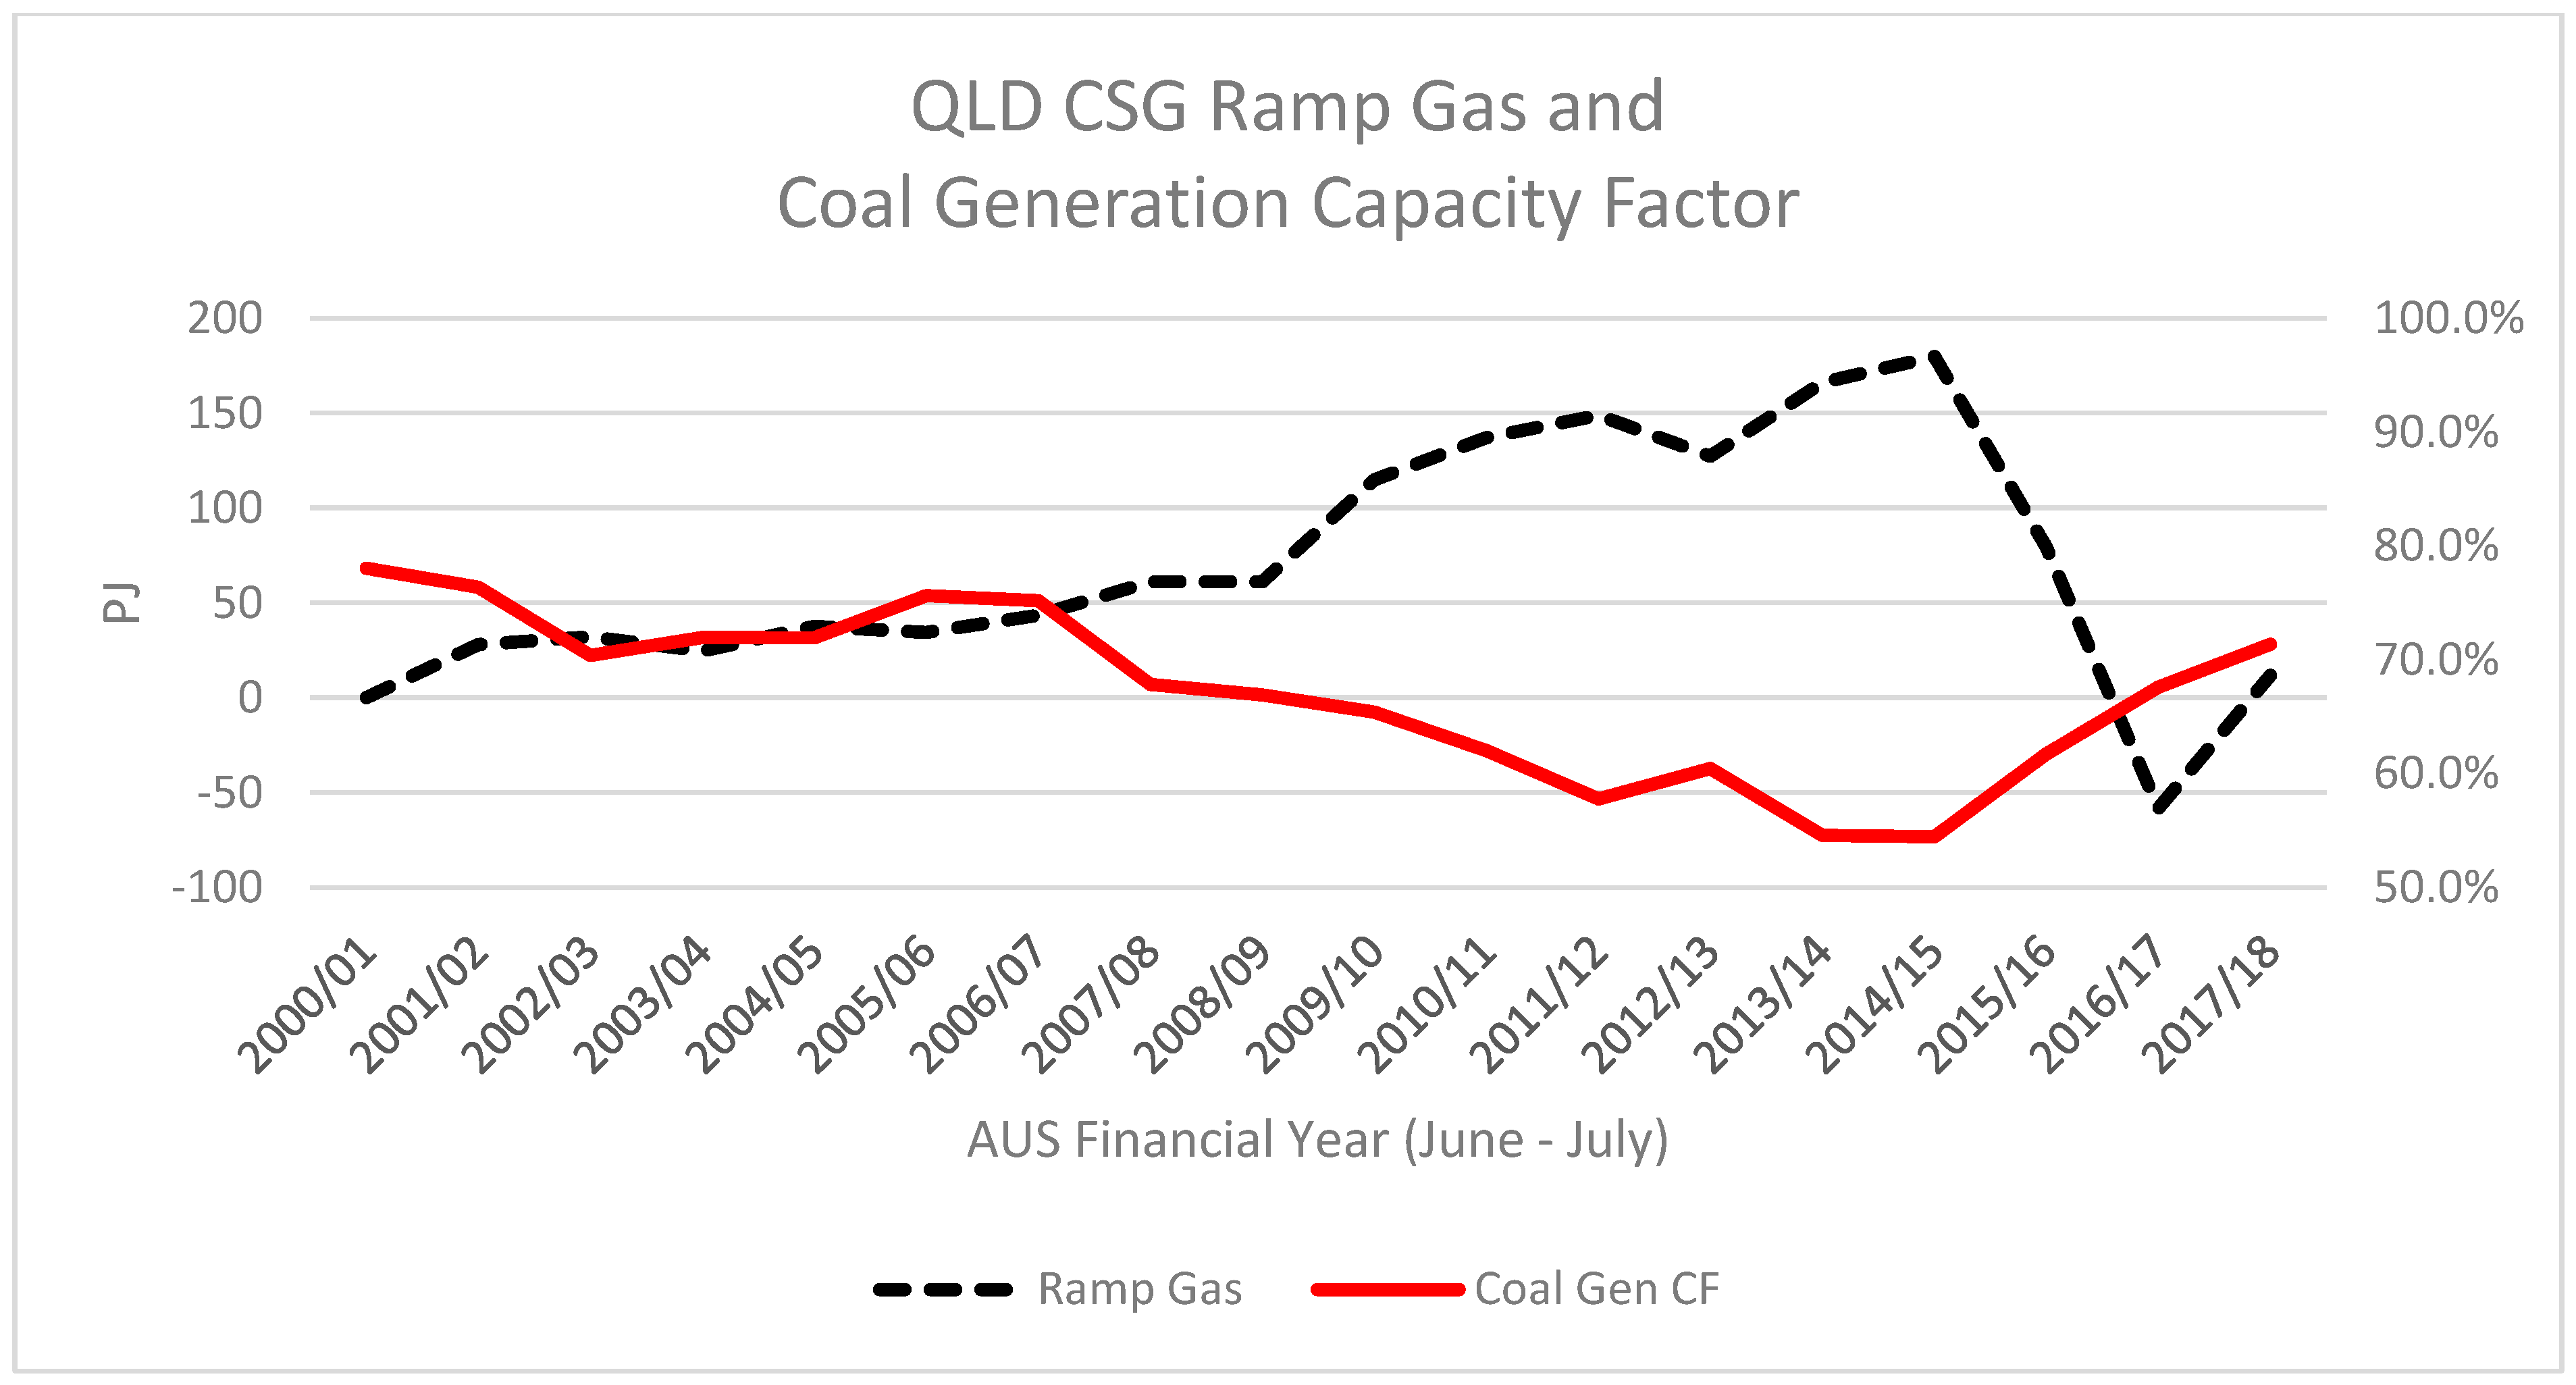
Figure 8 below shows the ramp gas phenomenon, with total gas production increasing well above pre-CSG domestic demand levels, with ramp gas peaking at 180 PJ/year in 2014–2015, being 106% of the baseline production rate of 170 PJ/year for domestic demand.
After domestic gas demand has been satisfied, the residual gas supply is either flared (burned on site in a flare stack, having no value) or used as a fuel for power generation. Since the gas supply is at negligible cost, the result is an increase in very low-cost electricity dumped onto the electricity market. The operation of gas-fired power stations using ramp gas might well be called “electrical flaring” (flaring by way of electricity generation) as a result. Once LNG facility operation commences, the ramp gas is withdrawn (often suddenly) from the domestic market to supply LNG production for export customers.
The process described above contains two phases that are of interest in the context of energy security, and which require further detailed examination:
- -
Pre-LNG start-up: the glut of ramp gas prior to LNG plant start-up;
- -
Post-LNG start-up: the sudden removal from the market.
As ramp gas flooded into the Queensland market, gas-fired electricity generation increased, operating with fuel effectively at zero cost. The direct physical effect was to displace coal-fired electricity generation. As seen in
Figure 9, the aggregate capacity factor of Queensland’s approximately 7 GW of baseload coal-fired electricity generation fleet closely follows an inverse trend to the availability of ramp gas. At the height of ramp gas dumping, generators with higher short-term marginal costs (including coal prices) as well as limited turn-down capability due to plant age, were forced to shut down generation units temporarily or permanently. At Gladstone Power Station, scheduled maintenance shut-downs were extended by reducing the work-rate and holding off returning to operation for a month or two longer after the generation unit was ready to restart. At Tarong Power Station, generation units were shut down and put into long-term storage (Tarong unit 2 for 39 months from November 2012 to February 2016, and Tarong unit 4 for 19 months from December 2012 to July 2014). Although not in operation, these generators still incur operating costs while under “care and maintenance” in anticipation of their restart when LNG export operations would soak up excess ramp gas and curtail zero cost gas-fired electricity generation.
Notwithstanding the excess of gas available, producers clearly understood that ramp gas was a temporary phenomenon. As a result, even though the spot market was flooded with ramp gas, gas users seeking long-term contracts for supply covering a period after LNG export start-up experienced challenging conditions, as future gas supply was already being priced at LNG export parity prices, a considerable jump from solely domestic supply pricing based on actual production and capital investment costs.
The long-term price level of Queensland gas, which had generally been AUD2-3/GJ, experienced an extreme jump to be linked to the East Asian LNG price of AUD12-14/GJ [
52]. In the absence of protective policies, such as domestic gas reservation, this alone is a massive disruption to the domestic energy system, but it is not the only disruption experienced post LNG start-up.
Following the immediate effects of ramp gas being removed from the market and the cessation of electrical flaring, coal-fired generators that had been placed in extended storage were promptly restarted, along with associated coal mining capacity. The costs of refurbishing and recommissioning these major energy production assets are not insignificant for the asset owners who derive no benefit from CSG or LNG operations. Furthermore, any ongoing benefit from the reduction in CO2 emissions while gas-fired generation had displaced coal-fired generation during the ramp gas phase is lost.
The anticipated shortfall of CSG supply for LNG operations eventuated as expected, with LNG operators pulling gas out of the domestic supply market to meet their shortfall, thus both increasing price and limiting supply and the ability of domestic commercial and industrial gas users to obtain supply contracts.
During the CSG ramp gas phase, five gas-fired power stations were constructed to manage the excess gas supply. With the start-up of LNG export operations, gas-fired power generation units suddenly changed from operating at a high capacity factor to operating only as standby generation used by gas producers to consume temporary excesses in the CSG to LNG supply–demand balance, or as peaking generation when electricity market spot prices exceeded LNG export parity gas price, if gas supply was available at the time required. This sudden change is quite disruptive to the electricity system; not only is there significant underutilized generation capacity recognised by the system operator being effectively idle, but also the stability of the electricity system may be impacted in situations where there is a shortfall to meet demand when peaking generation is required.
As we have seen, not only did the domestic gas supply system become linked to the international LNG pricing, but also, by extension, the electricity system also became linked. As a result, Queensland and Australia effectively lost their natural energy security advantage from domestic gas reserves.
It should also be noted that adding more gas supply is not guaranteed to improve domestic energy security either. As set out above when discussing actual primary energy self-sufficiency, production capacity developed above the level required to match domestic demand serves no net benefit as long as the systems remain physically linked, and especially when export customers are willing to pay a higher price for the fuel than domestic customers who have not previously been exposed to international market prices.
5.2. A New Indicator for Exporters’ Domestic Energy System Exposure to Export Impacts
A new energy security indicator is proposed to assess the extent of an energy exporter’s domestic energy system exposure to the international market for energy resources through exports, as shown in Equation (4). The calculation method is configured such that a higher score represents less export exposure and, hence, a preferable energy security situation, with the possible range of scores being from 0.0 to 1.0.
Equation (4): export exposure of the domestic energy system.
where:
TES = total energy supply of the given energy type.
Ex.DES(gas) = this sub-index is calculated as 1 minus the proportion of domestic gas production that has a physical connection to export and is not covered by protective measures, such as domestic gas reservations or similar policies. If all gas production is physically connected to export, either by pipeline or LNG terminal, then the rating is 0.0. If the gas system has no existing physical export pathway, then the rating is 1.0.
Ex.DES(elec) = this sub-index is calculated as 1 minus the proportion of electricity generated in a given year from sources that are export connected. Specifically:
Gas-fired electricity generation is evaluated based on whether the generator’s gas supply is export-linked as per the definition for Ex.DES(gas) above.
Electricity from coal is evaluated as 0.0 if the mines supplying that power station have an existing operational physical export route, such as a rail line to a coal export terminal; otherwise, it is 1.0.
Electricity generation from oil or any refined petroleum products is evaluated at 0.0 due to the globally integrated nature of the oil supply market.
Electricity from wind, solar, hydro, nuclear, geothermal, and biomass are evaluated as 1.0, since these energy sources are used purely for domestic electricity generation and are not export-exposed fuels.
Due to the global nature of the oil market, any significant quantity of oil production will be linked to international markets and based on the above approach used for gas and electricity, this figure would always be 0.0. Since there is no possibility of a different result, considering Ex.DES for oil does not add any value to assessing a country’s overall domestic export exposure and would in fact weight the overall indicator toward a lower score, oil is excluded from the calculation method for this indicator, except as covered by Ex.DES(elec) as an energy source for electricity generation.
Using this new indicator, we have assessed Australia’s domestic energy system export exposure before and after the commencement of LNG operations in Queensland, comparing 2012–2013 to 2018–2019 [
37,
54,
56].
Over this time interval, Australia’s domestic gas consumption increased 4.9%, while electricity demand increased 5.7% [
56].
In 2012–2013, only Western Australia’s domestic gas network had a physical connection to gas production that also supplied LNG exports; however, due to the domestic gas reservation policy of the Western Australian state government, that state’s domestic gas system can be considered protected from export parity pricing impacts [
57]. Meanwhile, the interconnected eastern Australian gas system spanning the states of Queensland, New South Wales, Victoria, South Australia, and Tasmania was nearing the end of its domestic isolation as the three Queensland LNG projects approached completion. Accordingly, in 2012–2013, the entire Australian gas system can be rated Ex.DES
(gas) = 1.0, as shown in
Table 6 [
56].
In 2018–2019, with LNG exports in operation from Queensland, the eastern Australian gas system has become fully export-exposed, and only Western Australia, with 37% of national domestic gas consumption, is protected, as set out above. As a result, Australia’s gas system rating for export exposure is Ex.DES(gas) = 0.37, as shown in
Table 7 [
50,
55,
56,
58,
59].
Evaluating Ex.DES(elec) requires a more detailed analysis, in some cases down to the level of individual power stations. The breakdown and calculation for 2012–2013 is shown in
Table 8 [
54,
56], and it is shown for 2018–2019 in
Table 9 [
54,
56].
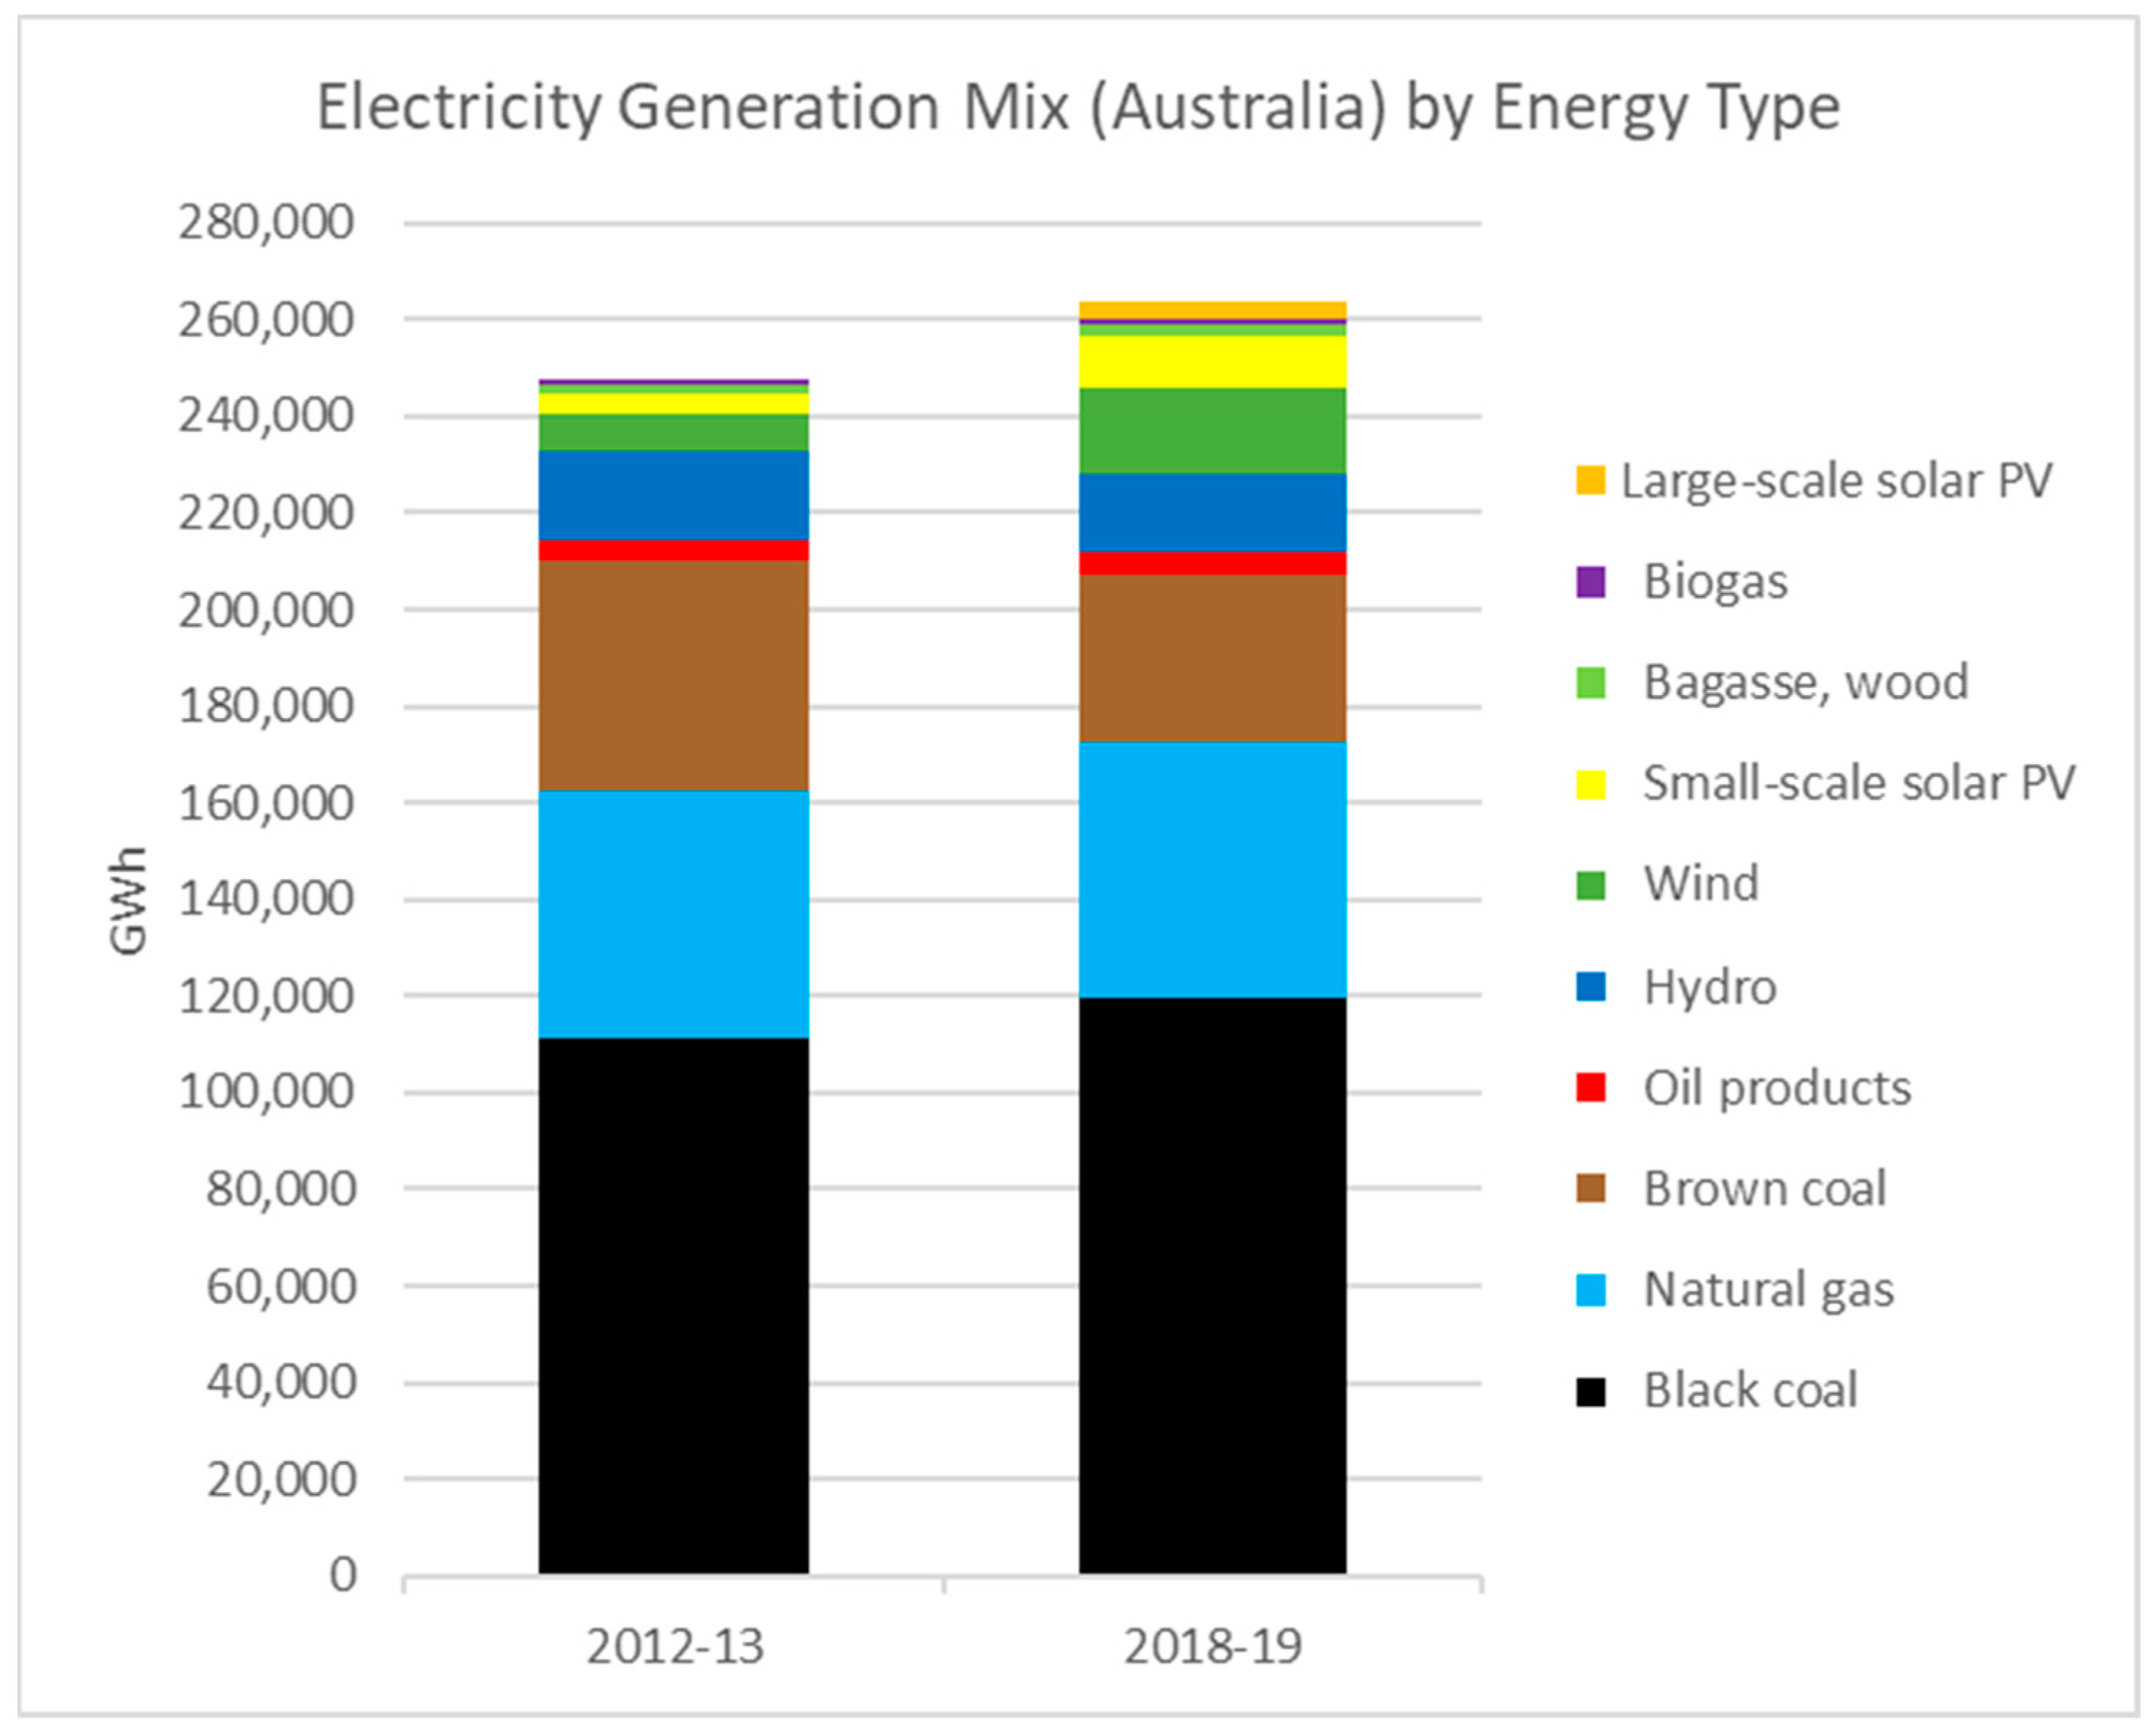
As set out above, all electricity generation from oil products is considered export-exposed, while all renewables (biofuels/biomass, solar, wind, and hydro) are not exportable. Brown coal, used for power generation in Victoria alone, is not an exportable fuel due to its high water content and low calorific value; hence, Victoria’s brown coal-fired electricity is not exposed to export linkage effects. A project demonstrating gasification of brown coal and conversion to hydrogen, which is liquefied and shipped to Japan, commenced periodic operation in 2021. Although only at demonstration scale at present, the project participants, supported by the governments of Japan and Australia, have aspirations to scale up to commercial production of hydrogen using brown coal from Victoria’s Loy Yang mine [
60]. The situation is reversed in New South Wales, where the black coal supply to every one of the state’s coal-fired power stations is interlinked to rail transport to coal export terminals at either Newcastle or Port Kembla.
A number of differences are noted in Ex.DES(elec) from 2012/2013 to 2018/2019. Electricity generation increased by 14,318 GWh (5.7%), from 249,709 GWh to 264,027 GWh. The start-up of LNG export operations in Queensland as set out above in the discussion of the calculation of Ex.DES(gas) has resulted in all of Australia’s gas-fired electricity generation, with the exception of Western Australia, becoming export-exposed.
Non-export-exposed brown coal generation fell by 13,095 GWh with the closure of Hazelwood Power Station in Victoria, although this was more than replaced by an increase in total renewable electricity generation of 18,824 GWh, which is also not export-exposed, as illustrated in
Figure 10. Generally, the export-linked status of black coal-fired power stations remained unchanged except for Mt Piper Power Station, due to the closure of one mine in its supply area and the subsequent cessation of exports.
Due to these changes, Ex.DES(elec) for Australia decreased from 0.65 to 0.59, representing a worsening of energy security conditions for Australia’s electricity generation due to increasing physical linkage of energy sources to export markets.
The aggregated calculation of Ex.DES for Australia comparing the financial year 2012/2013 (the full 12-month period before the commencement of Queensland LNG exports) and 2018/2019 (once LNG exports from Queensland were fully operational and the domestic energy system had restabilized) is shown in
Table 10.
As can be seen, notwithstanding an increase in domestic renewable electricity generation from 13.3% to 19.7% of the electricity generation mix, this is outweighed by a reduction in brown coal generation from 19.0% to 13.1%, and the linkage of all east coast gas supplies (affecting both electricity generation and industrial, commercial, and retail gas users) to export LNG has driven a significant worsening of Australia’s domestic energy system export exposure.
6. Conclusions
In this paper, we have established that the domestic energy security situation of energy resource exporters is considerably more complex than suggested by the existing body of the energy security literature, which is overwhelmingly focused on importer vulnerabilities.
Through a systems approach to the interactions of production, domestic demand, and export demand, we have established key energy security blind spots unique to energy exporting nations, as shown in
Table 11. In order to mitigate these blind spots, we have proposed new quantitative indicators.
The difference between primary energy self-sufficiency as it is usually calculated and the new calculation method Ex.PESS proposed in this paper has exposed energy security blind spots for Australia, Nigeria, and Mexico in relation to the supply of refined oil products, although all three countries are net energy exporters. This is achieved by a calculation method that segregates each fuel type, prevents an export surplus in one fuel (gas for example) from hiding an import dependency in another (such as oil), and by limiting the domestic energy security contribution of production of any fuel to only that which already supplies domestic needs, thus treating separately energy resource production capacity intended for export.
This paper’s analysis of the exposure of exporting countries domestic energy systems to international markets is crystalized in the proposed new indicator Ex.DESS, which has been applied to clearly show the deterioration of Australia’s domestic energy system security due to the commencement of LNG export operations from Queensland in 2015–2016.
The application of these indicators in the development of holistic energy policy in major energy exporting countries will better inform planning of the domestic energy system, the development of energy resource export projects, and the application of programs, such as domestic gas reservations and price caps. The use of these indicators will also allow for a quantitative counterpoint to forecasts of increased GDP from exports, royalties, and tax revenue to introduce some balance to the broader economic discussion of the net benefits of new energy resource export projects.
The clear conclusion from this paper is that an energy exporting country’s domestic energy security is enhanced by decoupling the domestic energy system from export-oriented activities, in the following ways:
Regulatory—application of instruments to protect the domestic energy system from supply and pricing issues due to export linkage as conditions of doing business in that jurisdiction, such as domestic gas reservation or a price cap on the portion of the export-linked resource consumed locally.
Technical—reorientation of the domestic energy system to reduce the reliance on export-linked energy sources. In practice, this can be achieved with largely the same actions undertaken to decarbonize the energy supply, by increasing electrification to reduce gas demand, and by increasing electricity generation from domestic renewable sources, such as hydro, wind, solar, and nuclear. The one notable exception is the use of low-grade fossil fuel deposits, such as brown coal, that have no export value, for domestic electricity generation.
In regard to this technical reorientation, pursuing the energy transition to a zero-CO2 domestic energy system allows energy resource exporting countries to enhance their overall energy security position and treat energy resources in a similar manner to any other natural resource exports, increasingly decoupled from their domestic energy system.


