Article

Alkaline Pretreatment and Pre-Hydrolysis Using Acidic Biowastes to Increase Methane Production from Sugarcane Bagasse

by
João Henrique Lima Alino
1,
Jhenifer Aline Bastos
1,
Paula Verônica Remor
1,2,
Laercio Mantovani Frare
1,
Fábio Orssatto
1,
Felippe Martins Damaceno
2,3 and
Thiago Edwiges
1,*
1
Department of Biological and Environmental Sciences, Federal University of Technology—Parana, Medianeira 85.884-000, Brazil
2
Research Group on Water Resources and Environmental Sanitation, Western Parana State University, Cascavel 85.819-110, Brazil
3
Faculty of Engineering, University of Porto, 4200-465 Porto, Portugal
*
Author to whom correspondence should be addressed.
Methane 2022, 1(3), 189-200; https://doi.org/10.3390/methane1030015
Submission received: 10 July 2022 / Revised: 7 August 2022 / Accepted: 15 August 2022 / Published: 17 August 2022

Abstract

:
Sugarcane bagasse (SCB) is the main residue obtained from sugarcane processing, and it has been widely investigated as a strategic renewable energy source. The typical recalcitrant characteristic of SCB requires the use of pretreatments (e.g., chemicals) to increase methane production through anaerobic digestion, which is normally reported to generate toxic effluents and increase operational costs. Based on this, the present study evaluated the efficiency of an inexpensive, alternative, and more sustainable method to improve the biodegradability of SCB and increase methane production by pre-storing it with acidic organic biowastes, such as cheese whey (CW) and fruit and vegetable waste (FVW). Different fresh weight-based proportions of FVW (5:95, 10:90, and 15:85) and CW (10:90, 20:80, and 25:75) were soaked with SBC for 7 days at 25 °C. These treatments were compared with traditional alkaline pretreatment using NaOH at concentrations of 1%, 5%, and 10% (w/v). The best result was obtained with SCB + FVW (5:95), being 520 ± 7 NL CH4 kg VS−1 (27.6% higher than the control) with degradation time (T90) reduced from 13 to 7 days. Pretreatment with SBC + CW resulted in antagonistic effects due to process inhibition, while alkaline pretreatment with NaOH at concentrations of 5% and 10% similarly increased methane yield by 21.2% and 34.1%, respectively. Therefore, pre-storage of SBC with FVW proved to be the best strategy to increase methane production from SCB, while simultaneously avoiding the use of chemical reagents that result in toxic effluents.

Graphical Abstract

1. Introduction

Energy is a critical factor for humanity that influences the socioeconomic development of all countries [1]. Approximately 72% of the energy produced worldwide comes from fossil sources, and only 15% comes from renewable sources [2]. Owing to the non-renewable and polluting characteristics of fossil fuels, the search for sustainable energy sources such as biomasses is consistently increasing [3]. Brazil is the largest sugarcane producer and the second largest producer of ethanol from sugarcane [4]. The industrial processing of sugarcane generates large amounts of organic residues, mainly in the form of sugarcane bagasse (SCB). The worldwide generation of SCB is approximately 540 million tons per year (fresh weight basis), representing 30% of harvested sugarcane [5]. A large amount of residual bagasse, together with its very low density (80–120 kg/m3), results in massive volumes of waste in the sugar mills, demanding appropriate management practices to minimize the associated environmental and economic impacts [6,7].
Anaerobic digestion (AD) is a sustainable technology for treating different organic residues [8]. This biological treatment transforms environmental liabilities into economic assets through the production of biogas, which can be used as a clean and renewable source of energy for the generation of electricity, heat, or biofuel (biomethane) [9]. AD occurs by a consortium of microorganisms in four stages, based on complex biochemical reactions: hydrolysis, acidogenesis, acetogenesis, and methanogenesis [10], with hydrolysis being the rate-limiting step when organic complex biomass is used as substrates.
SCB has been increasingly used as a substrate for biogas production [11]. However, agricultural substrates, such as SCB, are slowly hydrolyzed because of the complex structure formed by lignocellulose [12]. The recalcitrance of these substrates usually requires a pretreatment process before digestion to facilitate microbial degradation. Several processes, including physical, chemical, and biological pretreatments, are usually applied to lignocellulosic biomass. These pretreatments can open the lignocellulosic structure and facilitate the access of microorganisms to the biodegradable fraction, thereby increasing its biodegradability [13]. Pretreatments also lead to a reduction in the crystallinity of cellulose and the degree of polymerization, leading to an increase in lignin and hemicellulose solubilization [14].
Chemical pretreatments enhance lignocellulose degradation and are one of the most applied techniques owing to their high efficiency in carbohydrate solubilization [15]. However, the application of chemical pretreatments in full-scale biogas plants is still limited because of the high cost of chemical inputs and the subsequent toxic effluents that require specific treatment and final disposal [1]. Different strategies have been investigated to minimize the costs related to chemical reagents and their impact on the environment after the pretreatment process. Among these, pre-hydrolysis has been reported as a promising alternative to pretreat lignocellulosic waste [16]. This method is used as a storage system to maintain the energy content of crops, ensuring the maintenance of good nutritional values, allowing the use of these feedstocks as AD substrates [17]. Pre-hydrolyzed biomass is rich in fermented organic compounds, such as lactic acid [18]. This process causes a drop in the pH of the media prior to the AD reactor, creating an acidic environment (catalytic biowaste medium) that results in the delignification of lignocellulose in an eco-friendly way, removing the need for chemicals or high-energy requirements [19].
Fruit and vegetable waste (FVW) and cheese whey (CW) stand out among the potential acidic biowastes available for pre-hydrolysis with lignocellulosic substrates, since they are produced in large quantities worldwide. Brazil is the third largest producer of fruits worldwide and the third largest producer of vegetables in Latin America, with 1.7 million tons of FVW generated in 2011 [20]. These residues are characterized by high moisture content and high biodegradability, with a density of 1,030 kg·m−3 [21]. Approximately 9 kg of CW is generated to produce 1 kg of cheese [22], and it is characterized by a high concentration of easily degradable carbohydrates. Brazil is the second largest producer of milk worldwide, with an annual production of 33.4 billion liters in 2018 [23]. However, there is little or no information in the literature on the effect of pre-hydrolysis of SCB with acidic organic wastes.
This study aimed to evaluate the effect of pre-hydrolysis of SCB mixed FVW and CW on biodegradability and methane production. SCB was mixed with FVW in the proportions of 5:95, 10:90, and 15:85 (w/w) and with CW in the proportions of 10:90, 20:80, and 25:75 (w/w) on a fresh weight basis for pre-hydrolysis during 7 days at room temperature (25 °C). In addition, mild-alkaline pretreatment using NaOH at concentrations of 1%, 5%, and 10% w/w was also applied to SCB for comparison with the previous pretreatments. Biochemical methane potential (BMP) of the substrates was determined using batch bottles at mesophilic temperature (37 °C).

2. Material and Methods

2.1. Feedstock and Inoculum

The SCB used as feedstock was collected from a sugarcane juice retailer in a local fruit market in Medianeira/Brazil. The feedstock was milled using a kitchen blender to a particle size of less than 10 mm, as recommended by Holliger et al. [24]. The samples were stored in plastic bags and kept frozen at 20 °C until further use. FVW, used as acid biowaste, was collected from a wholesale market in Foz do Iguaçu/Brazil. The FVW was composed of watermelon (17%), mango (16%), melon (14%), tomato (13%), plum (12%), orange (9%), chayote (4%), sweet potato (3%), pepper (3%), and others (9%). The FVW was blended and also milled to a particle size of less than 10 mm. The CW, an acidic by-product of casein-induced coagulation (sweet whey), was collected from a dairy agroindustry in the western region of Parana/Brazil. The TS and VS contents of the substrates were 38.3% and 37.4% (SCB), 10.5% and 9.8% (FVW), 6.8% and 6.3% (CW).
Anaerobic effluents obtained from full-scale biogas plants treating cattle and swine manure were used as inoculum. The two digestates were mixed in a ratio of 1:1 (fresh weight-based), stored in a 100 L laboratory-scale reactor at mesophilic temperature (37 °C), and weekly fed with a mixture of different organic materials [25] to simulate a complex biomass degradation and increase the diversity of the microbial community [26]. The inoculum was then degassed for 7 days prior to incubation.

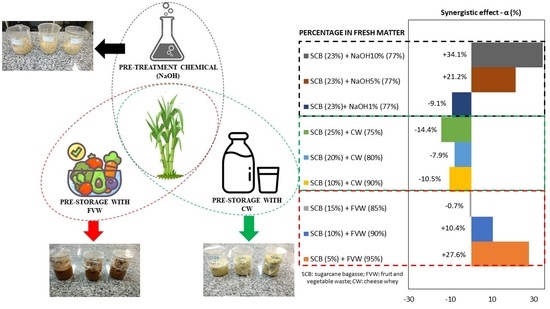
2.2. Pretreatment Procedure

Two different pretreatment strategies were investigated in this study: (experiment I) preliminary mixing (pre-hydrolysis) between SCB with FVW (5:95, 10:90, and 15:85), and between SCB with CW (10:90, 20:80, and 25:75) on a fresh weight basis; and (experiment II) mild-alkaline pretreatment of SCB with NaOH at concentrations of 1%, 5%, and 10% w/w (Table 1). Mixture proportions between SCB and FVW or CW were adopted according to the capacity of the acidic biowaste to completely humidify the bagasse, owing to the very low density of the SCB (80–120 kg·m−3) than that of the acidic biowastes (1030 kg·m−3). The concentration of the alkaline pretreatments was based on previous investigations by Bastos et al. and Remor et al. [27,28].
Mixtures between SCB and the acidic biowastes (0.5 kg) were kept in open beakers of 0.5 L for 7 days at room temperature (25 °C). The duration of the pretreatment with acidic biowastes was based on the reduction in the pH values that started with 6.8 for SCB + CW and pH of 4.7 for SCB + FVW and finished with ≈4.0. Alkaline pretreatment was performed by soaking 100 g of SCB in 340 mL of a solution of NaOH at 1%, 5%, and 10% (w/v) for 12 h at 25 °C in open beakers (Table 1). The TS content of the mixtures between SCB and the NaOH solution was kept in the range of 8.5–16.3% (Table 1). The chemical pretreated mixtures resulted in a pH > 10, and it was subsequently washed with tap water until neutral pH (≈7.0) to ensure biological activity compatible with the BMP assay protocols. The washing step was included since the inoculum used for the BMP tests was composed only of digestates and did not contain any extra nutrient or buffering solution. It is noteworthy that washing after pretreatment is a strategy that can be avoided by the addition of nutrient/buffering solutions as performed by Vasmara et al. (2021) [29]. The screened fraction was then oven-dried at 50 °C for 24 h to remove extra humidity and increase the homogeneity of the tests.

2.3. Biochemical Methane Potential (BMP) Assay

SCB after pretreatments were mixed with inoculum to obtain a feedstock to inoculum (F/I) ratio of 1/3 [24,26] based on volatile solids (VS) and loaded into 125 mL batch glass reactors. Triplicate reactors were run for each condition, including untreated SCB, FVW and CW, which were used as control, and microcrystalline cellulose (Sigma-Aldrich, 20 μm diameter) was used as a positive control [24]. Each flask was enclosed using 20 mm sealing pliers with a polytetrafluoroethylene/butyl septum and an aluminum seal cap. The endogenous production of biogas produced by the inoculum was subtracted from the total biogas produced by the substrates (Equation (1)).
B M P = V 1 [ V 2 ( M 1   ·   V S I N ) ] ( M 2   ·     V S S U B )   ·   %   C H 4
where:
BMP: biochemical methane potential (L CH4 kg VS added−1);
V1: biogas volume of the flask containing inoculum and substrate (L);
V2: biogas volume of the flask containing only inoculum (L kg VS–1);
M1: mass of inoculum added (kg);
M2: mass of substrate added (kg);
VSIN: VS content of the inoculum (%);
VSSUB: VS content of the substrate (%);
% CH4: methane concentration in the measured biogas (%).
Biogas yield was recorded every 1 to 3 days until the daily production of each flask was ≤1% of the cumulative production. The experiment was maintained in an incubator at a mesophilic temperature (37 °C). Biogas yield was corrected to standard temperature and pressure using Equation (2):
V 0 = V ·   ( P L P W )   T 0 P 0   ·   T
where:
V0: standard biogas volume (LN);
V: registered biogas volume (L);
PL: atmospheric pressure at the time of registration (mbar);
Pw: vapor pressure of water (mbar);
T0: standard temperature (273.15 K);
P0: standard pressure (1013 mbar); T: temperature (K) within incubator.
The vapor pressure of water was determined by using the temperature within the incubator as the basis for calculations, where the temperature used was the same as that registered inside the flask (Equation (3)):
P W = 10 8.1962 1730.63 T 39.724

2.4. Analytical Methods

TS, VS, and lipids were determined according to APHA [30]. Crude protein content was estimated by multiplying the total Kjeldahl nitrogen by the nitrogen-to-protein conversion factor of 5.36, considering an average protein content of approximately 18.6% nitrogen for fruits and vegetables [31]. Cellulose, hemicellulose, and lignin were determined using neutral detergent fiber (NDF), acid detergent fiber (ADF), and acid detergent lignin (ADL) [32].
The biogas composition was analyzed via gas chromatography (Clarus 680, Perkin Elmer) with a thermal conductivity detector and packed Plot Q column, using helium as a carrier gas at a flow rate of 30.0 mL min−1. In each analysis, which had been performed in duplicate, a 200 μL volume of biogas was injected with a Hamilton Gastight syringe (1750RN SYR, 22/2’’/2 capacity of 500 μL).

2.5. Data Analysis

The synergistic effect of pre-hydrolysis was calculated considering the inner reactions produced by the different biomasses on the cumulative methane yields. The possible influence of the acidic biowastes on the breakdown of the lignocellulose content present in the SCB, and thus, improved methane yields were calculated using Equation (4):
α = M e t h a n e   y i e l d   e x p e r i m e n t a l M e t h a n e   y i e l d c a l c u l a t e d   · 100
The experimental methane yield is the BMP from the pre-treated substrate mixtures (SCB + FVW and SCB + CW), while the calculated methane yield is the BMP of the mono-digestion of the substrates (SCB, FVW, and CW) in the same VS proportions used in the pretreatment mixtures (Equation (5)) [16]. The calculated methane yield was used to assess the BMP in the case the same substrates were digested isolated. The result indicates a synergistic effect if α > 1, antagonistic effect if α < 1, and no effect if α = 0 of the pretreatment strategies [33]:
B M P c a l c u l a t e d = ( B M P S C B   ·   V S S C B ) + ( B M P F V W   ( o r   C W )   ·   V S F V W ( o r   C W ) )
where:
BMPSCB: BMP of the SCB (LN CH4 kg VS−1)l
BMPFVW/CW: BMP of the acidic waste (FVW or CW) (LN CH4 kg VS−1);
VSSCB: mass of VS from SCB added to batch bottles (g);
VSFVW/CW: mass of VS from acidic waste (FVW or CW) added to the batch bottles (g).
The Tukey test (p < 0.05) was applied after the analysis of variance (ANOVA) to assess statistical differences between pretreatment strategies. The normal distribution of data was performed, and only the data resulting in a normal distribution (Anderson–Darling, p > 0.05) were used in Tukey’s test. Statistical analysis was performed using the Action Stat package for Excel (Statcamp/Brazil).

2.6. Kinetic Study

A kinetic study was performed using a first-order kinetic model assuming that methane production is related to the concentration of the substrate and that hydrolysis is the rate-limiting step during anaerobic digestion [34] (Equation (6)):
G ( t ) = G 0 × ( 1 e ( K t ) )
where:
G(t): cumulative methane yield at digestion time t (L kg VS–1);
G0: methane potential of the substrate (L kg VS–1);
Khyd: first-order disintegration rate constant (day–1);
t: time (day).
The parameters of the kinetic model were determined using nonlinear regression models calculated by the ‘Solver’ function in Excel software (Microsoft, 2010). The coefficient of determination was used to evaluate the statistical indicators of the kinetic model.

3. Results and Discussion

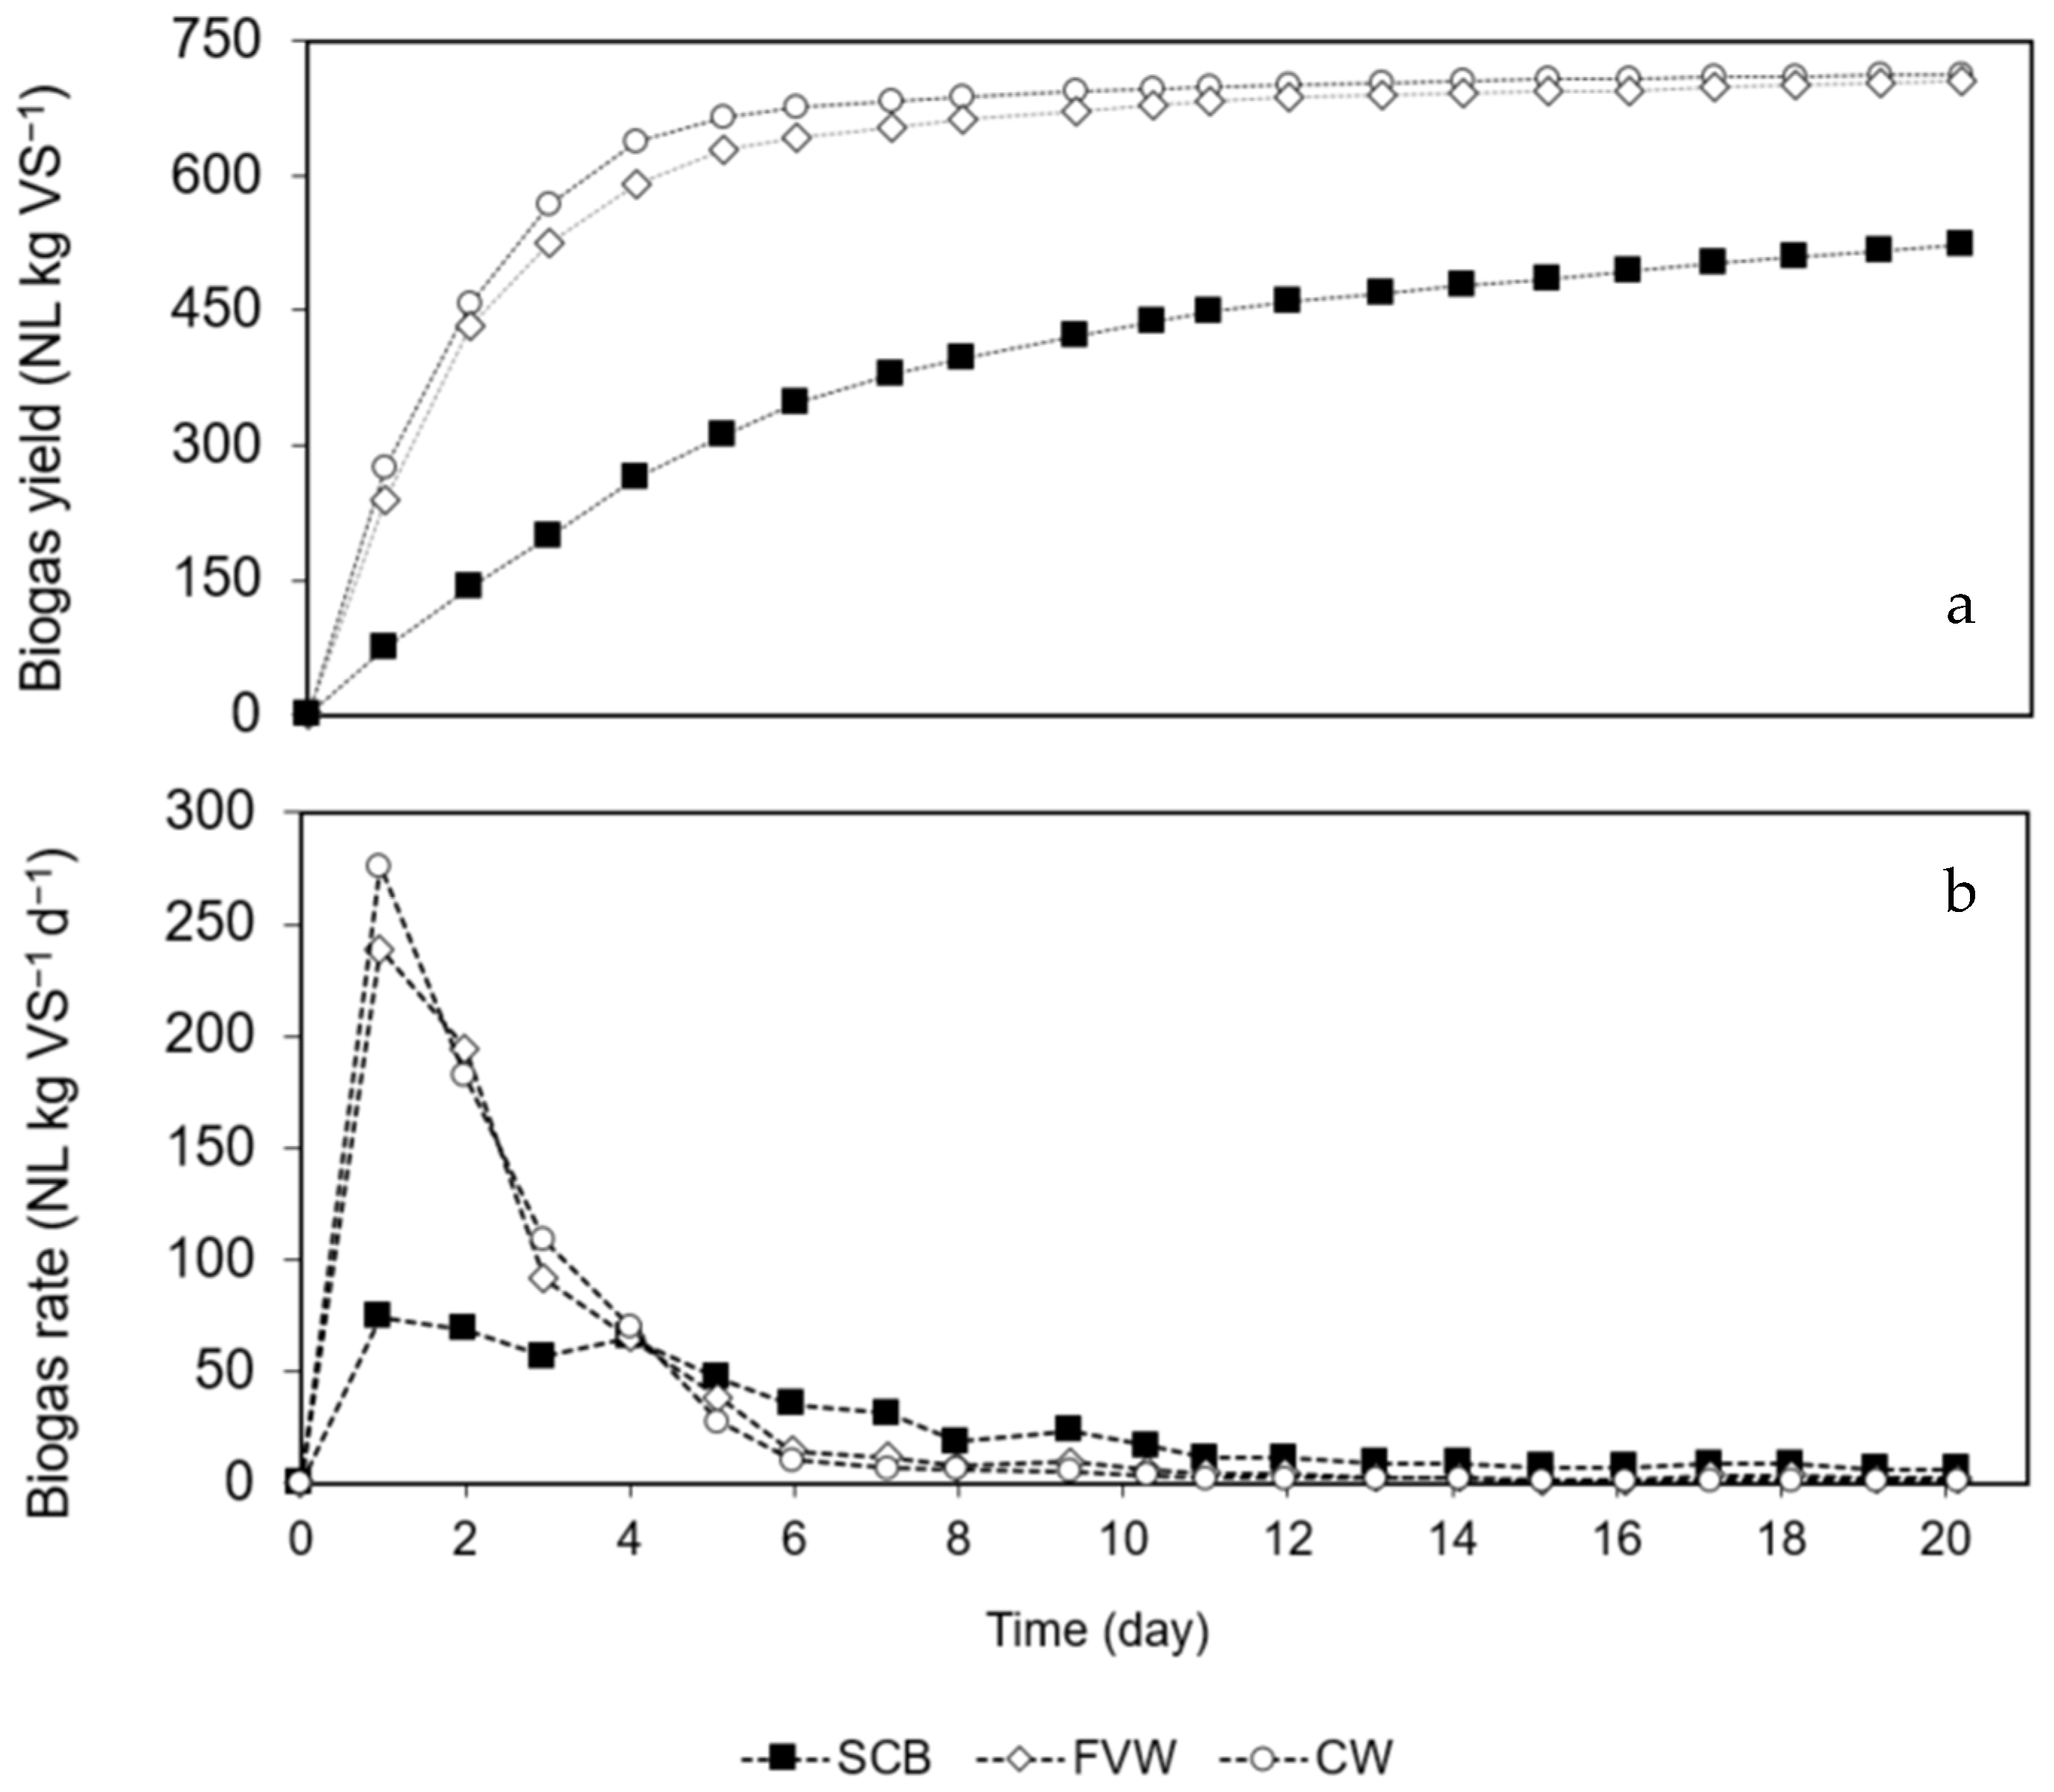
3.1. Characterization of Substrates and Inoculum

The inoculum had a pH of 8.37, a TS content of 3.1%, and a VS content of 1.8%. The VS/TS ratio of 58.3% indicated a satisfactory amount of VS in the inoculum (VS/TS > 50%) to perform the BMP tests. The untreated SCB had a TS content of 38.3% and a VS content of 37.4%, resulting in a VS/TS ratio of 97.6% (Table 2). Despite the low moisture content of the SCB for wet-AD, the preliminary VS/TS ratio indicated high organic fraction with potential to be converted into biogas. A similar VS/TS of 97.4% was reported by Leite et al. [35] for SCB. However, lignocellulose represented most of the organic fraction of the SCB, with 30.5% cellulose, 25.6% hemicellulose, and 5.5% lignin (61.3% of the total VS content), while only 3.2% was lipid and 2.3% was protein (Table 2). Leite et al. [35] also reported low lipid (0.8%) and protein (1.2%) contents of SCB. The high lignocellulose content in the chemical composition of SCB suggests its low biodegradability if directly treated by AD.
The FVW and CW used for pre-hydrolysis with SCB had low TS and high VS contents. The moisture contents were 89.5% and 93.2% for FVW and CW, respectively. The high moisture content of the catalytic biowaste is desired to completely humidify the dried lignocellulosic biomass during the pre-hydrolysis period and increase the chemical interactions between the organic compounds. The pH of the FVW was 4.7, owing to the typical content of easily degradable sugars present in this type of biomass. The pH of the CW was 6.7, which was similar to that of sweet whey obtained from Risner et al. [36], characterized by the casein-induced coagulation process at a pH close to 6.5.
The lipid and protein contents of the catalytic wastes were 5.0% and 9.6% for the FVW, and 9.8% and 12.1% for the CW, respectively. The slightly higher values obtained from the CW were possibly due to the residual fat and protein concentrations typical of cheese production. The physical and chemical properties of the catalytic biowastes, especially moisture and pH, are essential for providing sufficient water and an acidic environment to break the lignocellulosic rigid structure of the SCB during the pre-hydrolysis phase.

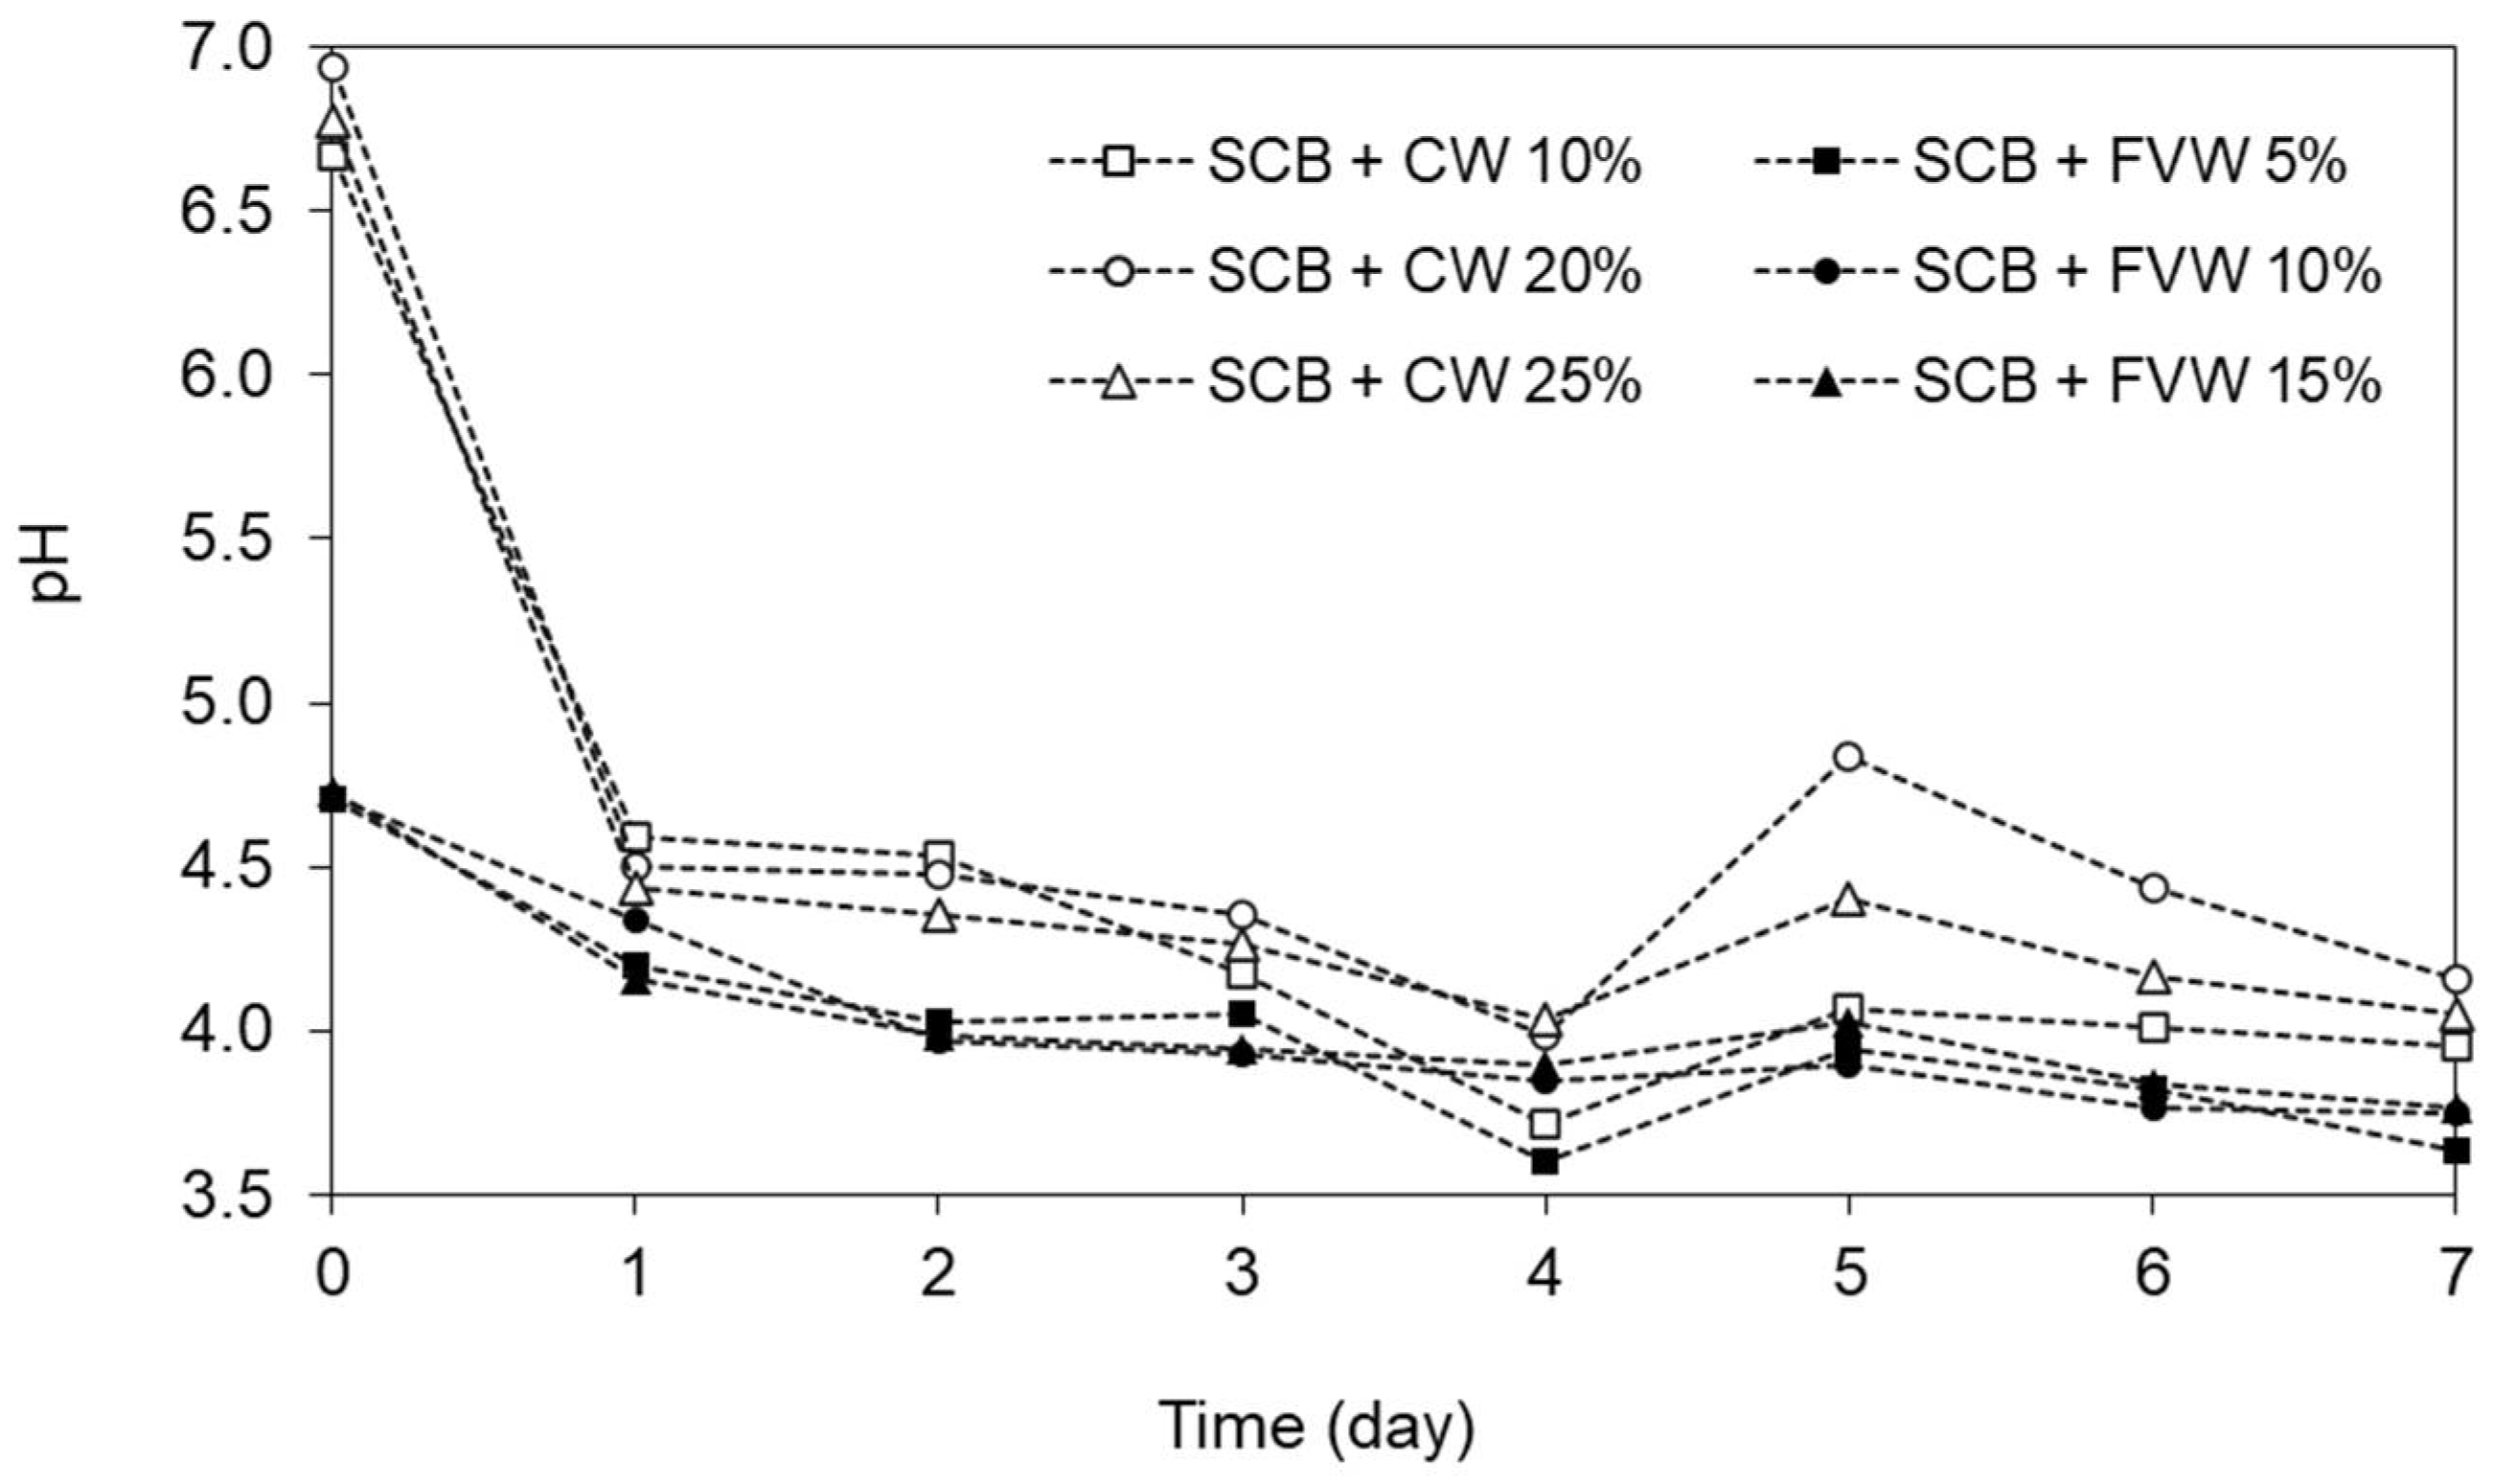
3.2. Effect of Pre-Hydrolysis between SCB + FVW and SCB + CW on Methane Potential (Experiment I)

FVW and CW were mixed with SCB and kept for 7 days prior to BMP batch tests. The pH of the mixtures started to decrease after one day of exposure time because of the fermentation of the mono and disaccharides content present in the FVW and CW. On average, the pH decreased from 6.8 to 4.1 in the mixture with SCB + CW and from 4.7 to 3.7 in the mixture with SCB + FVW (Figure 1). Although the initial pH of CW was higher than that of FVW, the fermentation process of soluble sugars (lactose and fructose) occurred in both mixtures, and an acidic environment was observed from the first day of pre-hydrolysis.
The pH of the digestates produced after the batch digestion tended to be slightly higher than the initial values, except for the chemical pretreatments (Figure 2). This was observed for isolated residues (SCB, FVW, and CW) and for all mixtures containing them, indicating adequate degradation of the organic fraction and no evidence of organic acid accumulation or inhibition during AD. The lowest pH value was observed for the mixtures between SCB and FVW because of the naturally higher contents of organic acids in FVW. Some sugar-rich fruits, such as melon, watermelon, mango, plum, and orange, represented 68% of the FVW composition used in this study. The stable pH condition of the organic matter degradation was supported by the good quality inoculum and a safe (F/I), even when an acidic biomass, such as FVW, was used.
The biogas yields from the isolated substrates were higher for the FVW and CW than for the SCB, being 705, 713, and 523 NL biogas kg VS–1, respectively (Figure 3a). This fact was expected due to the much higher biodegradability of the FVW and CW, which provided the rapid conversion of easily degraded carbohydrates into biogas. Biogas production started immediately for each of the three residues, and the peak of daily biogas production occurred after only one day of digestion, being 239 and 276 NL kg VS–1 d–1 for FVW and CW, respectively. There was no clear peak in daily biogas production for the untreated SCB, with values in the range of 57–74 NL kg VS–1 d–1 during the first four days of digestion (Figure 3b).
The BMP of the untreated SCB was 330 NL CH4 kg VS–1, while FVW and CW resulted in higher BMP values of 423 and 449 NL CH4 kg VS–1, respectively (Table 3). Similar results of 326 NL CH4 kg VS–1 for SCB, 388 NL CH4 kg VS–1 for FVW, and 510 NL CH4 kg VS–1 for CW were reported in the literature [37,38,39]. Compared to the SCB, catalytic biowastes had higher methane yield, which was related to their macromolecular composition, with lower lignocellulose and higher contents of protein and lipids (Table 2). The hydrolysis constant obtained after the kinetic analysis (Khyd) also reflected the different degradation rates of these residues. The Khyd of the SCB was only 0.18 d–1, while FVW and CW resulted in a Khyd of 0.48 d–1 and 0.56 d–1 (Table 3), respectively. The higher Khyd of the CW compared to the FVW is related to its smaller particle size and lower lignocellulose content, which can promote the faster degradation of sugars. The technical T90, i.e., the time necessary to achieve 90% of the cumulative methane yield, was calculated to be 13 days for SCB, while only 6 and 4 days were necessary to convert 90% of the organic matter into methane from FWV and CW, respectively. Edwiges et al. [16] also evaluated the T90 of the methane potential from lignocellulosic substrates and reported similar values of 15 days for garden waste (lignocellulosic substrate) and only 5 days for FVW. Higher T90 values of 17–28 days were reported by Kafle and Chen [34] for animal manure, such as dairy, chicken, and swine.
When 5% of SCB was mixed with 95% of FVW on a fresh weight basis, the resulting BMP was 520 NL CH4 kg VS–1. The calculated methane yield in the case of mono-digestion of isolated SCB and FVW was 408 NL CH4 kg VS–1 (Equation (5)), resulting in a synergistic effect (α) of 27.6% (Table 3). The corresponding mix proportion based on VS was 17:83 (Table 1), indicating that the synergistic effect requires five-fold more VS from FVW than from SCB, suggesting that a small amount of SCB has a catalytic role when added to FVW. Lower bagasse to co-substrates ratios were also reported in the literature [40] as being essential to achieve higher biodegradability and methane yields, e.g., 35:65 (bagasse: poultry waste) and 40:60 (bagasse: catering waste). When the percentage of SCB mixed with FVW increased from 5% to 10% and 15%, the synergistic effect of the tests decreased, probably due to the minor proportion of FVW in the mixtures and, consequently, lower moisture and availability of organic acids to break the lignocellulose of the SCB. The BMP of the SCB mixed in the proportions of 10% and 15% with FVW was 437 and 383 NL CH4 kg VS–1, with α of 10.4% and −0.7%, respectively. The antagonistic effect observed when 15% SCB was added to the mixture reveals the treatment limitation with higher proportions of lignocellulosic waste. Edwiges et al. [16] reported 13% higher BMP when FVW was pre-stored with garden waste for 7 days. The hydrolysis rate in these treatments also decreased with the increased concentrations of SCB, being 0.42, 0.37, and 0.36 d–1 for 5%, 10%, and 15% of SCB added to the mixture, respectively (Table 3). In addition, the T90 increased from 7 to 8–9 days when 5%, 10%, and 15% of SCB were applied.
The mixtures of SCB and CW resulted in an antagonistic effect, with α being −10.5%, −7.9%, and −14.4%, respectively (Table 3). The conversion of lactate into lactic acid by lactic acid bacteria has been reported to produce antimicrobial peptides (bacteriocins), which may have inhibited the reproduction of archaea methanogens during the AD, since bacteriocins naturally work as food preservatives [41].
Although no time delay was observed for the mixtures using CW, the T90 of these treatments was in the range of 10–11 days, which was higher when compared to the 7–9 days obtained with the mixtures using FVW (Table 3). Despite the higher Khyd of the mono-digestion of CW (0.56 d–1) than that of the FVW (0.48 d–1), the hydrolysis rates of the mixtures between SCB + FVW were faster than that with SCB + CW, being 0.36–0.42 and 0.24–0.36–1, respectively. These values suppose that, in addition to the pH of the media, the chemical composition of the catalytic biowastes may have also affected their performance in breaking the lignocellulose content.

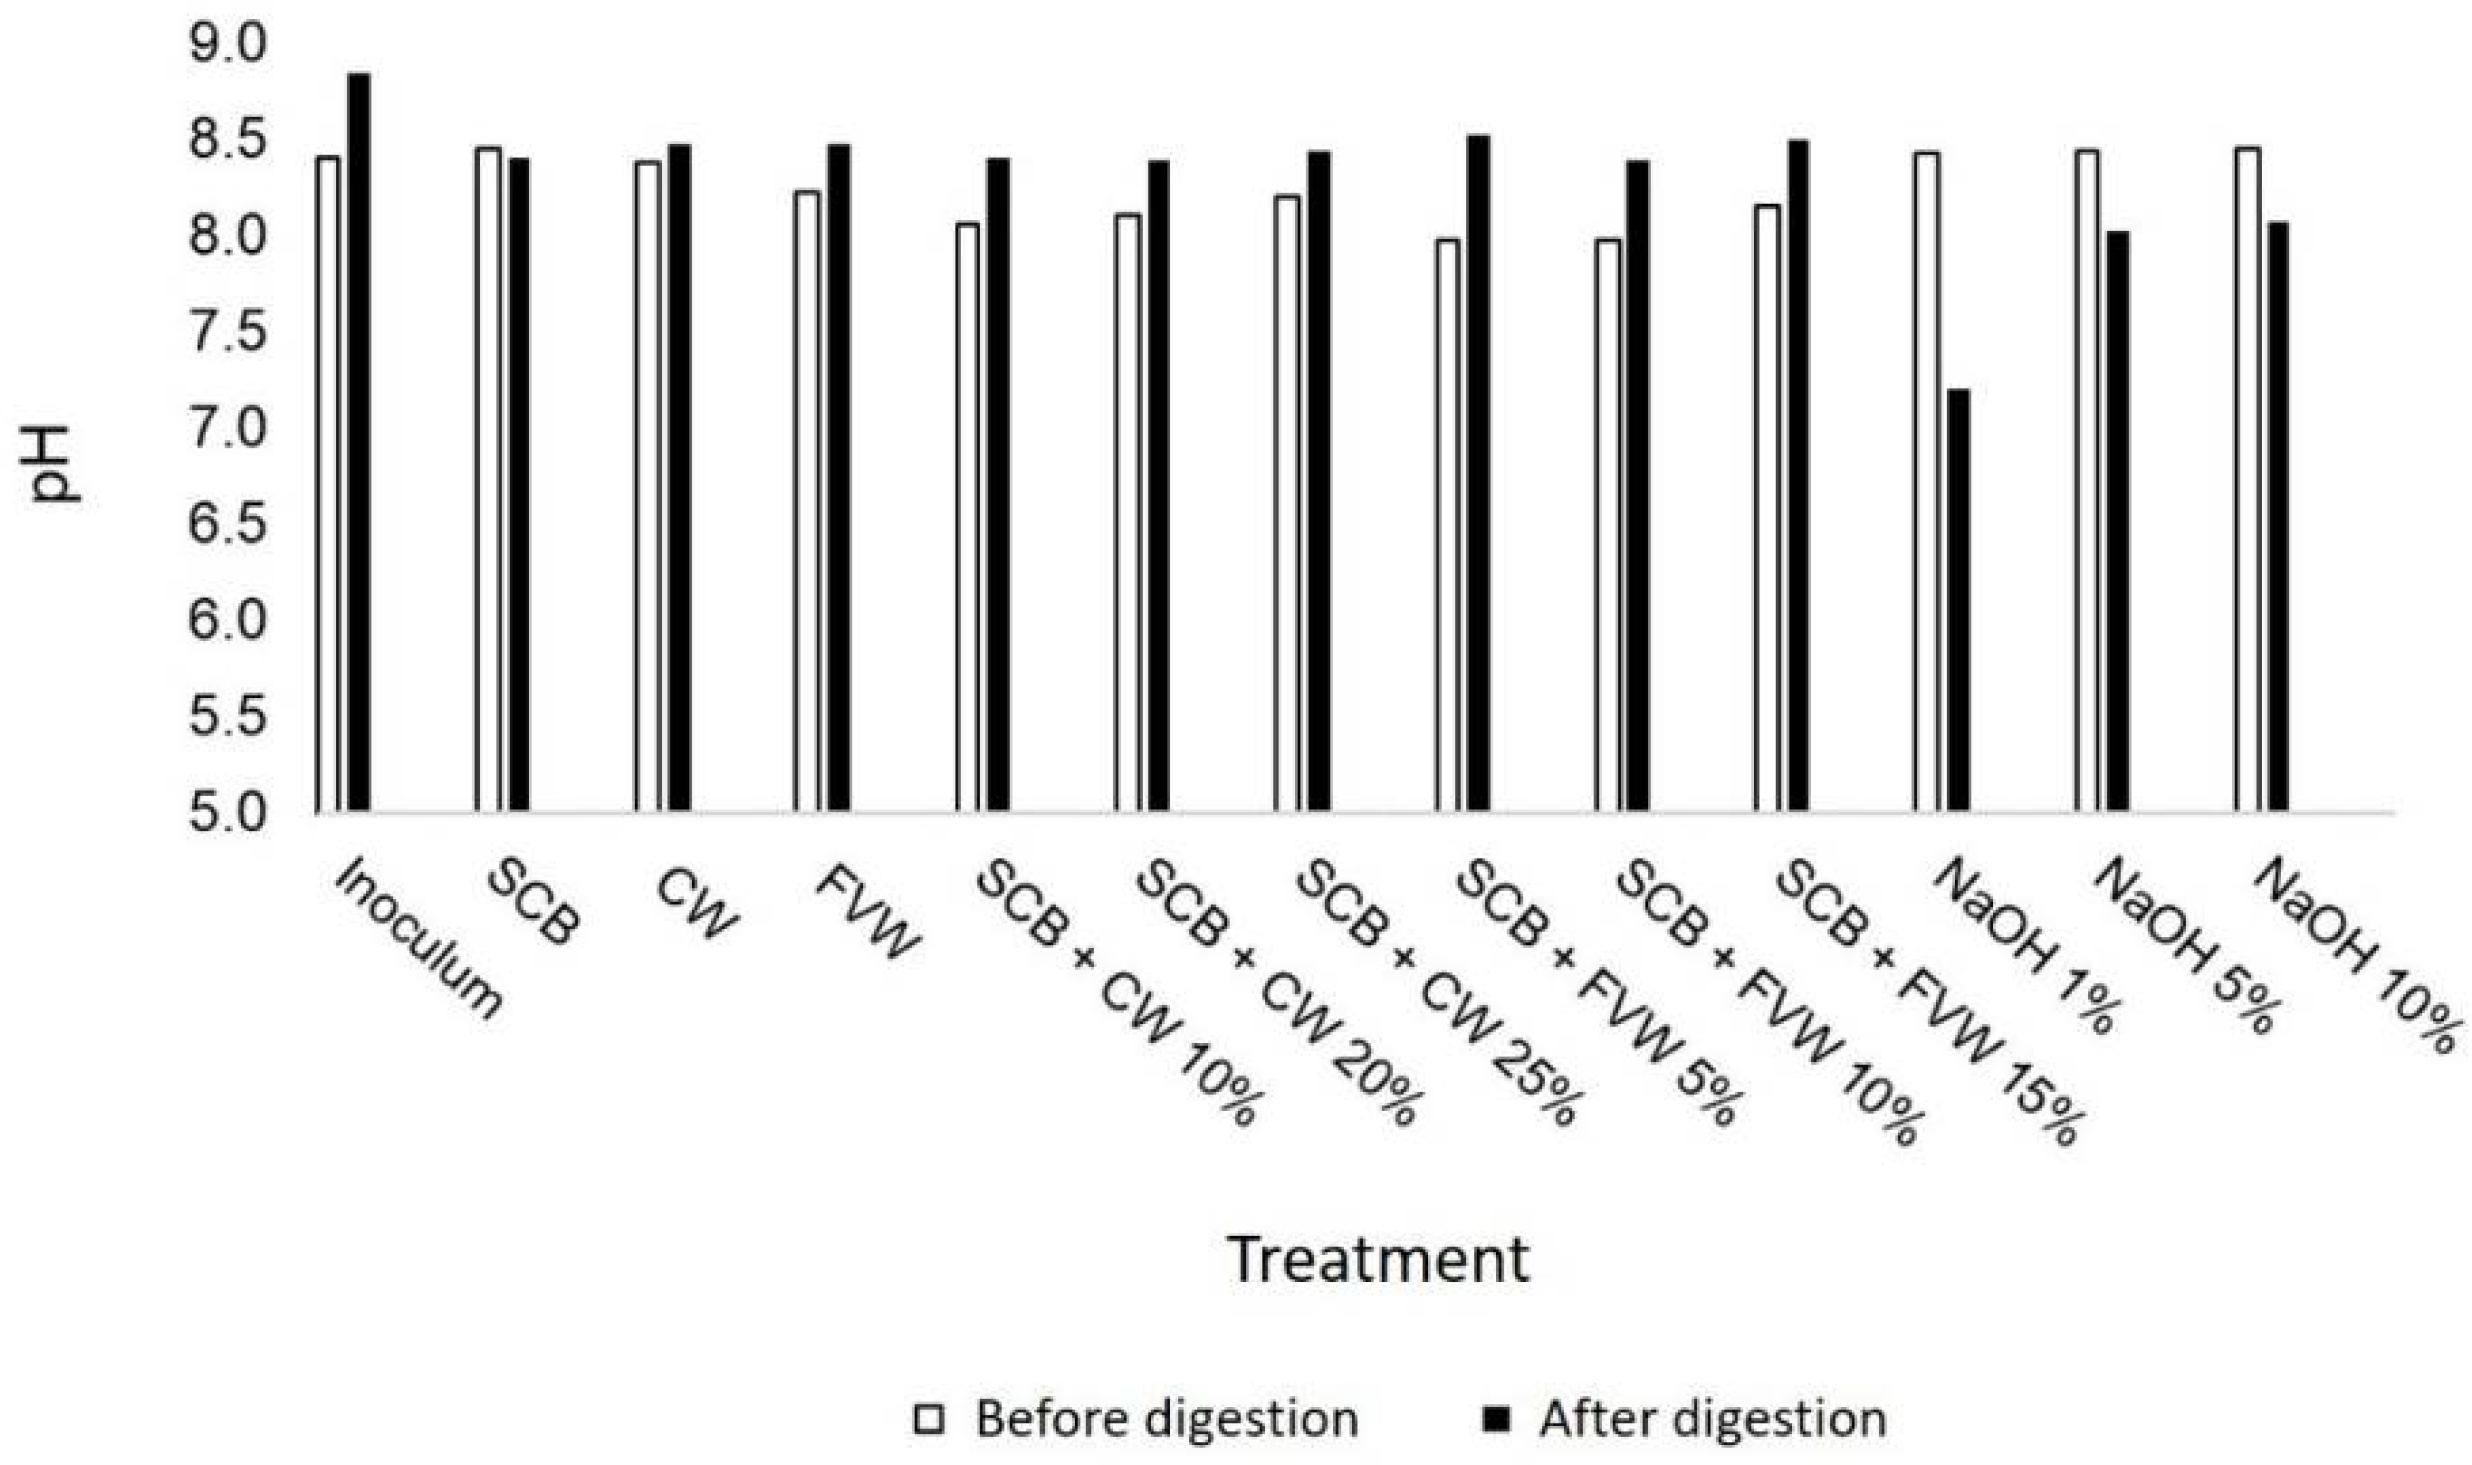
3.3. Effect of Alkaline Pretreatment on Methane Potential of SCB (Experiment II)

The BMP of the untreated SCB used in experiment II was 246 NL CH4 kg VS–1 (Table 3), which was lower than that of the untreated SCB obtained from the experiment I. Even though the SCB sample was frozen at −20 °C between experiments, humidity loss due to the freezing/thawing process was observed. The TS content of the SCB was 38.3% in experiment I and 43.9% in experiment II. However, very similar VS/TS proportions of 97.7% and 98.2% were detected in both situations, resulting in a similar biogas yield of 195 L kg SCB–1 (experiment I) and 201 L kg SCB–1 (experiment II) on a fresh matter basis.
The BMP of the SCB pretreated with NaOH at 1% was 223 NL CH4 kg VS–1, resulting in an antagonistic effect (α = −9.1) (Table 3). The mild-alkaline solution (i.e., 1%) showed a weak capacity to increase cellulose and hemicellulose accessibility, and in addition, it could have partially removed other organic compounds, such as lipids, proteins, and simple sugars during the washing process, which can decrease the methane yield of the pretreated bagasse. The hemicellulose and lignin solubilized by the mild alkaline pretreatment with NaOH can also be lost during the washing process, as investigated by Vasmara et al. [29], who reported 16% and 25% losses of lignin and hemicellulose after mild alkaline pretreatment with KOH. The lower Khyd of 0.13 d–1 for the pretreated SCB with NaOH at 1% than that of 0.20 d–1 for the untreated SCB also highlights this effect.
Increasing the concentration of the NaOH during pretreatments resulted in a synergistic effect (α > 1). Alkaline pretreatment causes swelling in the lignocellulosic cell wall, which increases the internal surface area, decreases the degree of polymerization of these compounds, and breaks the ester bonds that keep them strongly linked. These physical changes in the biomass structure make it more accessible to anaerobic microorganisms [42]. The BMP of SCB pretreated with NaOH at 5% and 10% were 298 NL CH4 kg VS–1 (α = 21.2) and 330 NL CH4 kg VS–1 (α = 34.1), respectively (Table 3). These values were similar to the ones reported by Remor et al. [28] (α = 19.9%) SCB pretreated with NaOH at 5.5% for 12 h when compared to the untreated substrate. El Achkar et al. [43] also reported 20% and 36% higher BMP with grape pomace pretreated with NaOH at 6% and 10% NaOH. Agarwal et al. [40] investigated several references for the pretreatment effect applied to SCB using different alkaline solutions with concentrations between 1 and 10% and which also reported α in the range of 3–30%. The Khyd of the pretreated SCB with 5% and 10% NaOH were higher (0.27–0.28 d–1) than those of the untreated bagasse (0.20 d–1). However, increasing the concentration of the alkaline solution from 5% to 10% did not cause any proportional enhancement in the hydrolysis rate, and the time delay was increased from 1.3 to 1.5 day. A higher time delay was observed for all chemically pretreated samples (1.3 to 1.9 day) than that for untreated bagasse (0.1 day) because, even after washing, some fraction of the chemical solution may have remained stuck to the biomass, limiting its initial degradation.
Degradation rates and time delay together with biogas and methane yields are essential to help decision making during the design of biogas plants. The comparable results in terms of a traditional alkaline pretreatment with the pre-hydrolysis strategy with acidic biowastes evidence the benefits of a mild condition created by the treatment of two types of organic waste, which can also benefit higher-scale operations due to the very low cost of co-substrate management and digestate post-treatment.

4. Conclusions

FVW proved to be a more effective catalytic biowaste than CW to improve the biodegradability of SCB after the pre-hydrolysis strategy. The best result was obtained by mixing SCB with FVW in the proportion of 5:95 fresh weight basis, with 27.6% increase in methane yield when compared to the mono-digestion of SCB and FVW. Alkaline pretreatment with NaOH at 5% and 10% concentrations also increased the methane yield of SCB by 21.2% and 34.1%, respectively. However, mixing low-moisture lignocellulosic wastes with a high-moisture acidic biowaste, such as FVW, generated comparable benefits in terms of the bioconversion of organic matter into methane. In addition, T90 was reduced from 13 to only 7 days when the organic pre-hydrolysis with FVW was applied. This sustainable strategy does not require the addition of chemicals or the subsequent treatment of potentially toxic effluents, therefore contributing to the environmental footprint of the pretreatment process while improving the economic feasibility of the real-scale operation. It is suggested in future studies the determination of the lignocellulose content of the solid fraction after the pretreatments to evaluate the cellulose degradation promoted by them.

Author Contributions

Conceptualization, T.E. and J.H.L.A.; Formal analysis, J.H.L.A., J.A.B. and P.V.R.; Investigation, J.H.L.A., F.O., L.M.F.; Methodology, F.M.D.; Supervision, T.E.; Validation, T.E.; Writing—original draft, J.H.L.A., J.A.B. and T.E. All authors have read and agreed to the published version of the manuscript.

Funding

Paula Veronica Remor acknowledges FCT for the Ph.D. grant (SFRH/BD/07543/2020).

Informed Consent Statement

Not applicable.

Conflicts of Interest

The authors declare no conflict of interest.

References

  1. Kumar, B.; Bhardwaj, N.; Agrawal, K.; Chaturvedi, V.; Verma, P. Current perspective on pretreatment technologies using lignocellulosic biomass: An emerging biorefinery concept. Fuel Process. Technol. 2020, 199, 106244. [Google Scholar] [CrossRef]
  2. REN21. Renewables 2020—Global Status Report; 2020 Update; REN21: Paris, France, 2020; ISBN 9783948393007. [Google Scholar]
  3. Anu, K.A.; Rapoport, A.; Kunze, G.; Kumar, S.; Singh, D.; Singh, B. Multifarious pretreatment strategies for the lignocellulosic substrates for the generation of renewable and sustainable biofuels: A review. Renew. Energy 2020, 160, 1228–1252. [Google Scholar] [CrossRef]
  4. Rivera, E.C.; Yamakawa, C.K.; Saad, M.B.W.; Atala, D.I.P.; Ambrosio, W.B.; Bonomi, A.; Junior, J.N.; Rossell, C.E.V. Effect of temperature on sugarcane ethanol fermentation: Kinetic modeling and validation under very-high-gravity fermentation conditions. Biochem. Eng. J. 2017, 119, 42–51. [Google Scholar] [CrossRef]
  5. Nosratpour, M.J.; Karimi, K.; Sadeghi, M. Improvement of ethanol and biogas production from sugarcane bagasse using sodium alkaline pretreatments. J. Environ. Manag. 2018, 226, 329–339. [Google Scholar] [CrossRef] [PubMed]
  6. Daniyanto, S.; Deendarlianto, B.A. Torrefaction of Indonesian sugar-cane bagasse to improve bio-syngas quality for gasification process. Energy Procedia 2015, 68, 157–166. [Google Scholar] [CrossRef]
  7. Adarme, O.F.H.; Baêta, B.E.L.; Lima, D.R.S.; Gurgel, L.V.A.; Aquino, S.F. Methane and hydrogen production from anaerobic digestion of soluble fraction obtained by sugarcane bagasse ozonation. Ind. Crop. Prod. 2017, 109, 288–299. [Google Scholar] [CrossRef]
  8. Mari, A.G.; Secco, D.; Kunz, A.; Edwiges, T.; Mari Junior, A.; Frigo, E.P.; Alves, H.J. Performance of up-flow anaerobic digester in solids removal and biogas production. J. Food Agric. Environ. 2014, 12, 1135–1139. [Google Scholar]
  9. Martínez, E.J.; Rosas, J.G.; Sotres, A.; Moran, A.; Cara, J.; Sánchez, M.E.; Gómez, X. Codigestion of sludge and citrus peel wastes: Evaluating the effect of biochar addition on microbial communities. Biochem. Eng. J. 2018, 137, 314–325. [Google Scholar] [CrossRef]
  10. Wu, D.; Li, L.; Zhao, X.; Peng, Y.; Yang, P.; Peng, X. Anaerobic digestion: A review on process monitoring. Renew. Sustain. Energy Rev. 2019, 103, 1–12. [Google Scholar] [CrossRef]
  11. Baêta, B.E.L.; Lima, D.R.S.; Adarme, O.F.H.; Gurgel, L.V.A.; Aquino, S.F. Optimization of sugarcane bagasse autohydrolysis for methane production from hemicellulose hydrolyzates in a biorefinery concept. Bioresour. Technol. 2016, 200, 137–146. [Google Scholar] [CrossRef]
  12. Kainthola, J.; Kalamdhad, A.S.; Goud, V.V. A review on enhanced biogas production from anaerobic digestion of lignocellulosic biomass by different enhancement techniques. Process Biochem. 2019, 84, 81–90. [Google Scholar] [CrossRef]
  13. Guan, R.; Xiujin, L.; Wachemo, A.C.; Hairong, Y.; Yanping, L.; Dexun, Z.; Xiaoyu, Z.; Junyu, G. Enhancing anaerobic digestion performance and degradation of lignocellulosic components of rice straw by combined biological and chemical pretreatment. Sci. Total Environ. 2018, 637, 9–17. [Google Scholar] [CrossRef] [PubMed]
  14. Yu, Q.; Liu, R.; Li, K.; Ma, R. A review of crop straw pretreatment methods for biogas production by anaerobic digestion in China. Renew. Sustain. Energy Rev. 2019, 107, 51–58. [Google Scholar] [CrossRef]
  15. Liu, X.; Zicari, S.M.; Liu, G.; Li, Y.; Zhang, R. Improving the bioenergy production from wheat straw with alkaline pretreatment. Biosyst. Eng. 2015, 140, 59–66. [Google Scholar] [CrossRef]
  16. Edwiges, T.; Bastos, J.A.; Alino, J.H.L.; D’Avila, L.; Frare, L.M.; Somer, J.G. Comparison of various pretreatment techniques to enhance biodegradability of lignocellulosic biomass for methane production. J. Environ. Chem. Eng. 2019, 7, 103–195. [Google Scholar] [CrossRef]
  17. Vervaeren, H.; Hostyn, K.; Ghekiere, G.; Willems, B. Biological ensilage additives as pretreatment for maize to increase the biogas production. Renew. Energy 2010, 35, 2089–2093. [Google Scholar] [CrossRef]
  18. Bochmann, G.; Montgomery, L.F.R. Storage and pre-treatment of substrates for biogas production. In The Biogas Handbook; Elsevier: Amsterdam, The Netherlands, 2013; pp. 85–103. [Google Scholar]
  19. Chen, Y.; Sharma-Shivappa, R.R.; Chen, C. Ensiling agricultural residues for bioethanol production. Appl. Biochem. Biotechnol. 2007, 143, 80–92. [Google Scholar] [CrossRef]
  20. FAO. FAO Statistical Yearbook 2014: Latin America and the Caribbean Food and Agriculture; FAO: Santiago, Chile, 2014. [Google Scholar]
  21. Edwiges, T.; Frare, L.; Mayer, B.; Lins, L.; Triolo, J.L.; Flotats, X.; Costa, M.S.S.M. Influence of chemical composition on biochemical methane potential of fruit and vegetable waste. Waste Manag. 2018, 71, 618–625. [Google Scholar] [CrossRef]
  22. Prazeres, A.R.; Carvalho, F.; Rivas, J. Cheese whey management: A review. J. Environ. Manag. 2012, 110, 48–68. [Google Scholar] [CrossRef]
  23. Brazilian Agricultural Research Company. Yearbook of Milk; EMBRAPA: Brasilia, Brazil, 2018; p. 103. [Google Scholar]
  24. Holliger, C.; Alves, M.; Andrade, D.; Angelidaki, I.; Astals, S.; Baier, U.; Bougrier, C.; Buffiere, P.; Carballa, M.; de Wilde, V.; et al. Towards a standardization of biomethane potential tests. Water Sci. Technol. 2016, 74, 2515–2522. [Google Scholar] [CrossRef]
  25. Steinmetz, R.L.R.; Mezzari, M.P.; Da Silva, M.L.B.; Kunz, A.; Do Amaral, A.C.; Tápparo, D.C.; Soares, H.M. Enrichment and acclimation of an anaerobic mesophilic microorganism’s inoculum for standardization of BMP assays. Bioresour. Technol. 2016, 219, 21–28. [Google Scholar] [CrossRef] [PubMed]
  26. VDI Verein Deutscher Ingenieure. Fermentation of Organic Materials: Characterization of the Substrate, Sampling, Collection of Material Data, Fermentation Tests; Verein Deutscher Ingenieure: Berlin, Germany, 2016; p. 132. [Google Scholar]
  27. Bastos, J.A.; Remor, V.; Alino, J.H.L.; Frare, L.M.; Lofhagen, J.C.P.; Edwiges, T. Hydrolysate recycling improves economic feasibility of alkaline pretreatment for bioenergy production. J. Environ. Chem. Eng. 2021, 9, 1–8. [Google Scholar] [CrossRef]
  28. Remor, V.; Bastos, J.A.; Alino, J.H.L.; Frare, L.M.; Kaparaju, P.; Edwiges, T. Optimization of Chemical Solution Concentration and Exposure time in the Alkaline Pretreatment Applied to Sugarcane Bagasse for Methane Production. Environ. Technol. 2022, 1, 1–13. [Google Scholar] [CrossRef] [PubMed]
  29. Vasmara, C.; Cianchetta, S.; Marchetti, R.; Ceotto, E.; Galetti, S. Potassium hydroxide pre-treatment enhances methane yield from giant reed (Arundo donax L. ). Energies 2021, 14, 630. [Google Scholar] [CrossRef]
  30. Apha. Standard Methods for the Examination of Water and Wastewater, 21st ed.; American Public Health Association: Washington, DC, USA, 2017. [Google Scholar]
  31. Salo-Vaananen, P.; Koivistoinen, E. Determination of protein in foods: Comparison of net protein and crude protein (Nx6.25) values. Food Chem. 1996, 57, 27–31. [Google Scholar] [CrossRef]
  32. Van Soest, J.; Robertson, J.B.; Lewis, B.A. Methods for dietary fiber, neutral detergent fiber, and non-starch polysaccharides in relation to animal nutrition. J. Dairy Sci. 1991, 74, 3583–3597. [Google Scholar] [CrossRef]
  33. Nielfa, A.; Cano, R.; Fdz-Polanco, M. Theoretical methane production generated by the co-digestion of organic fraction municipal solid waste and biological sludge. Biotechnol. Rep. 2015, 5, 14–21. [Google Scholar] [CrossRef]
  34. Kafle, G.K.; Chen, L. Comparison on batch anaerobic digestion of five different livestock manures and prediction of biochemical methane potential (BMP) using different statistical models. Waste Manag. 2016, 48, 492–502. [Google Scholar] [CrossRef]
  35. Leite, A.F.; Janke, L.; Harms, H.; Zang, J.W.; Fonseca-Zang, W.A.; Stinner, W.; Nikolausz, M. Assessment of the Variations in Characteristics and Methane Potential of Major Waste Products from the Brazilian Bioethanol Industry along an Operating Season. Energy Fuels 2015, 29, 4022–4029. [Google Scholar] [CrossRef]
  36. Risner, D.; Tomasino, E.; Hughes, P.; Meunier-Goddik, L. Volatile aroma composition of distillates produced from fermented sweet and acid whey. J. Dairy Sci. 2019, 102, 202–210. [Google Scholar] [CrossRef]
  37. Janke, L.; Leite, A.; Nikolausz, M.; Schmidt, T.; Liebetrau, J.; Nelles, M.; Stinner, W. Biogas Production from Sugarcane Waste: Assessment on Kinetic Challenges for Process Designing. Int. J. Mol. Sci. 2015, 16, 20685–20703. [Google Scholar] [CrossRef] [PubMed]
  38. Lopez, V.M.; De La Cruz, F.B.; Barlaz, M.A. Chemical composition and methane potential of commercial food wastes. Waste Manag. 2016, 56, 477–490. [Google Scholar] [CrossRef] [PubMed]
  39. Escalante, H.; Castro, L.; Amaya, M.P.; Jaimes, L.; Jaimes-Estévez, J. Anaerobic digestion of cheese whey: Energetic and nutritional potential for the dairy sector in developing countries. Waste Manag. 2018, 71, 711–718. [Google Scholar] [CrossRef] [PubMed]
  40. Agarwal, N.K.; Kumar, M.; Ghosh, P.; Kumar, S.S.; Singh, L.; Vijay, V.K.; Kumar, V. Anaerobic digestion of sugarcane bagasse for biogas production and digestate valorization. Chemosphere 2022, 295, 133893. [Google Scholar] [CrossRef] [PubMed]
  41. Gomes, S.D.; Fuess, L.T.; Mañunga, T.; Gomes, C.F.L.; Zaiat, M. Bacteriocins of lactic acid bacteria as a hindering factor for biohydrogen production from cassava flour wastewater in a continuous multiple tube reactor. Int. J. Hydrog. Energy 2016, 41, 8120–8131. [Google Scholar] [CrossRef]
  42. Kaur, M.; Verma, Y.P.; Chauhan, S. Effect of chemical pretreatment of sugarcane bagasse on biogas production. Mater. Today Proc. 2020, 21, 1937–1942. [Google Scholar] [CrossRef]
  43. El Achkar, J.H.; Lendormi, T.; Salameh, D.; Louka, N.; Maroun, R.G.; Lanoisellé, J.; Hobaika, Z. Influence of pretreatment conditions on lignocellulosic fractions and methane production from grape pomace. Bioresour. Technol. 2018, 247, 881–889. [Google Scholar] [CrossRef]
Figure 1. The pH of pre-stored mixtures from SCB + FVW and SCB + CW at different proportions. SCB: sugarcane bagasse; FVW: fruit and vegetable waste; CW: cheese whey waste.
Methane 01 00015 g001
Figure 2. The pH before and after anaerobic digestion batch tests of differently pre-stored mixtures of sugar cane bagasse (SCB), fruit and vegetable waste (FVW), and cheese whey waste (CW).
Methane 01 00015 g002
Figure 3. Biogas yield (a) and daily biogas production (b) from mono-digestion of sugarcane bagasse (SCB), fruit and vegetable (FVW), and cheese whey (CW).
Methane 01 00015 g003
Table 1. Pretreatment conditions.
TreatmentPretreament
Strategy
Mass of the
Catalytic Residue
or NaOH
Proportions
(Fresh Weigh
Basis)
Proportions
(VS Basis)
TS of the Mixtures
(%)
1SCB pre-stored
with FVW
1 g SCB/19.0 g FVW5:95 (SCB:FVW)17:83 (SCB:FVW)11.9
21 g SCB/9.0 g FVW10:90 (SCB:FVW)30:70 (SCB:FVW)13.3
31 g SCB/5.7 g FVW15:85 (SCB:FVW)40:60 (SCB:FVW)14.7
4SCB pre-stored
with CW
1 g SCB/9.0 g CW10:90 (SCB:CW)40:60 (SCB:CW)10.0
51 g SCB/4.0 g CW20:80 (SCB:CW)60:40 (SCB:CW)13.1
61 g SCB/3.0 g CW25:75 (SCB:CW)66:34 (SCB:CW)14.7
7SCB pretreated
with NaOH
1 g SCB/0.04 g NaOHNaOH 1%N.A8.5
81 g SCB/0.18 g NaOHNaOH 5%N.A12.3
91 g SCB/0.35 g NaOHNaOH 10%N.A16.3
SCB: sugarcane bagasse; FVW: fruit and vegetable waste; CW: cheese whey; TS: total solids. The mixtures were prepared on a fresh weight basis. N.A.: not applied.
Table 2. Characterization of the sugarcane bagasse, fruit and vegetable waste, and cheese whey.
SubstrateTSVSVS/TSpHCrude ProteinCrude
Lipid
CelluloseHemicelluloseLignin
(%)(%)(% VS)(% VS)(% VS)(% VS)(% VS)
SCB38.3 ± 0.137.4 ± 0.197.7N.D.2.3 ± 0.23.2 ± 0.430.5 ± 0.325.6 ± 0.85.2 ± 0.1
FVW10.5 ± 0.29.8 ± 0.193.84.7 ± 0.19.6 ± 0.15.0 ± 0.2N.D.N.D.N.D.
CW6.8 ± 0.16.3 ± 0.192.56.7 ± 0.112.1 ± 0.49.8 ± 0.2N.D.N.D.N.D.
SCB: sugarcane bagasse; FVW: fruit and vegetable waste; CW: cheese whey; TS: total solids; VS: volatile solids. N.D.: not determined.
Table 3. Summary of results from batch tests and kinetic analysis.
TreatmentBiogas Yield
(NL kg VS−1)
BMPE
(NL kg VS−1)
BMPC
(NL kg VS−1)
T90
(d)
Khyd
(d−1)
Tdelay
(d)
R2α
(%)
SCB523 ± 4330 ± 6N.A.130.180.10.999N.A.
FVW705 ± 10423 ± 6N.A.60.480.10.998N.A.
CW713 ± 9449 ± 6N.A.40.560.10.999N.A.
(1) SCB 5% + FVW 95%816 ± 10520 ± 740770.420.40.99927.6
(2) SCB 10% + FVW 90%771 ± 10437 ± 639580.370.30.99610.4
(3) SCB 15% + FVW 85%638 ± 7383 ± 438690.360.40.997−0.7
(4) SCB 10% + CW 90%583 ± 10345 ± 6381100.280.10.997−10.5
(5) SCB 20% + CW 80%587 ± 15338 ± 9365110.240.10.998−7.9
(6) SCB 25% + CW 75%536 ± 18309 ± 11353110.360.10.998−14.4
SCB1449 ± 11246 ± 6N.A.120.200.10.999N.A.
(7) SCB + NaOH 1%405 ± 13223 ± 7N.A.120.131.90.997−9.1
(8) SCB + NaOH 5%567 ± 28298 ± 15N.A.120.281.30.99821.2
(9) SCB + NaOH 10%632 ± 13330 ± 7N.A.120.271.50.99934.1
SCB: sugarcane bagasse; SCB1: untreated SCB used as a control in experiment II; FVW: fruit and vegetable waste; CW: cheese whey; BMPE: experimental biochemical methane potential; BMPC: methane yield calculated using Equation (5); T90: time to achieve 90% of the cumulative methane potential; Khyd: hydrolysis constant; R2: coefficient of determination of the kinetic analysis. α is the synergistic effect (percentage of increased/decreased BMP of treated SCB when compared to untreated SCB). N.A.: not applied. The mixtures SCB and FVW or CW were prepared on a fresh weight basis.
Publisher’s Note: MDPI stays neutral with regard to jurisdictional claims in published maps and institutional affiliations.

