Article

The Development of a Low-Cost Method for Monitoring Methane Leakage from the Subsurface of Natural Gas Fields

by
Muhammad Alfiza Farhan
1,2,*,
Yuichi Sugai
2,
Nuhindro Priagung Widodo
1 and
Syafrizal Syafrizal
1
1
Department of Mining Engineering, Bandung Institute of Technology, Bandung 40116, Indonesia
2
Department of Earth Resources Engineering, Kyushu University, Fukuoka 819-0395, Japan
*
Author to whom correspondence should be addressed.
Methane 2022, 1(1), 24-37; https://doi.org/10.3390/methane1010003
Submission received: 15 September 2021 / Revised: 6 December 2021 / Accepted: 10 December 2021 / Published: 16 December 2021

Abstract

:
The leakage of methane from the subsurface on the coalfield or natural gas field invariably becomes an important issue nowadays. In notable addition, materials such as activated carbon, zeolites, and Porapak have been successfully identified as adsorbents. Those adsorbents could adsorb methane at atmospheric pressure and room temperature. Therefore, in this scholarly study, a new method using adsorbents to detect points of methane leakage that can cover a wide-scale area was developed. In the beginning, the most capable adsorbent should be determined by quantifying adsorbed methane amount. Furthermore, checking the possibility of adsorption in the column diffusion and desorption method of adsorbents is equally necessary. The most capable adsorbent was activated carbon (AC), which can adsorb 1.187 × 10⁻³ mg-CH4/g-AC. Hereinafter, activated carbon successfully can adsorb methane through column diffusion, which simulates the situation of on-site measurement. The specific amount of adsorbed methane when the initial concentrations of CH4 in a bag were 200 ppm, 100 ppm, and 50 ppm was found to be 0.818 × 10⁻³ mg-CH4/g-AC, 0.397 × 10⁻³ mg-CH4/g-AC, 0.161 × 10⁻³ mg-CH4/g-AC, respectively. Desorption of activated carbon analysis shows that methane concentration increases during an hour in the temperature bath under 80 °C. In conclusion, soil methane leakage points can be detected using activated carbon by identifying the observed methane concentration increase.

1. Introduction

Methane (CH4) is an important greenhouse gas, with a global warming potential (GWP) 28–36 times that of carbon dioxide (CO2) in a time horizon of 100 years [1]. The European Environment Agency [2] has revealed that methane concentration doubled, from roughly 900 ppb to about 1800 ppb, over the past century. Coal and natural gas fields accumulated approximately 100 teragrams of atmospheric methane, which is the third-largest contribution of global methane emissions [3].
CH4 is produced in soils by anaerobic methanogenic microbes and consumed by aerobic methanotrophic bacteria under some circumstances [4]. Studies reported that the microseepage of methane from deep oil traps is typically viewed as a local source of atmospheric methane [5,6]. Correspondingly, the subsurface leakage of methane is measured to appropriately recognize the dynamics of gas migration on the areas of abandoned shafts, mine ventilation termination, closed and remediated coal mines [7]. It also showed methane can move to the surface along the mining-induced fracture zones, which are caused by mining activities.
Recently, a static flux chamber method has been applied to study methane leakage into the atmosphere on the natural gas and coalfield, e.g., in a natural gas field in Tarim Basin, China [8], oil and gas wells [9], abandoned shafts of coal mines [10]. The flux chamber method indicatively has a range of measurements between 0.1 ppm and 50 ppm with 0.25 ppb precision [11]. However, it is only suitable for point measurements, and it consumes considerable time because many flux chamber measurements must be needed [12].
A variety of microporous materials such as activated carbon (AC) and zeolites have been studied and developed for the physical adsorption of gas mixtures containing CO2 and CH4 [13,14]. Methane can be adsorbed by activated carbon under low pressure 1 bar at 303 K [15]. Meanwhile, Porapak is commonly used in a packed column of gas chromatography to adsorb methane. Therefore, a new alternative method using one of those three adsorbents, which is the best adsorbent to detect points of methane leakage on the wide-scale area of coal or natural gas fields was particularly studied.

2. Results

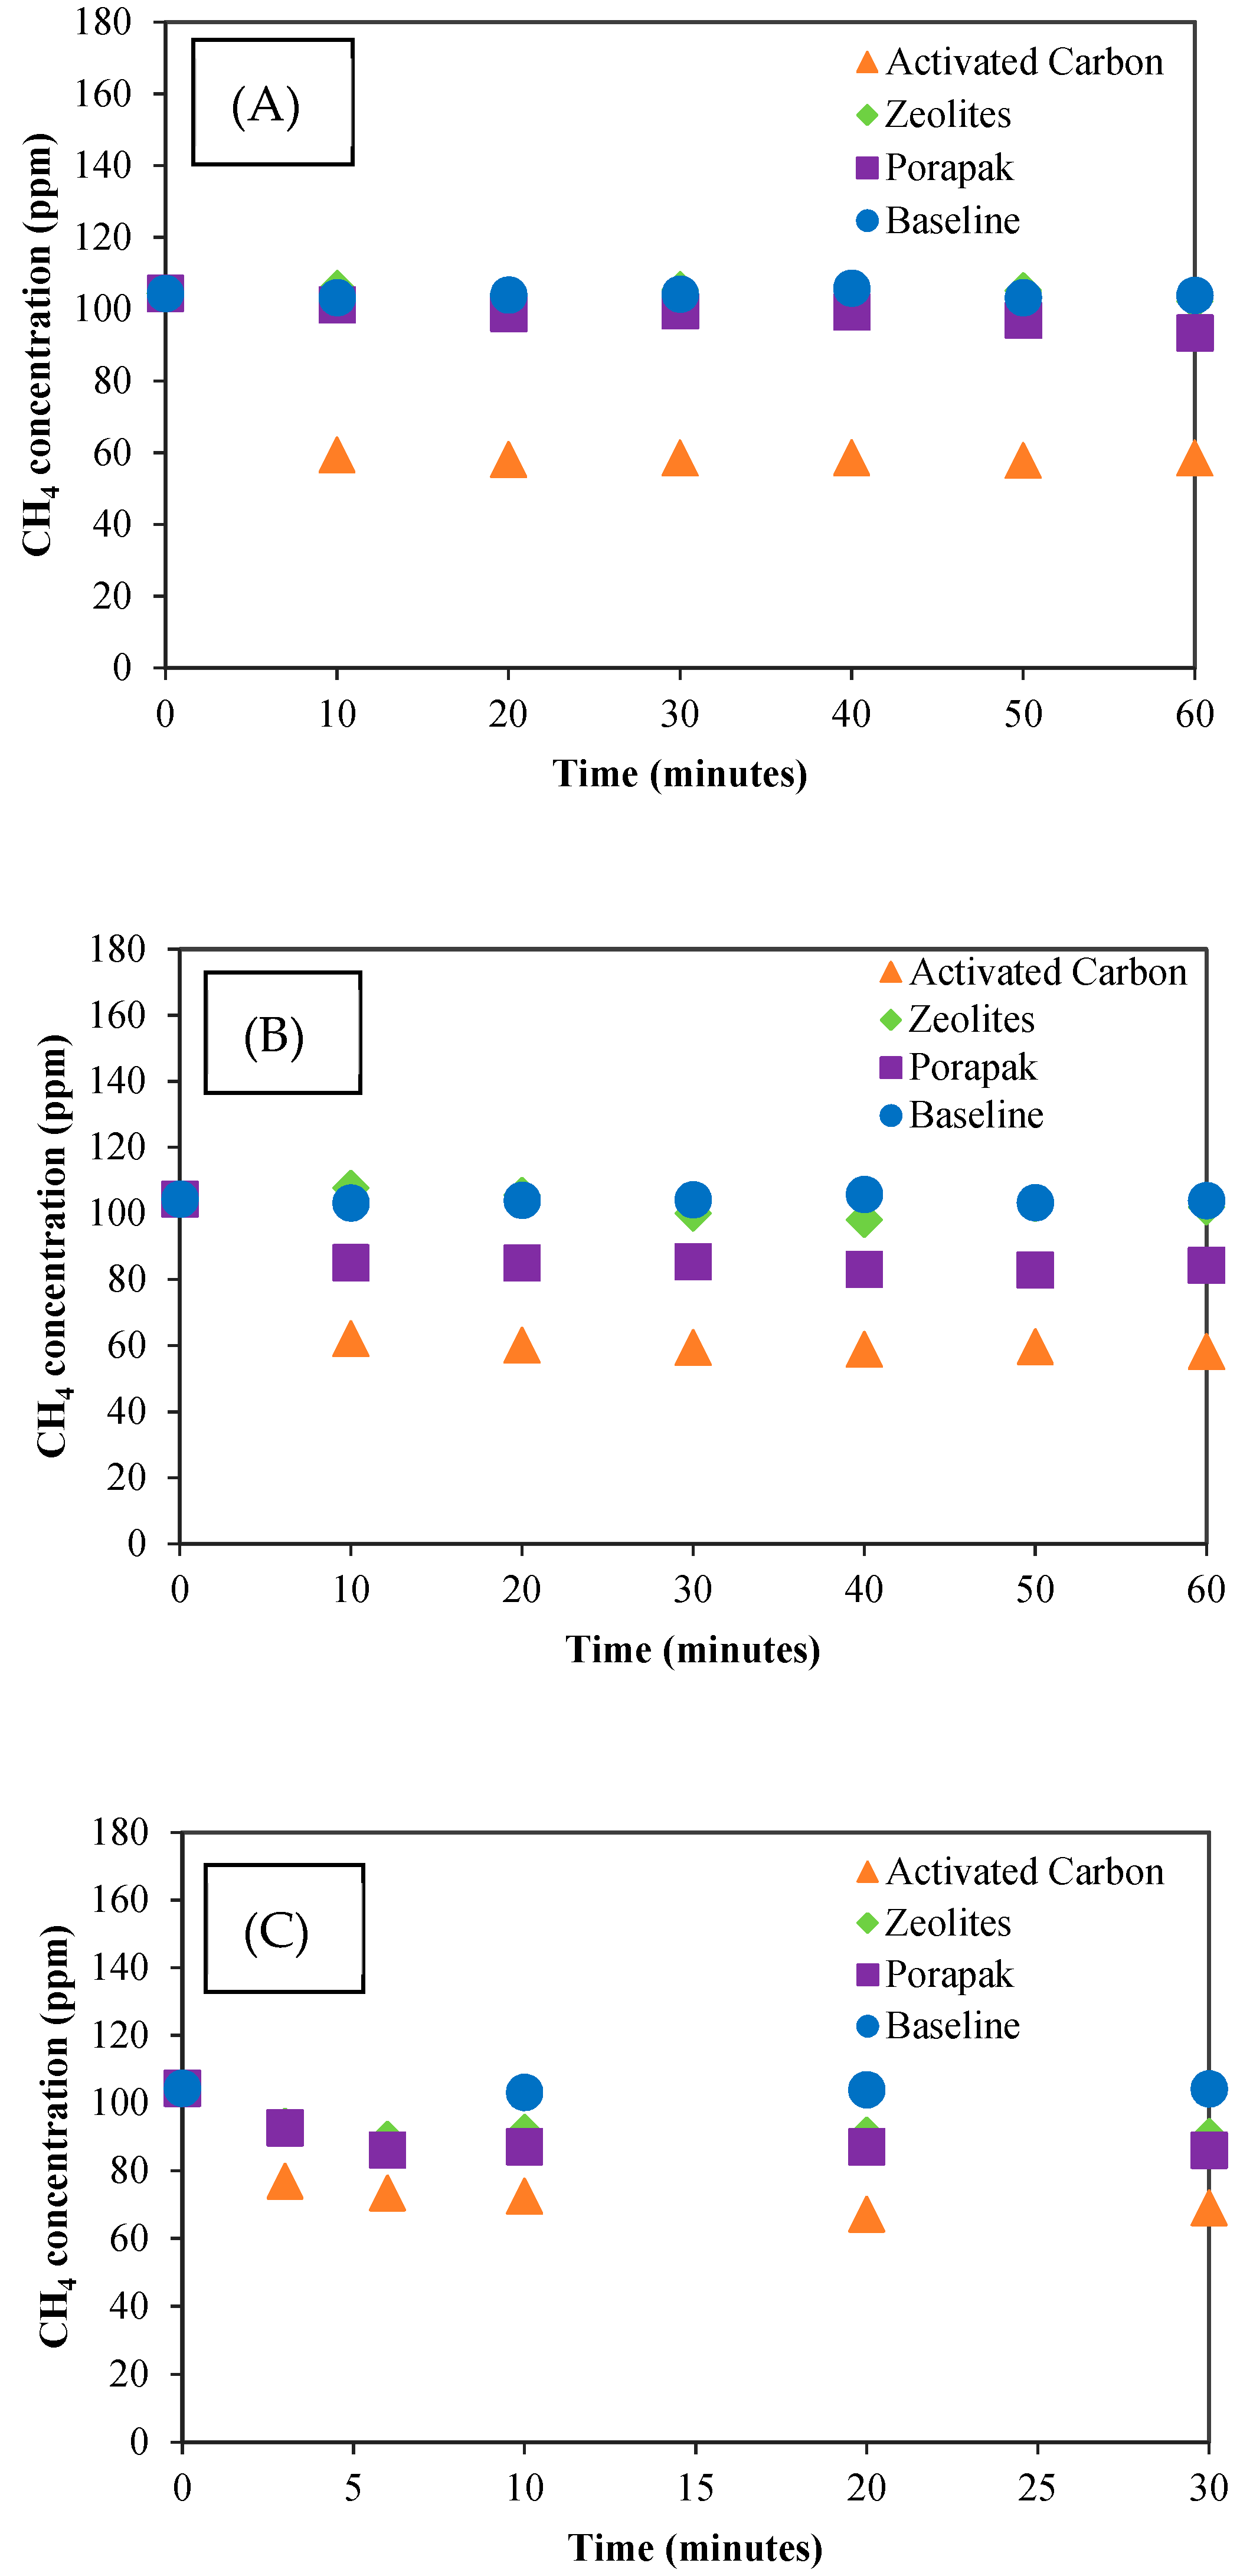
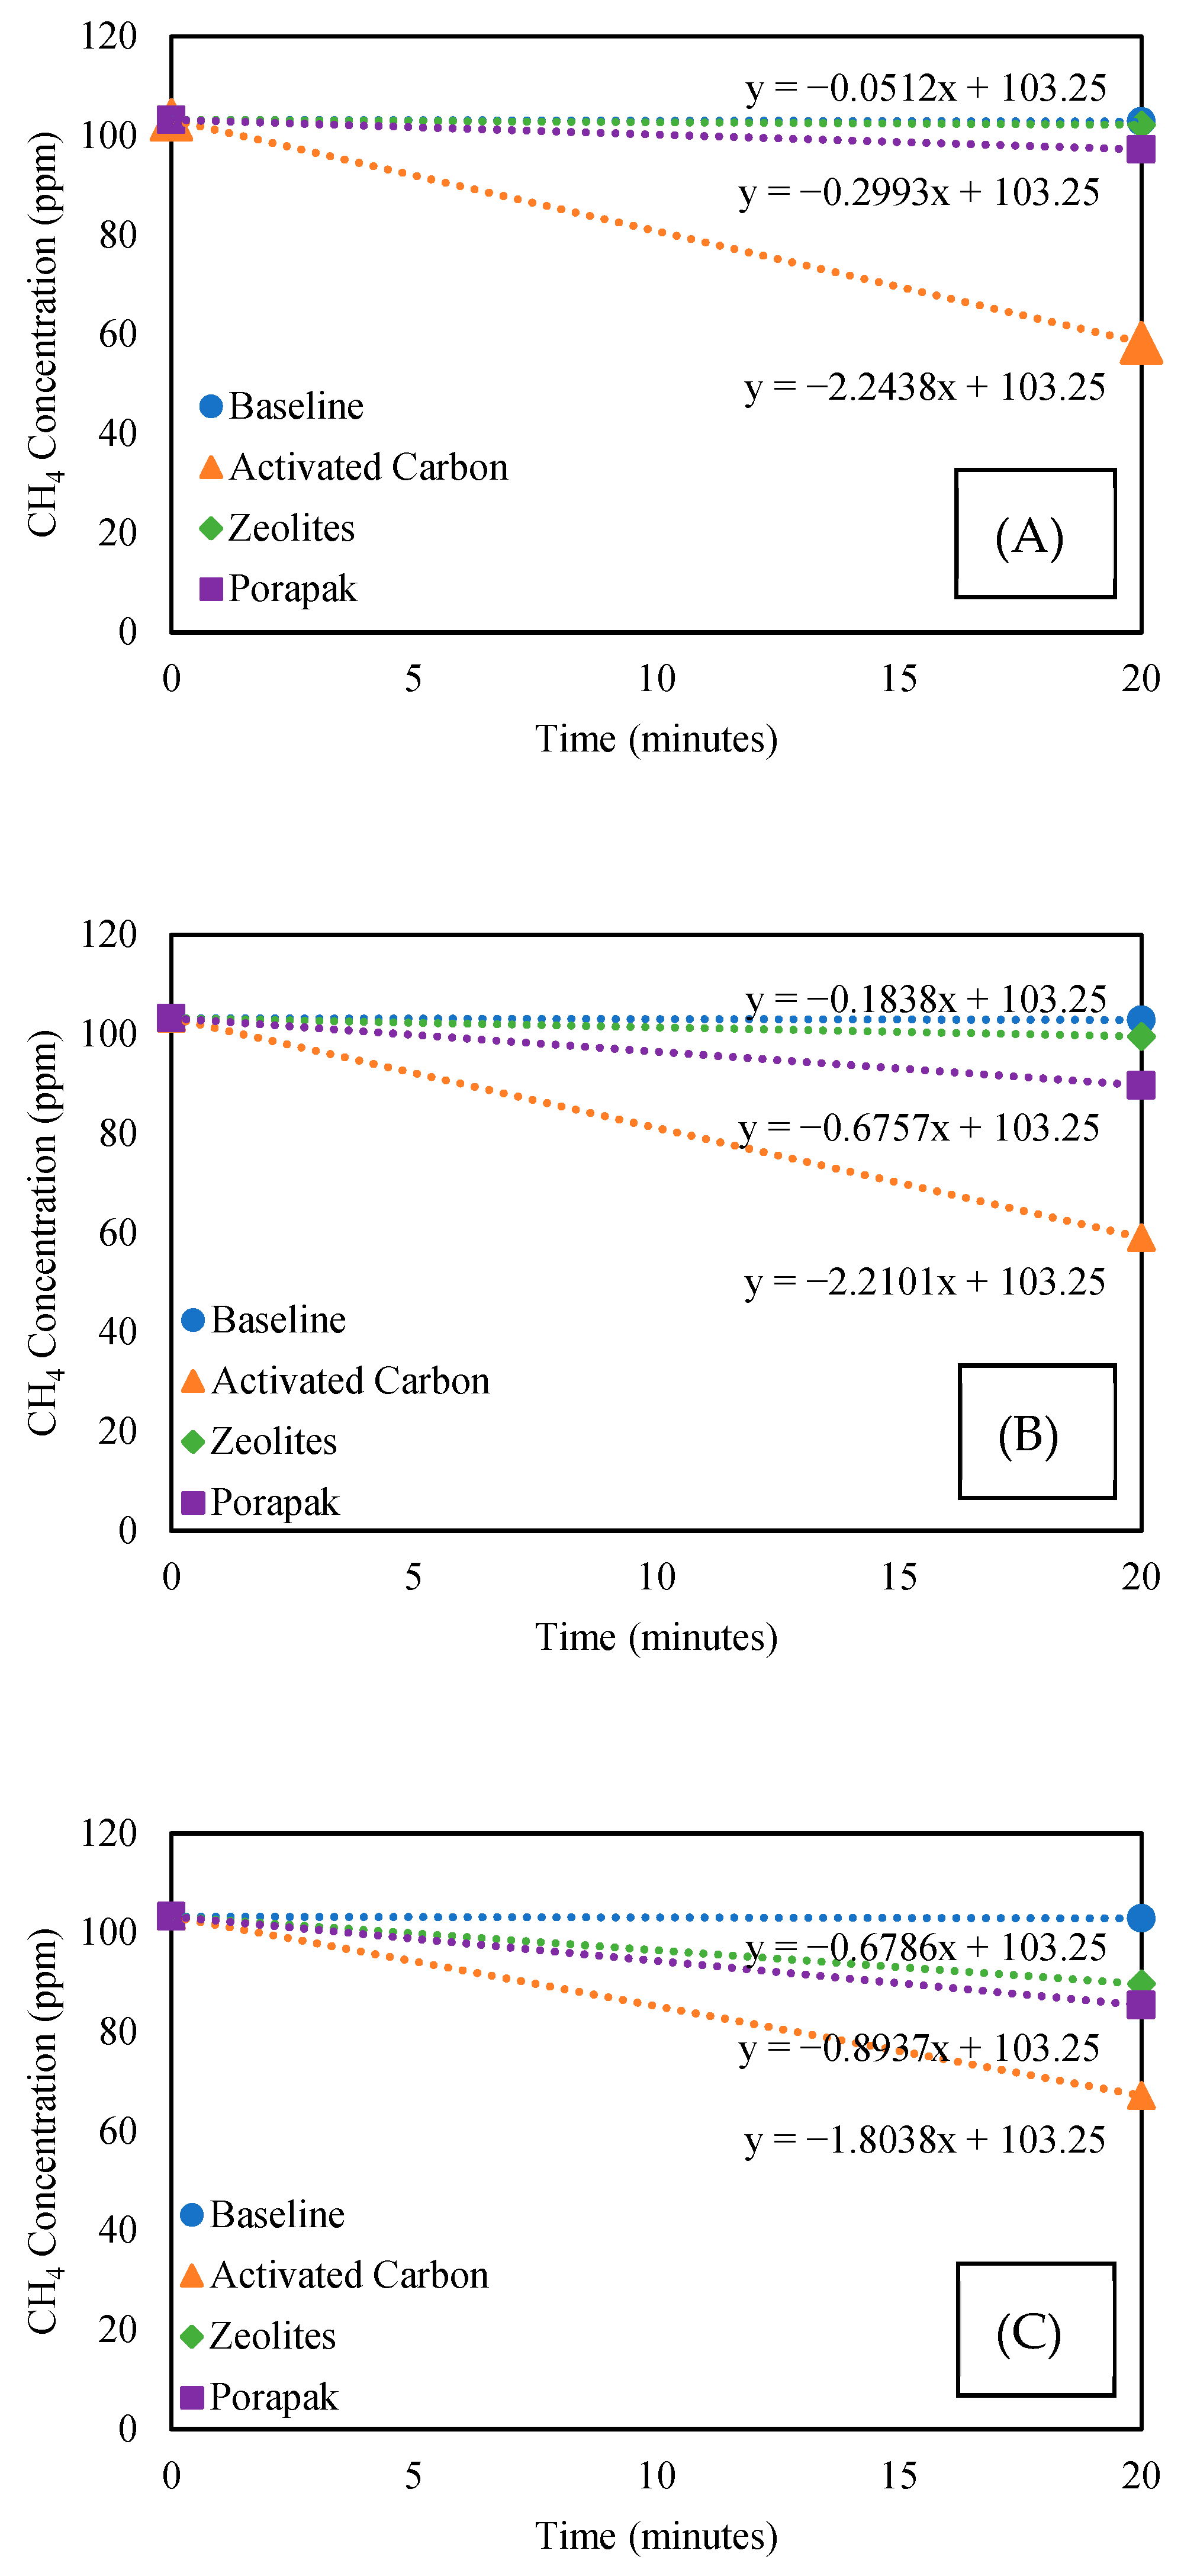
2.1. Screening Adsorbents

The experiment objectively evaluating the most potent adsorbent was successfully conducted. In this comprehensive study, commercial activated carbon, zeolites, and Porapak, with specific characteristics and properties, were used. Before the test, using the adsorbents, the baseline experiment was essentially conducted; briefly, methane concentration was analyzed for 60 min in the Tedlar bag that contained no adsorbents in it. Moreover, three mass variations of the adsorbents were prepared. Then, 5 g of the adsorbents was applied at the first attempt, then added 5 g increments of the adsorbents for the following experiments up to 15 g.
Activated carbon exhibited the best result (Figure 1). The final concentration of methane was persistently the lowest, compared with others (Figure 1), which means that more methane was adsorbed by activated carbon. The de-escalatory concentration of methane when using porapak and zeolites was positively below the baseline, but the reduction in concentration was not extremely significant (Figure 1). All in all, the decreased concentrations of methane when using the adsorbents were consistently below the baseline (Figure 1), indicating methane was successfully adsorbed onto the surface of the adsorbents.
Based on the results above, it can be inferred that the concentration was relatively stable after 20 min. A decrease in methane concentration was observed in the first 20 min. Therefore, the amount of adsorbed CH4 was calculated with time intervals of 20 min.
Adsorbed   CH 4 ( L g ) = ( Δ CH 4   concentration ) ×   Gas   bag   vol .   ( L ) Adsorbent   mass   ( g )
Adsorbed   CH 4 ( L g ) = ( 102.873 58.368 )   ppm   × 0.2   L 5   g = 1.780   ×   10 6   L CH 4 g AC
At room temperature, the volume of 1 mol gas is 24 L; therefore,
Adsorbed   CH 4 ( mg g ) = Adsorbed   CH 4 ( L g ) 24   L ×   Mr CH 4 ( g mol ) × 1000
Adsorbed   CH 4 ( mg g ) = 1.780 × 10 6 ( L g ) 24   L   ×   16 ( g mol ) × 1000 = 1.187   ×   10 3 mg CH 4 g AC
Activated carbon had the highest value of adsorbed methane volume by 1.187 × 10⁻³ mg-CH4/g-AC, followed by Porapak by 0.150 × 10⁻³ mg-CH4/g-P and zeolites by 0.017 × 10⁻³ mg-CH4/g-Z when 5 g of adsorbents were optionally used (Table 1). Nevertheless, the value amount of adsorbed CH4 of activated carbon degraded by proportionately increasing activated carbon mass, whereas zeolites demonstrated the opposite. The value of adsorbed CH4 was assumed to be the same. This discovered phenomenon is discussed in the next section.
Based on the results, a graph was generated to investigate the gradient of the methane concentration reduction line of each adsorbent, which varied by the determined mass of the adsorbent (Figure 2). Activated carbon displayed the lowest gradient, followed by Porapak and zeolites, even though the performance of the activated carbon decreased by gradually adding 5 g of it (Figure 2). This sufficiently confirmed the previous results (Table 1).
As can be seen in Table 1, the value of the volume of adsorbed CH4 by the activated carbon became lower by adding more 5 g increments of activated carbon. Contrastingly, the value of the volume of adsorbed CH4 by the zeolites became higher by adding more 5 g increments of zeolites. Porapak mass analytically had no significant effect on the volume of the amount of adsorbed CH4. To understand and interpret the underlying reasons behind these outcomes, further examination was carried out.
As previously mentioned, the same materials from the previous experiment were used, then added 5 g for the next examination. Identical experiments using the same adsorbent for the first and second measurements were then necessarily performed. The moderate changes in CH4 concentration were tracked for 20 min. This investigation was conducted as a particular reference for further experiments to investigate whether it is using the adsorbent more than once would become problematic.
As evident in the gradient of the methane concentration reduction line, the first and second measurements sufficiently reveal that activated carbon strongly decreased in terms of its adsorption performance when used for the second measurement (Figure 3A). The gradient of the second measurement tended to have a similar slope to the first, indicating there was no more methane adsorbed in the second measurement than in the first. All in all, fresh activated carbon could remarkably be used in every single subsequent experiment.
Zeolites and Porapak showed stable performance for the first and second measurements. That is why for every documented increase in the mass of the adsorbent, the value of the amount of adsorbed CH4 per gram of adsorbent quantitatively was almost the same (Table 1).

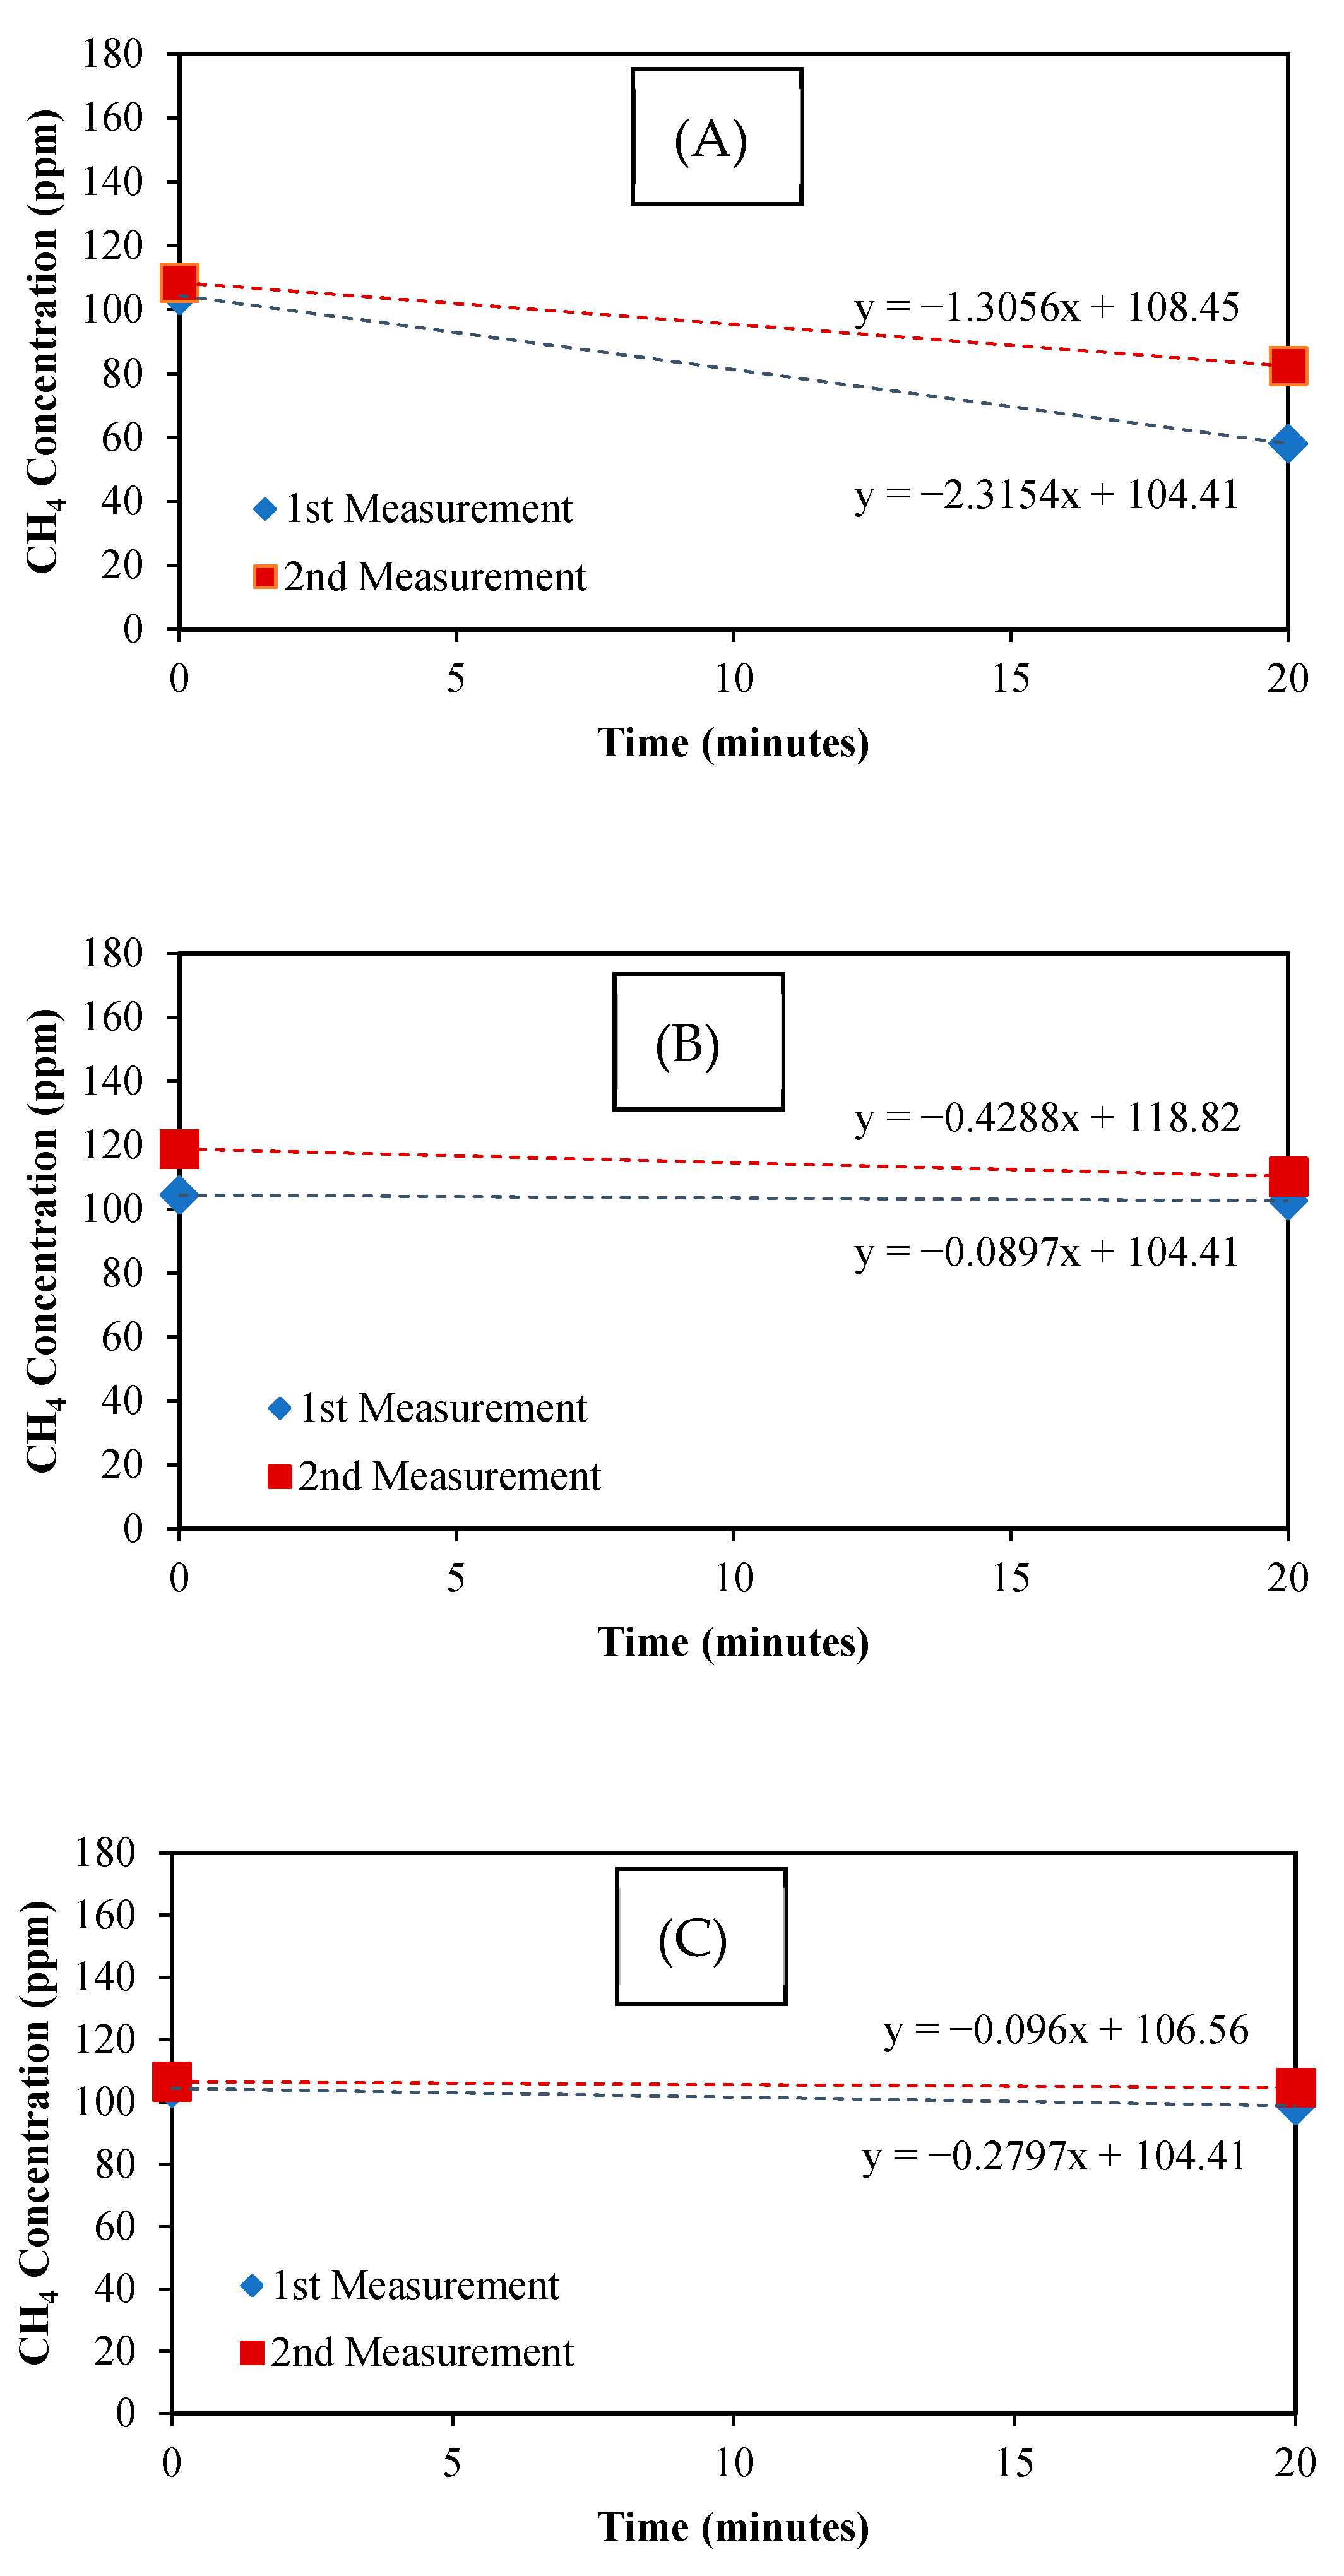
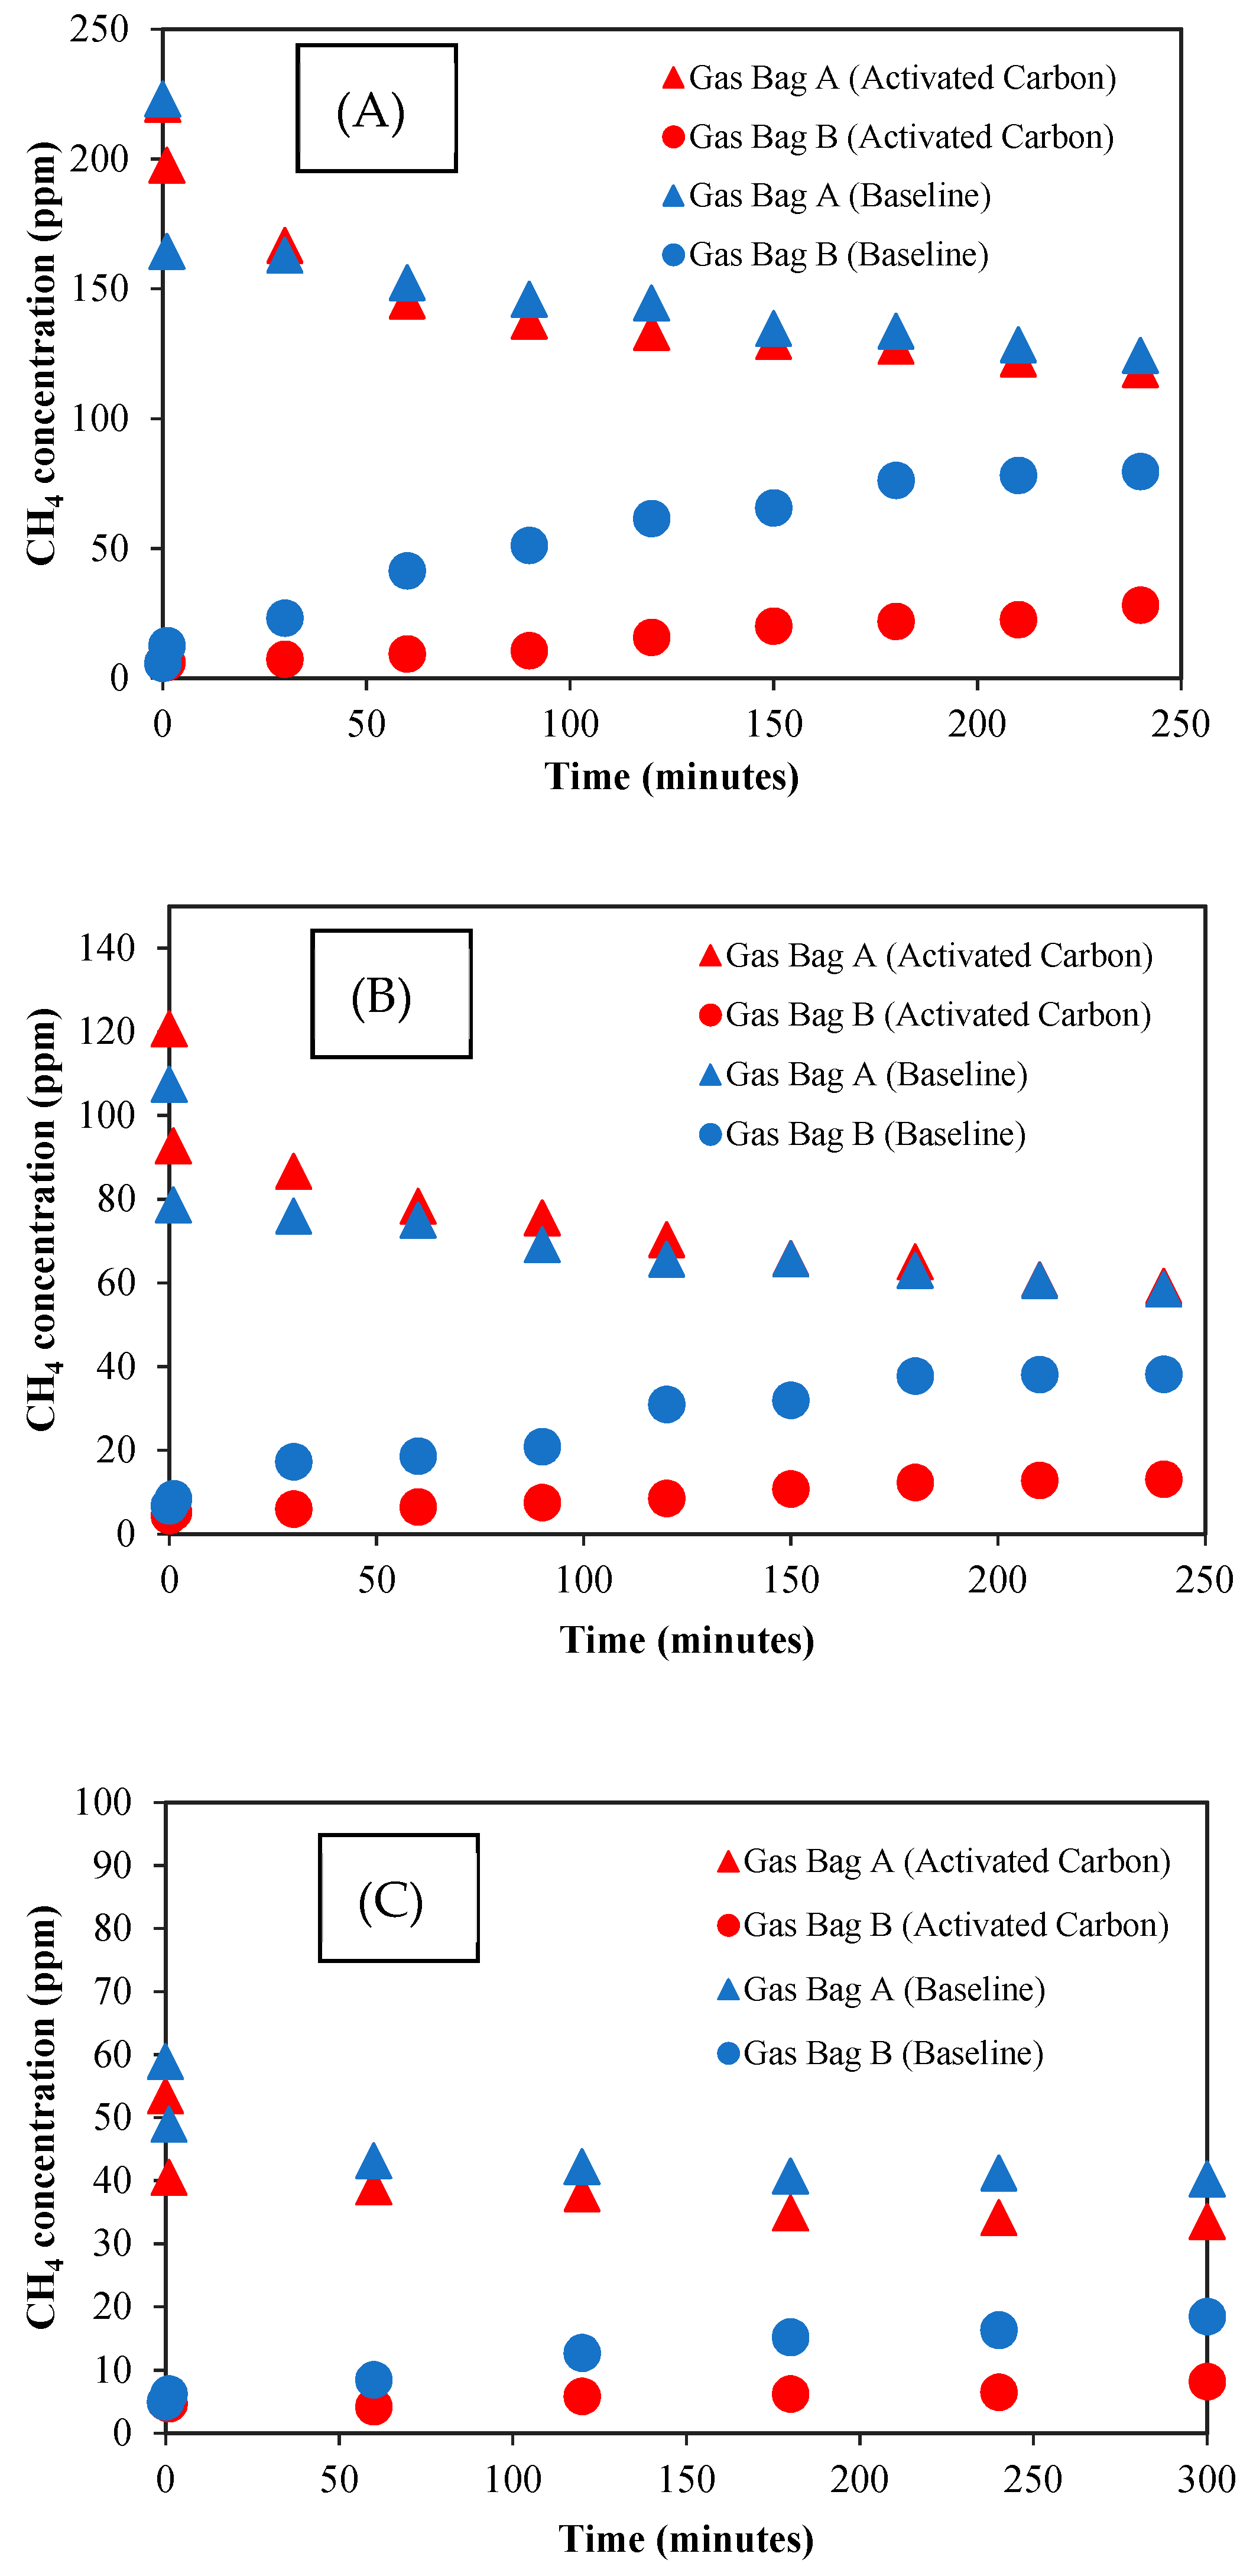
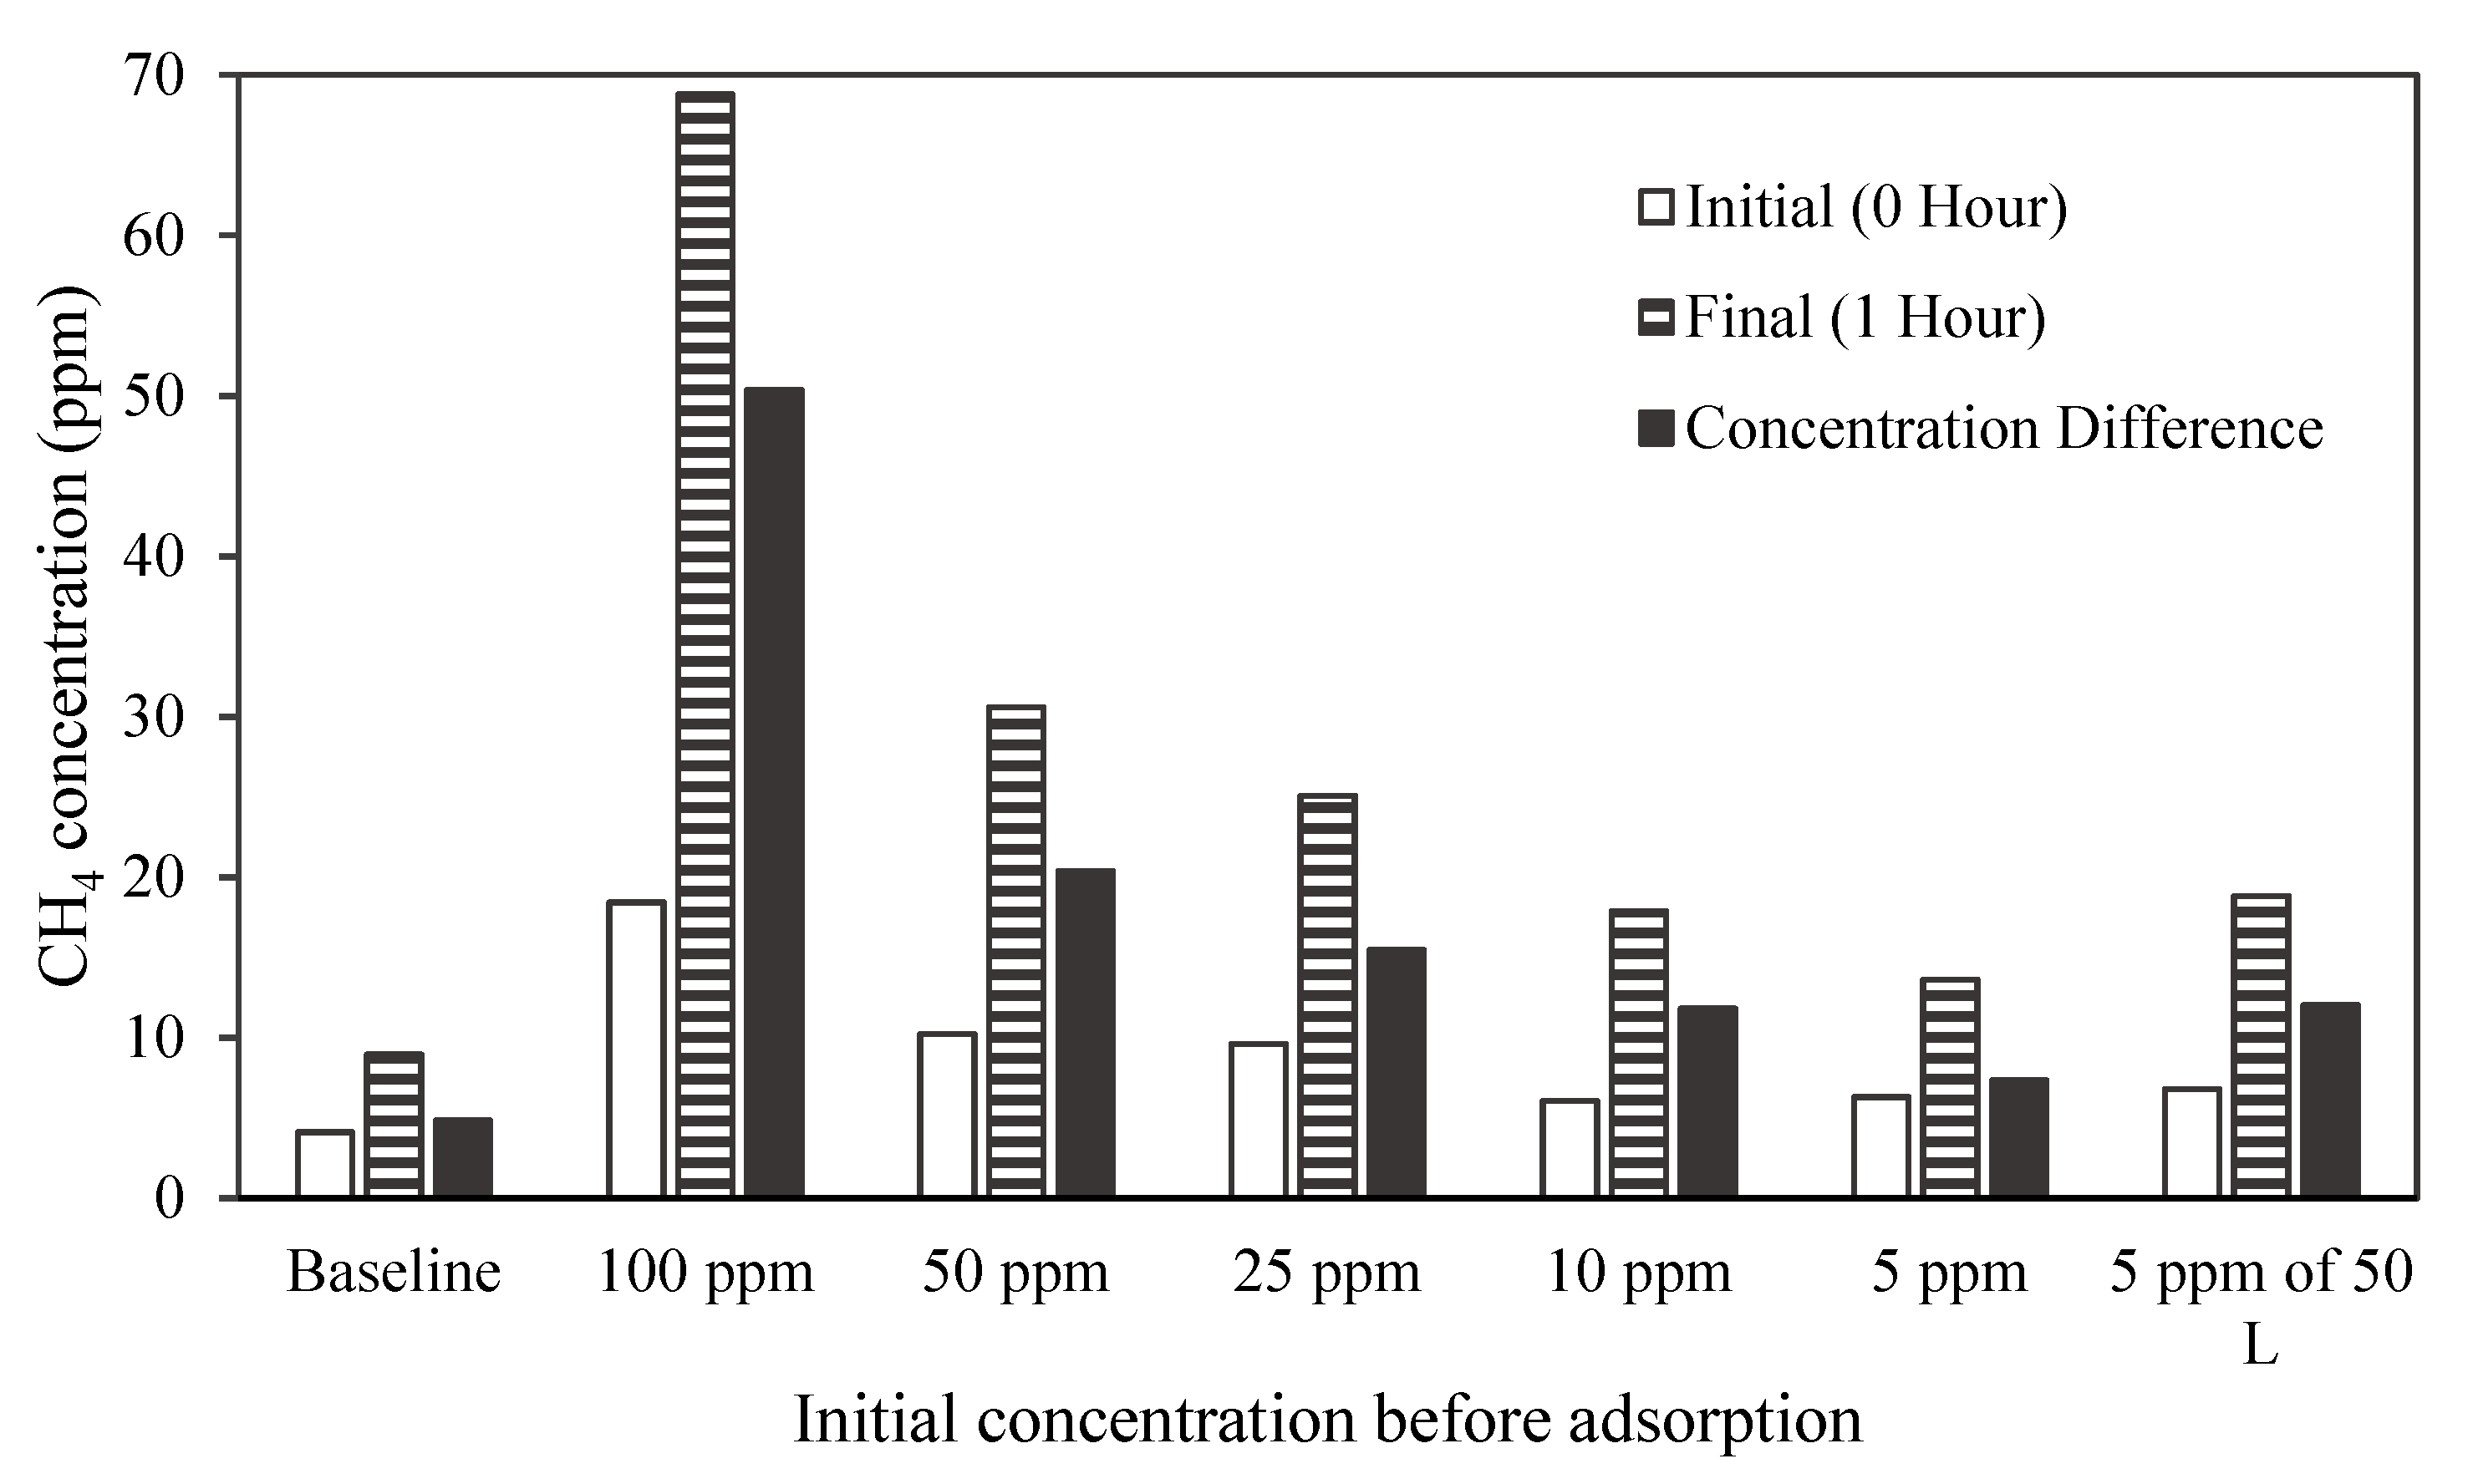
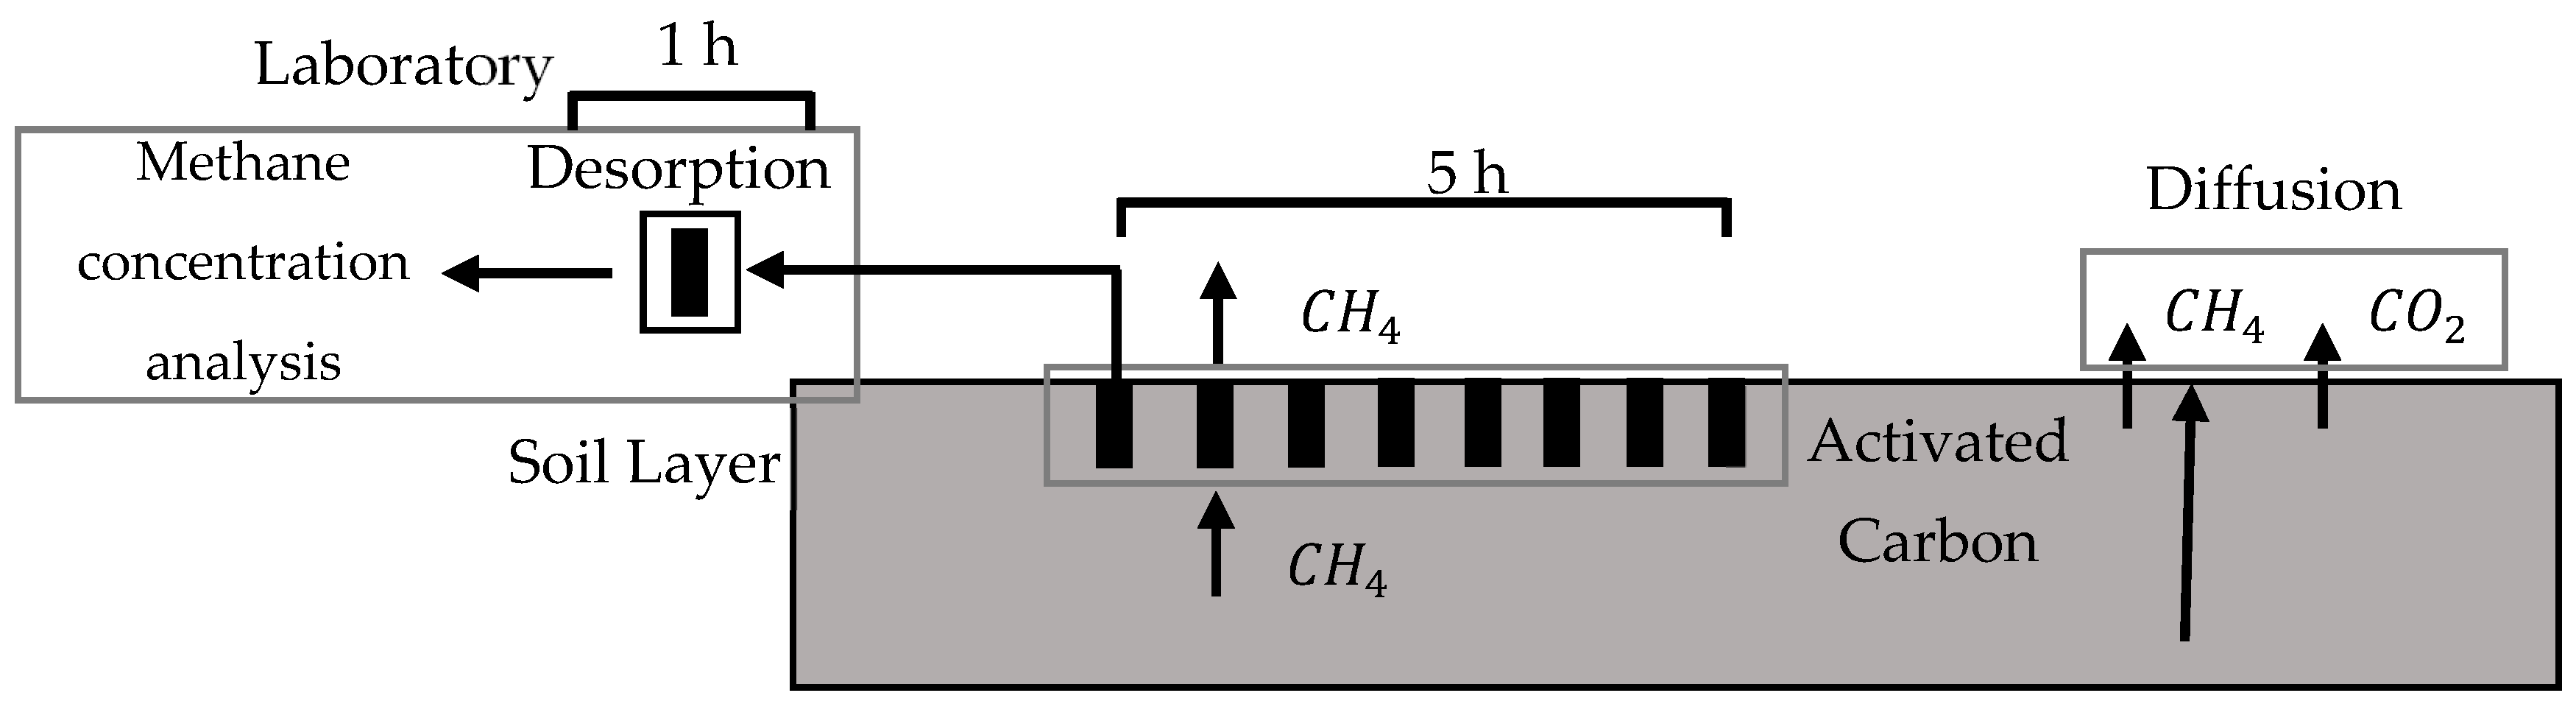
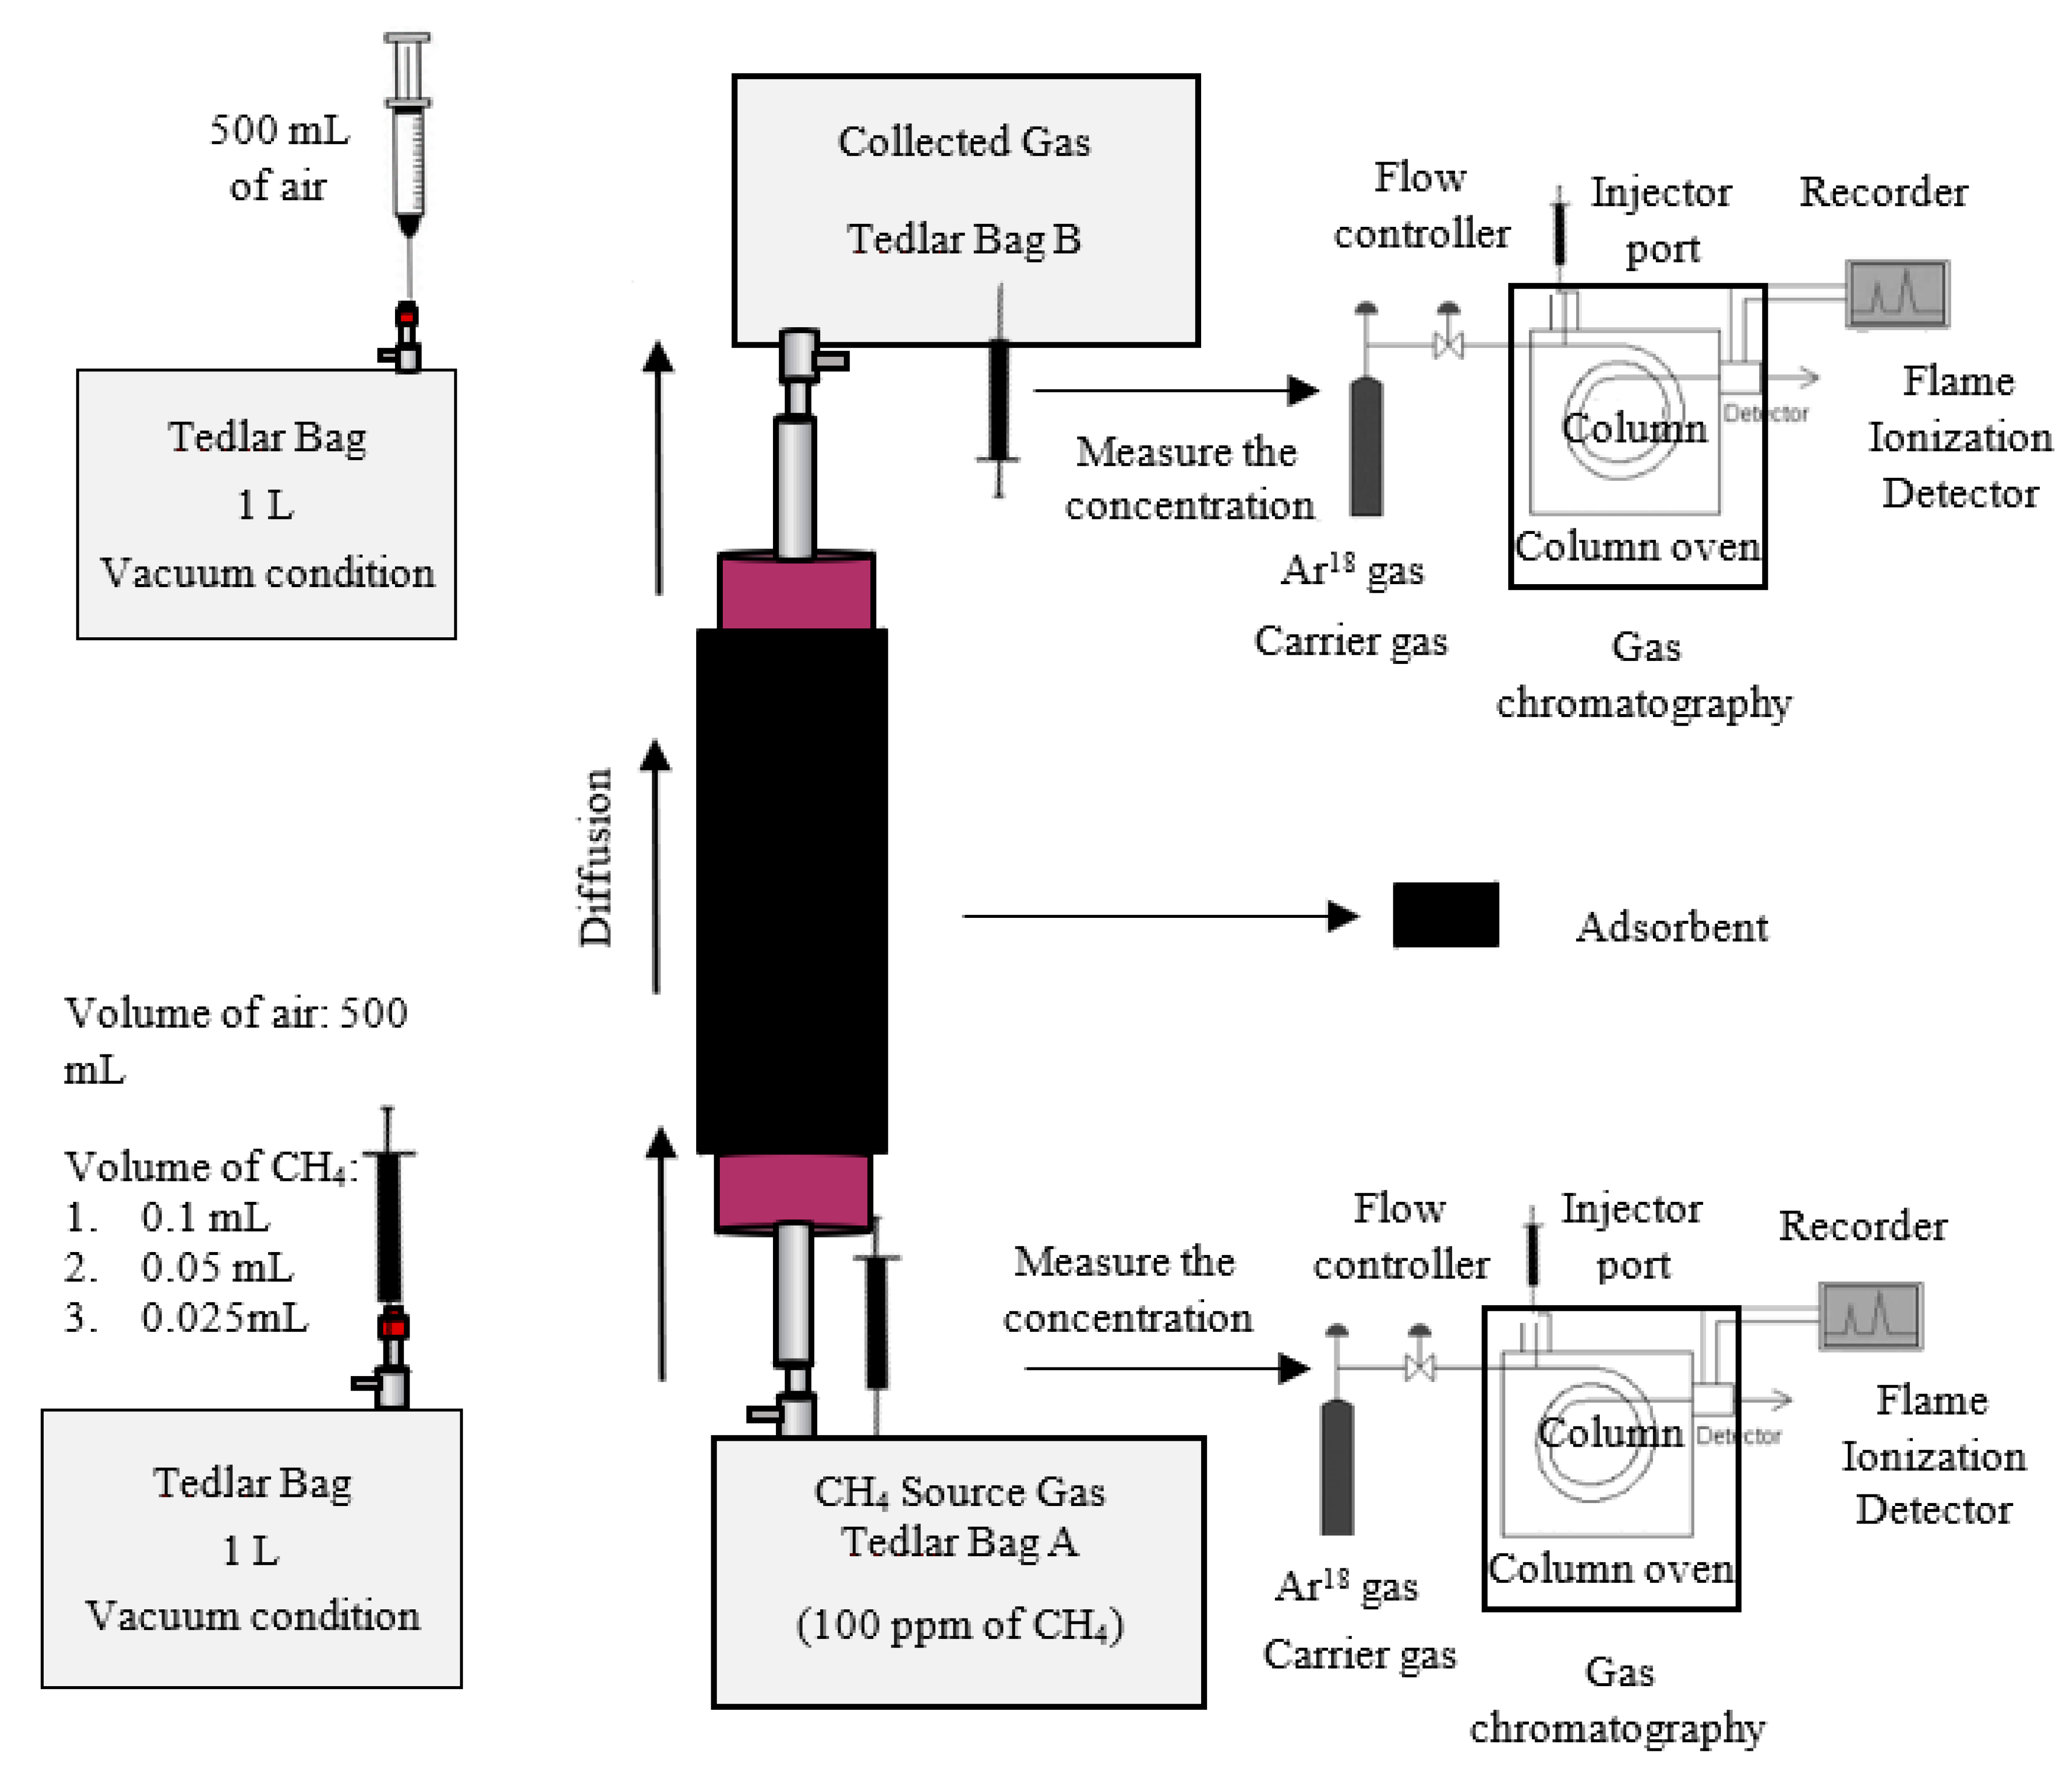
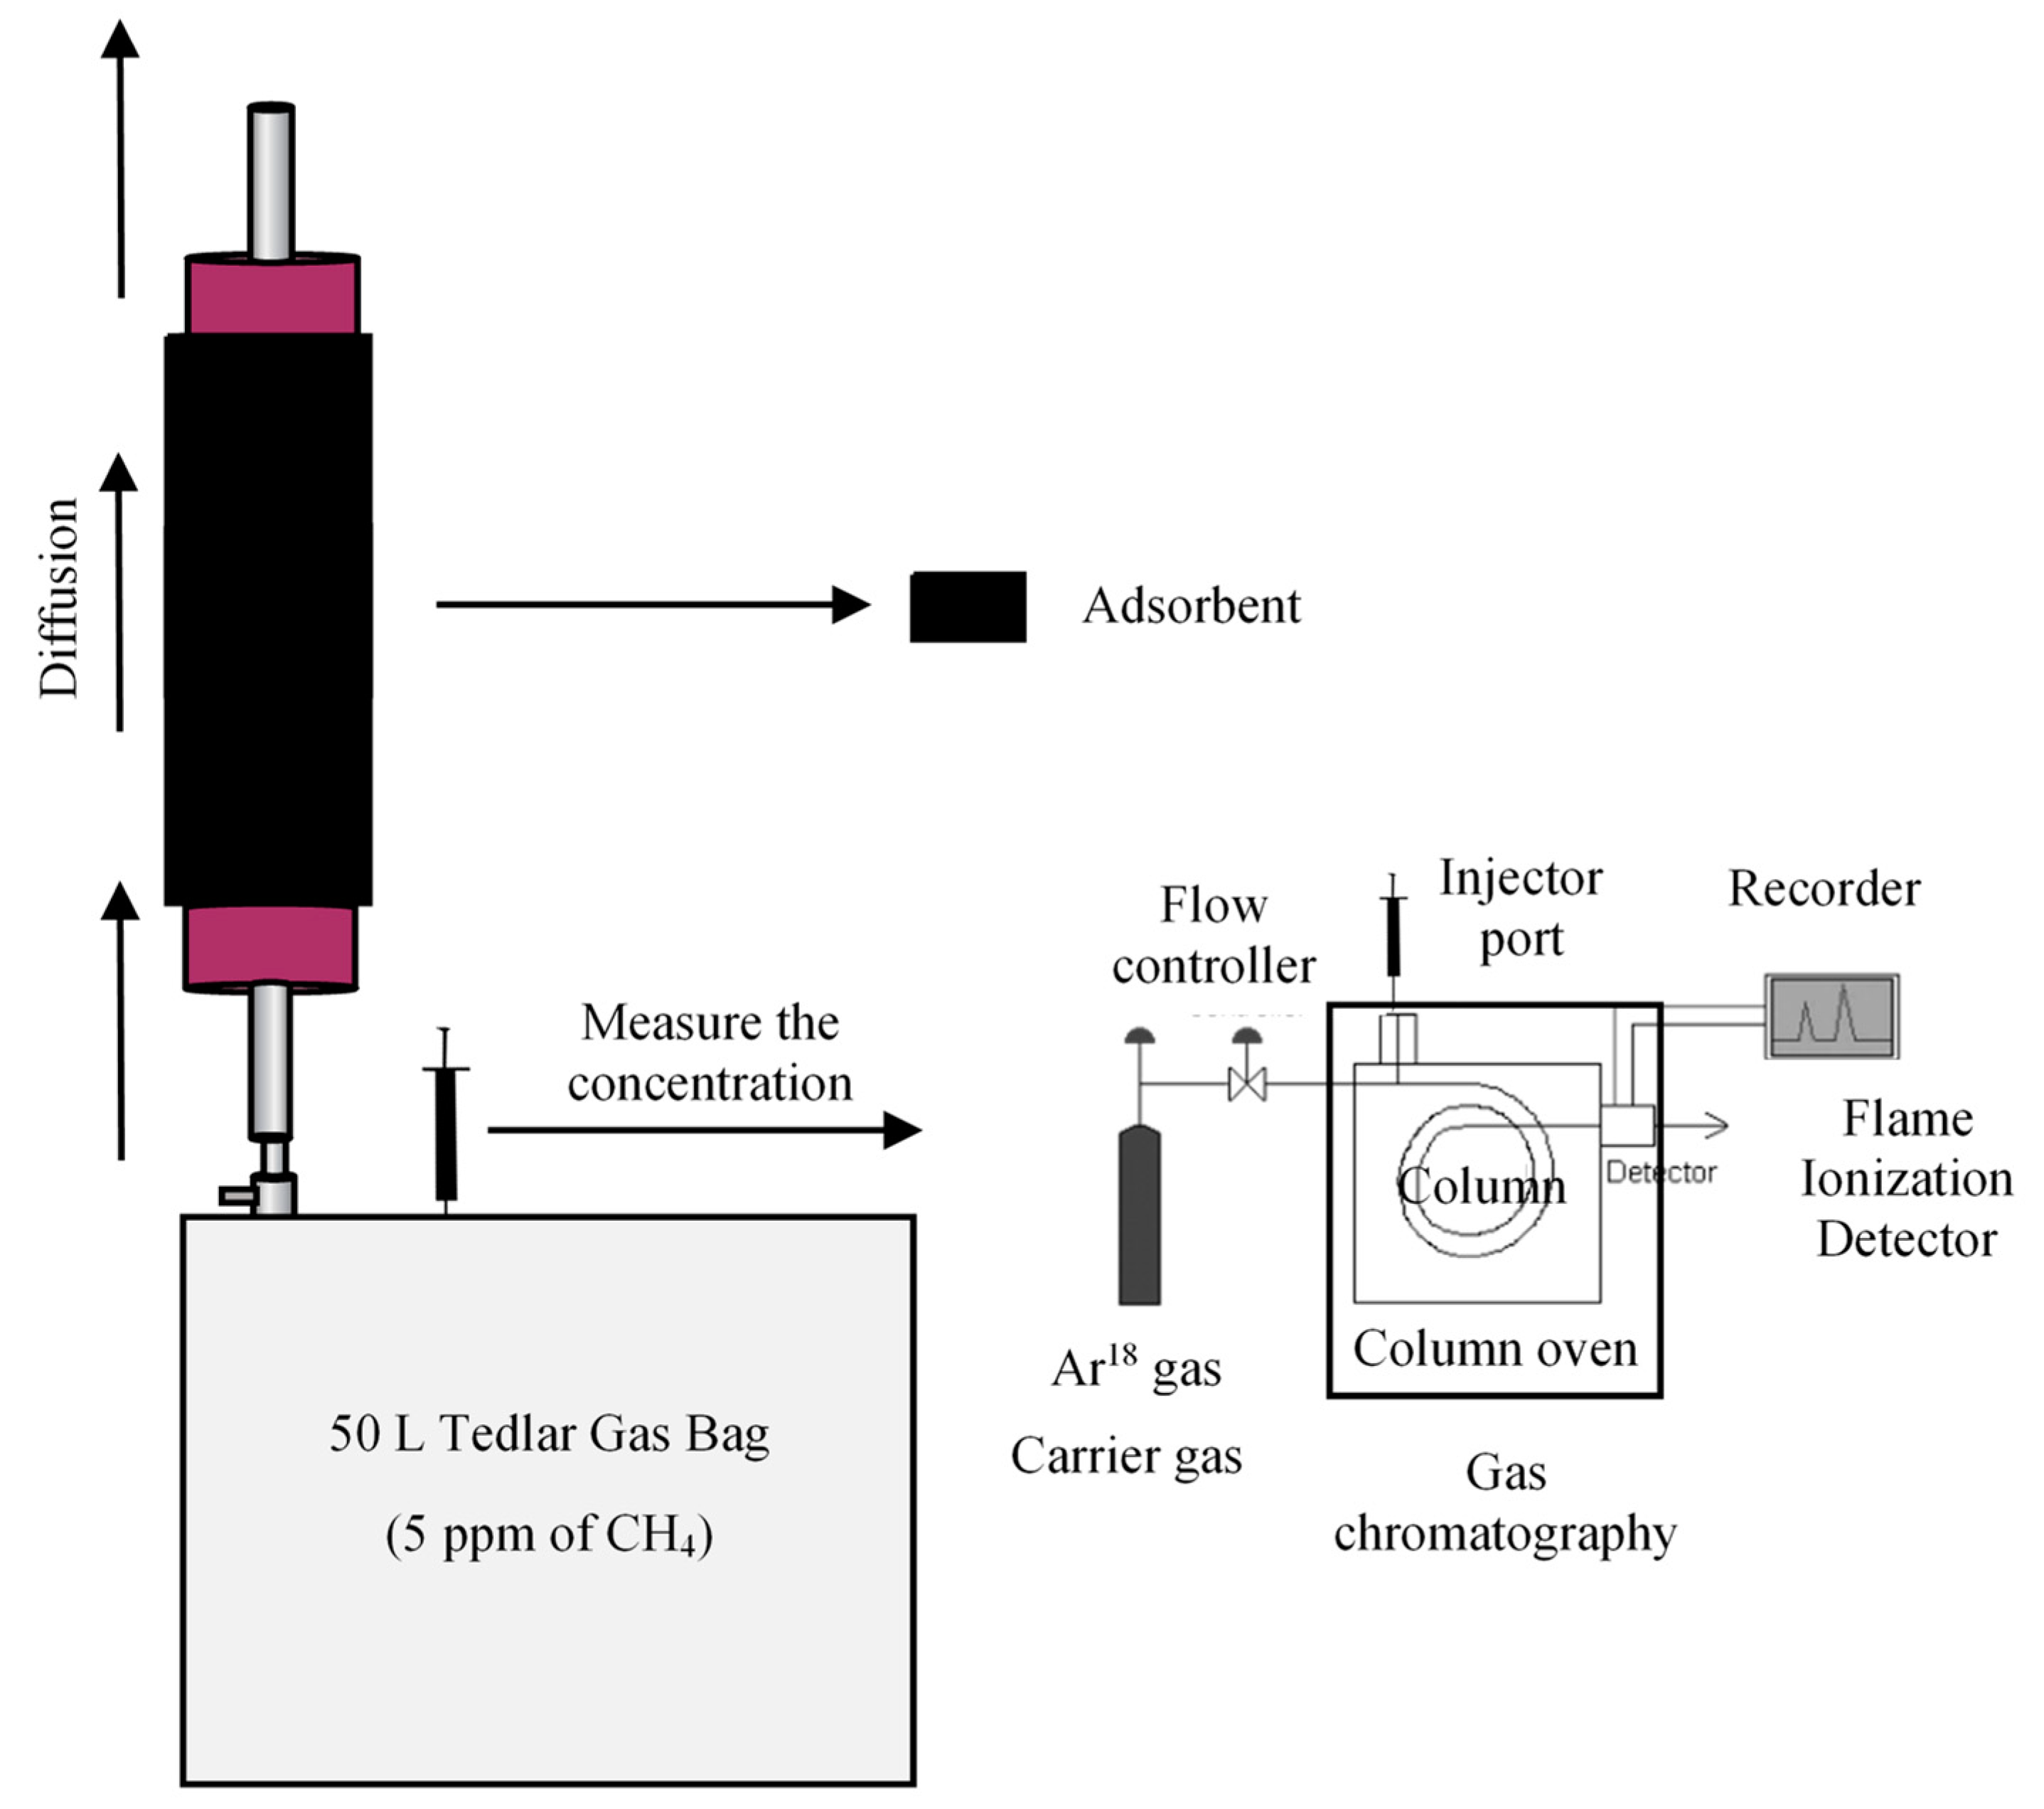
2.2. Column Diffusion

Examining the possibility of adsorption in the gas column diffusion was essential to understand whether this suggested method is applicable or not. The experiments were conducted by injecting no adsorbent inside the column to properly examine the natural diffusion behavior of methane in the column from one Tedlar bag to another Tedlar bag. The methane concentrations of both Tedlar bags as the baseline, marked by the blue color, were carried out. The red color illustrates the methane concentration of both Tedlar bags using activated carbon in the column.
Three types of measurements were conducted. The sets of initial concentrations of methane in the Tedlar bag A—200 ppm, 100 ppm, and 50 ppm—were performed to observe the column diffusion phenomenon. Those three initial concentrations were implemented for easier observation of the diffusion process. If it was excessively low, the diffusion process in the column would be difficult to observe. As regards the time limit for when the test was completed, methane concentration in the column diffusion was equitably evaluated for 4 h because methane concentration does not fluctuate significantly after 4 h, indicating the diffusion of methane from one Tedlar bag to another Tedlar bag through the column naturally lasts 4 h.
From the results of the laboratory experiments, the final methane concentration when activated carbon was present in the column was always lower than the final methane concentration when no adsorbent was in the column (Figure 4). This means that methane flowing abundantly from Tedlar bag A to Tedlar bag B was successfully adsorbed. However, the smaller the initial value of the CH4 concentration in the first Tedlar bag was, the smaller the difference in value between the red and blue dots in the second Tedlar bag would become because the measurable amount of methane in the analyzed system became more insignificant.
Adsorbed methane amount on this completed experiment was relatively the same as the screening results of the experiment using adsorbents (Table 1), prominently representing that the activated carbon performance appeared to be constant even though it was a separate type of experiment. However, the lower the initial concentration was, the lesser was the adsorbed methane amounts per gram of activated carbon (Table 2) because the amount of methane in the designed system became gradually smaller and more limited so that the methane was increasingly difficult to adsorb onto the activated carbon surface. The amount of adsorbed methane when the initial concentrations of CH4 in a bag were 200 ppm, 100 ppm, and 50 ppm was found to be 0.818 × 10⁻³ mg-CH4/g-AC, 0.397 × 10⁻³ mg-CH4/g-AC, 0.161 × 10⁻³ mg-CH4/g-AC, respectively.

3. Discussion

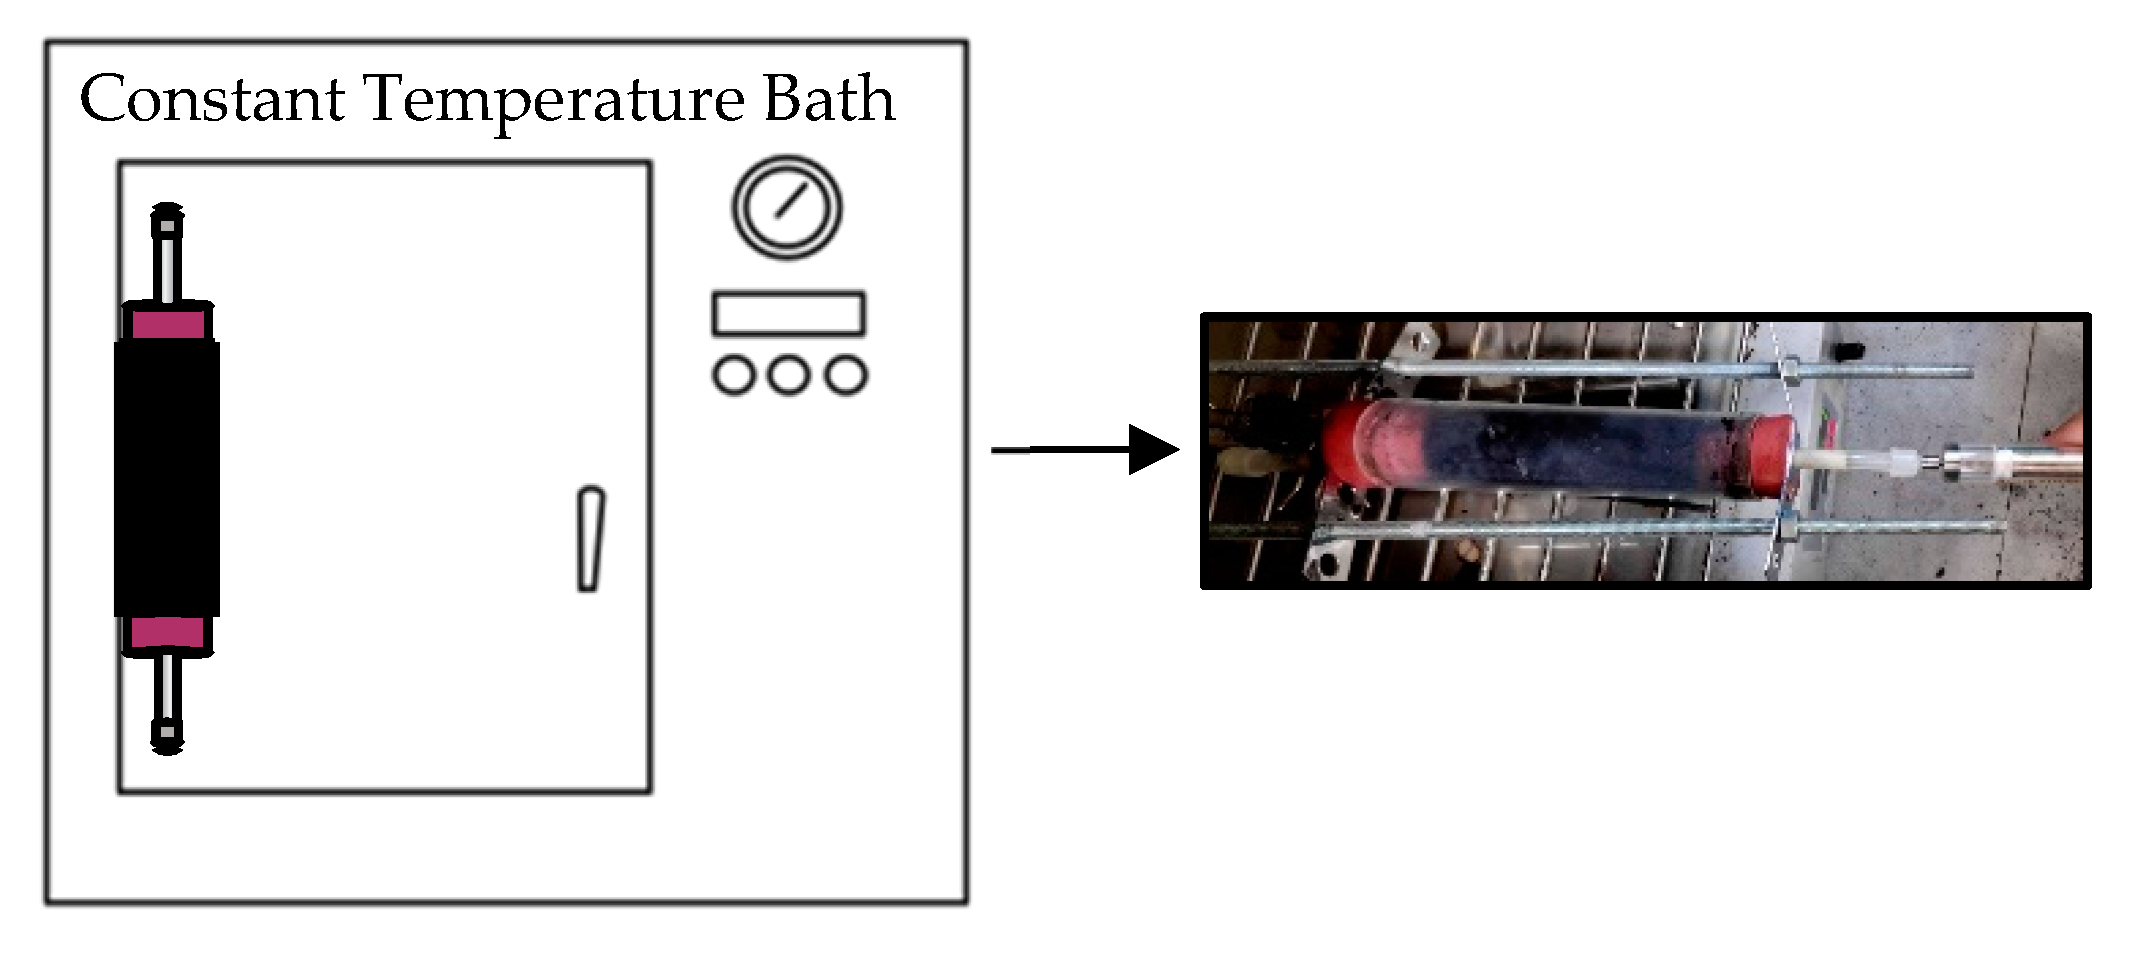
3.1. Thermal Desorption

Same as the previous experiment, conducting the baseline procedure was vital for validating the experimental results. Baseline data indicate the thermal desorption data of the fresh activated carbon that had not undergone an adsorption process. The increase in methane concentration had to be checked because methane basically must be present in activated carbon. Results sufficiently reveal there was a slight increase in the concentration of methane at the baseline experiment, indicating that methane was present on the fresh activated carbon surface before desorption (Figure 5).
Five sets of variations of the initial concentration in one Tedlar bag before adsorption were planned to be tested. Based on preference, the investigation began with the highest one, which was 100 ppm, then 50 ppm, 25 ppm, 10 ppm, and 5 ppm. The increase in the concentration of methane was precisely measured during an hour of the thermal desorption process from each of these initial system conditions. The results show the value of the increase in the concentration of methane was always greater than the baseline experiment (Figure 5).
As an example, when the initial concentration of methane was 5 ppm, meaning there was gas leakage from one Tedlar bag to another Tedlar bag, becoming ideally 2.5 ppm and 2.5 ppm, methane could be detected by indicating the concentration difference or the increase in the methane concentration of 5 ppm measurement, which was still higher than the concentration difference of the baseline experiment. To reasonably conclude, 5 ppm leakage point of methane from the subsurface to the atmosphere could be correctly detected using activated carbon columns.
In terms of simulating the detection of methane leak points from the subsurface to the atmosphere, a column was prepared in which there was activated carbon, with the opening of one column connected by a 50 L Tedlar bag, and the other openings were directly connected to the open air (atmosphere). An initial concentration value of 5 ppm was set because the atmospheric methane concentration averaged 1.9 ppm so that methane could be diffused from the Tedlar bag into the atmosphere. The methane concentration difference from thermal desorption process of the 50 L Tedlar bag with 5 ppm CH4 was significantly higher than the methane concentration difference in the baseline measurement, indicating that activated carbon could be appropriately applied as an indicator and instrument to detect methane leakage point (Figure 5).

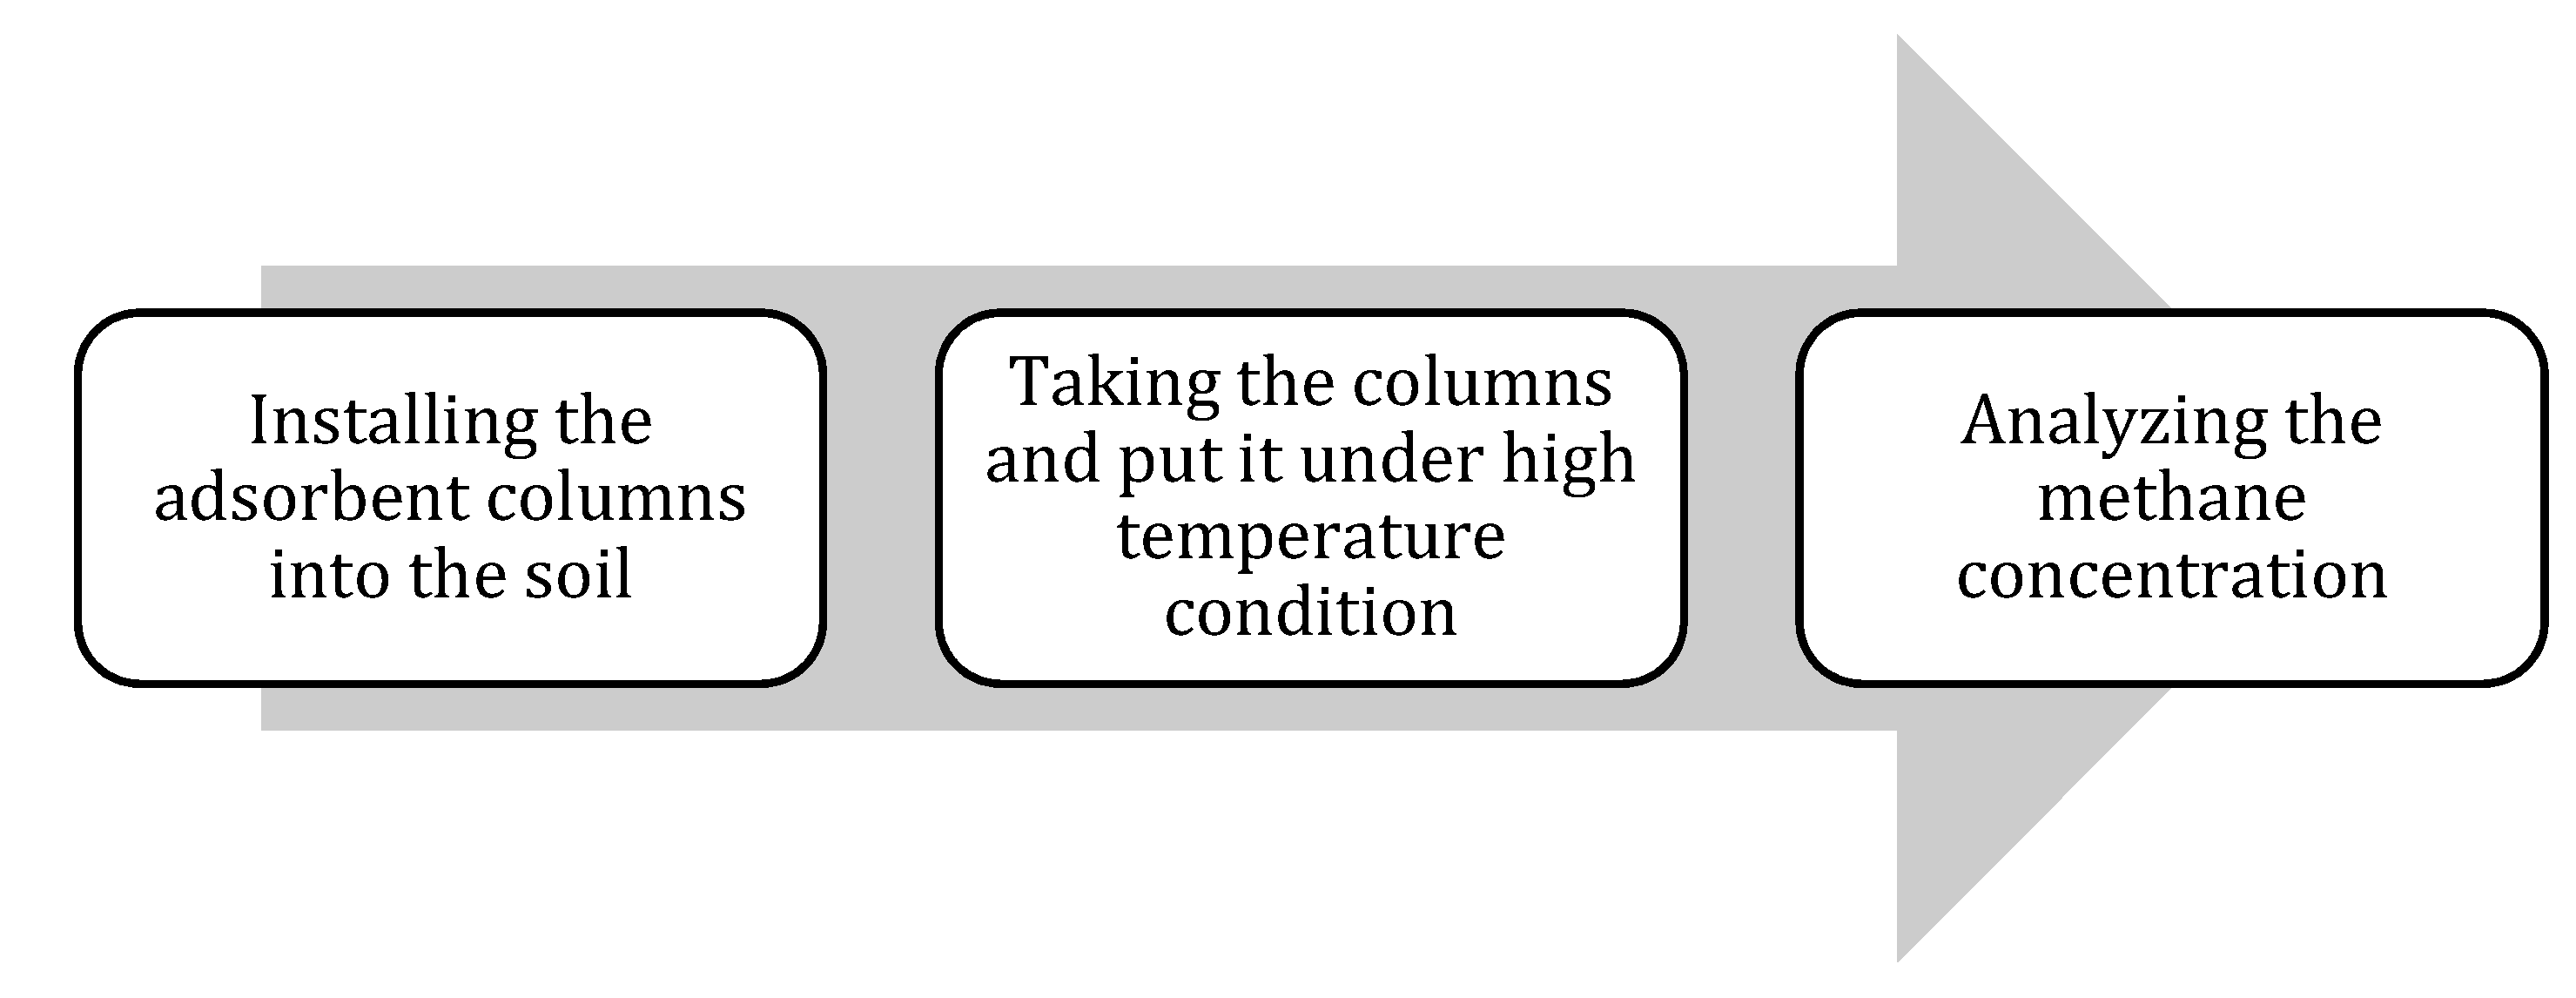
3.2. Low-Cost Method for Monitoring Methane Leakage

The tests carried out were considerably influential for determining the time parameters and the design of the proposed methods (Figure 6). Activated carbon columns had to be installed into the soil layer. Adsorbents needed 5 h for adsorbing methane. Then, the columns were gathered, brought to the lab, and placed into the oven, i.e., constant temperature bath, for thermal desorption. The desorption process required 1 h. Eventually, an increase in methane concentration before and after the columns were cautiously placed in the oven was accurately analyzed by gas chromatography. The value of methane leakage was estimated after 6 h of tests.

4. Materials and Methods
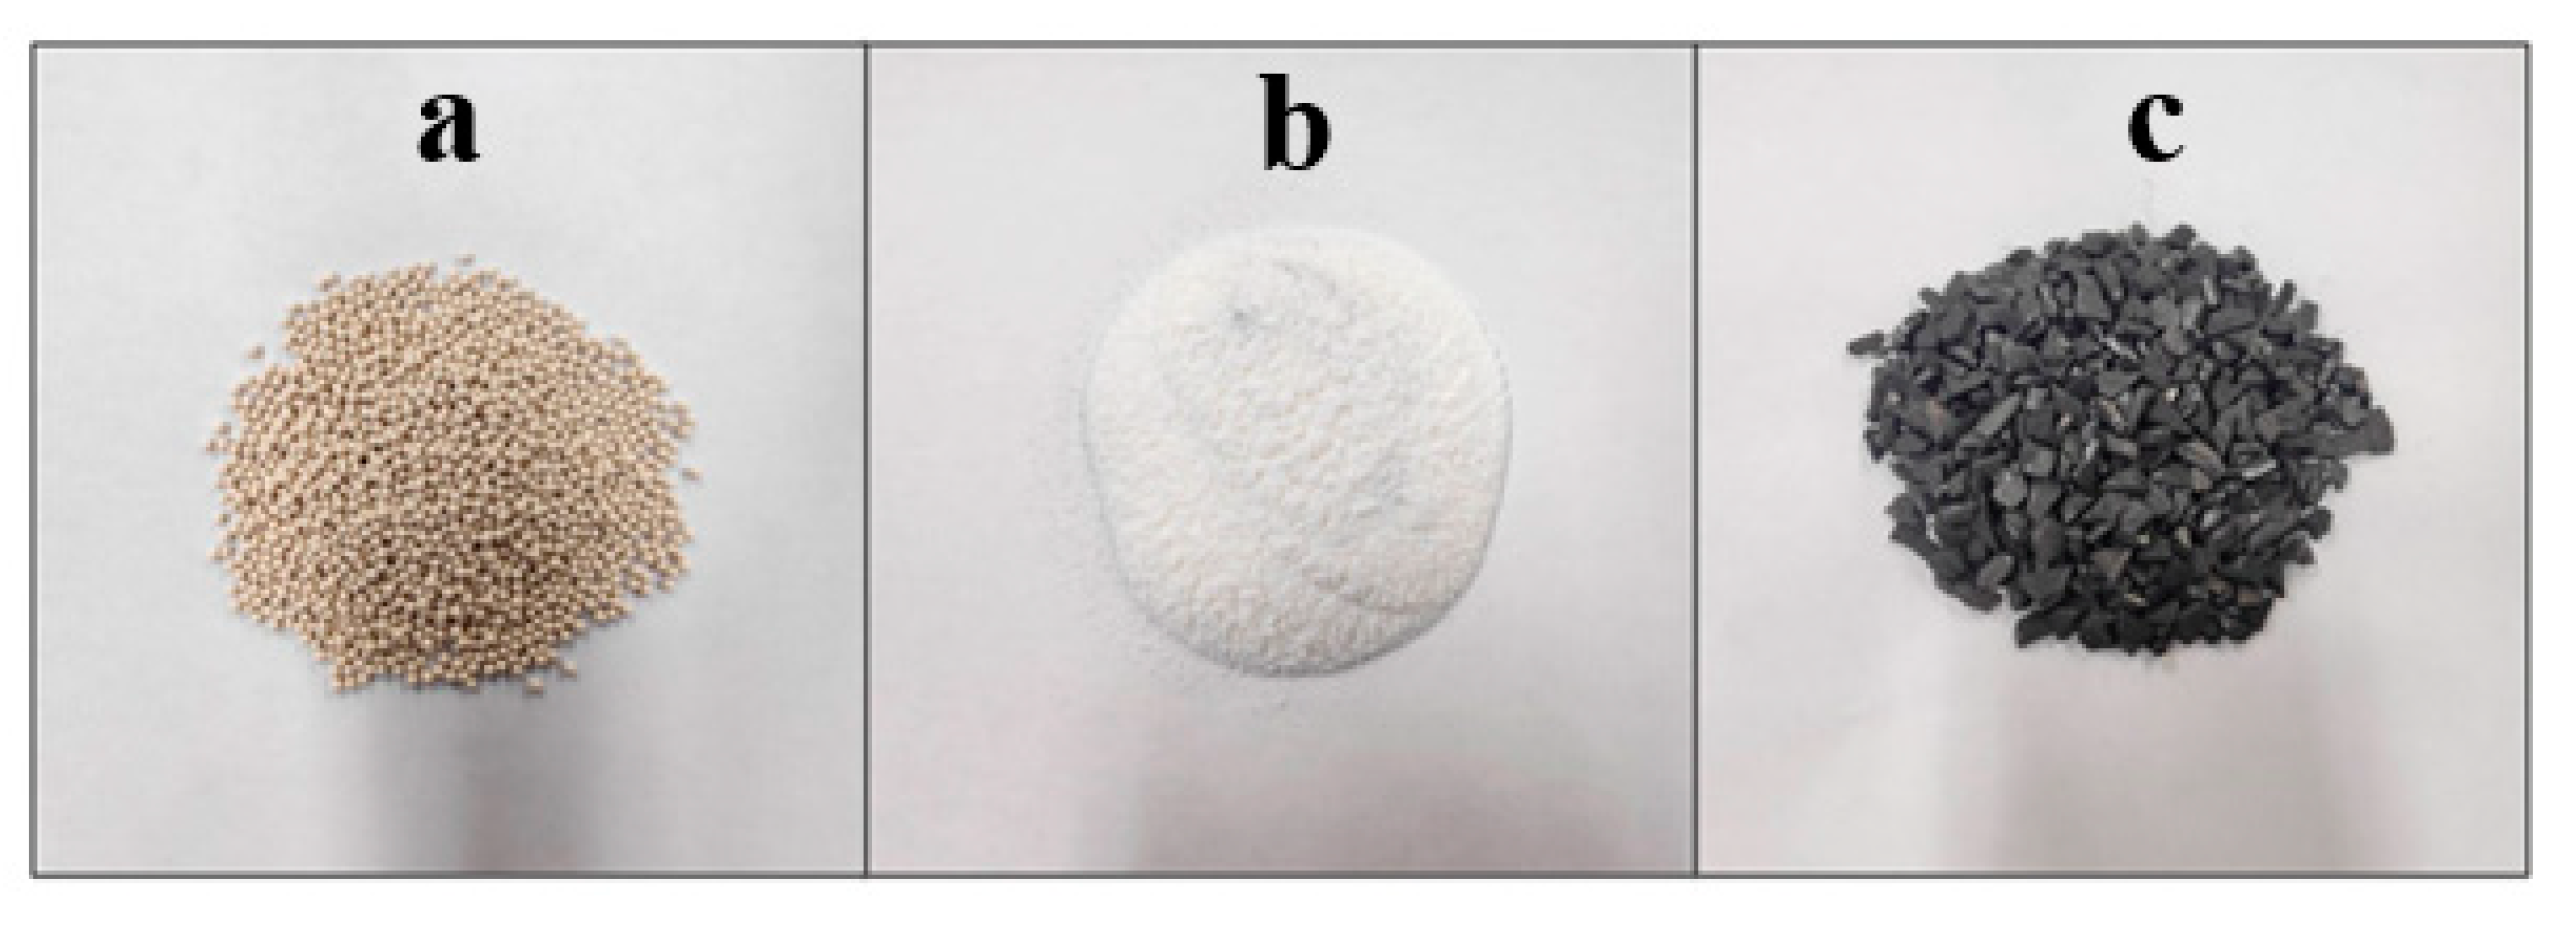
Methane concentrations in the gas samples were accurately analyzed in the Laboratory of Resources Production and Safety Engineering, Kyushu University, Japan, using gas chromatography (GC-14B, Shimadzu, Japan) with a flame ionization detector (FID) that was calibrated by the methane standard gas of (99.0%) before each of measurements. Gas chromatography had to be calibrated to construct the calibration curves. Before performing the measurements, methane standard gas was injected into gas chromatography with the volume of 0.02 mL, 0.015 mL, 0.0125 mL, 0.01 mL, 0.0075 mL, 0.005 mL, and 0.0025 mL. Afterward, linear calibration curves of methane volume in relation to the area of the graph showing methane peaks in gas chromatography were generated. The linear equation of the curves was then used for determining the methane concentration of the measurements. The working conditions of the chromatographer were set as follows: a GC stainless column 6.0 m × 3.0 mm I.D. (packed column) that was inserted by 80 or 100 mesh Porapak Q; argon (Ar18) carrier gas; column temperature of 100 °C; injection temperature of 100 °C; an FID detector with a constant temperature of 100 °C. Methane flowed simultaneously with a carrier gas (Ar18) in the orbicular column. Methane was introduced into a hydrogen flame inside the FID detector. Methane in the selected sample would produce ions when burnt, whereas the carrier gas would not. Ions were detected ordinarily by employing a metal collector biased with a high DC voltage. Lastly, readings of methane concentration were processed with the “CDS” (ver. 2.83) software.

4.1. Adsorbents

There are fundamentally two activation methods to generate activated carbons: physical and chemical. They can be used separately or in a conceivable combination with one another. On the other hand, commercial activated carbon is widely available in the market. Thus, commercial activated carbon manufactured by Junsei Chemical Co. Ltd., which has a granular form, was preferentially used in this study (Figure 7). Moreover, synthetic beads zeolites with a specified size of 1.40–2.36 mm (8–12 mesh) fabricated by Fujifilm Wako Pure Chemical Corporation and Porapak type Q with a size of 80–100 mesh, the chemical name of which is poly (4-ethyl styrene-CO-divinylbenzene), produced by Waters Corporation, were used in this study (Figure 7). The value of the specific surface area of activated carbon, zeolites, Porapak calculated from the characteristics data of commercial products is 1000 m2/g, 500–600 m2/g, and 600 m2/g, respectively. In addition, information of the bulk density of activated carbon, zeolites, and Porapak is 0.46 g/cm3, 0.70–0.82 g/cm3, and 0.34 g/cm3, respectively. Further, 5 g, 10 g, and 15 g of each adsorbent were provided to evaluate which adsorbent is the best in terms of the possibility of diffusion in the column and thermal desorption.

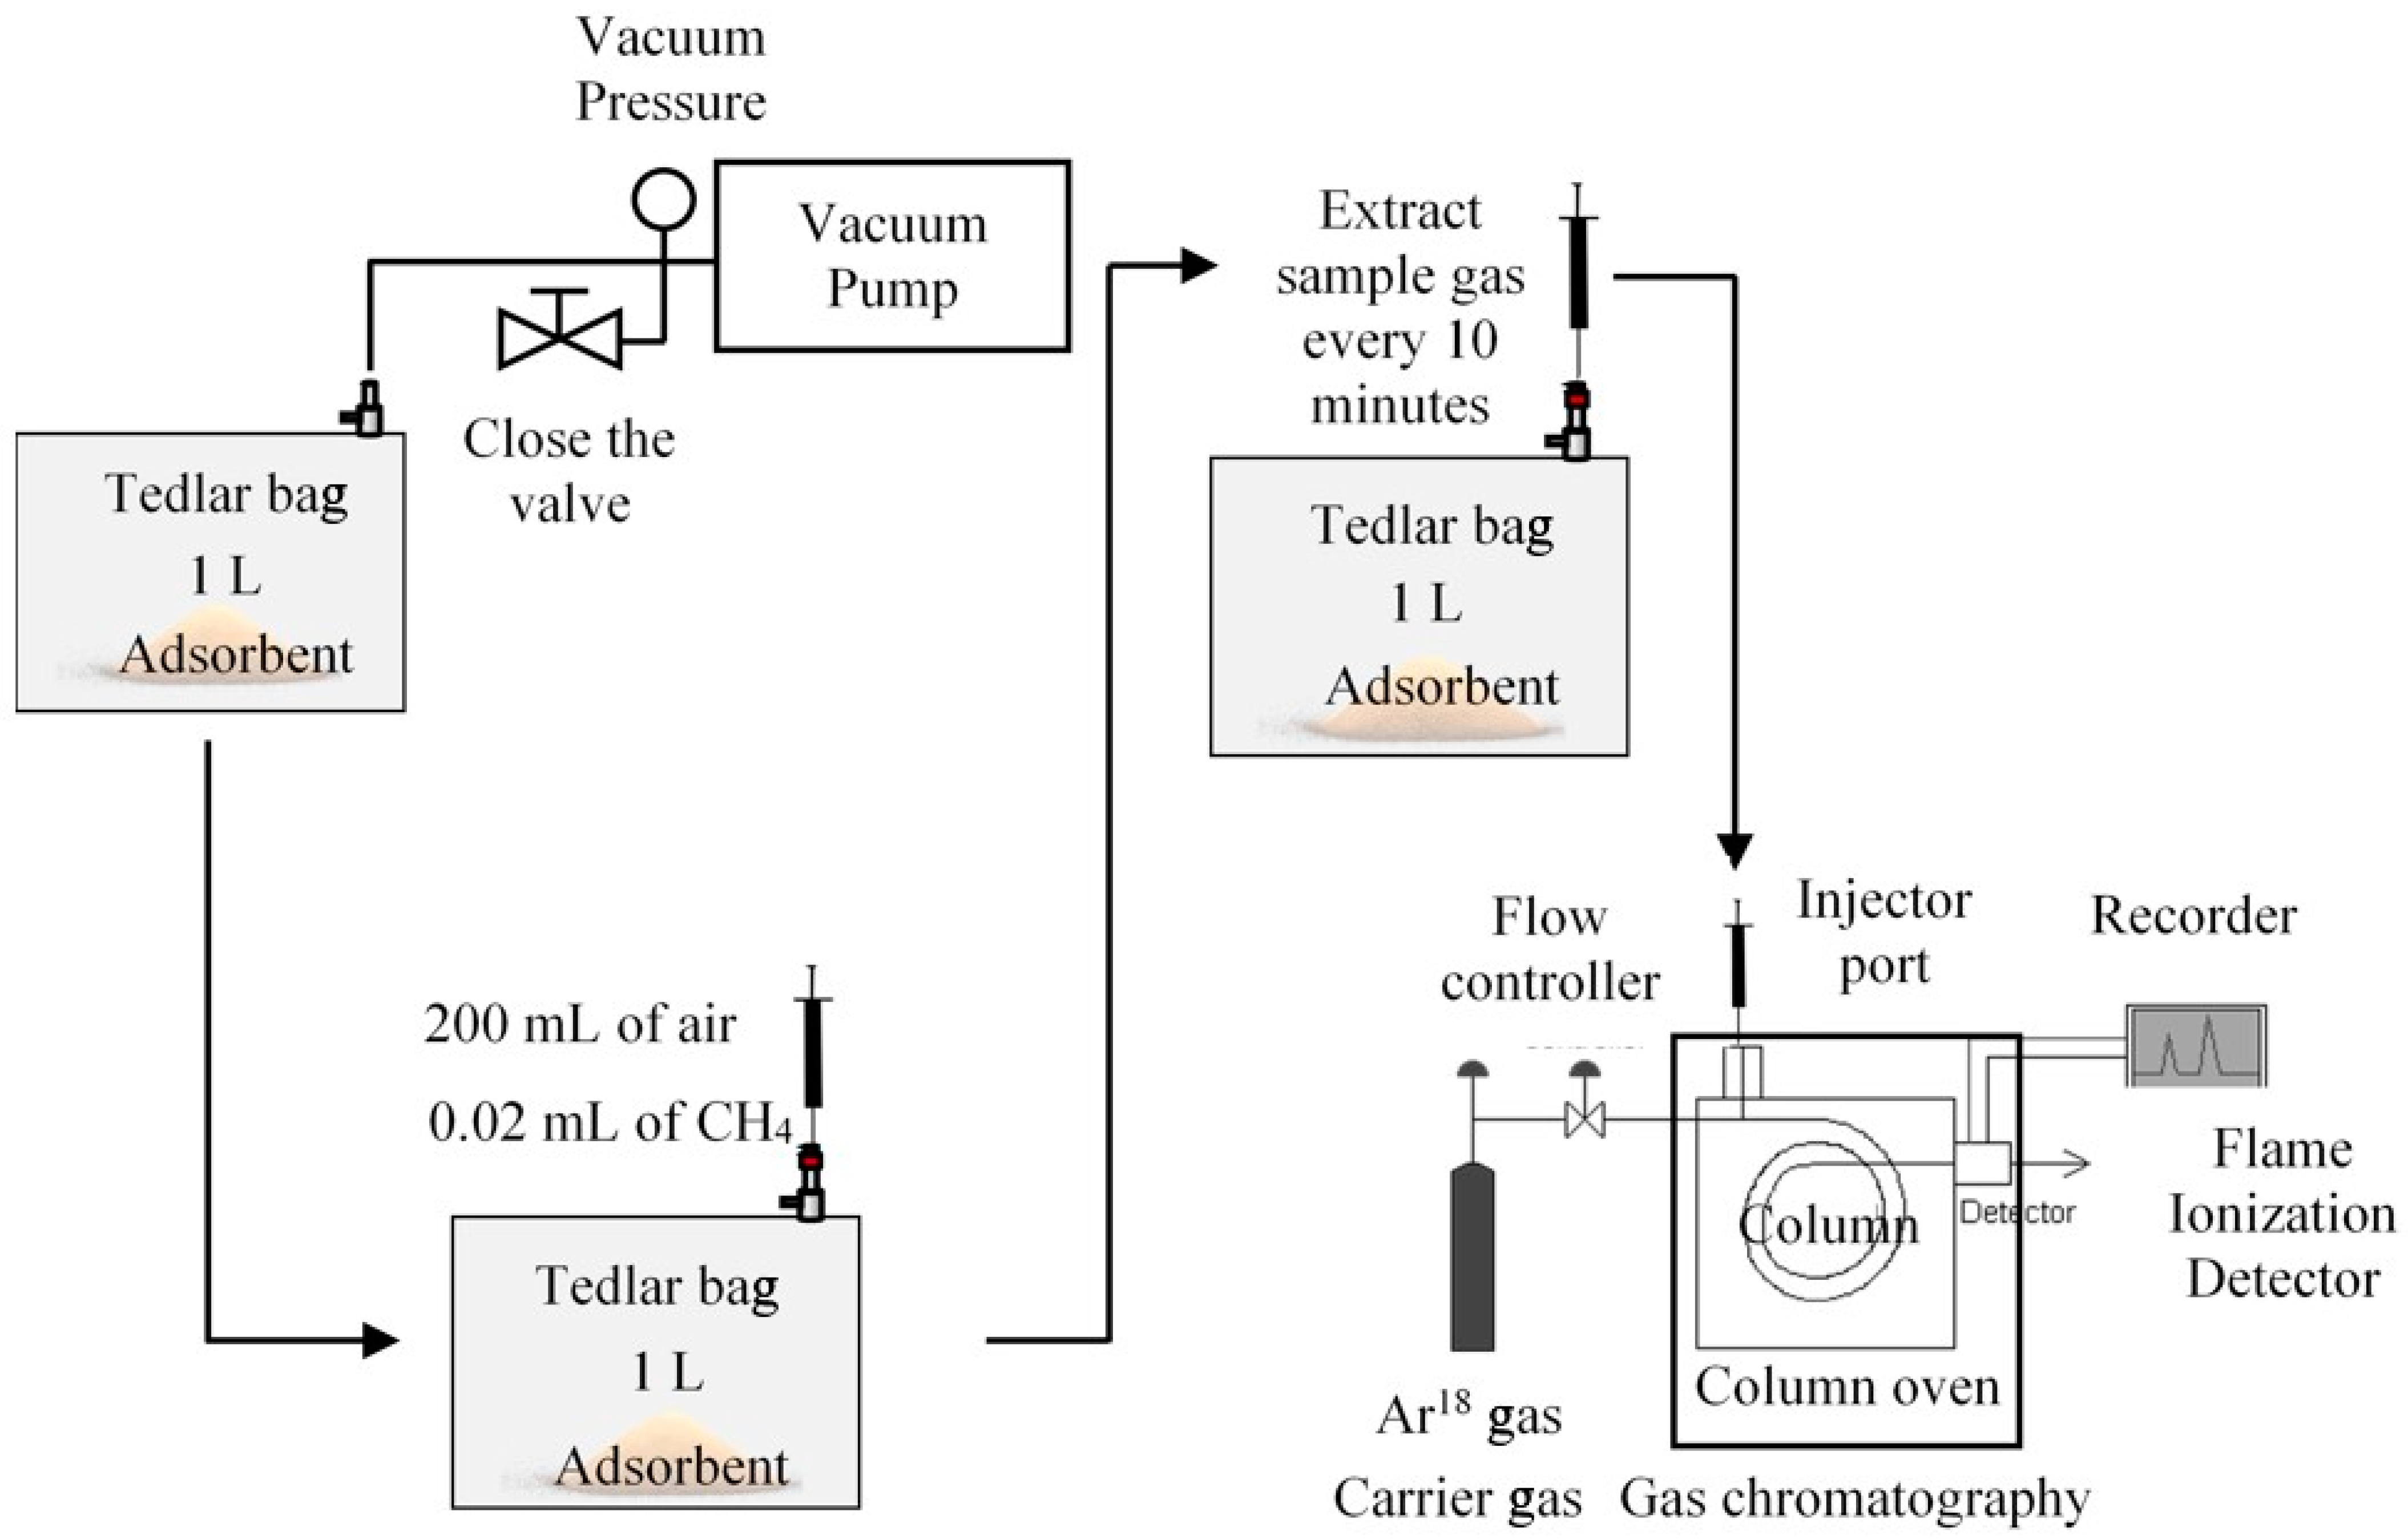
4.2. Screening Adsorbents

The first subject of our study was evaluating the most potent adsorbent. To start with, the adsorbent was carefully inserted into the 1 L Tedlar gas bag, and the Tedlar bag was made in a vacuum condition. The funnel was used to facilitate the entry of the adsorbent into the opening of the Tedlar bag, as it was arduous to insert the adsorbent directly, considering the opening was relatively narrow. When the adsorbent grain size was overly large, such as with activated carbon, it was then ground using mortar and stamper to make the grain size smaller. Thereafter, 200 mL of air and 0.02 mL of methane were reciprocally injected. This analytically means the methane concentration in the Tedlar bag was 100 ppm. Lastly, the sample gas was extracted every 10 min to be accurately analyzed the methane concentration using gas chromatography (Figure 8).
The experiments were conducted by varying the mass of each adsorbent 5 g, 10 g, and 15 g in the 1 L Tedlar bag. The first measurement was performed using 5 g of adsorbent in the Tedlar bag, then analyzed the adsorbed methane value of 5 g adsorbents. Afterward, 5 g of extra adsorbent was added into the Tedlar bag. Therefore, the second measurement was performed using 10 g of adsorbent, and the adsorbed methane value of 10 g adsorbents was then analyzed as well. Next, another 5 g increment of adsorbent was added, amounting to 15 g of adsorbent in the Tedlar bag for the subsequent measurement to analyze the adsorbed methane value. The weights were conscientiously evaluated by laboratory LCD analytical digital balance. Briefly, the same materials from the previous measurement were used, then added 5 g for the subsequent measurement. Therefore, the adsorption performance analysis of the adsorbents that were used more than once needed to be interpreted. This procedure can appropriately provide reasonable insights for researchers who study the application of the adsorbents more than once by conducting experiments to compare the first vs. second adsorption measurements of adsorbents.
Adsorbed methane amount can be measured by following the fundamental equation below, which considers the concentration difference of methane ( Δ CH 4   conc . ) between initial concentration and final concentration [16]:
Adsorbed   CH 4 ( L g ) = ( Δ CH 4   concentration ) ×   Gas   bag   vol .   ( L ) Adsorbent   mass   ( g )
At room temperature, the volume of 1 mol gas is 24 L; therefore,
Adsorbed   CH 4 ( mg g ) = Adsorbed   CH 4 ( L g ) 24   L ×   Mr CH 4 ( g mol ) × 1000

4.3. Column Diffusion

The second subject of the study was to examine the possibility of adsorption in the gas column diffusion. Two Tedlar bags of 1 L were prepared in vacuum condition. The first Tedlar bag (B) was only injected with 500 mL of air. The other (A) was injected with 500 mL of air and methane with decided variations of volume. At the start of the procedure, 0.1 mL of methane was injected, which means 200 ppm of methane was inside the Tedlar bag. Then, 100 ppm and 50 ppm of the methane in the Tedlar bag were prepared to be analyzed as the source of methane (Figure 9). The diffusion occurred spontaneously, after which the gas was extracted from each of the Tedlar bags. After this step, the methane concentration was properly analyzed by gas chromatography throughout 5 h measurements. Theoretically, methane will flow from the higher concentration to the lower concentration. The column acted as a medium for the diffusion of methane. The purpose of the experiment was primarily to observe how the diffusion of methane can spontaneously occur in the presence and absence of the adsorbent in the column.
Concerning the main objective, which was to develop a method to detect methane leakage points from the subsurface to the atmosphere by using adsorbent, the laboratory experimental was designated to simulate methane leakage to the atmosphere detected by using a column. To this end, 50 L of Tedlar gas bag containing 5 ppm of methane from the injection of 50 L of air and 0.25 mL of methane was arranged similarly as a source of methane from the subsurface (Figure 10). The column in this experiment simulated an adsorbent column being placed on the ground. Another opening of the column was left open because it simulated the dynamic flow of methane from the subsurface to the open air in the atmosphere through the ground.

4.4. Thermal Desorption

Thermal Desorption of adsorbate from activated carbon at 80–120 °C under atmospheric pressure has been experimentally studied [17]. For this study, the closed column was cautiously placed into the constant temperature bath under 80 °C, and the sample gas inside the column was extracted into a syringe before and after desorption (Figure 11).
This experiment was directly related to the column diffusion experiment. If the column diffusion experiments were successfully conducted and exhibited acceptable results indicating adsorption by the adsorbent, they were repeated using the lower initial concentration of methane. After diffusion occurred through the column, which required approximately five hours, both column openings had to be sealed to ensure methane would not leak from the column. The gas was extracted from the column and analyzed by gas chromatography with the initial concentration of methane inside the column before adsorption. The column was delicately placed in a constant temperature bath, then the gas was extracted from the column after an hour in the constant temperature bath for analysis by gas chromatography.

4.5. Proposed Method

The above catena of methodical processes (Section 4.2, Section 4.3 and Section 4.4) was practically applied as a single flow for developing a new method (Figure 12). Each process was first tested to reliably determine whether the proposed method could be implemented effectively for monitoring methane leakage. In this proposed method, columns were placed randomly following the field conditions according to which the methane leakage would be estimated. Those columns were charged by adsorbent and replaced with new columns every prescribed period. The columns that were recovered from the field were carried to the laboratory. The gas adsorbed on the adsorbent was desorbed under high-temperature conditions. Under those circumstances, methane concentration was correctly analyzed using a detector such as a flame ionization detector (FID) in the gas chromatograph. After a considerable time, methane leakage in the field could be estimated.

5. Conclusions

This study developed a low-cost method to detect methane leakage points from the subsurface to the atmosphere through the ground. Activated carbon demonstrated the highest value of adsorbed methane amount, at 1.187 × 10⁻³ mg-CH4/g-AC, followed by Porapak, at 0.150 × 10⁻³ mg-CH4/g-P, and zeolites at 0.017 × 10⁻³ mg-CH4/g-Z when 5 g of adsorbents were used. Therefore, activated carbon was the best adsorbent by screening the adsorption capacity of those three adsorbents. In addition, activated carbon could adsorb methane during the diffusion process between two Tedlar bags, which had different methane concentrations in column experiments. The detectable amount of adsorbed methane when the initial concentrations of CH4 in a bag were 200 ppm, 100 ppm, and 50 ppm was found to be 0.818 × 10⁻³ mg-CH4/g-AC, 0.397 × 10⁻³ mg-CH4/g-AC, 0.161 × 10⁻³ mg-CH4/g-AC, respectively, indicating that its performance appeared to be constant even though it was a different type of experiment. The analytical results reveal that the concentration difference of methane when 5 ppm of the initial concentration of methane adsorption was used with activated carbon was higher than the concentration difference of the baseline on thermal desorption, which indicates that activated carbon can detect methane leak points from subsurface to the atmosphere even with an exceedingly small concentration of 5 ppm as a source of methane. The proposed method has a limitation—it merely indicates the point of methane leakage. The value of methane emissions in the overall field is not able to be measured appropriately. However, this method can precisely indicate the points of methane leakage up to 5 ppm leakage from the subsurface.

Author Contributions

Conceptualization, Y.S. and M.A.F.; methodology, Y.S.; software, Y.S.; validation, M.A.F., Y.S., N.P.W. and S.S.; formal analysis, M.A.F.; investigation, Y.S.; resources, N.P.W. and S.S.; data curation, M.A.F.; writing—original draft preparation, M.A.F.; writing—review and editing, M.A.F.; visualization, M.A.F.; supervision, Y.S. and N.P.W.; project administration, N.P.W. and S.S.; funding acquisition, Y.S. and S.S. All authors have read and agreed to the published version of the manuscript.

Funding

This research received no external funding. The APC was funded by Yuichi Sugai.

Institutional Review Board Statement

Not applicable.

Informed Consent Statement

Not applicable.

Conflicts of Interest

The authors declare no conflict of interest. The funders had no role in the design of the study; in the collection, analyses, or interpretation of data; in the writing of the manuscript, or in the decision to publish the results.

References

  1. Intergovernmental Panel on Climate Change (IPCC). Mitigation of Climate Change: Energy Systems; Fifth Assessment, Report; IPCC: Cambridge, UK; Cambridge University Press: Cambridge, UK, 2014. [Google Scholar]
  2. European Environment Agency (EEA). EEA air pollutant emission inventory guidebook-2009. In Technical Guidance to Prepare National Emission Inventories; EEA Technical Report No 6/2009; EEA: Copenhagen, Denmark, 2009. [Google Scholar]
  3. Maasakkers, J.D.; Jacob, D.J.; Sulprizio, M.P. Global distribution of methane emissions, emission trends, and OH concentrations and trends inferred from an inversion of GOSAT satellite data for 2010–2015. Atmos. Chem. Phys. 2019, 19, 7859–7881. [Google Scholar] [CrossRef] [Green Version]
  4. Le Mer, J.; Roger, P. Production, oxidation, emission, and consumption of methane by soils: A review. Eur. J. Soil Biol. 2001, 37, 25–50. [Google Scholar] [CrossRef]
  5. Klusman, R.W.; Jakel, M.E. Natural microseepage of methane to the atmosphere from the Denver-Julesburg basin, Colorado. J. Geophys. Res. Atmos. 1998, 103, 28041–28045. [Google Scholar] [CrossRef]
  6. Mosier, A.R.; Schimel, D.S. Influence of agricultural nitrogen on atmospheric methane and nitrous oxide. Chem. Ind. 1991, 23, 874–877. [Google Scholar]
  7. Sechman, H.; Kotarba, M.J.; Fiszer, J.; Dzieniewicz, M. Distribution of methane and carbon dioxide concentrations in the near-surface zone and their genetic characterization at the abandoned “Nowa Ruda” coal mine (lower Silesian Coal Basin, SW Poland). Int. J. Coal Geol. 2013, 116, 1–16. [Google Scholar] [CrossRef]
  8. Tang, J.; Xu, Y.; Wang, G.; Etiope, G.; Han, W.; Yao, Z.; Huang, J. Microseepage of methane to the atmosphere from the Dawanqi oil-gas field, Tarim Basin, China. J. Geophys. Res. Atm. 2017, 122, 4353–4363. [Google Scholar] [CrossRef]
  9. Riddick, S.N.; Denise, L.; Mauzerall, M.A.; Celia, M.K.; Bressler, K.; Chu, C.; Gum, C.D. Measuring methane emissions from abandoned and active oil and gas wells in West Virginia. Sci. Total Environ. 2019, 651, 1849–1856. [Google Scholar] [CrossRef] [PubMed]
  10. Sechman, H.; Kotarba, M.J.; Kedzior, S.; Dzieniewicz, M.; Romanowski, T.; Twaróg, A. Distribution of methane and carbon dioxide concentrations in the near-surface zone, genetic implications, and evaluation of gas flux around abandoned shafts in the Jastrzębie-Pszczyna area. Int. J. Coal Geol. 2019, 204, 51–69. [Google Scholar] [CrossRef]
  11. Xu, L.; Vath, R.; McCoy, J. Chamber-Based Soil Methane Flux Measurement; LI-COR Biosciences: Lincoln, NE, USA, 2018. [Google Scholar]
  12. Fredenslund, A.M.; Scheutz, C.; Kjeldsen, P. Tracer method to measure landfill gas emissions from leachate collection systems. Waste Manag. 2010, 30, 2146–2152. [Google Scholar] [CrossRef] [PubMed]
  13. Dantas, T.L.P.; Luna, F.M.T.; Silva, I.J., Jr.; Torres, A.E.B.; de Azevedo, D.C.S.; Rodrigues, A.E.; Moreira, R.F.P.M. Modelling of the fixed-bed adsorption of carbon dioxide and a carbon dioxide-nitrogen mixture on zeolite 13X. Braz. J. Chem. Eng. 2011, 28, 533–544. [Google Scholar] [CrossRef]
  14. Belmabkhout, Y.; Sayari, A. Adsorption of CO2 from dry gases on MCM-41 silica at ambient temperature and high pressure. 2: Adsorption of CO2/N2, CO2/CH4 and CO2/H2 binary mixtures. Chem. Eng. Sci. 2009, 64, 3729–3735. [Google Scholar] [CrossRef]
  15. Rios, R.B.; Silva, F.W.M.; Torres, A.E.B.; Azevedo, D.C.; Cavalcante, C.L. Adsorption of methane in activated carbons obtained from coconut shells using H3PO4 chemical activation. Adsorption 2009, 15, 271–277. [Google Scholar] [CrossRef]
  16. Abdeen, Z.; Somaia; Mohammad, G. Study of the Adsorption Efficiency of an Eco-Friendly Carbohydrate Polymer for Contaminated Aqueous Solution by Organophosphorus Pesticide. J. Org. Polym. Mater. 2014, 4, 16–28. [Google Scholar] [CrossRef] [Green Version]
  17. Ion, V.A.; Parvulescu, O.C.; Dobre, T.; Duteanu, N.; Nitu, S.G. Modelling of Thermal Desorption of Volatile Organic Compounds from Activated Carbon. Rev. De Chim. 2015, 66, 703–706. [Google Scholar]
Figure 1. Adsorption performance of adsorbents: (A) 5 g; (B) 10 g; (C) 15 g.
Methane 01 00003 g001
Figure 2. Graph for the 20 min adsorption analysis: (A) 5 g, (B) 10 g, and (C) 15 g adsorbents.
Methane 01 00003 g002
Figure 3. The first vs. second measurements of 5 g additions of (A) activated carbon, (B) zeolites, and (C) Porapak.
Methane 01 00003 g003
Figure 4. Column CH4 adsorption of (A) 200 ppm, (B) 100 ppm, and (C) 50 ppm initial concentration.
Methane 01 00003 g004
Figure 5. CH4 thermal desorption with variations of initial concentration before adsorption.
Methane 01 00003 g005
Figure 6. Methane leakage monitoring conceptual design of proposed method.
Methane 01 00003 g006
Figure 7. Adsorbents: zeolites (a), porapak (b), and activated carbon (c).
Methane 01 00003 g007
Figure 8. Experimental setup of screening the adsorbents.
Methane 01 00003 g008
Figure 9. Experimental setup of adsorption in the column.
Methane 01 00003 g009
Figure 10. Experimental setup of diffusion to the atmosphere.
Methane 01 00003 g010
Figure 11. Thermal desorption.
Methane 01 00003 g011
Figure 12. Schematic process of proposed method.
Methane 01 00003 g012
Table 1. Amount of adsorbed CH4.
AdsorbentAmount of Adsorbed CH4
(10−3 mg/g Adsorbent)
5 g10 g15 g
Activated carbon1.1870.5850.317
Zeolites0.0170.0440.117
Porapak0.1500.1750.155
Table 2. Amount of CH4 adsorption in a column.
Initial Concentration (ppm)Final Concentration (ppm)Adsorbed CH4 Amount (10−3 mg/g-AC)
Without ACWith AC
20079.728.20.818
10038.213.20397
5018.48.240.161
Publisher’s Note: MDPI stays neutral with regard to jurisdictional claims in published maps and institutional affiliations.

