Article

Mechanisms, Growth Rates, and Morphologies of Gas Hydrates of Carbon Dioxide, Methane, and Their Mixtures

1
Department of Chemistry and Chemical Engineering, Royal Military College of Canada, Kingston, ON K7K 7B4, Canada
2
Department of Chemical Engineering, Universidad de Los Andes, Bogota111711, Colombia
*
Author to whom correspondence should be addressed.
Current address: Station Forces, P.O. Box 17000, Kingston, ON K7K 7B4, Canada.
Methane 2022, 1(1), 2-23; https://doi.org/10.3390/methane1010002
Submission received: 24 September 2021 / Revised: 15 November 2021 / Accepted: 18 November 2021 / Published: 25 November 2021

Abstract

:
Mechanisms of growth and dissociation, growth rates, and morphology of gas hydrates of methane, carbon dioxide, and two CH 4 :CO 2 mixtures (80:20 and 30:70 nominal concentration) were studied using using high resolution images and very precise temperature control. Subcooling and a recently proposed mass transfer-based driving force were used to analyze the results. When crystal growth rates did not exceed 0.01 mm/s, all systems showed faceted, euhedral crystal habits at low driving forces. At higher driving forces and growth rates, morphologies were different for all systems. These results solve apparent contradictions in literature about the morphology of hydrates of methane, carbon dioxide, and their mixtures. Differences in the growth mechanism of methane-rich and carbon dioxide-rich hydrates were elucidated. It was also shown that hydrate growth of methane, carbon dioxide, and their mixtures proceed via partial dissociation of the growing crystal. Temperature gradients were used to dissociate hydrates at specific locations, which revealed a most interesting phenomenon: On dissociation, carbon dioxide-rich hydrates propagated onto the bare substrate while drawing water from the opposite side of the sample. Furthermore, it was shown that an abrupt change in morphology common to all systems could be correlated to a change in the slope of growth rate data. This change in morphology was explained by a shift in the crystal growth mechanism.

1. Introduction

Gas hydrates, hereafter called hydrates, are crystalline, non-stoichiometric compounds (approximately composed of 85% water and 15% guest on a molar basis) that are formed when a small molecule (guest) is trapped inside an hydrogen bonded cage [1]. Hydrates are typically formed at temperatures below 300 K and pressures above 0.6 MPa [2]. Depending on the type of guest molecule, different clathrate structures will crystallize. Carbon dioxide, methane, and their mixtures form cubic structure I (sI) [3].
Hydrate formation is a phase transformation which requires a supersaturated environment to occur [4]. Crystallization of hydrates can be divided into nucleation and growth steps [5,6]. Hydrate nucleation is the process during which small hydrate nuclei form and disappear until the required critical size for sustained growth is achieved [3,6]. The duration of the nucleation period is stochastic and is best studied with equipment designed specifically for that purpose [7,8]. Classical homogeneous nucleation theory has been used to describe hydrate nucleation; however, in typical laboratory conditions, heterogeneous nucleation is more likely to occur due to the presence of small impurities or surfaces containing the sample [3]. Readers interested in gas hydrate nucleation are referred to a recently published monograph on the subject [9].
In this work, we bypass the complications associated with studying nucleation of gas hydrates by working with systems that have “memory”. The meaning of the word “memory” has been subject of some debate [10,11]. From a strictly practical point of view, we take “memory” to mean: a system where aqueous clathrates have been formed and dissociated and for which subsequent hydrate morphology and crystal growth rates are highly reproducible. Hydrate growth models have been recently reviewed [12]. Surfaces also play an important role in hydrate growth: for example, surfaces with varying degrees of wettability can produce different morphologies at the same subcooling [13].
Carbon dioxide and methane hydrates have been found to have many applications in environmental and industrial fields. For instance, atmospheric CO 2 could be sequestered by hydrate formation in deep sea sediments to reduce the greenhouse effect and facilitate CH 4 extraction from natural gas reservoirs [14,15]. Another application is the CO 2 and CH 4 extraction from power plants emissions by hydrate-based gas separation [14]. Polycrystalline clathrate films will inevitably form when methane and carbon dioxide are in contact with water at the appropriate thermodynamic conditions. Knowledge of mesoscopic surface morphology and growth mechanisms is important to produce physically sound models and to develop either hydrate management alternatives (kinetic inhibitors and anti-agglomerants for oil and gas operations) or hydrate promoters.
While several studies on the mesoscopic crystal habit of CO 2 and CH 4 hydrates have been carried out in the past [16,17,18,19,20,21,22,23], a clear difference between the morphology of these hydrates has not been established. In general, CH 4 hydrates that grow from water droplets have been reported to have granular crystal morphologies, although there are reports of dendritic growth [24]. Discrepancies appear among the studies on CO 2 hydrate morphologies. Servio and Englezos (2003) reported jagged hydrate film morphologies for both CO 2 and CH 4 hydrates, with no appreciable difference between the guest molecules [19]. In stark contrast with the CH 4 morphologies reported by Beltran and Servio (2010) [24], Decarie and Beltran (2011) reported spherulitic films for CO 2 hydrates [25]. Uchida et al. (1999) reported dendritic CO 2 hydrate morphologies [16].
Conflicting reports exist on the effect of composition on mixed CH 4 : CO 2 hydrate morphology. Ueno et al. (2015) found that feed gas composition had no effect on hydrate morphology. Polygonal and dendritic crystal habits were reported at low and high driving forces, respectively [23]. David et al. (2015) found an effect of composition on the mixed hydrate morphology. Smooth crystal habits were found on CH 4 -rich mixtures and well defined crystalline facets for CO 2 -rich mixtures [22].
Using neutron reflectivity, Koga et al. (2010) found Angstrom-scale surface roughing of the water surface upon contact with methane before hydrate formation [26]. This surface remained unchanged until a macroscopic hydrate film developed. In a similar experiment with gaseous carbon dioxide, but using X-ray reflectivity, it was found that the water interface remained intact until hydrates were formed [27]. This clearly suggests that despite being structure I formers, CO 2 and CH 4 form through different mechanisms at the molecular level.
Studies using analytical techniques have shown that methane is preferentially consumed during early stages of CH 4 :CO 2 hydrate formation [28,29,30]. Studies using Raman spectra have shown that small cages of structure I, which are occupied preferentially by CH 4 , are formed before any enclathration of CO 2 occurred [31]. The early formation of CH 4 hydrates is thought to hinder the enclathration of CO 2 into the hydrate phase [31]. Furthermore, it has been proposed that the formation of these binary hydrates is controlled by the competition between the two guests for occupancy of structure I large cages [32]. The occupancy of the different cages and the stability of the resulting hydrate could be related to weak intermolecular interactions between the host and the guest molecules [33,34]. In contrast, equilibrium compositions of the hydrate phase usually see enrichment of CO 2 when compared to the feed gas [29,31,35].
For both CO 2 and CH 4 clathrates, the size of the crystals that compose the hydrate film has been found to decrease with increasing subcooling [18,20,36]. Ohmura et al. (2004, 2005) and Ueno et al. (2015) reported a transition from polyhedral to dendritic crystal morphologies with increasing subcooling, for both CO 2 and CH 4 hydrates [18,20,23]. Freer et al. (2001) reported a morphological transition between well defined crystals to a rough film with increasing driving force for methane hydrates [37]. This transition from well-defined, single crystal structures to spherulitic morphologies with the increasing subcooling is attributed to diffusion limitations, arising from environmental constraints imposed by changes in temperature [38].
In general, subcooling has been used as a criterion to classify the hydrate morphology [36], although at higher driving forces (i.e., ≳7.9 K), morphology differences between both guest molecules are less evident [18,20,36]. Kitamura et al. (2013) found a sawtooth, anisotropic growth pattern for the growing CH 4 hydrate films, at low driving forces whilst at higher driving forces (≳2.5 K) the pattern became non-faceted, smoother and isotropic [39]. Magill (2001) points out that it is precisely anisotropy, alongside surface tension and diffusion constraints, one of the three leading factors that affect morphology, since the system will change to the most stable spatial configuration for the imposed crystallization conditions [38]. Servio and Englezos (2003) reported slightly jagged morphologies with ’needle-like’ crystals extending from the hydrate film into the hydrate guest phase at high driving forces, but not at low driving forces [19].
The degree of subcooling is also associated with a difference in concentration at the bulk of the liquid and at the liquid-hydrate interface (Figure 1). Each temperature, namely the experimental temperature ( T e x p ) and the hydrate–liquid–vapor equilibrium temperature ( T H L V ), has an equilibrium concentration of guest molecule in the liquid phase associated with it [18,40,41]. Since the solubility of CO 2 is approximately 20 times that of CH 4 [41], and even if Δ T s u b , T e x p and T H L V are matched, the difference in mole fraction of guest molecule between the bulk liquid and the hydrate interface ( Δ x ) should be greater for CO 2 than for CH 4 (Figure 1a). This suggests a mass transfer-based driving force could be an adequate way to explain the differences in growth mechanisms and film growth rates of methane and carbon dioxide [18,40,41].
Even under the same degree of subcooling, this solubility difference could be accountable for the differences for the hydrate film growth velocities of CO 2 and CH 4 observed in the literature. Ohmura et al. showed that n Δ x g better correlates quiescent hydrate growth rates than Δ T s u b [40,43]. Other studies classified morphology using similar mass transfer limited driving forces [18,44].
The growth rates of CO 2 and CH 4 hydrate films have been studied separately by different authors [16,22,37,39,45]. Both Freer et al. (2001) for methane [37], and Peng et al. (2007) for CO 2 and CH 4 [21], reported that film growth rates increased with increasing subcooling. However, both also found that hydrate growth rates decreased with decreasing experimental temperature, when compared at the same subcooling.
The state-of-the-art can be summarized as follows:
  • It is not clear whether morphology is dependent on the guest molecule, the driving force, or other variables. Some authors report morphological differences between CO 2 and CH 4 hydrates and their mixtures, but for other groups, those differences are less evident or even negligible.
  • Although there is a clear correlation between Δ T s u b and morphology, CO 2 and CH 4 hydrates have not been formed at the exact same temperatures, subcoolings, and precursor phases, which makes it difficult to compare morphology and growth mechanisms between methane, carbon dioxide, and their mixtures.
  • It has not been established whether the formation of these hydrates is a mass transfer or heat transfer limited process. Solubilities, heat of formation, and intrinsic rates of formation for CO 2 and CH 4 differ considerably between each other and may have a role on the hydrate growth velocities and morphologies.
The objective of this work is to resolve apparent discrepancies on the morphology of carbon dioxide, methane and their mixtures while comparing the growth mechanism, growth kinetics, and crystal morphology of CO 2 and CH 4 hydrates. A recently proposed mass transfer-based driving force ([40]) and subcooling will be used to analyze the results. By matching subcooling ( Δ T s u b ), experimental ( T e x p ), and equilibrium ( T H L V ) temperatures, we maintained comparable heat transfer conditions for CH 4 and CO 2 and were able to provide further insight into the mechanisms governing hydrate formation.

2. Materials and Methods
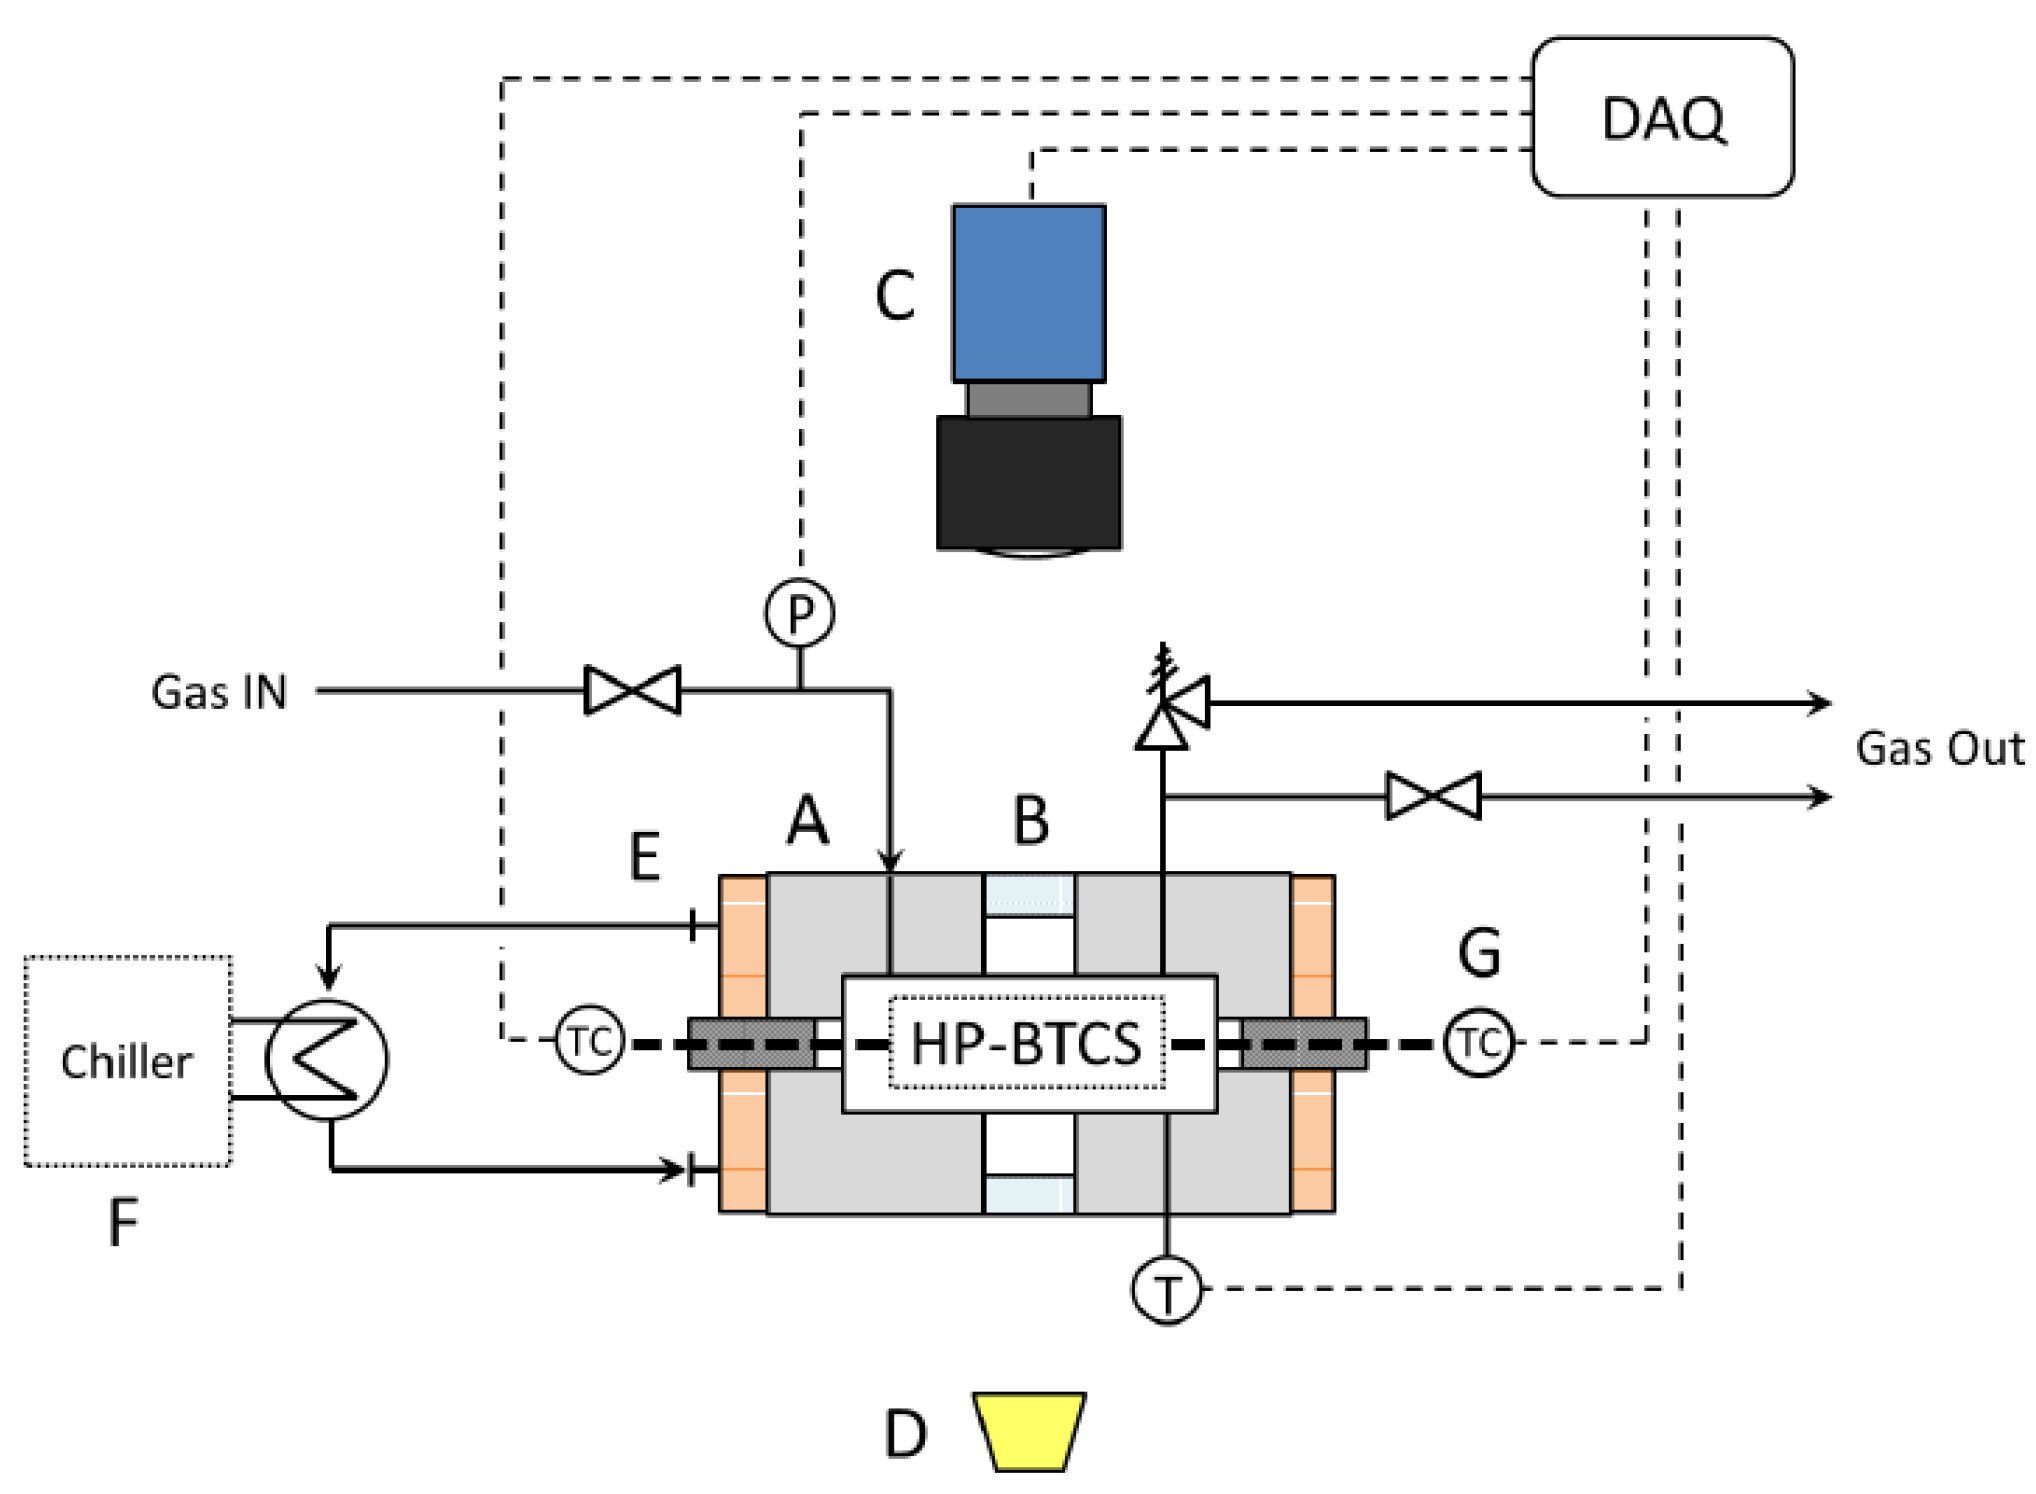
2.1. Apparatus

The crystallizer used for our experiments was recently developed in our lab. The reader is referred to the original reference for details [46]. Briefly, a stainless steel, refrigerated vessel houses a bilateral temperature control stage (HP-BTCS) (Figure 2). The steel vessel provides a sealed, high pressure atmosphere and bulk temperature control, while temperatures on opposite sides of the stage are independently and precisely controlled using two thermoelectric coolers (TEC). Samples are observed through the top of the reactor with a PCO.edge 5.5 sCMOS camera (Optikon, ON, Canada). A Nikon AF Micro-Nikkor 60 mm lens (Optikon, ON, Canada) was used for low magnification images and an Infinity KC microscope with IF series objectives (Optikon, ON, Canada) were used for high magnification images. The pressure in the cell was measured by a Rosemount 3051s pressure transmitter (Laurentide Controls, QC, Canada) and the bulk temperature inside of the cell was monitored with a platinum RTD probe (Omega Engineering, QC, Canada). Instrumental standard uncertainties were as follows: for bulk temperature u T R T D = 0.32 K and for pressure u p = 0.005 MPa.
Both ends of the stage were equipped with a thermoelectric cooler (TEC) (TE Technology, Traverse City, MI, USA). A sapphire slide was used to hold the water sample and bridge the two ends of the stage. Slide temperatures were measured by thermistor elements (TE Technology, Traverse City, MI, USA) with an instrumental standard uncertainty of u T t h e r m i s t o r = 0.01 K.

2.2. Methods

A pre-cleaned sapphire slide was set on the temperature control stage in the reactor. Using a micro pipette, 20 μ L of water were transferred onto the slide. The reactor was then sealed, purged with 99.99% nitrogen (Air Liquide, Quebec City, QC, CA), and finally purged with one of the gases on Table 1. Gas mixture compositions were chosen in order to draw comparisons with the morphology and hydrate–liquid–vapor (HLV) equilibrium data of methane-rich and carbon dioxide-rich CH 4 :CO 2 mixtures available in literature. We will be referring to mixtures by their nominal composition (CH 4 :CO 2 ); however, Table 1 provides the exact composition as provided by the supplier. The water sample was pre-treated by forming ice, then hydrate and dissociating the latter before setting the stage at the experimental conditions. Experimental pressure was kept constant during each run. After dissociating hydrates formed from ice, the experimental temperature was set to the desired profile.
Two types of temperature profiles were used: constant temperature gradient (Figure 3a) and uniform surface temperature (Figure 3b). For the uniform surface temperature experiments, both TECs were cooled to the same experimental temperature. During the constant temperature-gradient experiments, one of the TECs was cooled slightly above T H L V while the other TEC was set to achieve a 4 K difference along the slide. We have previously shown that by choosing the appropriate thickness and length of a sapphire slide for our apparatus, we obtain a linear temperature distribution for gradient experiments and a constant temperature for uniform temperature experiments [46]. By knowing the temperature distribution and the temperatures at both ends of the slide, it is possible to calculate the temperature at each point of the slide with an uncertainty of less than 0.2 K. Constant gradient experiments allowed for the observation of hydrate growth subject to several subcoolings during a single experiment.
The experimental pressures were chosen in order to run CH 4 and CO 2 experiments at the same temperature, while maintaining identical degrees of subcooling for both guests, as depicted in Figure 4. For consistency, the conditions of the first experiment match those of our previous work with methane [46].
To determine crystal growth velocities, we use still frames of high-resolution video recordings to determine the position of the growth front at times t 0 and t 1 . The velocity is then calculated by a finite difference approximation. The instrumental uncertainties associated with this method are as follows: for distance measurements u x = 12 μ m, for time measurements, u t = 1 μ s. We have previously shown that growth velocity, determined in this manner, remains constant with respect to time and space for the time scales of interest in our experiments [46].

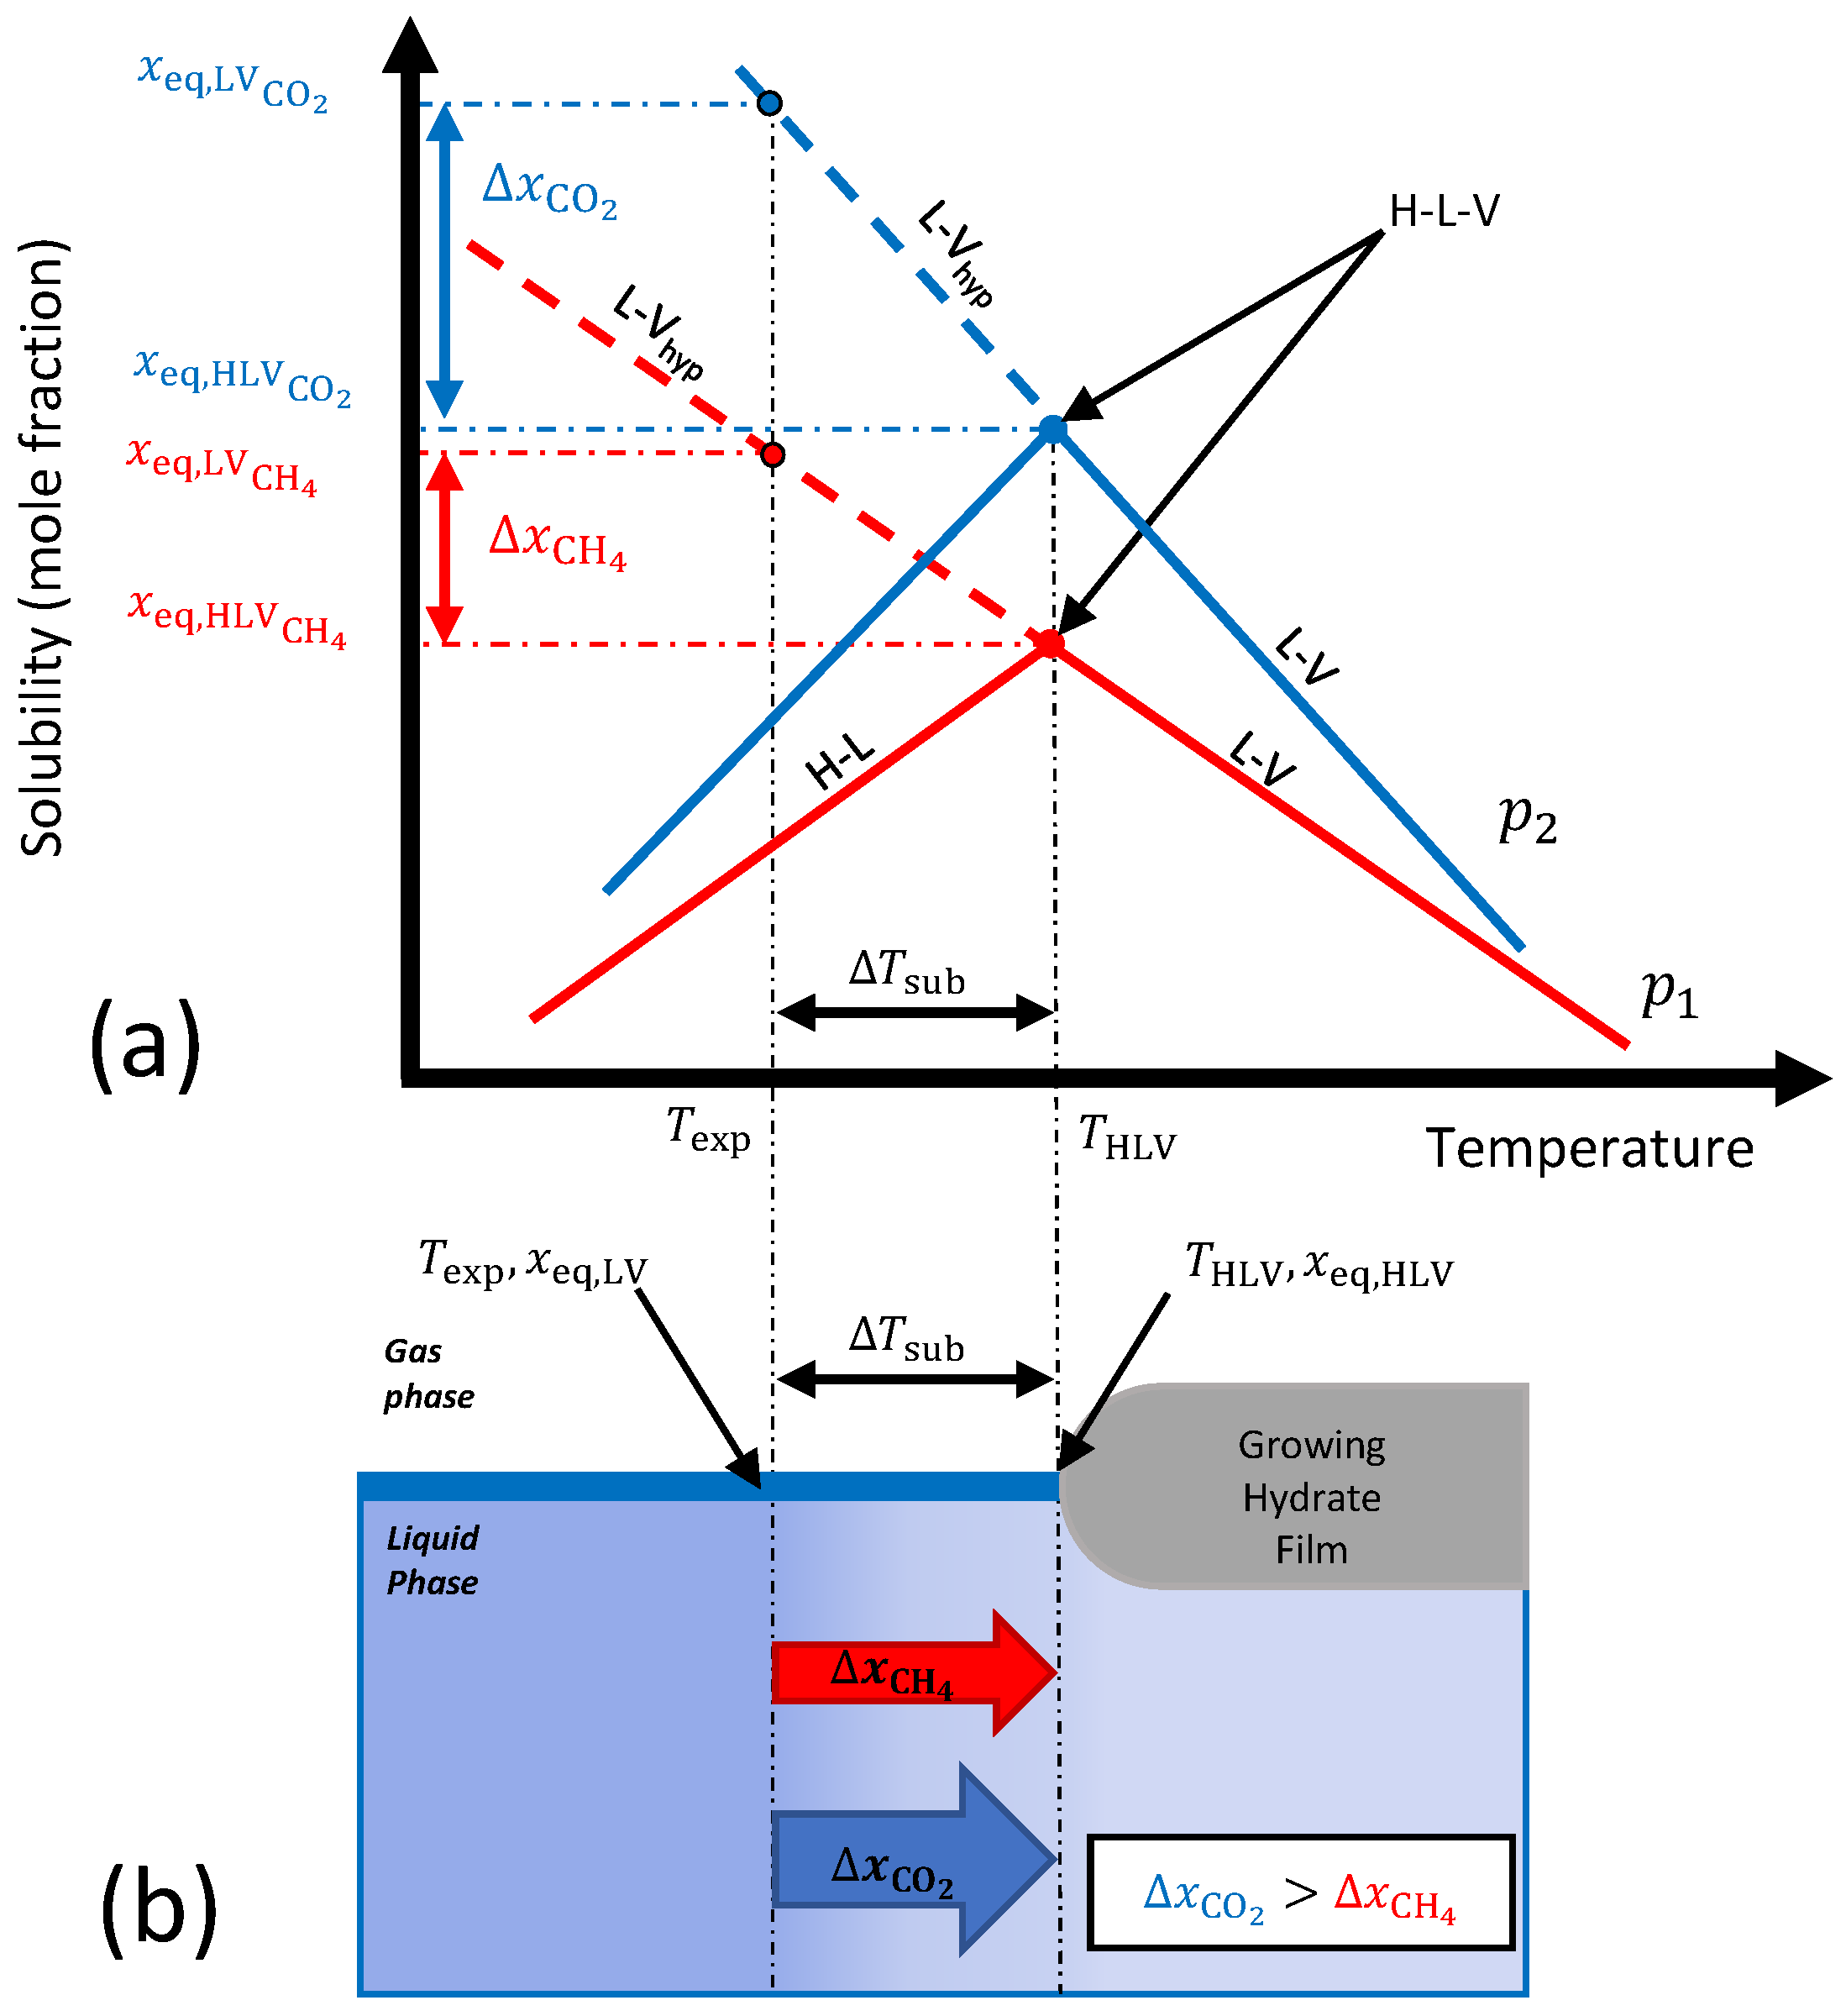
2.2.1. Mass Transfer-Based Driving Force

Volumetric growth rate has been proposed to be proportional to the difference in guest solubility between the growing crystal at the hydrate–liquid–vapor interface and the bulk liquid phase [40]:
V ˙ h n Δ x g
The difference in solubility Δ x g has been defined [43] as:
Δ x g = x e q , L V x e q , H L V
where x e q , L V is the mole fraction of the guest molecule in the liquid water phase at the liquid water–guest gas interface, far away from the growing hydrate front, and under hypothetical liquid–vapor equilibrium at P e x p and T e x p ; and x e q , H L V is the mole fraction of the guest molecule in liquid water phase, very close to the growing hydrate interface, under HLV equilibrium at P e x p and T H L V (Figure 1). The hydration number n, represents the number of water molecules per guest molecule. The equilibrium mole fractions ( x e q , H L V , x e q , L V ) were calculated following Englezos et al. (1987) [4], who calculated the solubility of a guest molecule in the liquid phase using the expression:
x e q = f ( T , P ) H
where f is the fugacity of the pure guest molecule at the pressure and temperature of the system and H is Henry’s constant. All fugacities were calculated at the constant experimental pressure, P e x p . In the case of x e q , L V , T e x p was used to calculate fugacity, whereas T H L V was used to calculate the fugacity for x e q , H L V . The fugacities were calculated with the Trebble–Bishnoi equation of state [47] and Henry’s law constants were taken from Fogg and Gerrard (1991) [48]. The difference in solubility was scaled by the hydration number n for the guest molecule, following Kishimoto and Ohmura (2012) [40]. Heriot Watt University’s HWPVT package was used to calculate hydration numbers.

2.2.2. Extension for Mixtures

We extended Kishimoto’s mass transfer driving force to mixtures. In order to do this, it was necessary to modify the equilibrium expression as follows:
x i , e q , L V = y i f i ( T , P ) H i
where ideal solution and infinite dilution in the liquid phase were assumed. In addition, it is necessary to account for the presence of two guests:
ν 1 g 1 + ν 2 g 2 + n H 2 O 1 Hyd
where g are the hydrate guests, n is the hydration number and the Greek letter nu ( ν ) are the stoichiometric coefficients of each guest. This coefficient is found through the hydrate phase composition. Heriot-Watt University’s HWPVT package was used to calculate stoichiometric coefficients and hydration number for the two mixtures. Volumetric growth rate of the hydrate film is then correlated to:
V h ˙ n Δ x g 1 ν 1
The derivation of this relationship can be found in the supporting material.

2.3. Experimental Conditions

Table 2 summarizes the experimental conditions used in this study. All experiments were done in triplicate.

3. Results and Discussion

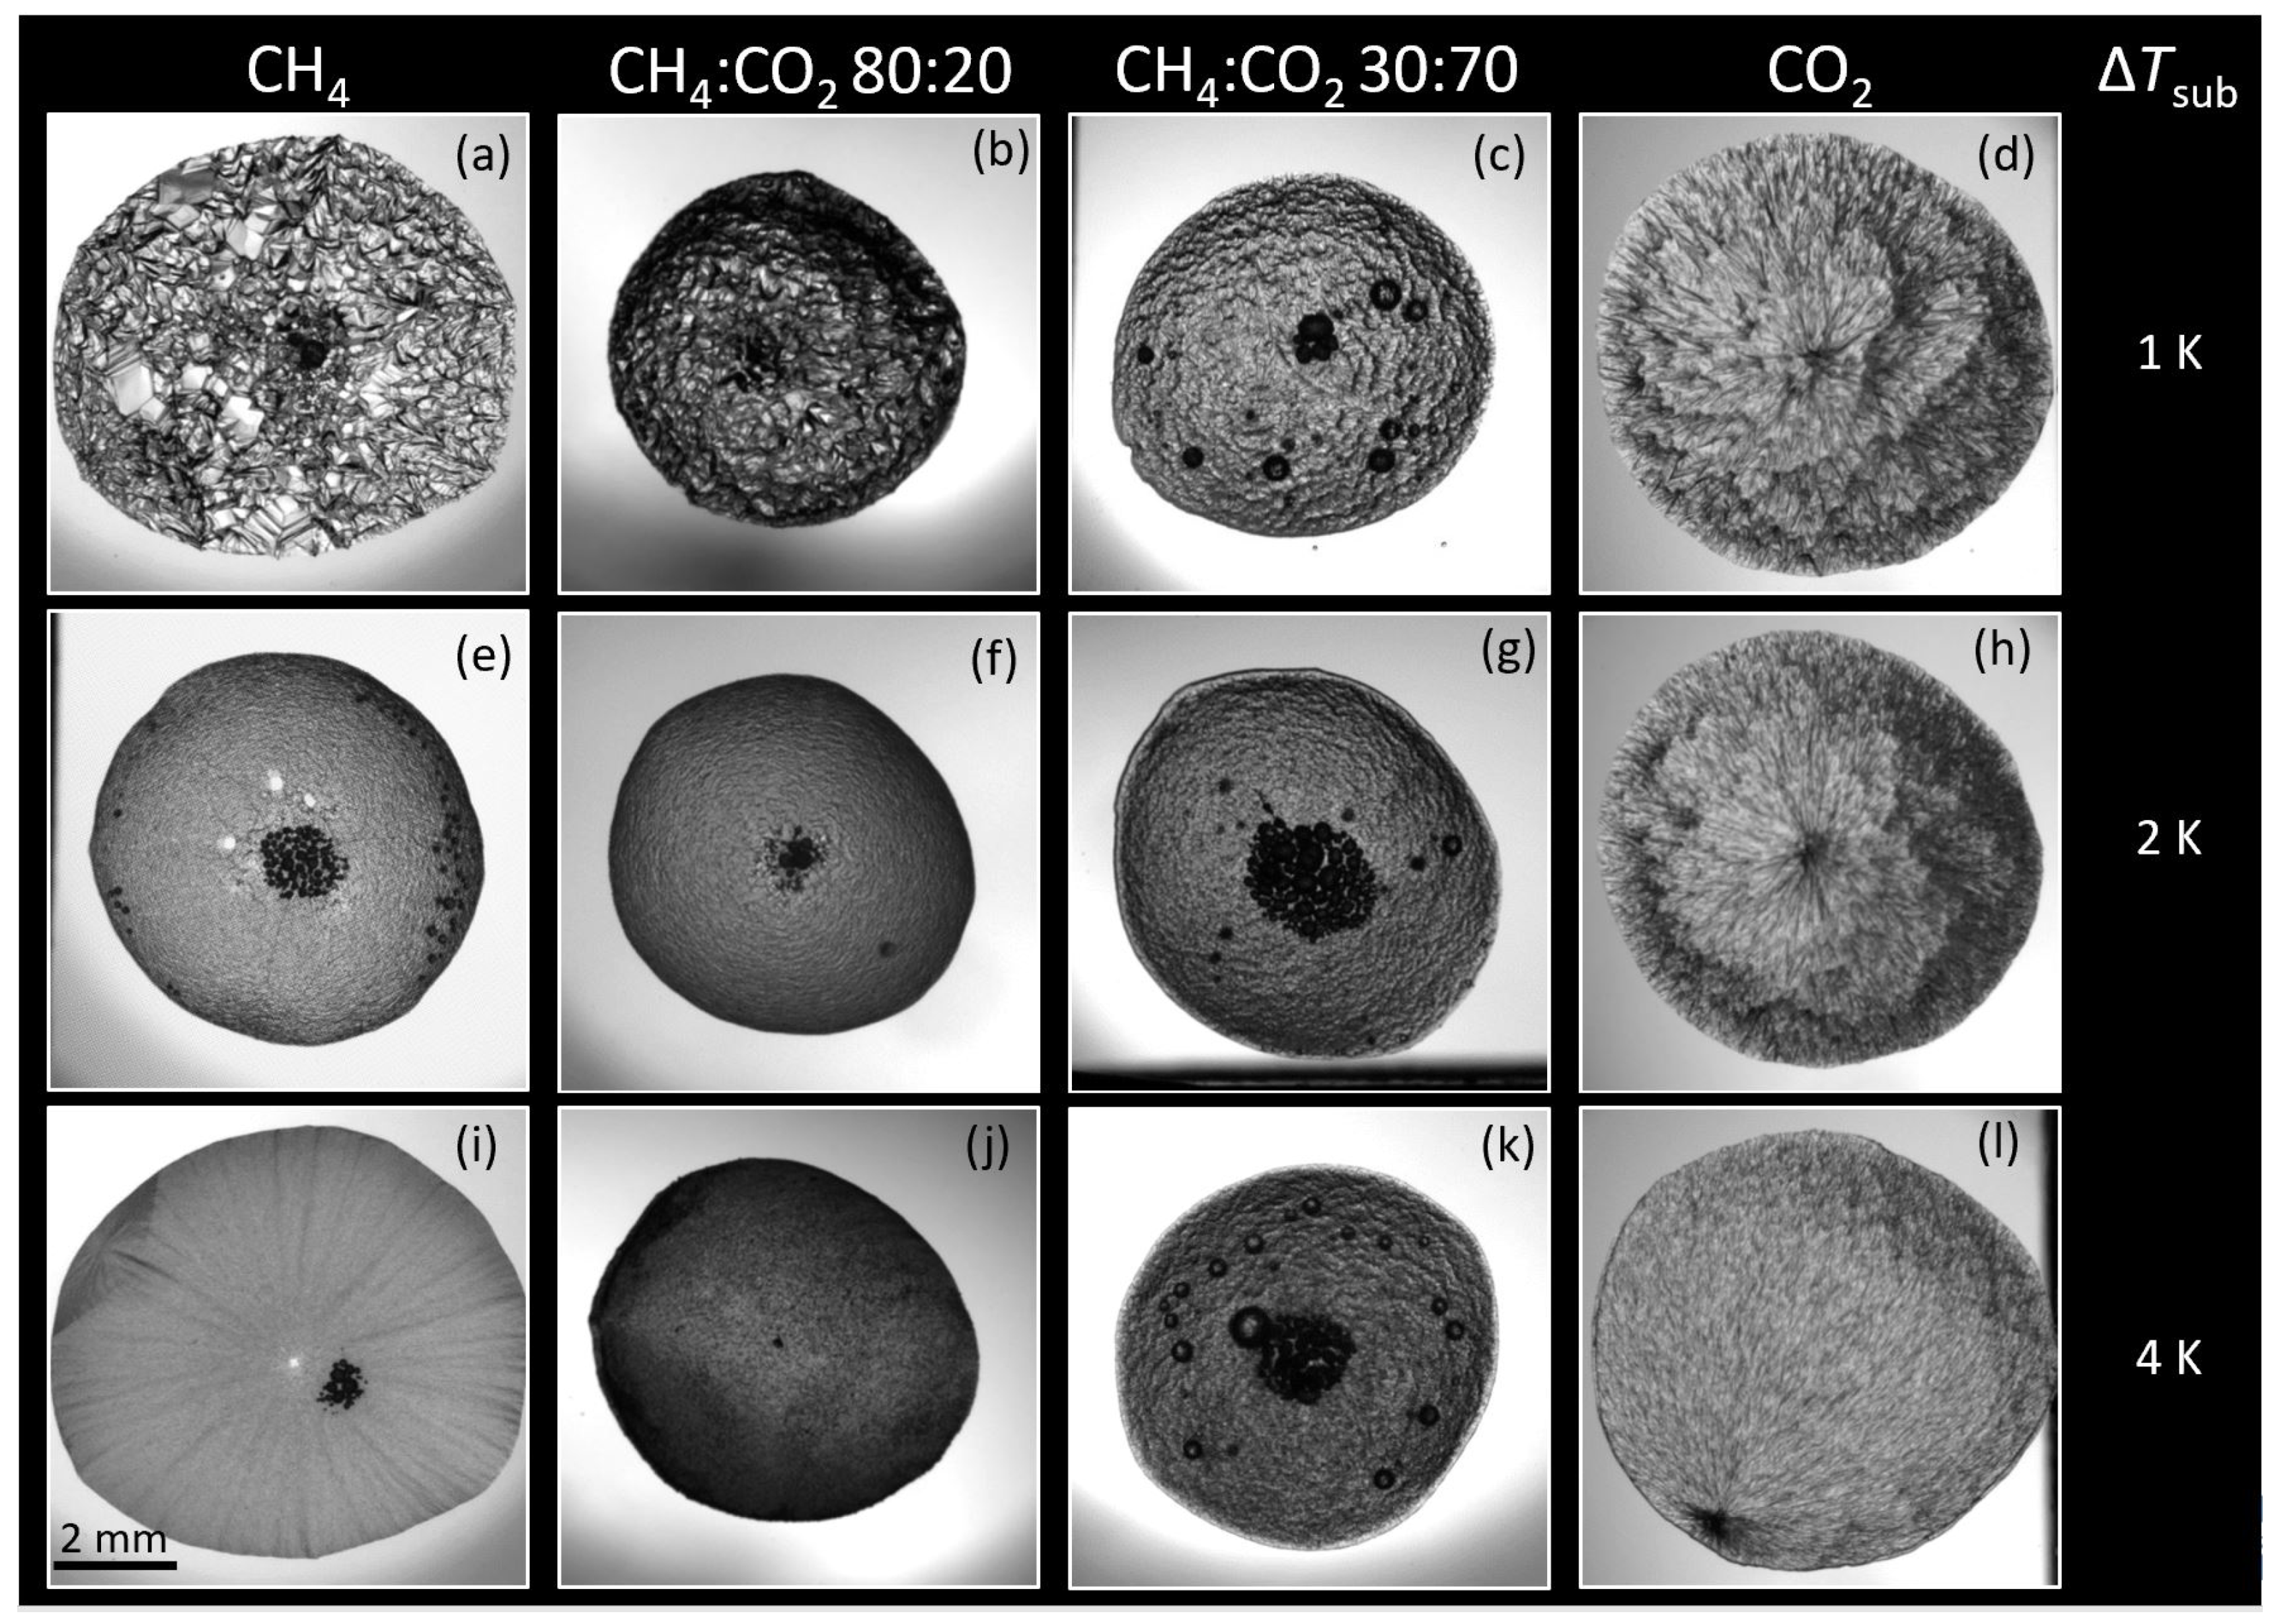
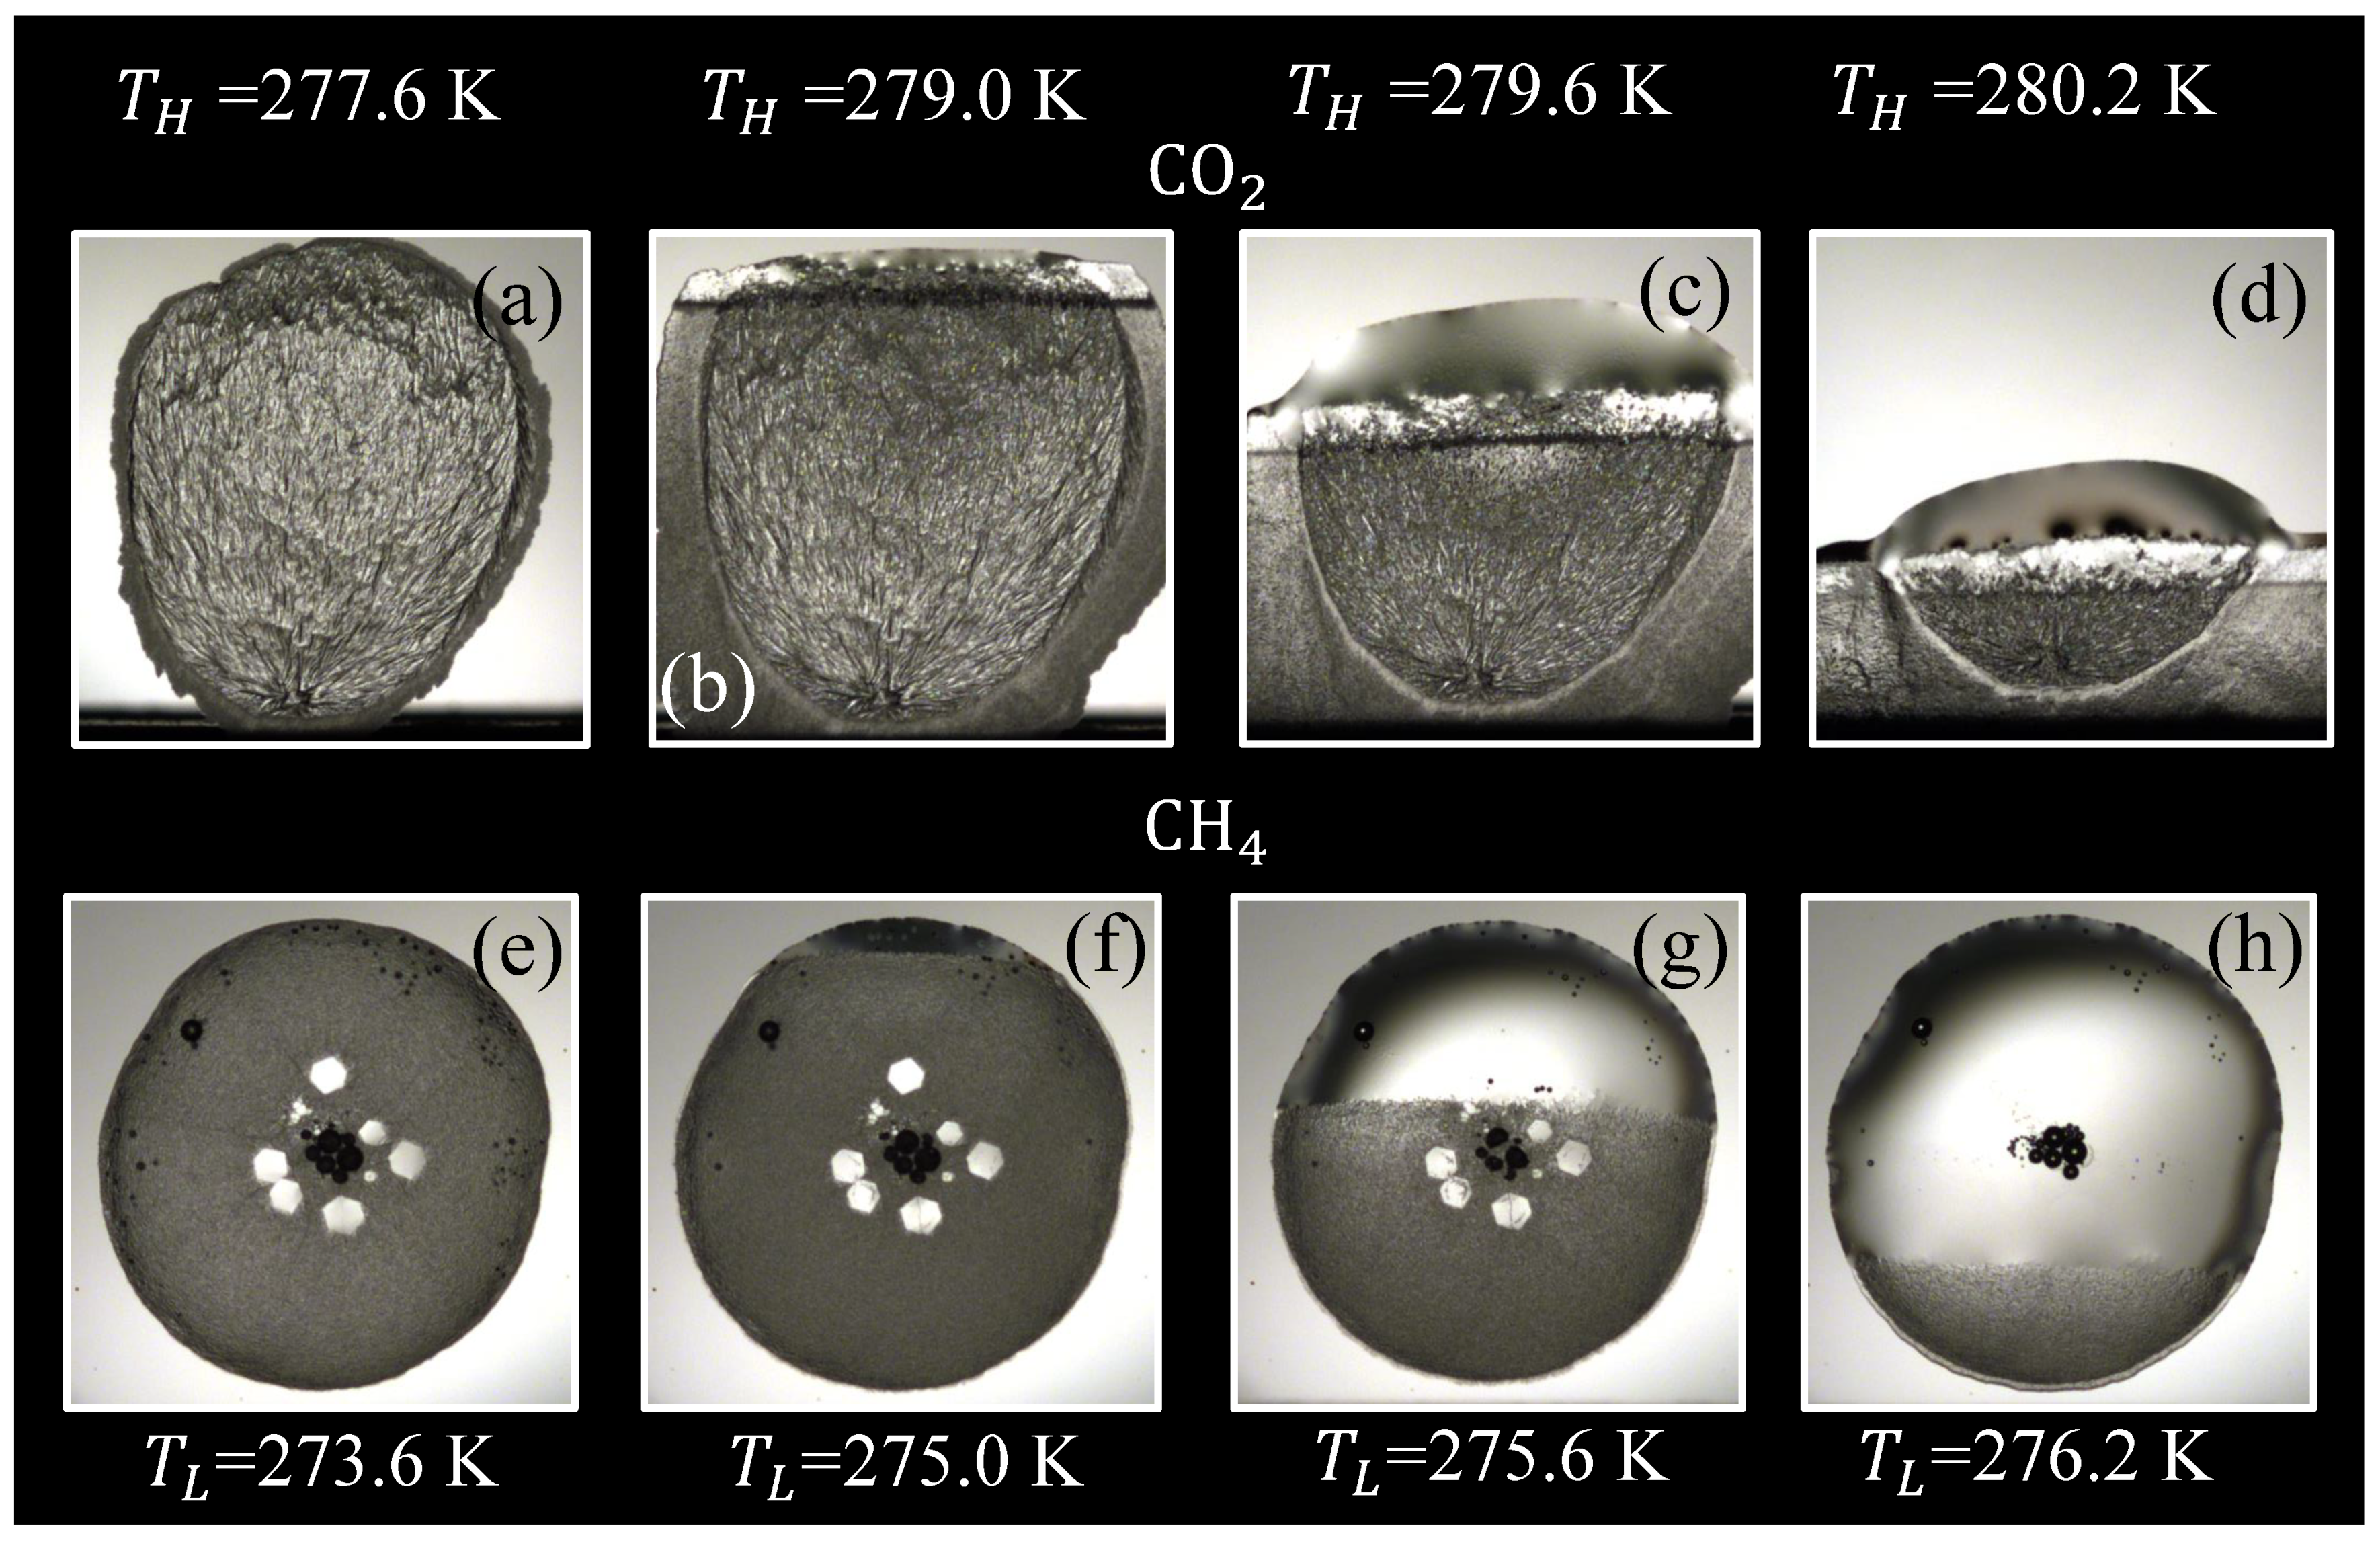
3.1. Hydrate Morphology
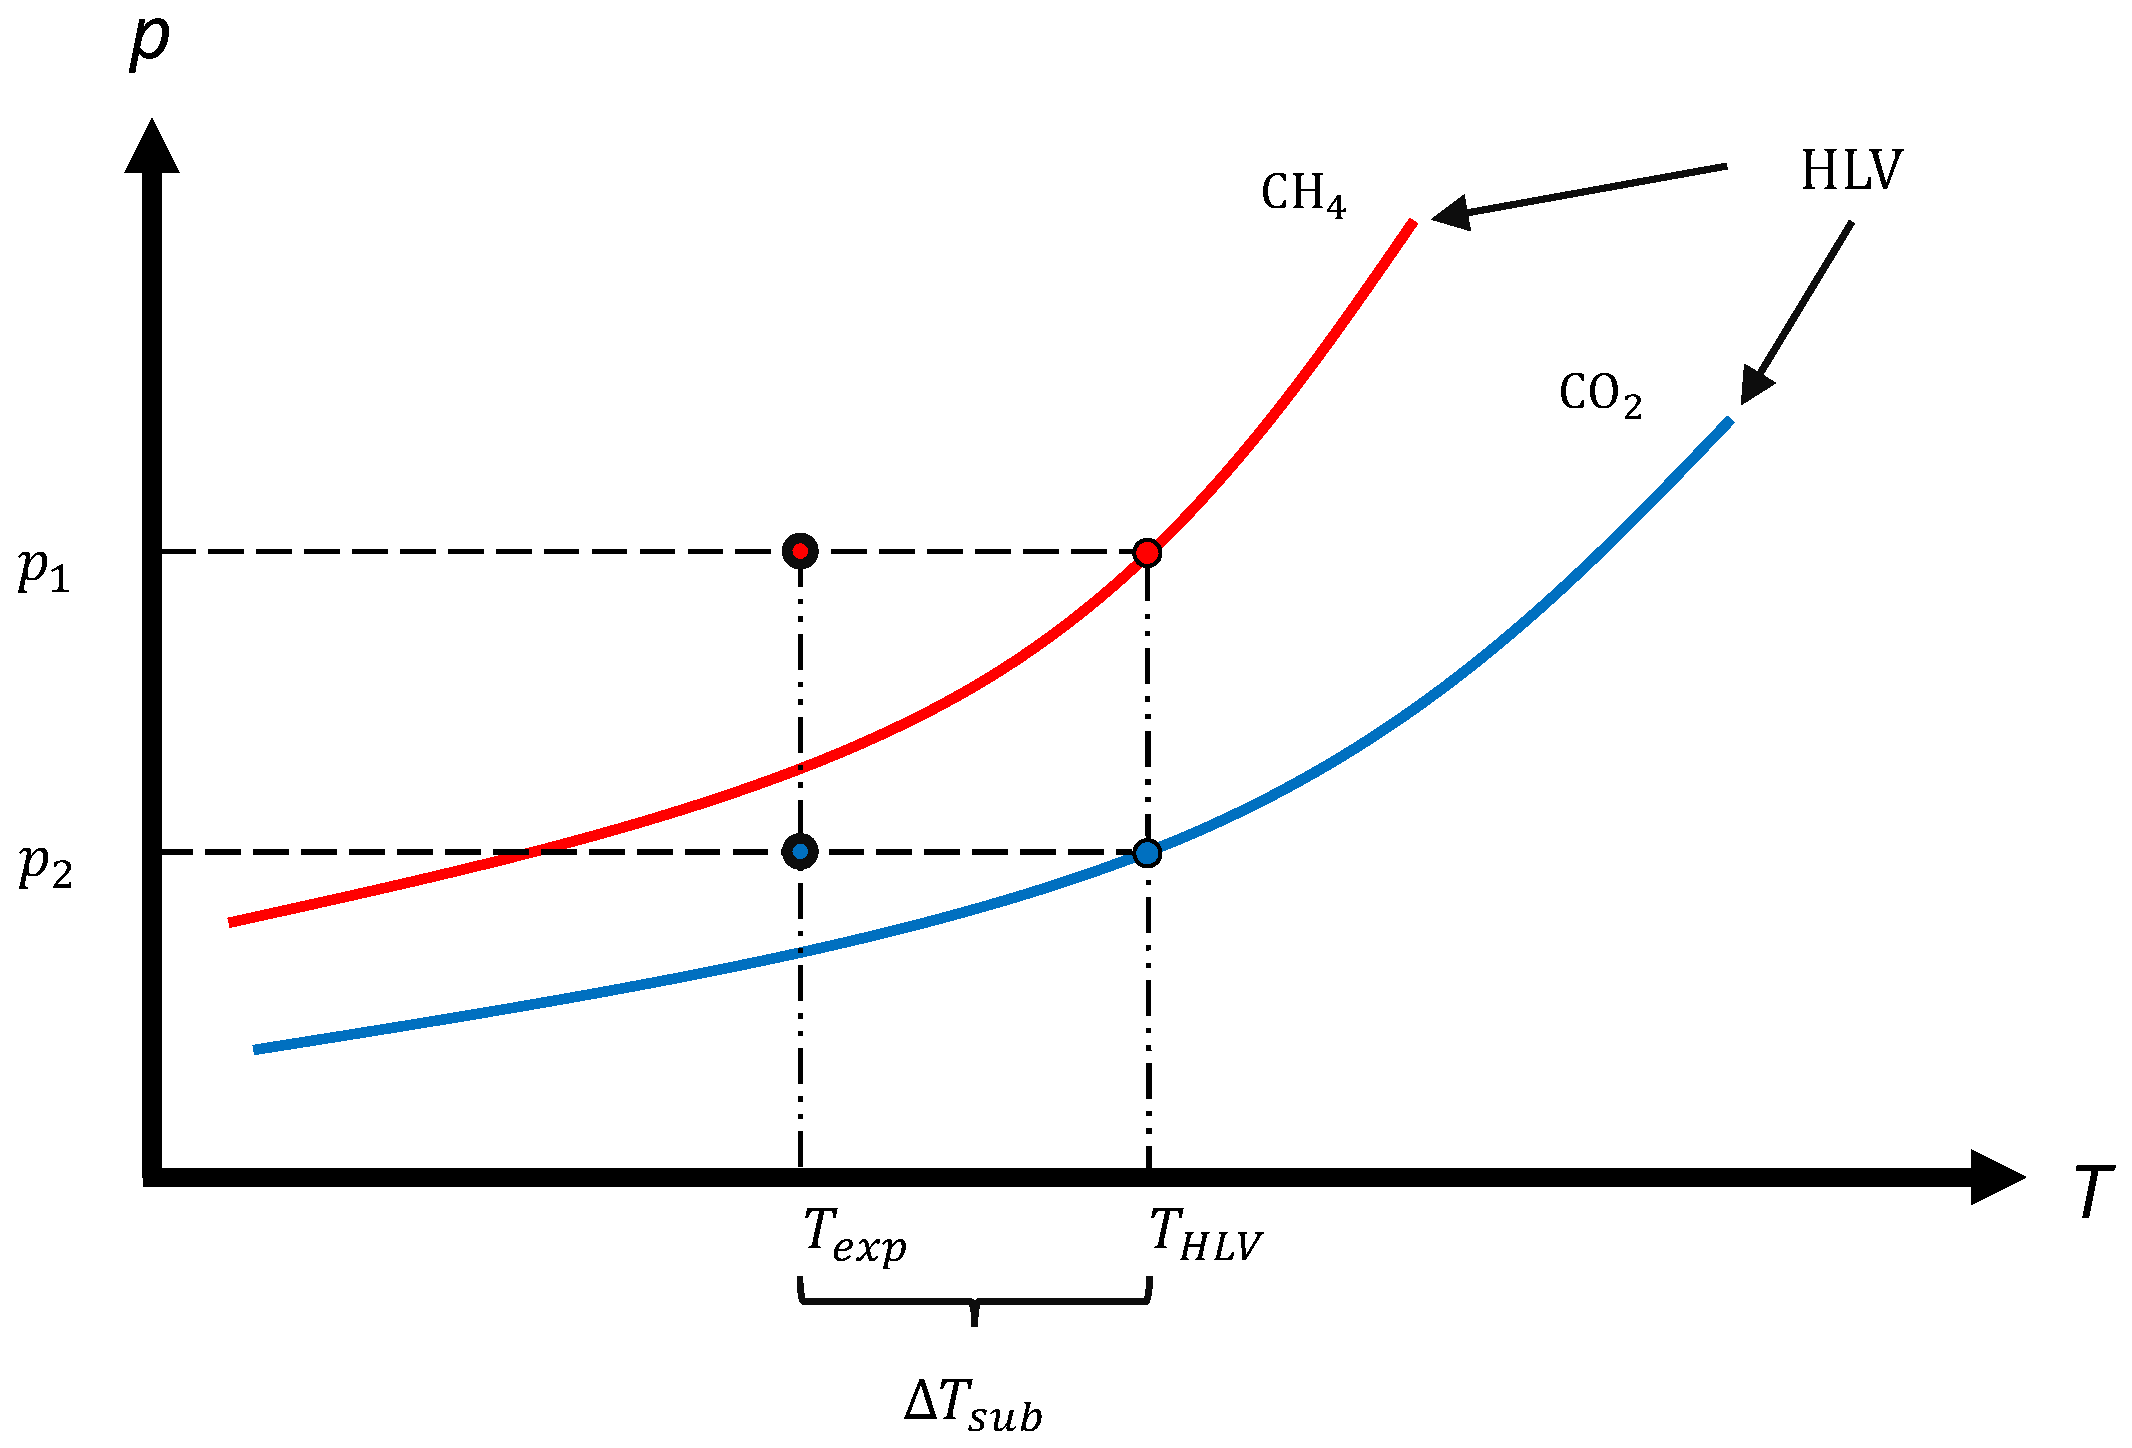
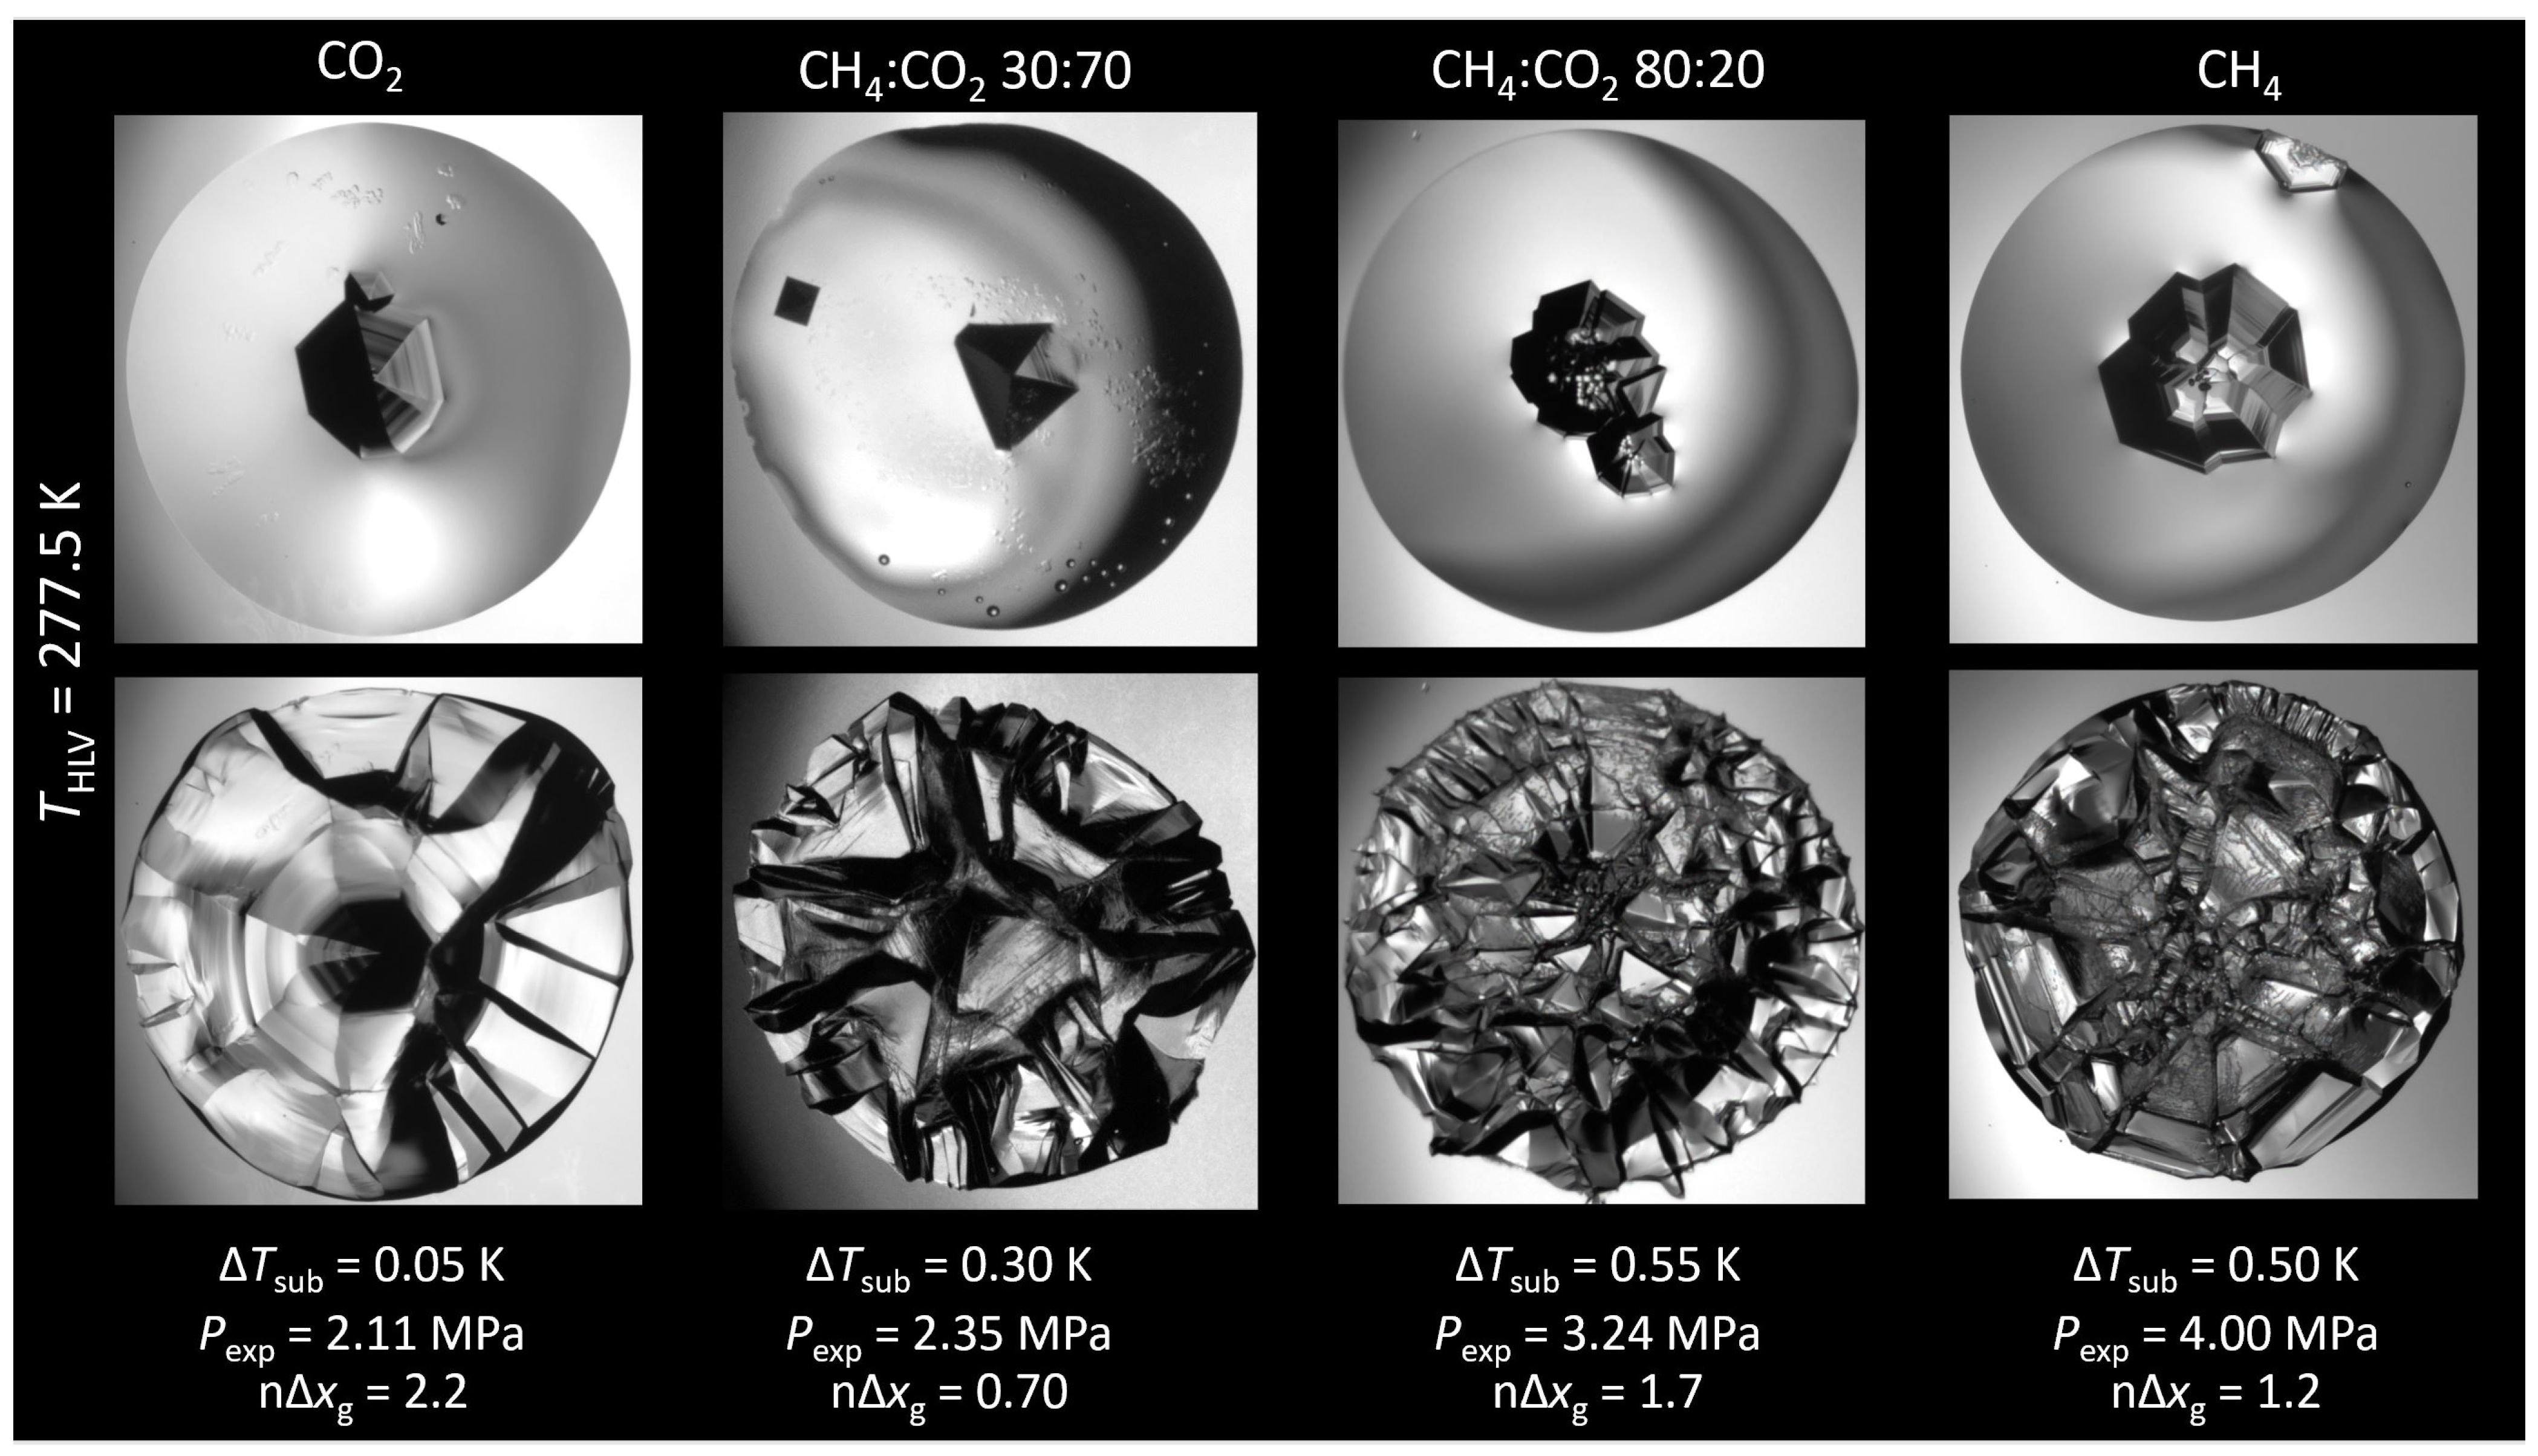
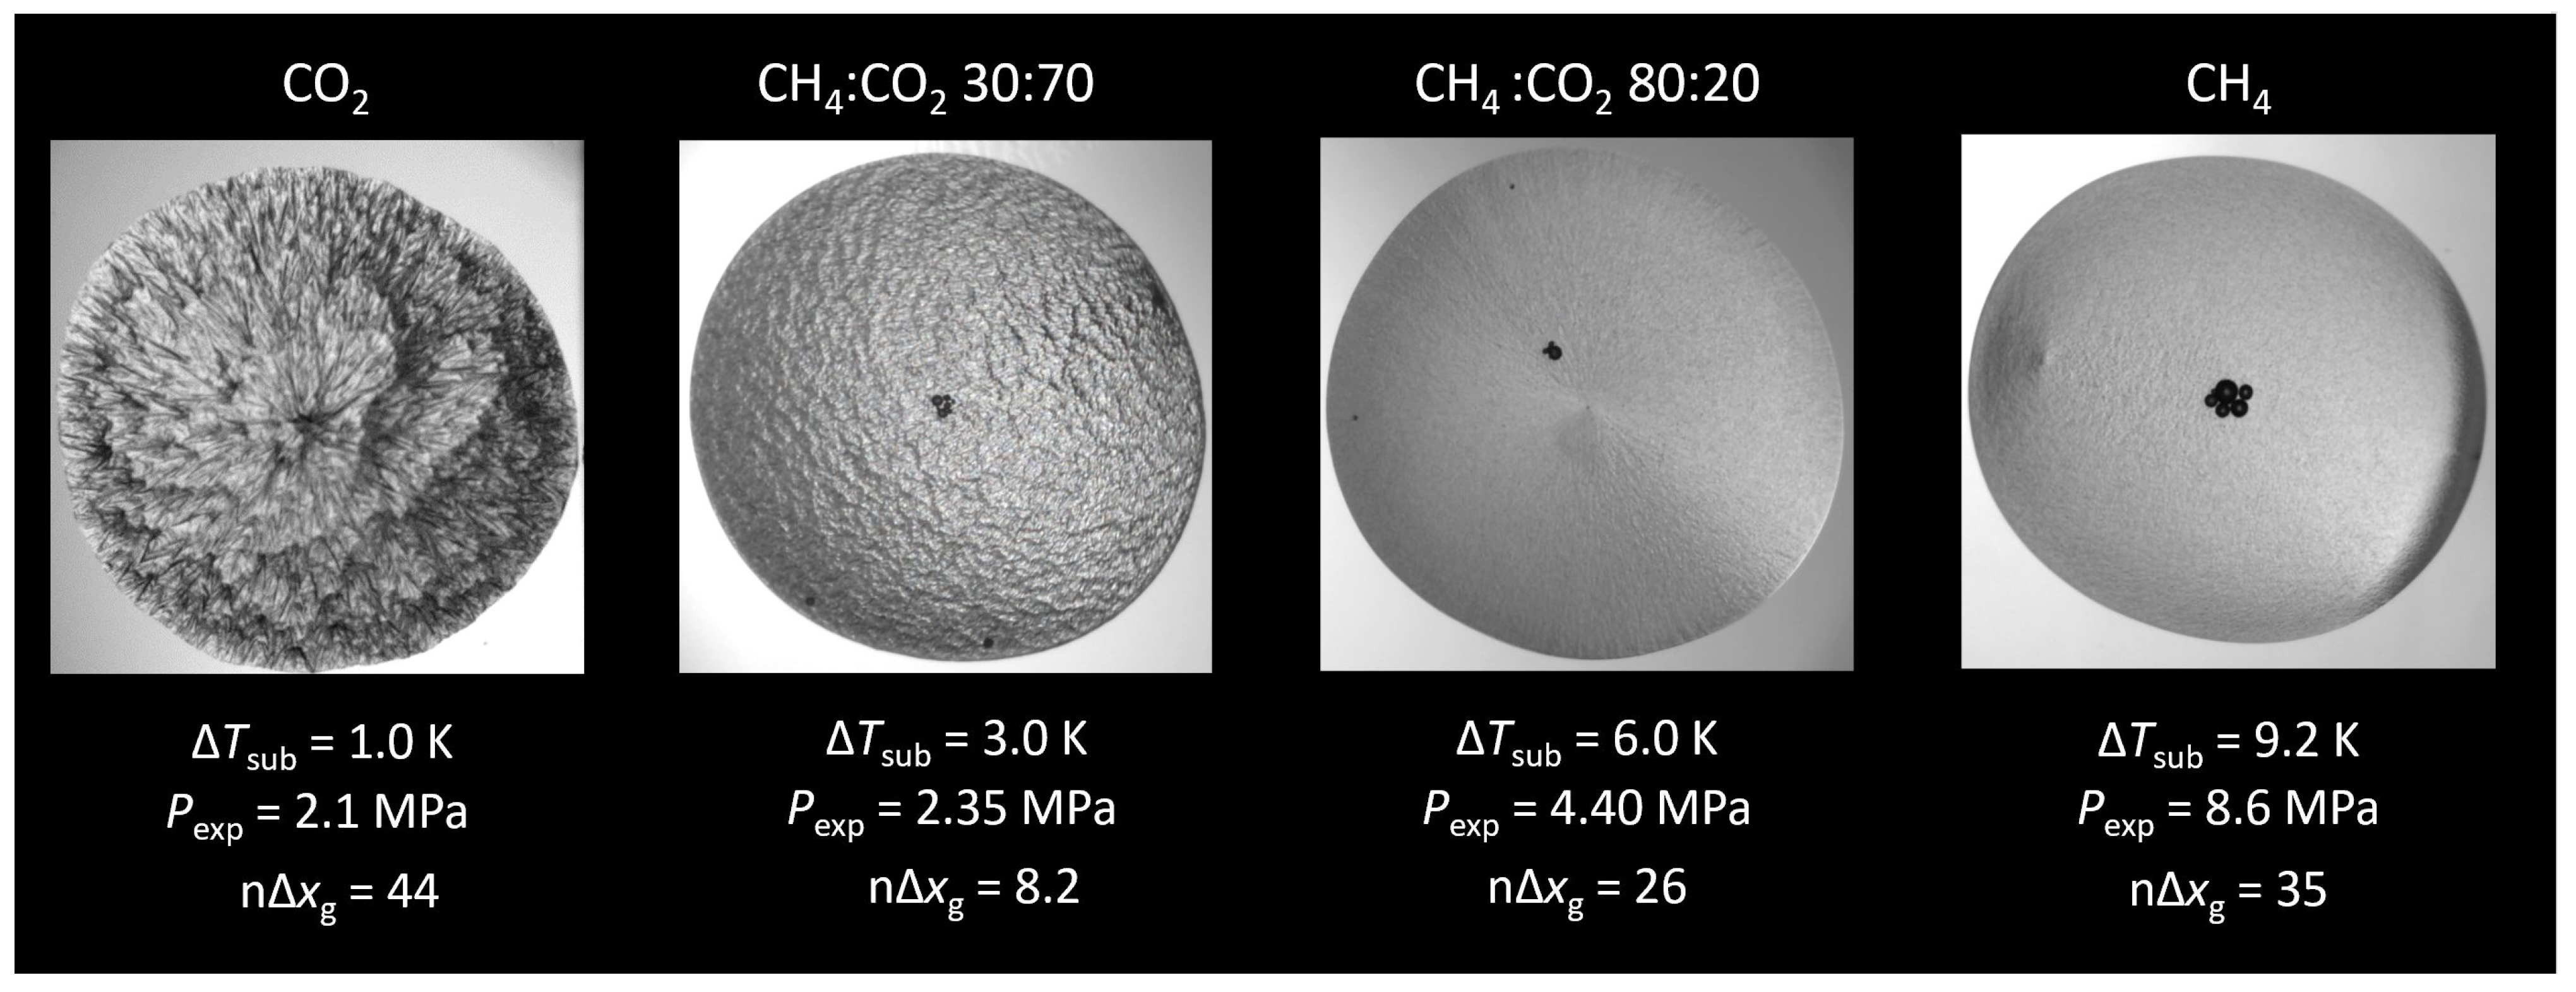
3.1.1. Subcooling

Figure 5 shows hydrates formed with a uniform temperature settings across the slide (Figure 3b) and matching subcooling for all guests (Figure 4). Experimental pressures were different for each gas mixture; this was necessary in order to match hydrate–liquid–vapor equilibrium temperature ( T HLV = 277.5 K). Methane morphology changed from prismatic ( Δ T s u b = 1.0 K) to granular ( Δ T s u b = 2.0 K) to spherulitic ( Δ T s u b = 4.0 K). The CH 4 -rich (80:20) mixture showed a transition from a coarse ( Δ T s u b = 1.0 K) to smooth crystal habits ( Δ T s u b = 2.0 K & 4.0 K). On the other hand, pure CO 2 hydrates presented feather-like spherulite crystals under all the evaluated subcoolings, which became more closely packed with increasing subcooling. The CO 2 -rich mixture (30:70) presented a coarse radial morphology at all subcoolings.
Several authors have previously reported granular habits for CH 4 that tend to smooth out with increasing Δ T s u b [36,40,45,46,49,50]. Uchida and co-workers [16] have reported dendritic CO 2 hydrate films, comparable to those observed here. Spherulitic films of CO 2 hydrates have also been reported previously [22,25].
For the range of conditions shown in Figure 5 methane, carbon dioxide, and their mixtures formed different crystal habits. Thus, the vapor phase composition had a clear effect on morphology. The effect of subcooling on morphology was slight for CO 2 , but it became more important as the content of CH 4 increased.

3.1.2. Mass Transfer-Based Driving Force
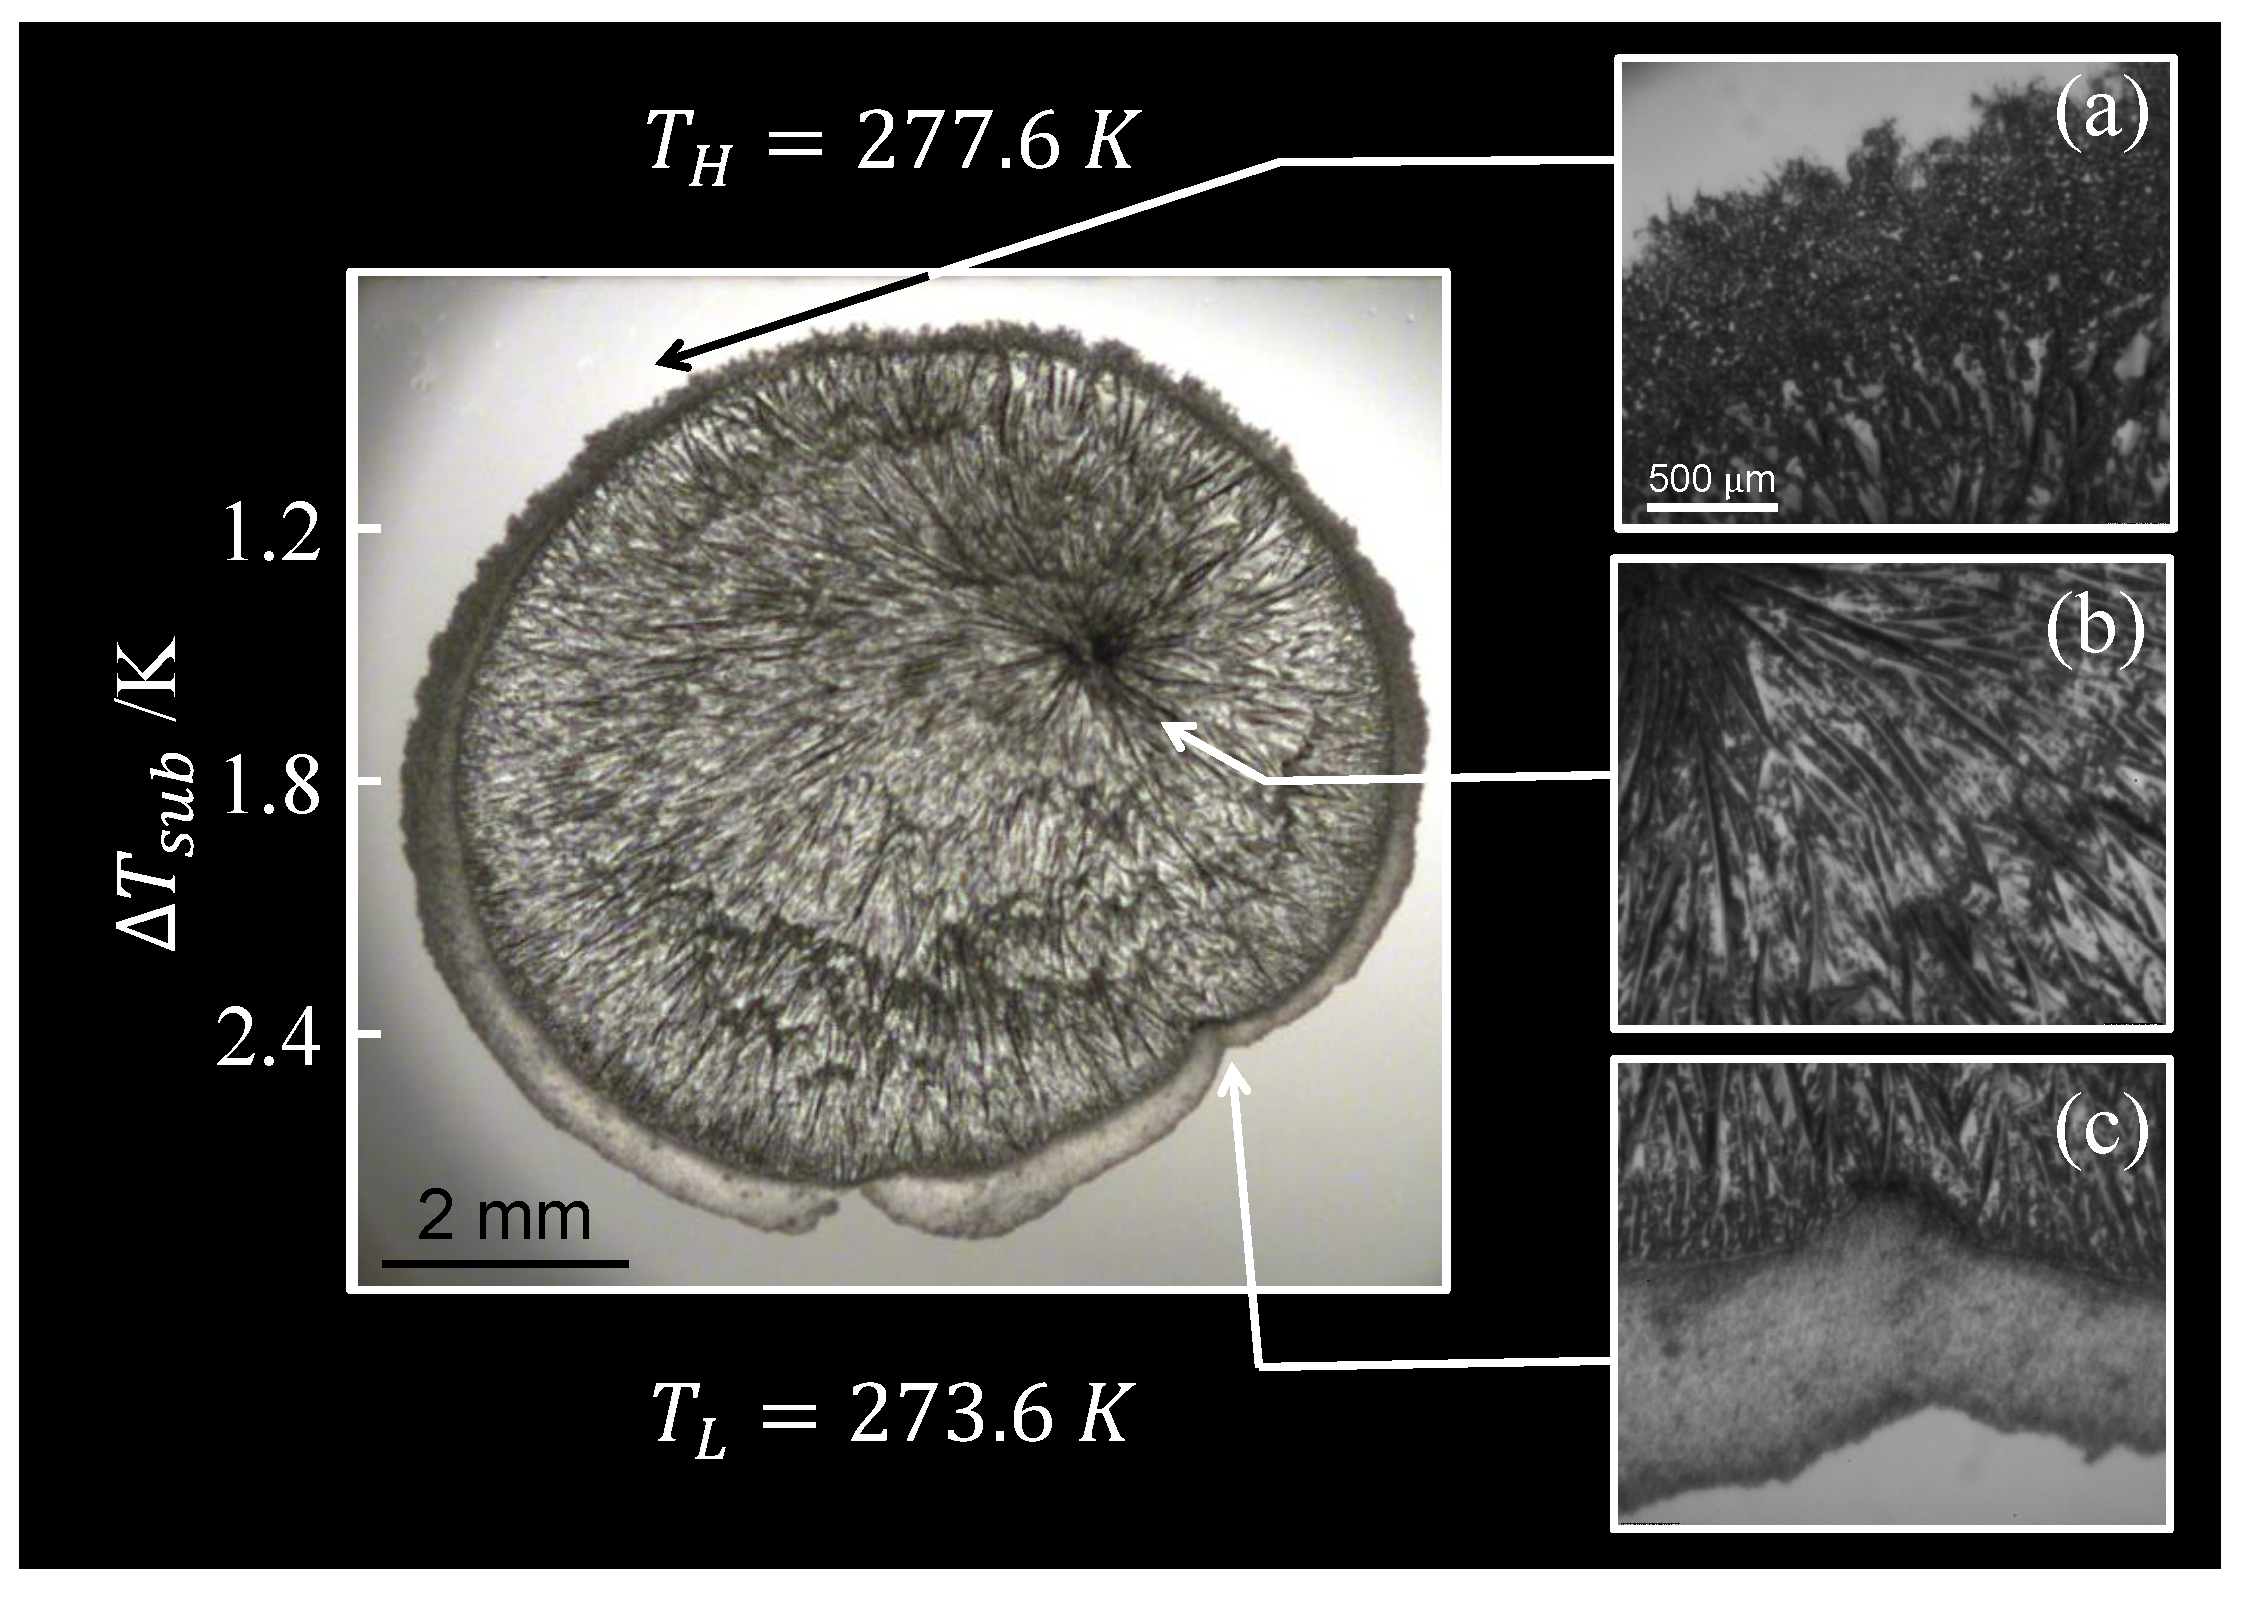
Figure 6 shows hydrates formed using uniform temperature profiles, with minimal subcoolings and small n Δ x g ν 1 . The mass transfer-based driving force (n Δ x g ν 1 ) was calculated using the solubility of methane for mixtures. Top panels present images of the early stages of hydrate growth, where crystals exhibited opaque, faceted, euhedral habits. Euhedral morphologies have been previously reported for both CH 4 , CO 2 and 30:70 mixtures [18,23,51].
Two-dimensional growth is easily observable as striations on all the newly formed crystals (Figure 6 top panels). Furthermore, it appears that guest composition does not influence the observed morphology. Bottom panels on Figure 6 show water samples fully covered by hydrates. At this point of growth, morphology of all guests seems to be different. Except for pure carbon dioxide, the hydrate surface appears rugged. This apparent difference was due to partial dissociation of the growing crystals. Partial dissociation will be discussed further in Section 3.2.2.
Figure 7 shows uniform temperature experiments performed at higher driving forces. Hydrates from every guest developed from a single initial point and grew isotropically. Granasy et al. (2005) identified this type of growth as a category 1 spherulite [52]. Carbon dioxide showed feather-like spherulites. Methane and the 80:20 mixture showed similar smooth, spherulitic crystal habits, but 30:70 presented a coarse, radial crystal habit. Unlike hydrates formed at lower driving forces (Figure 6), morphologies at higher driving forces (Figure 7) were the same at all stages of growth. Vapor phase composition had a clear effect on the crystal habit formed at higher driving forces (Figure 7).

3.1.3. Gradient

Figure 8 and Figure 9 show hydrates formed under a constant temperature difference across the slide of 4 K.
Carbon dioxide hydrates appeared feather-like and the number of crystallites per unit area increased with increasing subcooling (Figure 8). However the morphology motif remained unchanged for CO 2 .
For methane, both the grain size and morphology motif changed with driving force (Figure 9). At Δ T s u b > 1.3 K, the grain size decreased with increasing driving forces and the hydrate film became relatively smooth. Granular crystals transitioned to faceted morphology at approximately Δ T s u b 1.3, as reported in our previous work [46]. These faceted crystals grew in size with decreasing driving force. Occasionally, large single crystals became part of the hydrate film at these Δ T s u b .
Figure 10 presents experiments at a constant temperature gradient and low subcoolings. Driving force in terms of Δ T sub and n Δ x g are shown on the sides of each panel. Values of n Δ x g shown for mixed hydrates were calculated using methane solubility. All guests showed faceted morphologies as Δ T sub approached 0 K. As the driving force increased, an abrupt change in morphology was observed for each guest. Methane and 80:20 changed from faceted to granular morphologies. Large single crystals formed within the methane hydrate film. Large single crystals have been previously observed in methane hydrates [46,51]. Carbon dioxide transitioned from faceted to needle-like crystal habit and 30:70 changed from faceted to a radial, coarse crystal habit. As driving force increased, crystallites decreased their size and transitioned from rougher to flatter habits. The transition from big polyhedral crystals to flatter crystal habits occurs at different values of Δ T sub and n Δ x g for each guest. Similar changes in morphology have been observed in literature: carbon dioxide, 30:70 and 70:30 mixtures has been observed to change from polyhedra to dendrites while CH 4 transitioned from faceted to granular with increasing driving force [18,23,24,37,44,46].
Towards low driving forces—all guests show sub-parallel growth textures (Figure 10). This could be caused by several big faceted crystals competing for space towards lower driving forces. Sub-parallel textures are caused by growth restrictions in two dimensions and unrestricted growth in only one dimension [53].
Figure 10 helps to solve the apparent ambiguity in literature with respect to the morphology of CH 4 and CO 2 hydrates. Methane and carbon dioxide hydrates develop polyhedral, faceted morphologies when subject to a low enough driving force (Figure 6 top panels and Figure 10). However, CH 4 and CO 2 develop characteristic, unique morphologies as driving forces increase. The Δ T sub and n Δ x g at which this transition from polyhedral to characteristic morphology depends on each guest (Figure 10). Using equal driving forces in terms of either Δ T sub or n Δ x g will not result in similar morphologies unless it is a considerably low driving force (Figure 10). This implies that neither of these measures is a better representation of a true driving force for hydrate growth.

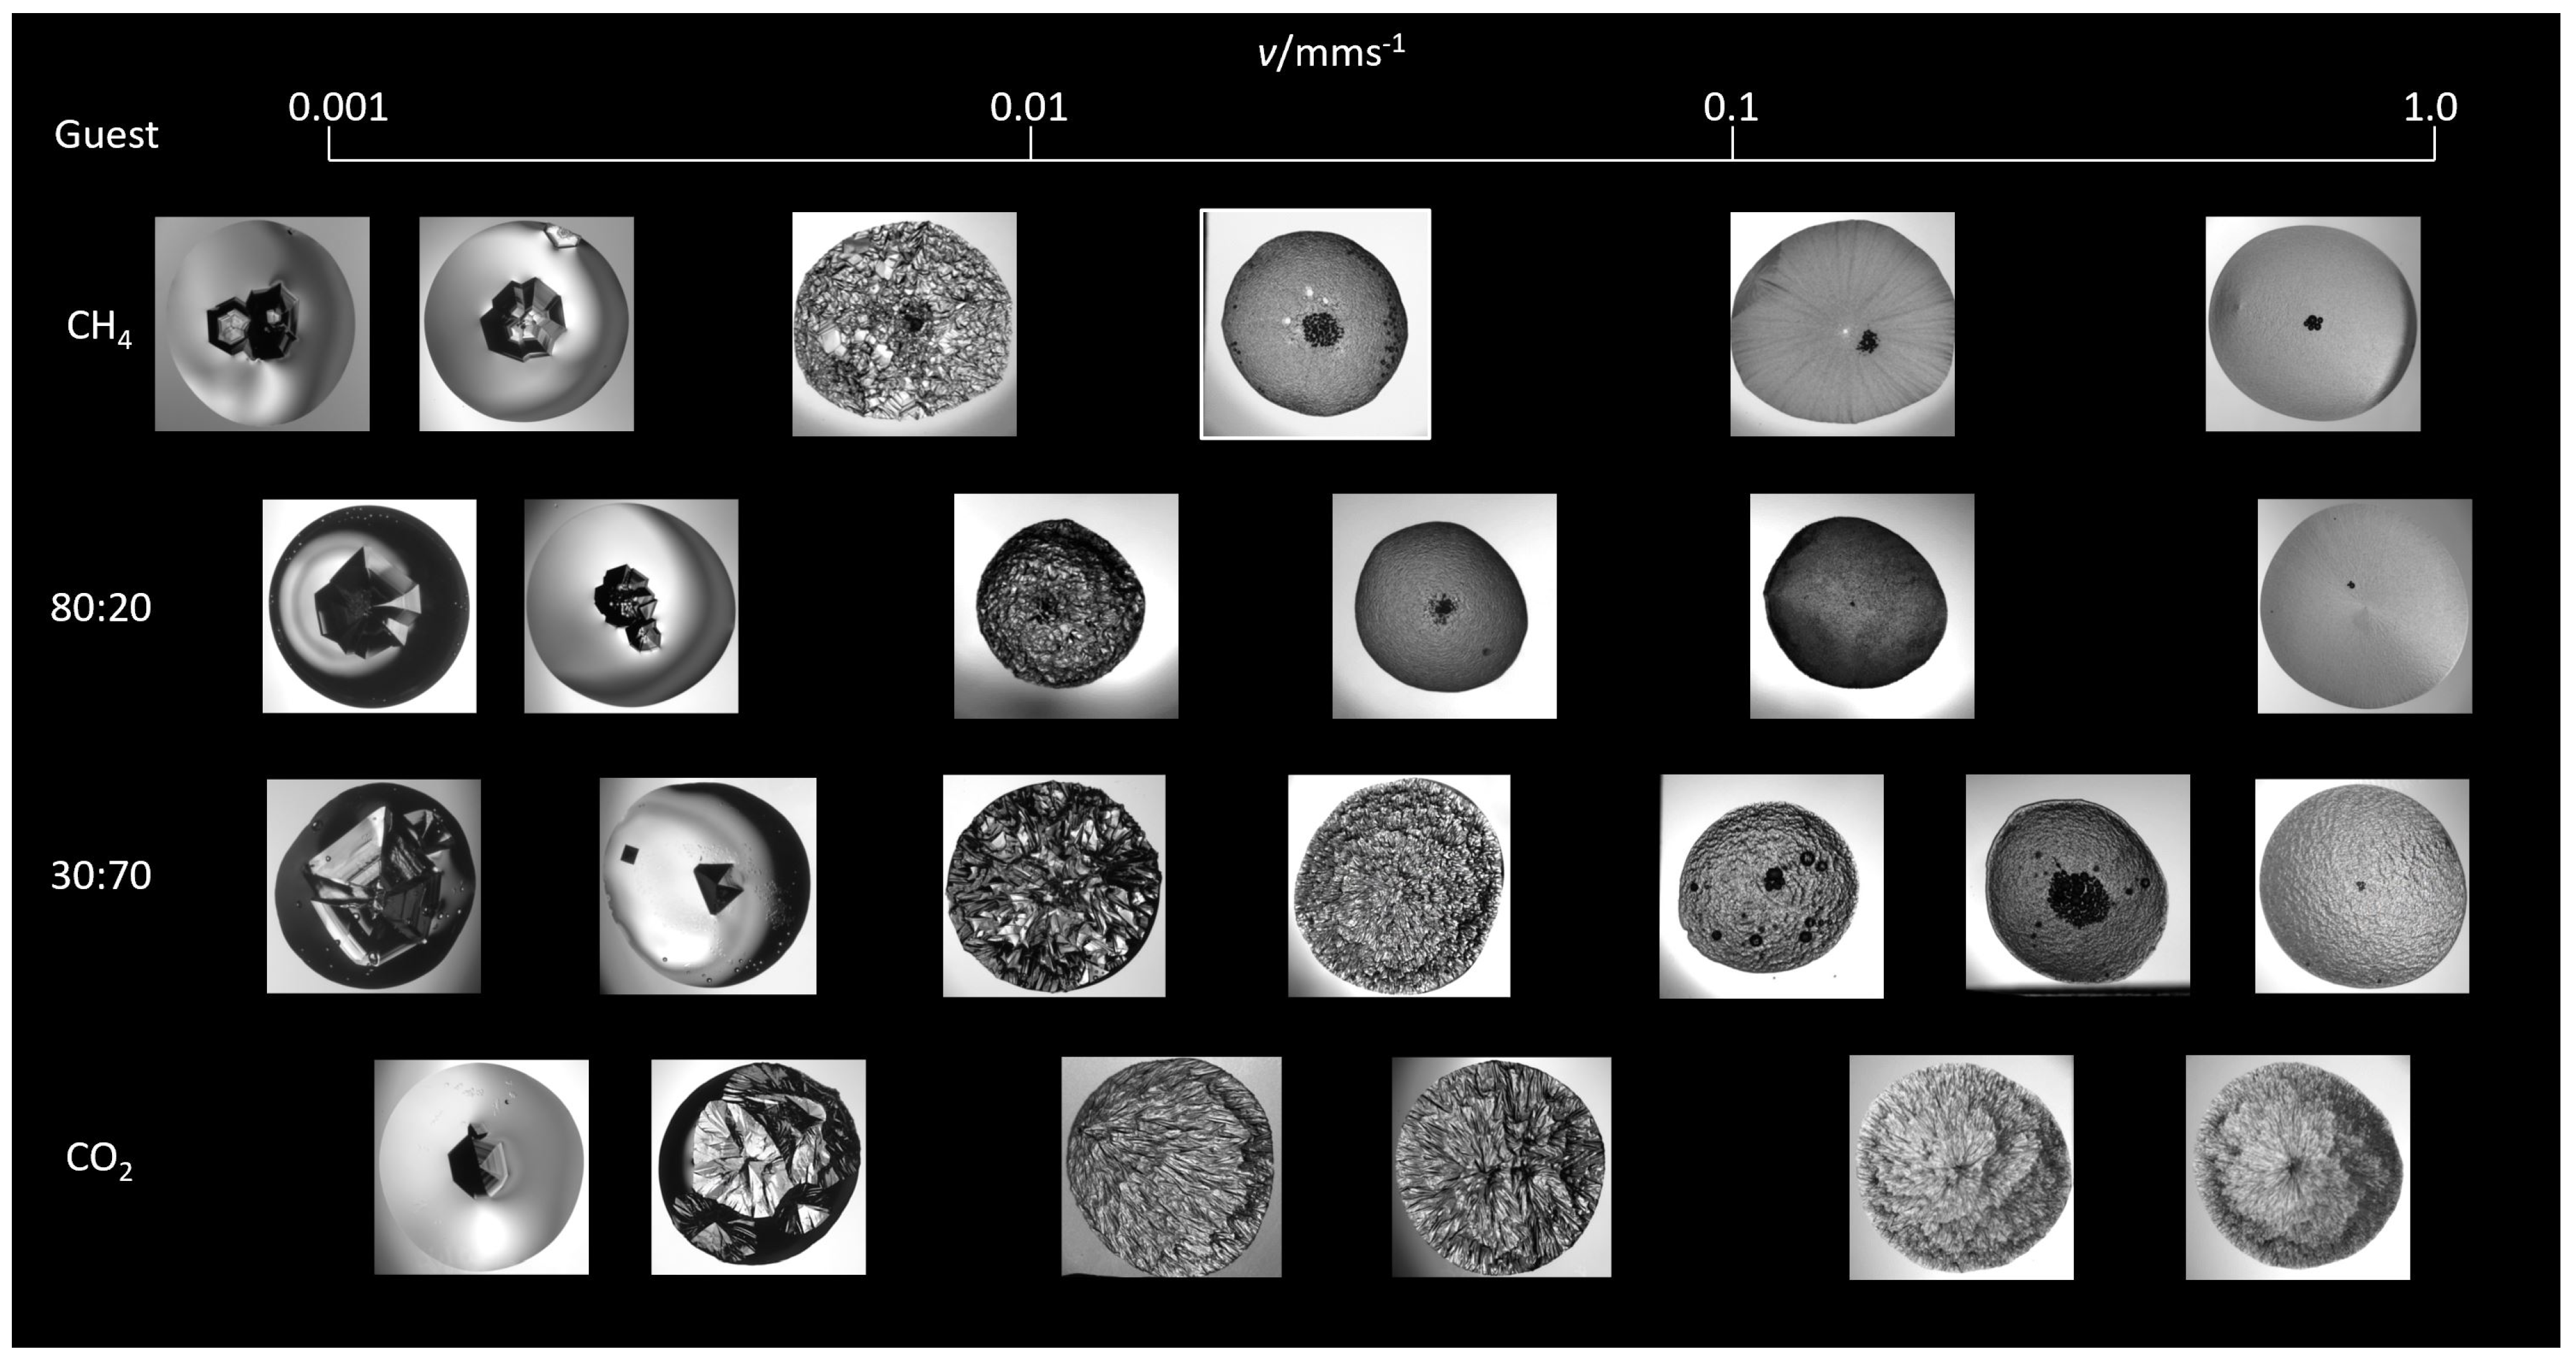
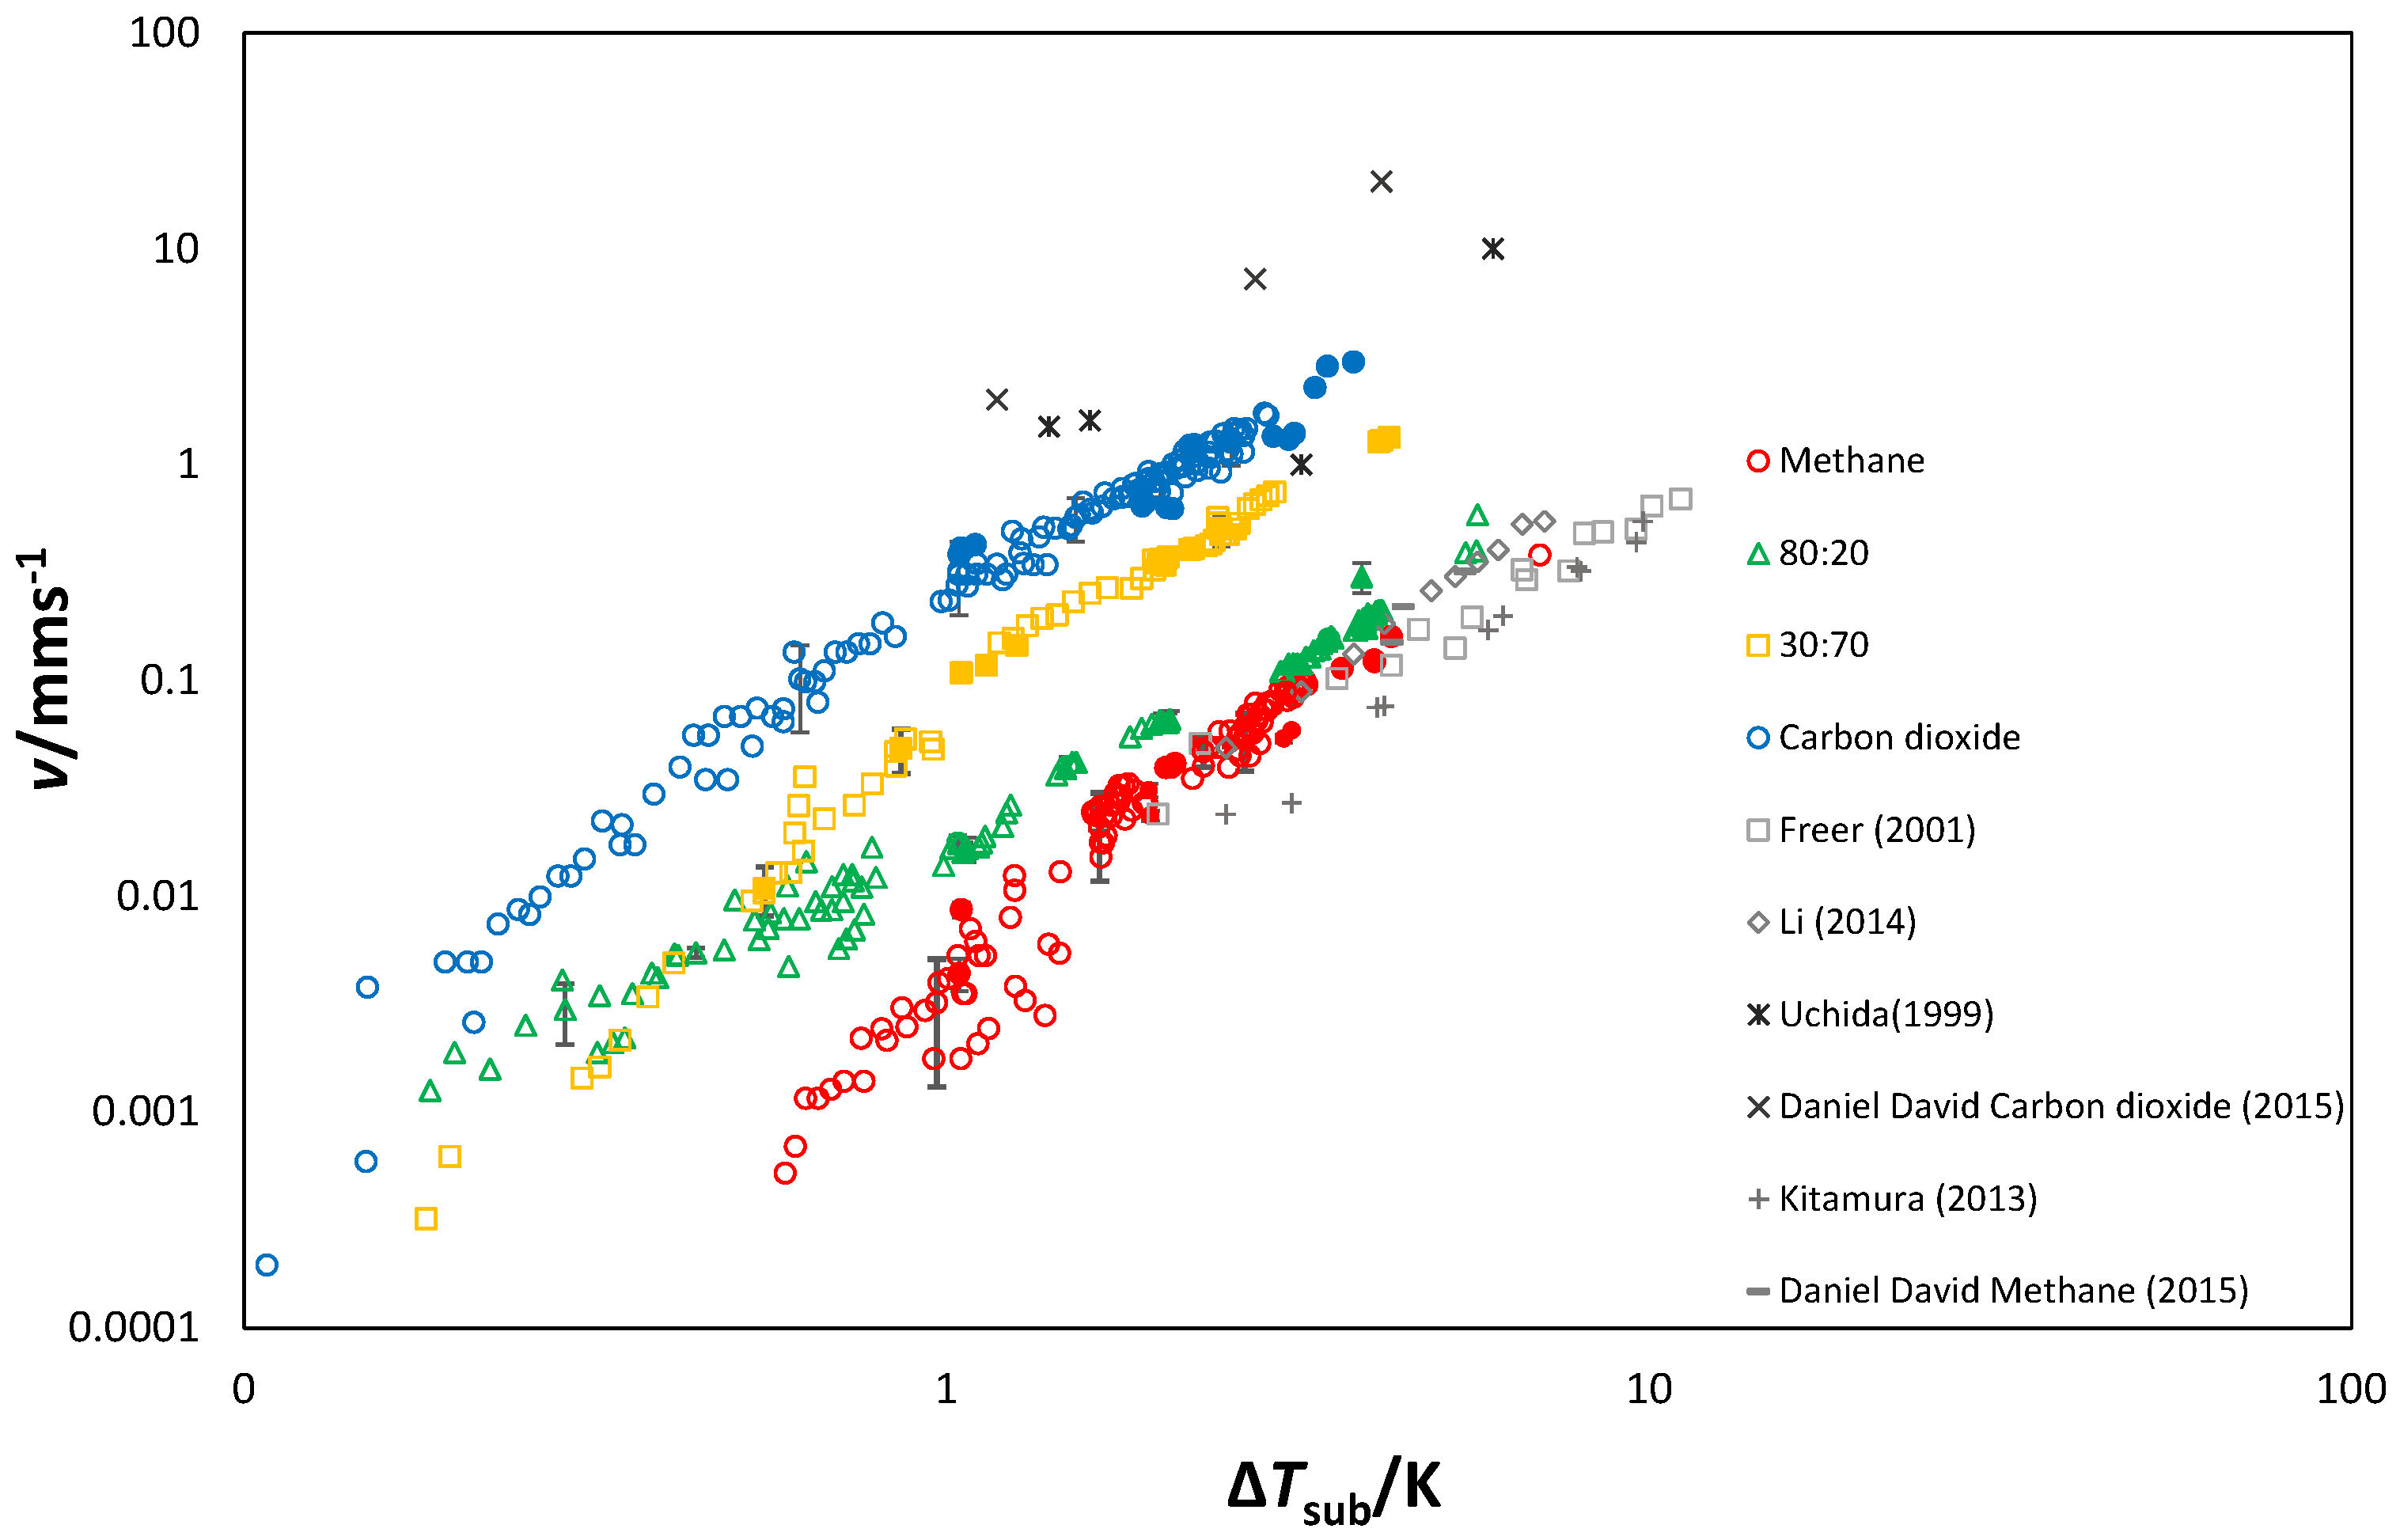
3.1.4. Growth Velocity

Figure 11 shows gas hydrates formed under uniform temperature profiles (Figure 3b) and organized according to growth rates and vapor phase composition. At velocities in the 0.001–0.01 mm/s range, morphologies are polyhedral and faceted for all guests. As growth rates increase, morphology changes for each gas mixture. At growth rates above 0.01 mm/s, 80:20, and CH 4 still look similar. These two CH 4 -rich guests showed granular morphologies at 0.01 mm/s and smooth spherulites at 0.1 mm/s (Figure 11). In contrast, 30:70 and CO 2 presented unique changes to their crystal habit. Carbon dioxide presented feather-like crystallites in the range of 0.01–0.1 mm/s. The 30:70 gas mixture showed whiskery crystals between 0.01 and 0.1 mm/s and coarse radial morphology above 0.1 m/s (Figure 11). This change in morphology was also observed on hydrates formed using a temperature gradient (Figure 10).
At a constant velocity of v ≈ 0.01 mm/s morphology changed from feathers (pure CO 2 ) to prismatic (pure CH 4 ); mixtures showed morphologies bound between the pure extremes. Above 0.01 mm/s, CO 2 maintained a feather-like habit, but as methane content was increased morphologies transitioned from rough (30:70) to smooth, radiating spherulites (CH 4 and 80:20).
Growth rate seemed to be a better predictor of morphology than either Δ T sub or n Δ x g ν 1 . The transitions in morphology (Figure 10 and Figure 11) occurred at similar growth velocities, but different values of Δ T sub and n Δ x g ν 1 . Growth rate could be used as an indicator to predict morphology for CH 4 , CO 2 and their mixtures in quiescent systems.

3.2. Growth and Dissociation

3.2.1. Growth Mechanism

Figure 12 shows formation sequences of CH 4 and CO 2 hydrates at a uniform surface temperature of 274.4 K or Δ T s u b = 3 K.
Gas bubbles appear as black spots and were more numerous with CH 4 (Figure 12). Bubbles were also readily observed in experiments with 80:20 and 30:70 gas mixtures. However, bubbles were more common in experiments with the 30:70 mixtures (Figure 5). We attribute this phenomenon to the fact that methane solubility in water is one order of magnitude lower than that of carbon dioxide [41]. These bubbles did not have a significant effect on the hydrate film growth kinetics or the final morphology of the hydrate.
The exact location for hydrate nucleation cannot be pinpointed, as this occurs at the molecular level [54]. Given that we are working in a quiescent system, nucleation is expected to have occurred near the points where film growth was first observed. We call these points ’initial growth points’.
For CO 2 and the 30:70 mixture, the initial growth point appeared at the periphery of the water droplet. In all the constant temperature gradient experiments involving CO 2 , the growing hydrate moved toward the center of the droplet. In contrast, for uniform temperature experiments with CO 2 , the hydrate continued to grow from the periphery and quickly covered the water droplet in a radiating fashion. Occasionally, more than one growth point appeared in the same droplet, creating fairly evident ridges between growing hydrate films. For all the CO 2 experiments, the hydrate film grew by lateral growth along the crystal plane, with no secondary nucleation.
During the CH 4 experiments, the hydrate started to grow in the periphery or near the center of the water droplet, but always moved to the center (irrespective of the temperature profile used). From the center, the hydrate film advanced as a circular front, moving outward from the initial growth point until the whole water droplet was covered with hydrate. Occasionally, more than one initial growth point would appear in the droplet. As has been described previously [46], big crystals formed as secondary nucleation points ahead of the growing hydrate film and attached themselves to the main hydrate front.
CH 4 hydrates have lower densities than water at the experimental conditions [3], meaning that the formed hydrate should float to the top of the water droplet, as observed. On the other hand, CO 2 hydrates have higher densities than water at the experimental conditions [55]. Therefore, it was not expected to observe CO 2 hydrate movement from the periphery to the center of the droplet. Since this phenomenon only occurred during gradient experiments, we surmise it could be due to minute convection currents in the sample.

3.2.2. Partial Dissociation during Growth

Figure 13 shows instances of partial dissociation during growth. As the hydrate film grew, crystallites partially dissociated, leaving pieces of the previously formed hydrate, from which hydrate continued to grow. Before partial dissociation, hydrates appeared gray. However, ensuing growth produced a translucent film. The change in hue could indicate a change in the thickness of the film or in the angle at which light passes through the hydrate. This change can be observed clearly for CH 4 on Supporting Video S1. Initially a well-defined, opaque crystallite is observed. Following partial dissociation and regrowth, the hydrate film became translucent.
Partial dissociation occurred regardless of temperature profile, location in the droplet, or time of growth. At all driving forces, all guests showed partial dissociation during growth. Supporting Video S2 shows partial dissociation of a CO 2 hydrate film. In this case, only one instance of partial dissociation is observed. At low driving forces, all guests showed a similar crystal habit initially (Figure 6 top panels), but partial dissociation was much more frequent with gases containing methane. The disparity in dissociation/growth frequency explains the differences in the final morphology of fully covered droplets between CH 4 and CO 2 hydrates (Figure 6 bottom panels).
Although Teng et al. [56] hypothesized partial dissociation for CO 2 hydrates, Ovalle and Beltran were the first to show this partial dissociation mechanism for propane hydrates and for mixed methane + propane hydrates [57]. Since Figure 13 shows partial dissociation for methane, carbon dioxide and their mixtures (structure I formers) and partial dissociation observed for propane and methane-propane mixtures (structure II formers), it is very possible that growth via partial dissociation is a growth mechanism common to all gas hydrates.

3.2.3. Dissociation Mechanism

Figure 14 shows the dissociation process for CO 2 and CH 4 hydrates when subject to a temperature gradient. The interfaces that formed in the dissociation processes were very different for CO 2 and CH 4 hydrates. As CO 2 hydrates dissociated, a black line delimited the T H L V (Figure 14b). A secondary interface was also observed (Figure 14c), but as time progressed, this secondary interface disappeared. With each dissociation step the water phase was driven toward the cold side of the stage. This occurred simultaneously with hydrate formation outside of the original water boundary (halo [24]) toward the cold side.
As CH 4 hydrates dissociated, a very clear interface between the hydrate and the liquid water phase could be seen (Figure 14g). No water migration toward the cold side of the slide was observed on dissociating of methane hydrates.
The mixed, CH 4 :CO 2 hydrates behaved in between the pure systems on dissociation. The 80:20 mixture (CH 4 rich) did not cause any water migration, but a secondary interphase similar to Figure 14c was observed. The CO 2 rich mixture (30:70) formed a secondary interphase and caused migration of water towards the cold side of the sapphire slide.

3.3. Growth Rates

The measured growth rates (see Figure 15) increased with increasing CO 2 content and Δ T sub , which agrees with previous works [16,21,22,37,39]. A clear dependency of the growth rate on subcooling and composition was observed. Growth rates of the mixtures were bound by those of the two pure components. For a given Δ T s u b , the CO 2 hydrate film growth velocity was an order of magnitude higher than CH 4 . The 80:20 mixture showed growth rates approximately 50% higher than CH 4 velocity.
Higher CO 2 content increases the overall solubility of the gas in the liquid phase since CO 2 solubility is approximately 20 times higher than CH 4 [41,58]. Following the model proposed by Kishimoto et al. (Figure 1), the increase in gas solubility increases the driving force due to mass transfer. Likewise, the increase in Δ T sub increases the guest solubility and the heat transfer, which translates into a higher driving force. This suggests that the growth rate is controlled not only by the degree of subcooling, but also by mass transfer.

Morphology and Growth Velocity

Figure 16 shows hydrate-film growth rates for the 80:20 mixture plotted against n Δ x g ν 1 , alongside images of hydrates formed under a temperature gradient. The mass transfer driving force, n Δ x g , was calculated using methane mole fractions. The red dashed lines were drawn by inspection at the point where a transition in morphology was observed. At this point, morphology changes from big euhedral crystallites to smooth with some small individual crystals. The driving force at which this change in morphology was observed coincided with an abrupt change in the slope of the growth rate data (Figure 16a). This abrupt change in morphology was observed for all guests (Figure 10).
The change in morphology can be explained by the growth mechanisms that correspond to different magnitudes of the driving force for crystal growth [53,59]. At low driving forces, polyhedral crystals bounded by flat faces are expected. As the driving force increases, the growth mechanism changes to two-dimensional growth. This change is reflected on a change of morphology, with flat faces or a hopper crystal habits observed [53,59]. Finally, rough growth is the dominant mechanism with dendrites or spherulites as the morphology at high driving forces. These changes in morphology for all guests can be observed with respect to driving force in Figure 10 and with growth rate in Figure 11.

4. Conclusions

This work used high-resolution imaging and very precise temperature control to study mechanisms, growth rates, and morphologies of gas hydrates of carbon dioxide, methane, and two of their mixtures (CH 4 :CO 2 , 80:20, and 30:70 nominal concentration).
Previous, apparent contradictions in literature on the morphology of the guests studied were resolved. Methane and carbon dioxide and the two mixtures can exhibit the same crystal habit. All guests studied formed euhedral, faceted morphologies at low driving forces provided growth velocities were lower than 0.01 mm/s. However, as growth rates increased, different crystal habits were observed for each guest: carbon dioxide exhibited feather-like crystal habits; 30:70 presented a coarse radial morphology; methane and 80:20 formed similar smooth morphologies.
Hydrates formed from all gases in this study showed partial dissociation during growth. Partial dissociation occurred regardless of the guest, driving force, temperature profile, location in the droplet or time of growth. To the best of our knowledge, this is the first time partial dissociation is shown for methane, carbon dioxide, and their mixtures. Since we have observed hydrate growth via partial dissociation for both single and binary structure I (this work) and structure II [57] gas hydrates, we posit that partial dissociation is an intrinsic mechanism of hydrate growth.
A sharp change in morphology was observed for all guests. This change in morphology coincided with an inflection point on growth rate data plotted against the driving force. This change in morphology was explained by a shift in the crystal growth mechanism as the driving force increased.

Supplementary Materials

The following are available online at https://www.mdpi.com/article/10.3390/methane1010002/s1: Our derivation of the mass-transfer base model on Section 2.2.2. Figure S1: Morphology of pure carbon dioxide gas hydrates formed using a uniform temperature. Video S1: Growth of CH 4 hydrate film at a uniform temperature setting. Video S2: Growth of CO 2 hydrate film at a uniform temperature setting.

Author Contributions

Conceptualization, J.G.B.; methodology, J.G.B., C.M., J.F.S., N.O. and S.O.; software, J.G.B., C.M., J.F.S., N.O. and S.O.; validation, J.G.B., C.M., J.F.S., N.O. and S.O.; formal analysis, J.G.B., C.M., J.F.S., N.O. and S.O.; investigation, J.G.B., C.M., J.F.S., N.O. and S.O.; resources, J.G.B.; data curation, J.G.B., C.M., J.F.S., N.O. and S.O.; Writing—Original Draft preparation J.G.B., C.M., J.F.S., N.O. and S.O.; Writing—Review and Editing, J.G.B., C.M., J.F.S., N.O. and S.O.; visualization J.G.B., C.M., J.F.S., N.O. and S.O.; supervision, J.G.B.; project administration, J.G.B.; funding acquisition, J.G.B. All authors have read and agreed to the published version of the manuscript.

Funding

Natural Sciences and Engineering Research Council of Canada (NSERC) Discovery Grant No. 42488, the Canadian Foundation for Innovation (CFI) Project # 30151 and the Royal Military College of Canada Short Term Research Needs Program.

Institutional Review Board Statement

Not applicable.

Informed Consent Statement

Not applicable.

Data Availability Statement

Not applicable.

Conflicts of Interest

The authors declare no conflict of interest.

Nomenclature

Δ difference
ν stoichiometric coefficient
Greek Letters
ffugacity
HHenry’s law constant
vhydrate film growth velocity
nhydration number
xmole fraction
Ppressure
gtemperature gradient
Ttemperature
V ˙ volumetric growth rate
Subscripts and Abbreviations
Lcoldest side of the stage
jdissociation step
e x p experimental value
g r a d gradient experiments
hhalo
Hhottest side of the stage
h y d hydrate front
H L V hydrate–Liquid water–vapor
i n t interface
s u b subcooling
u n i uniform experiments

References

  1. Englezos, P. Clathrate Hydrates. Ind. Eng. Chem. Res. 1993, 32, 1251–1274. [Google Scholar] [CrossRef]
  2. Sloan, E.D. Fundamental principles and applications of natural gas hydrates. Nature 2003, 426, 354–359. [Google Scholar] [CrossRef] [PubMed]
  3. Sloan, E.D.; Koh, C.A. Clathrate Hydrates of Natural Gases, 3rd ed.; Chemical Industries; CRC Press: Boca Raton, FL, USA, 2008. [Google Scholar]
  4. Englezos, P.; Kalogerakis, N.; Dholabhai, P.D.; Bishnoi, P.R. Kinetics of formation of methane and ethane gas hydrates. Chem. Eng. Sci. 1987, 42, 2647–2658. [Google Scholar] [CrossRef]
  5. Natarajan, V.; Bishnoi, P.R.; Kalogerakis, N. Induction phenomena in gas hydrate nucleation. Chem. Eng. Sci. 1994, 49, 2075–2087. [Google Scholar] [CrossRef]
  6. Mullin, J.W. Crystallization; Elsevier: Amsterdam, The Netherlands, 2001. [Google Scholar]
  7. Maeda, N.; Wells, D.; Becker, N.C.; Hartley, P.G.; Wilson, P.W.; Haymet, A.D.J.; Kozielski, K.A. Development of a high pressure automated lag time apparatus for experimental studies and statistical analyses of nucleation and growth of gas hydrates. Rev. Sci. Instruments 2011, 82, 65109. [Google Scholar] [CrossRef]
  8. Metaxas, P.J.; Lim, V.W.; Booth, C.; Zhen, J.; Stanwix, P.L.; Johns, M.L.; Aman, Z.M.; Haandrikman, G.; Crosby, D.; May, E.F. Gas hydrate formation probability distributions: Induction times, rates of nucleation and growth. Fuel 2019, 252, 448–457. [Google Scholar] [CrossRef]
  9. Maeda, N. Nucleation of Gas Hydrates; Springer International Publishing: New York, NY, USA, 2020. [Google Scholar]
  10. Buchanan, P.; Soper, A.; Thompson, H.; Westacott, R.; Creek, J.; Hobson, G.; Koh, C. Search for memory effects in methane hydrate: Structure of water before hydrate formation and after hydrate decomposition. J. Chem. Phys. 2005, 123, 164507. [Google Scholar] [CrossRef] [PubMed]
  11. Thompson, H.; Soper, A.; Buchanan, P.; Aldiwan, N.; Creek, J.; Koh, C. Methane hydrate formation and decomposition: Structural studies via neutron diffraction and empirical potential structure refinement. J. Chem. Phys. 2006, 124, 164508. [Google Scholar] [CrossRef] [PubMed]
  12. Ke, W.; Svartaas, T.M.; Chen, D. A review of gas hydrate nucleation theories and growth models. J. Nat. Gas Sci. Eng. 2019, 61, 169–196. [Google Scholar] [CrossRef]
  13. Esmail, S.; Beltran, J. Methane hydrate propagation on surfaces of varying wettability. J. Nat. Gas Sci. Eng. 2016, 35, 1535–1543. [Google Scholar] [CrossRef]
  14. Chatti, I.; Delahaye, A.; Fournaison, L.; Petitet, J.P. Benefits and drawbacks of clathrate hydrates: A review of their areas of interest. Energy Convers. Manag. 2005, 46, 1333–1343. [Google Scholar] [CrossRef]
  15. Dashti, H.; Yew, L.; Lou, X. Recent advances in gas hydrate-based CO2 capture. J. Nat. Gas Sci. Eng. 2015, 23, 195–207. [Google Scholar] [CrossRef]
  16. Uchida, T.; Ebinuma, T.; Kawabata, J.; Narita, H. Microscopic observations of formation processes of clathrate-hydrate films at an interface between water and carbon dioxide. J. Cryst. Growth 1999, 204, 348–356. [Google Scholar] [CrossRef]
  17. Circone, S.; Stern, L.; Kirby, S.; Durham, W.; Chakoumakos, B.; Rawn, C.; Rondinone, A.; Ishii, Y. CO2 Hydrate: Synthesis, Composition, Structure, Dissociation Behavior, and a Comparisonto Structure I CH4 Hydrate. J. Phys. Chem. B 2003, 107, 5529–5539. [Google Scholar] [CrossRef]
  18. Ohmura, R.; Shimada, W.; Uchida, T.; Mori, Y.; Takeya, S.; Nagao, J.; Minagawa, H.; Ebinuma, T.; Narita, H. Clathrate hydrate crystal growth in liquid water saturated with a hydrate-forming subtance: Variations in crystal morphology. Philos. Mag. 2004, 84, 1–16. [Google Scholar] [CrossRef]
  19. Servio, P.; Englezos, P. Morphology of Methane and Carbon Dioxide Hydrates Formed from Water Droplets. AIChE J. 2003, 49, 269–276. [Google Scholar] [CrossRef]
  20. Ohmura, R.; Matsuda, S.; Uchida, T.; Ebinuma, T.; Narita, H. Clathrate Hydrate Crystal Growth in Liquid Water Saturated with a Guest Substance: Observations in a Methane + Water System. Cryst. Growth Des. 2005, 5, 953–957. [Google Scholar] [CrossRef]
  21. Peng, B.; Dandekar, A.; Sun, C.; Luo, H.; Ma, Q.; Pang, W.; Chen, G. Hydrate Film Growth on the Surface of a Gas Bubble Suspended in Water. J. Phys. Chem. B 2007, 111, 12485–12493. [Google Scholar] [CrossRef]
  22. Daniel-David, D.; Guerton, F.; Dicharry, C.; Torre, J.; Broseta, D. Hydrate growth at the interface between water and pure or mixed CO2/CH4 gases: Influence of pressure, temperature, gas composition and water-soluble surfactants. Chem. Eng. Sci. 2015, 132, 118–127. [Google Scholar] [CrossRef]
  23. Ueno, H.; Akiba, H.; Akatsu, S.; Ohmura, R. Crystal growth of clathrate hydrates formed with methane + carbon dioxide mixed gas at the gas/liquid interface and in liquid water. New J. Chem. 2015, 39, 8254–8262. [Google Scholar] [CrossRef]
  24. Beltran, J.; Servio, P. Morphological Investigations of Methane-Hydrate Films Formed on a Glass Surface. J. Cryst. Growth Des. 2010, 10, 4339–4347. [Google Scholar] [CrossRef]
  25. Decarie, G.; Beltran, J. Effect of hydrate guest on clathrate morphology. In Proceedings of the 7th International Conference on Gas Hydrates, Edinburgh, UK, 17–21 July 2011. [Google Scholar]
  26. Koga, T.; Wong, J.; Endoh, M.; Mahajan, D.; Gutt, C.; Satija, S. Hydrate formation at the methane/water interface on the molecular scale. Langmuir 2010, 26, 4627–4630. [Google Scholar] [CrossRef] [PubMed]
  27. Lehmkuhler, F.; Paulus, M.; Sternemman, C.; Lietz, D.; Venturini, F.; Gutt, C.; Tolan, M. The carbon dioxide water interface at conditions of gas hydrate formation. J. Am. Chem. Soc. 2009, 131, 585–589. [Google Scholar] [CrossRef] [PubMed]
  28. Lang, F.; Servio, P. Bulk liquid and gas mole fraction measurements during hydrate growth for the CH+ CO2+ H2O system. J. Chem. Thermodyn. 2018, 117, 113–118. [Google Scholar] [CrossRef]
  29. Schicks, J.M.; Luzi-Helbing, M. Cage occupancy and structural changes during hydrate formation from initial stages to resulting hydrate phase. Spectrochim. Acta Part A Mol. Biomol. Spectrosc. 2013, 115, 528–536. [Google Scholar] [CrossRef] [PubMed]
  30. Horvat, K.; Kerkar, P.; Jones, K.; Mahajan, D. Kinetics of the Formation and Dissociation of Gas Hydrates from CO2-CH4 Mixtures. Energies 2012, 5, 2248–2262. [Google Scholar] [CrossRef]
  31. Schicks, J.M.; Luzi-Helbing, M. Kinetic and Thermodynamic aspects of Clathrate Hydrate Nucleation and growth. J. Chem. Eng. Data 2015, 60, 269–277. [Google Scholar] [CrossRef]
  32. Uchida, T.; Ikeda, M.; Takeya, S.; Kamata, Y.; Ohmura, R.; Nagao, J.; Zatsepina, O.Y.; Buffet, B.A. Kinetics and Stability of CH4-CO2 Mixed Gas Hydrates during Formation and Long-Term Storage. ChemPhysChem 2005, 6, 646–654. [Google Scholar] [CrossRef]
  33. Belosludov, R.V.; Zhdanov, R.K.; Gets, K.V.; Bozhko, Y.Y.; Belosludov, V.R.; Kawazoe, Y. Role of Methane as a Second Guest Component in Thermodynamic Stability and Isomer Selectivity of Butane Clathrate Hydrates. J. Phys. Chem. C 2020, 124, 18474–18481. [Google Scholar] [CrossRef]
  34. Kodera, M.; Matsueda, T.; Belosludov, R.V.; Zhdanov, R.K.; Belosludov, V.R.; Takeya, S.; Alavi, S.; Ohmura, R. Physical Properties and Characterization of the Binary Clathrate Hydrate with Methane + 1,1,1,3,3-Pentafluoropropane (HFC-245fa) + Water. J. Phys. Chem. C 2020, 124, 20736–20745. [Google Scholar] [CrossRef]
  35. Kwon, T.H.; Kneafsey, T.J.; Rees, E.V.L. Thermal Dissociation Behavior and Dissociation Enthalpies of Methane–Carbon Dioxide Mixed Hydrates. J. Phys. Chem. B 2011, 115, 8169–8175. [Google Scholar] [CrossRef] [PubMed]
  36. Tanaka, R.; Sakemoto, R.; Ohmura, R. Crystal Growth of Clathrate Hydrates Formed at the Interface of Liquid Water and Gaseous Methane, Ethane, or Propane: Variations in Crystal Morphology. Cryst. Growth Des. 2009, 9, 2529–2536. [Google Scholar] [CrossRef]
  37. Freer, E.M.; Selim, M.S.; Sloan, E.D. Methane hydrate film growth kinetics. Fluid Phase Equilibria 2001, 185, 65–75. [Google Scholar] [CrossRef]
  38. Magill, J. Spherulites: A personal perspective. J. Mater. Sci. 2001, 36, 3143–3164. [Google Scholar] [CrossRef]
  39. Kitamura, M.; Mori, Y. Clathrate-hydrate film growth growth along water/methane phase boundaries–and observational study. Cryst. Res. Technol. 2013, 48, 511–519. [Google Scholar] [CrossRef]
  40. Kishimoto, M.; Ohmura, R. Correlation of the Growth Rate of the Hydrate Layer at a Guest/Liquid-Water Interface to Mass Transfer Resistance. Energies 2012, 5, 92–100. [Google Scholar] [CrossRef]
  41. Hashemi, S.; Macchi, A.; Bergeron, S.; Servio, P. Prediction of methane and carbon dioxide solubility in water in the presence of hydrate. Fluid Phase Equilibria 2006, 246, 131–136. [Google Scholar] [CrossRef]
  42. Servio, P.; Englezos, P. Measurement of dissolved methane in water in equilibrium with its hydrate. J. Chem. Eng. Data 2002, 47, 87–90. [Google Scholar] [CrossRef]
  43. Saito, K.; Sum, A.; Ohmura, R. Correlation of Hydrate-Film Growth Rate at the Guest/Liquid-Water Interface to Mass Transfer Resistance. Ind. Eng. Chem. Res. 2010, 49, 7102–7103. [Google Scholar] [CrossRef]
  44. Oya, S.; Aifaa, M.; Ohmura, R. Formation, growth and sintering of CO2 hydrate crystals in liquid water with continuous CO2 supply: Implication for subsurface CO2 sequestration. Int. J. Greenh. Gas Control. 2017, 63, 386–391. [Google Scholar] [CrossRef]
  45. Li, S.; Sun, C.; Liu, B.; Li, B.; Chen, G.; Sum, A. New Observations and Insights into the Morphology and Growth Kinetics of Hydrate Film. Sci. Rep. 2014, 4, 4129. [Google Scholar] [CrossRef]
  46. Duquesnay, J.; Diaz Posada, M.; Beltran, J. Novel gas hydrate reactor design: 3-in-1 assessment of phase equilibria, morphology and kinetics. Fluid Phase Equilibria 2016, 413, 148–157. [Google Scholar] [CrossRef]
  47. Trebble, M.A.; Bishnoi, P.R. Development of a new equation of state. Fluid Phase Equilibria 1987, 35, 1–18. [Google Scholar] [CrossRef]
  48. Fogg, P.; Gerrard, W. Solubility of Gases in Liquids: A Critical Evaluation of Gas/Liquid Systems in Theory and Practice; Wiley: Hoboken, NJ, USA, 1991. [Google Scholar]
  49. Sun, C.; Chen, G.; Ma, C.; Huang, Q.; Luo, H.; Li, Q. The growth kinetics of hydrate film on the surface of gas bubble suspended in water or aqueous surfactant solution. J. Cryst. Growth 2007, 306, 491. [Google Scholar] [CrossRef]
  50. Lee, S.; Kim, H.; Lee, J. Morphology study of methane-propane clathrate hydrates on the bubble surface in the presence of SDS or PVCap. J. Cryst. Growth 2014, 402, 249–259. [Google Scholar] [CrossRef]
  51. Li, S.L.; Sun, C.Y.; Liu, B.; Feng, X.J.; Li, F.G.; Chen, L.T.; Chen, G.J. Initial thickness measurements and insights into crystal growth of methane hydrate film. AIChE J. 2013, 59, 2145–2154. [Google Scholar] [CrossRef]
  52. Granasy, L.; Pusztai, T.; Tegze, G.; Warren, J.; Douglas, J. Growth and form of spherulites. Phys. Rev. E 2005, 72, 011605. [Google Scholar] [CrossRef]
  53. García-Ruiz, J.M.; Otálora, F. Crystal Growth in Geology. In Handbook of Crystal Growth; Elsevier: Amsterdam, The Netherlands, 2015; pp. 1–43. [Google Scholar] [CrossRef]
  54. Sloan, E.D. Clathrate Hydrates of Natural Gases, 2nd ed.; Marcel Dekker, Inc.: New York, NY, USA, 1998. [Google Scholar]
  55. Aya, I.; Yamane, K.; Nariai, H. Solubility of CO2 and Density of CO2 Hydrate at 30 MPa. Energy 1997, 22, 263. [Google Scholar] [CrossRef]
  56. Teng, H.; Yamasaki, A.; Shindo, Y. Stability of the hydrate layer formed on the surface of a CO2 droplet in high-pressure, low-temperature water. Chem. Eng. Sci. 1996, 51, 4979–4986. [Google Scholar] [CrossRef]
  57. Ovalle, S.; Beltran, J.G. Growth Mechanisms and Phase Equilibria of Propane and Methane + Propane Hydrates. J. Chem. Eng. Data 2021, 66, 4112–4121. [Google Scholar] [CrossRef]
  58. Bruusgaard, H.; Beltran, J.; Servio, P. Solubility measurements for the CH4+CO2+H2O system under hydrate–liquid–vapor equilibrium. Fluid Phase Equilibria 2010, 296, 106–109. [Google Scholar] [CrossRef]
  59. Sunagawa, I. Crystals: Growth, Morphology, and Perfection; Cambridge University Press: Cambridge, UK, 2005. [Google Scholar]
Figure 1. Solubility of guest molecules in the liquid phase. (a) Guest mole fraction in the liquid phase as a function of temperature. Nomenclature: HLV, hydrate–liquid–vapor equilibria; LV, liquid–vapor equilibria; LV h y p , hypothetical liquid–vapor equilibria [42]; HL, hydrate–liquid equilibria; Blue, CO 2 ; Red, CH 4 . p 1 > p 2 . (b) Schematic of the growing hydrate film occurring at constant pressure. The temperature and concentration at the HLV interface are assumed to be at the three-phase equilibrium values ( T H L V and x e q , H L V ). The concentration at the L–V interface is assumed to be at the hypothetical two-phase equilibrium value ( x e q , L V , h y p ) at the experimental temperature ( T e x p ). At the same subcooling, the difference in solubility between the LV interphase and the HLV interphase is approximately 20 times higher for CO 2 than for CH 4 [18,40,41,42].
Methane 01 00002 g001
Figure 2. Apparatus schematic (A)316 stainless steel pressure vessel. (B) Sapphire sight windows. (C) Video camera. (D) Cold light source. (E) Coolant jacket. (F) Refrigerated circulator. (G) Bi-polar PID temperature controllers [46].
Methane 01 00002 g002
Figure 3. (a) Constant gradient temperature profile. One TEC is held at T H > T H L V and the other at T L < T H L V . (b) Uniform surface temperature profile. Both TECs are held at T H = T L < T H L V .
Methane 01 00002 g003
Figure 4. The same T H L V and T e x p were used for CO 2 and CH 4 experiments. Pressure was adjusted for both guests in order to achieve the same subcooling at the same experimental temperature.
Methane 01 00002 g004
Figure 5. Hydrates formed using an uniform surface temperature profile. Increasing CO 2 content from left to right. (ad) T = 276.5 K ( Δ T sub 1 K). (eh) T = 275.5 K ( Δ T sub 2 K). (il) T = 273.5 K ( Δ T sub 4 K). (a,e,i) CH 4 hydrates, P = 4.03 MPa. (b,f,j) CH 4 :CO 2 80:20 hydrates, P = 3.25 MPa. (c,g,k) CH 4 :CO 2 70:30 hydrates, P = 2.35 MPa. (d,h,l) CO 2 hydrates, P = 2.10 MPa.
Methane 01 00002 g005
Figure 6. Gas hydrates formed at a uniform temperature setting. Feed gas composition is specified above each pair of pictures. Top panels show initial stages of hydrate film growth. Bottom panels show fully covered water droplets. Values of n Δ x g of mixtures were calculated using the solubility of methane; T HLV = 277.5 K for all experiments. The driving force in both Δ T sub and n Δ x g are shown.
Methane 01 00002 g006
Figure 7. Hydrates formed with uniform temperature setting. Feed gas composition is specified above each panel. Experimental conditions are shown at the bottom of the figure. T H L V = 277.4 K for CO 2 and 30:70. CH 4 T H L V = 284.70; 80:20 T H L V = 280.40.
Methane 01 00002 g007
Figure 8. CO 2 hydrate formed in a constant 4 K temperature difference along the slide. T H = 277.6 K (top), T L = 273.6 K (bottom). P = 2.08 MPa. T H L V = 277.4 K. (a) Δ T s u b 0.7 K. A dark halo propagates from the original droplet boundary. (b) Δ T s u b 1.7 K. Feather-like crystals extending from the initial growth point. (c) Δ T s u b 2.4 K. A clear halo propagates from the original droplet boundary.
Methane 01 00002 g008
Figure 9. CH 4 hydrate formed in a constant 4 K temperature difference along the slide. T H = 277.6 K (top), T L = 273.6 K (bottom). P = 4.01 MPa. T H L V = 277.4 K. (a) Δ T s u b 0.6 K. Big faceted crystals. (b) Δ T s u b 1.8 K. Crystal granulates and a large single crystal in the film. (c) Δ T s u b 2.2 K. Smaller crystal granulates and a smoother hydrate film. A halo propagates from the original droplet boundary.
Methane 01 00002 g009
Figure 10. Gas hydrates formed at a constant temperature gradient setting. Feed composition is specified above each panel. T H and T L are high and low temperatures set on the stage, respectively. CO 2 P exp = 2.10 MPa. CH 4 P exp = 4.0 MPa. 30:70, P exp = 2.35 MPa; 80:20, P exp = 3.25 MPa.
Methane 01 00002 g010
Figure 11. Morphology of gas hydrates formed at a uniform temperature. The abscissa shows film growth rates and the ordinate vapor phase composition. Standard uncertainties for each system: u uni , CH 4 = 0.003 mm/s, u uni , 80 : 20 = 0.006 mm/s, u uni , 30 : 70 = 0.018 mm/s, u uni , CO 2 = 0.05 mm/s.
Methane 01 00002 g011
Figure 12. Hydrate formation sequences. T H = T L = 274.4 K. (ad) CO 2 . P = 2.12 MPa. T H L V = 277.5 K. (eh) CH 4 . P = 4.01 MPa. T H L V = 277.6 K. (a) CO 2 hydrate growth moments after nucleation at the periphery of the water droplet. (bc) The hydrate continues to grow outward from the initial growth point towards the top of the water droplet. (d) Moments before the hydrate covers the whole water droplet. (e) CH 4 hydrate growth moments after nucleation from various points in the center of the droplet. (f) Large crystals appear during methane hydrate growth of the hydrate film. (g) CH 4 hydrate continues to grow outward from the initial growth point and towards the periphery of the droplet (h) Moments before the hydrate covers the whole water droplet.
Methane 01 00002 g012
Figure 13. Partial dissociation on hydrates formed at a uniform temperature setting. Feed gas composition is specified above each pair of pictures. The top panels show growth before partial dissociation was observed. The bottom panels present the change in morphology after partial dissociation. T H L V = 277.4 K for all experiments. The driving force in both Δ T s u b and n Δ x g are shown at the bottom of the figure.
Methane 01 00002 g013
Figure 14. Hydrate dissociation sequences. (ad) CO 2 . P = 2.07 MPa. T H L V = 277.4 K. (eh) CH 4 . P = 4.01 MPa. T H L V = 277.5 K. (a) CO 2 hydrate moments after the hydrate has covered the whole water droplet. (b) As the temperature increases the hydrate dissociates, forming an interface (the black line) between the hydrate and the liquid water phase. (c) As the hydrate continues to dissociate, the liquid water is pushed to the cold side of the stage. (d) The water droplet has lost its original form by the end of the dissociation process. (e) CH 4 hydrate moments after the hydrate has covered the whole water droplet. (f) As the temperature increases the hydrate dissociates, forming an interface between the hydrate and the liquid water phase. (g) The hydrate continues to dissociate. (h) As the hydrate has dissociated almost completely, the liquid water of the water droplet can be seen once again.
Methane 01 00002 g014
Figure 15. Hydrate-film growth velocity versus subcooling. Empty-colored markers, gradient experiments; solid-colored markers, uniform temperature experiments. Error bars represent standard uncertainties as follows: u grad , CH 4 = 0.009 mm/s, u uni , CH 4 = 0.003 mm/s, u grad , 80 : 20 = 0.004 mm/s, u uni , 80 : 20 = 0.006 mm/s, u grad , 30 : 70 = 0.031 mm/s, u uni , 30 : 70 = 0.018 mm/s, u grad , CO 2 = 0.14 mm/s, u uni , CO 2 = 0.05 mm/s. Gray and black markers represent literature data (Freer, [37]; Li, [45]; Uchida, [16]; Daniel David, [22]; Kitamura, [39]).
Methane 01 00002 g015
Figure 16. (a) Growth rates of 80:20 CH 4 :CO 2 hydrates graphed versus n Δ x g ν 1 and Δ T s u b . (b) 80:20 hydrates formed under a constant temperature gradient. The red dotted line indicates an inflection point in growth rate with respect to n Δ x g . The inflection in growth rate corresponds to an abrupt change in morphology.
Methane 01 00002 g016
Table 1. Gases used in this study. Nominal compositions (CH 4 :CO 2 ) are as follows: Mixture 1 (80:20); Mixture 2 (30:70).
Composition10 2 y CH 4 10 2 y CO 2 Source
CH 4 99.9990Air Liquide, QC, CA
80:2080.0219.98
30:7029.9470.06
CO 2 0100
Table 2. Experimental conditions for gas hydrate formation from water droplets immersed in guest atmosphere. All experiments were done in triplicate. T H L V , Calculated HLV equilibrium temperature at experimental pressure. T H , highest temperature of the stage. T L , lowest temperature of the stage.
Vapor PhaseP/MPa T HLV /K T H /K T L /K
CH 4 4.00277.4279.2275.2
CH 4 4.00277.4279.0275.0
CH 4 4.01277.5279.0275.0
CH 4 4.00277.4276.9276.9
CH 4 4.00277.4277.1277.1
CH 4 6.60282.3274.4274.4
CH 4 8.60284.7275.5275.5
CH 4 8.60284.7276.7276.7
CO 2 2.10277.5277.5277.5
CO 2 2.09277.5277.5277.5
CO 2 2.10277.5279.5275.5
CO 2 2.10277.5279.0275.0
CO 2 2.10277.5275.7279.7
80:203.25277.4279.2275.2
80:203.25277.4275.0279.0
80:203.25277.4273.5277.5
80:203.25277.4271.8275.8
80:203.25277.4277.1277.1
80:203.25277.4277.2277.2
80:203.25277.4277.1277.1
80:204.40280.2274.2274.2
80:204.40280.2273.4273.4
30:702.35277.4277.3277.3
30:702.35277.4277.2277.2
30:702.35277.4277.3277.3
30:702.35277.4279.5275.5
30:702.35277.4279.2275.2
30:702.35277.4277.2277.2
30:702.35277.4277.1277.1
30:702.35277.4274.2274.2
30:702.35277.4276.4276.4
30:702.35277.4275.4275.4
30:702.35277.4273.4273.4
Publisher’s Note: MDPI stays neutral with regard to jurisdictional claims in published maps and institutional affiliations.

