Article

The Use of Conditional Variational Autoencoders in Generating Stellar Spectra

1
Department of Chemistry and Physics, Saint Mary’s College, Notre Dame, IN 46556, USA
2
Department of Physics, Florida Polytechnic University, Lakeland, FL 33805, USA
*
Author to whom correspondence should be addressed.
Astronomy 2025, 4(3), 13; https://doi.org/10.3390/astronomy4030013
Submission received: 3 June 2025 / Revised: 14 August 2025 / Accepted: 14 August 2025 / Published: 22 August 2025

Abstract

We present a conditional variational autoencoder (CVAE) that generates stellar spectra covering 4000 ≤ T eff ≤ 11,000 K, 2.0 log g 5.0 dex, 1.5 [ M / H ] + 1.5 dex, v sin i 300 km/s, ξ t between 0 and 4 km/s, and for any instrumental resolving powers less than 115,000. The spectra can be calculated in the wavelength range 4450–5400 Å. Trained on a grid of SYNSPEC spectra, the network synthesizes a spectrum in around two orders of magnitude faster than line-by-line radiative transfer. We validate the CVAE on 10 4 test spectra unseen during training. Pixel-wise statistics yield a median absolute residual of < 1.8 × 10 3 flux units with no wavelength-dependent bias. A residual error map across the parameters plane shows | Δ F | < 2 × 10 3 everywhere, and marginal diagnostics versus T eff , log g , v e sin i , ξ t , and [ M / H ] reveal no relevant trends. These results demonstrate that the CVAE can serve as a drop-in, physics-aware surrogate for radiative transfer codes, enabling real-time forward modeling in stellar parameter inference and offering promising tools for spectra synthesis for large astrophysical data analysis.

1. Introduction

Since transformers were introduced [1], generative artificial intelligence (AI) has rapidly spread to many disciplines, including astronomy. Researchers now identify pulsar candidates with transformer-based classifiers [2]. Others have created multimodal, object detection-driven augmentation models for satellite image sets [3]. Deep-learning frameworks can translate data from one solar instrument to another, producing homogeneous long-term data series [4]. Generative AI has even been used to predict optical galaxy spectra from broadband photometry alone [5]. Most recently, teams have combined several generative techniques to synthesize realistic solar magnetic-field patches and employ them as queries to locate matching structures in real observations [6]. In stellar spectroscopy, ref. [7] developed a proof-of-concept Transformer-based model that can both predict stellar parameters from spectra and generate synthetic spectra from stellar parameters, functioning as a kind of “foundation model” for stellar spectroscopy. Their model was trained on low-resolution Gaia spectra, but the concept demonstrates the versatility of deep learning (specifically Transformers) to serve as a forward model for spectra generation. Ref. [8] introduced Cycle-StarNet, a hybrid generative adversarial network approach that learns to transform theoretical (synthetic) stellar spectra into spectra that look more like real observed spectra. Their goal was to bridge the “synthetic–observational gap” by correcting systematic differences between models and real data. Ref. [9] introduce a Transformer-based stellar foundation model, SpectraFM that treats every wavelength pixel as a token, embeds its flux plus a learned wavelength positional code, and is pre-trained on ∼90,000 synthetic APOGEE spectra to predict key stellar labels ( T eff , log g , [Fe/H], [O/Fe], [Mg/Fe]). After a brief fine-tune on real APOGEE data and an additional 100 star fine-tune in a different infrared window, the model outperforms a neural network (NN) trained from scratch. Attention-map analysis shows the Transformer naturally locks onto physically meaningful spectral lines, giving astrophysically interpretable predictions. Overall, SpectraFM demonstrates that a single, modality-flexible foundation model can transfer knowledge across instruments and small datasets, reducing the “synthetic gap” and paving the way for few-shot or cross-survey spectroscopic inference in astronomy. Ref. [10] applied physics-informed neural networks (PINNs) to solve the radiative transfer equation in a different context, specifically for supernova spectra synthesis. They used a NN that inherently satisfies the differential equations of radiative transfer to compute spectra, and compared the results to a traditional radiative transfer code (TARDIS). These are just a few recent examples to illustrate the rise in the use of AI in astronomy.
The generation of synthetic stellar spectra is essential for many astrophysical applications including the calibration of spectroscopic surveys and the testing of stellar classification algorithms. Most stellar spectroscopy analysis techniques rely on synthetic data to be tested and constrained. Astronomers use radiative transfer codes to simulate the spectra of specific stars, planets, galaxies, and other astronomical objects. Synthetic stellar spectroscopy relies on a limited combination of model atmospheres and radiative transfer codes. Every available radiative transfer code is usually appropriate for a specific range of stellar parameters. For example, the PHOENIX models [11] are well suited for stars having T eff ≤ 12,000 K, or SYNSPEC models [12,13,14], usually used to synthesize spectra of stars with effective temperatures ( T eff ) ≥ 4000 K.
In the absence of direct access to the radiative transfer and model atmospheres codes, one can access specific databases that offer a selection, yet limited in sampling space, of stellar spectra. A comprehensive listing of the available codes and databases is described in [15] and references therein. When using databases that are typically calculated with large steps in stellar parameters, the resulting uncertainties in the derived stellar parameters become significant when compared with true observations.
In our previous work [15], we introduced a robust methodology for constructing synthetic spectra from theoretical models. The method was based on a combination of two distinct NNs. First, an autoencoder is trained on a set of BAFGK synthetic data. Then, a fully Dense NN was used to relate the stellar parameters to the Latent Space of the autoencoder. Finally, the Fully Dense NN was linked to the decoder part of the autoencoder in order to build a model that uses as input any combination of the effective temperature T eff , surface gravity log g , projected equatorial rotational velocity v e sin i , the overall metallicity [ M / H ] , and the microturbulence velocity ξ t , and output a normalized stellar spectrum.
Here, we extend that work of [15] by exploring new deep generative models, specifically the Conditional Variational Autoencoders (CVAE), to model and generate synthetic spectral data. This method is straightforward and requires fewer steps and preparation than the one described in [15] as it requires training only one model.
The paper is organized as follows: Section 2 describes the model atmospheres and radiative transfer codes used in the database construction. Section 3 details the CVAE model and its mathematical description. Section 4 evaluates the generated spectra. Conclusions are outlined in Section 5.

2. Database

Our Training Database (DB) is built using synthetic data. The same technique that will be presented in this paper can be applied to observational spectra that have accurate stellar parameters. It is worth noting that the idea is to reconstruct spectra similar to the ones we have in the DB, regardless of the origin or nature of these spectra. Our DB is made of a set of synthetic spectra having stellar and instrumental parameters in the range depicted in Table 1. This broad range of resolving powers demonstrates that our technique is not limited to a single instrument; it can be applied to data from many different instruments and surveys.
Around 300,000 synthetic spectra were calculated to construct the DB. For each spectrum, stellar and instrumental parameters were randomly selected from Table 1. The procedure for generating a synthetic spectrum is detailed in [16,17,18]. In summary, we used ATLAS9 (Kurucz, [19]) to calculate line-blanketed model atmospheres for this work. These are LTE plane parallel models that assume hydrostatic and radiative equilibrium. We used the Opacity Distribution Function (ODF) of [20]. For stars cooler than 8500 K, we incorporated convection using Smalley’s prescriptions [21] and the mixing length theory. The mixing length parameter was 0.5 for 7000 K ≤ T eff ≤ 8500 K and 1.25 for T eff ≤ 7000 K. The synthetic spectra grid was computed using SYNSPEC [12] according to the parameters described in Table 1. We scaled the metallicity, with respect to the Grevesse & Sauval solar value [22], from −1.5 dex up to +1.5 dex. The metallicity is calculated as the abundance of elements heavier than Helium. The change in metallicity consists of a change in the abundance of all metals with the same scaling factor. The synthetic spectra were computed from 4450 Å up to 5400 Å with a wavelength step of 0.05 Å. This range contains many moderate and weak metallic lines in different ionization stages. These weak metallic lines are sensitive to v e sin i , [ M / H ] , and ξ t , while the Balmer line is sensitive to T eff and log g . The linelist used in the synthetic spectra calculation was constructed from Kurucz database and modified with updated atomic data as explained in [17]. Figure 1 shows a colormap of the full database. The fluxes of the normalized spectra are shown as the intensity in the colorbar. The strong absorption line around 4861 Å corresponds to the Balmer H β line. This range of wavelength contains many lines with different information on the chemical abundance of many metals such as Mg, Si, Ca, Sc, Ti, Cr, Mn, Fe, Ni, and Zr, among others. These chemical elements have different ionization stages and are sensitive to the stellar and instrumental parameters.

3. Variational Autoencoder

Variational Autoencoders (VAEs) are a class of deep generative models that learn to encode data into a lower-dimensional latent space and then decode it back to reconstruct the original data. Unlike traditional autoencoders, VAEs impose a probabilistic structure on the latent space by encoding inputs to probability distributions rather than to fixed points [23]. This probabilistic approach allows VAEs to serve as generative models capable of producing new, realistic data samples. A standard VAE consists of two primary components, an encoder network that maps input data x to a distribution in latent space, typically parameterized by means μ and log-variances log σ 2 , and adecoder network that maps samples from the latent space back to the data space, reconstructing the original input.
The VAE is trained to minimize two objectives simultaneously: The reconstruction loss that ensures decoded outputs closely match the inputs and the Kullback–Leibler (KL) divergence that ensures the encoded latent distributions approximate a prior distribution, typically a standard normal distribution N ( 0 , I ) .

3.1. Conditional Variational Autoencoders

Conditional Variational Autoencoders (CVAEs) extend the VAE framework by incorporating conditioning information. In a CVAE, both the encoding and decoding processes are conditioned on additional variables c. This conditioning enables the model to generate data with specific desired properties or characteristics. Typically, the conditioning variable c contains the values of the stellar and instrumental parameters.
Formally, while a VAE models the marginal likelihood p ( x ) , a CVAE models the conditional likelihood p ( x | c ) . The encoder in a CVAE learns to approximate the posterior q ϕ ( z | x , c ) rather than q ϕ ( z | x ) , and the decoder learns the conditional generative model p θ ( x | z , c ) .
In our specific application, we employ a CVAE to model and generate synthetic stellar spectra conditioned on physical stellar parameters. This approach offers several advantages. It provides a data-driven model for spectrum synthesis that complements traditional physics-based models, it enables rapid generation of spectra once trained, facilitating large-scale analyses, and it allows for exploration of the continuous space of stellar parameters through the conditioned generative process.
Our CVAE implementation uses the 6 parameters of Table 1 as conditioning variables. Its architecture consists of two main blocks, An encoder and a decoder network. The encoder takes two inputs, the stellar spectrum represented as a 1D array with shape ( n wav , 1 ) , where n wav is the number of wavelength points which is 19,000 in our case, and the conditioning stellar parameters vector with shape ( 6 , ) containing T eff , log g , v e sin i , [M/H], ξ t , and the resolving power.
The encoder processes these inputs through several dense layers and outputs the mean vector μ of the latent distribution and the log-variance vector log σ 2 of the latent distribution. This will allow us to sample a latent vector z from this distribution in the form of:
z = μ + exp ( 0.5 · log σ 2 ) ϵ
where ϵ N ( 0 , I ) is a random noise vector.
Next, the decoder takes the sampled latent vector z from the encoder and the same conditioning stellar parameters vector. Through several dense layers, the decoder reconstructs the original spectrum with shape ( n wav , 1 ) .
In a similar way to traditional VAE, the model is trained by minimizing the loss function:
L = L reconstruction + L KL
where
  • L reconstruction = MSE ( x , x ^ ) is the mean squared error between the original spectrum x and the reconstructed spectrum x ^ .
  • L KL = 1 2 j = 1 J ( 1 + log σ j 2 μ j 2 exp ( log σ j 2 ) ) is the KL divergence term that regularizes the latent space.
Once trained, our CVAE can generate synthetic stellar spectra for any given set of physical parameters through the following process:
  • Normalize the desired stellar parameters using the previously calculated normalization factors:
    c normalized = c c min c max c min
  • Sample a random vector z from the standard normal distribution N ( 0 , I ) .
  • Feed z and c normalized to the decoder to generate a normalized synthetic spectrum:
    x ^ normalized = decoder ( z , c normalized )
  • Denormalize the spectrum to obtain physical flux values (the generated spectrum):
    x ^ = x ^ normalized · ( x max x min ) + x min

3.2. Model Architecture

In our implementation, we used the following architecture specifications:
  • An input layer containing the spectrum of dimension 19,000 combined with a conditional vector containing the stellar and instrumental parameters of dimension 6.
  • Latent space of dimension 100.
  • Encoder network: Dense layers with 4000, 2000, and 1000 units with ReLU activations.
  • Decoder network: Dense layers with 1000, 2000, and 4000 units with ReLU activations, followed by a final layer with sigmoid activation.
  • Training parameters: Adam optimizer with a dynamical learning rate, a batch size of 512, and early stopping based on reconstruction loss with patience of 50.
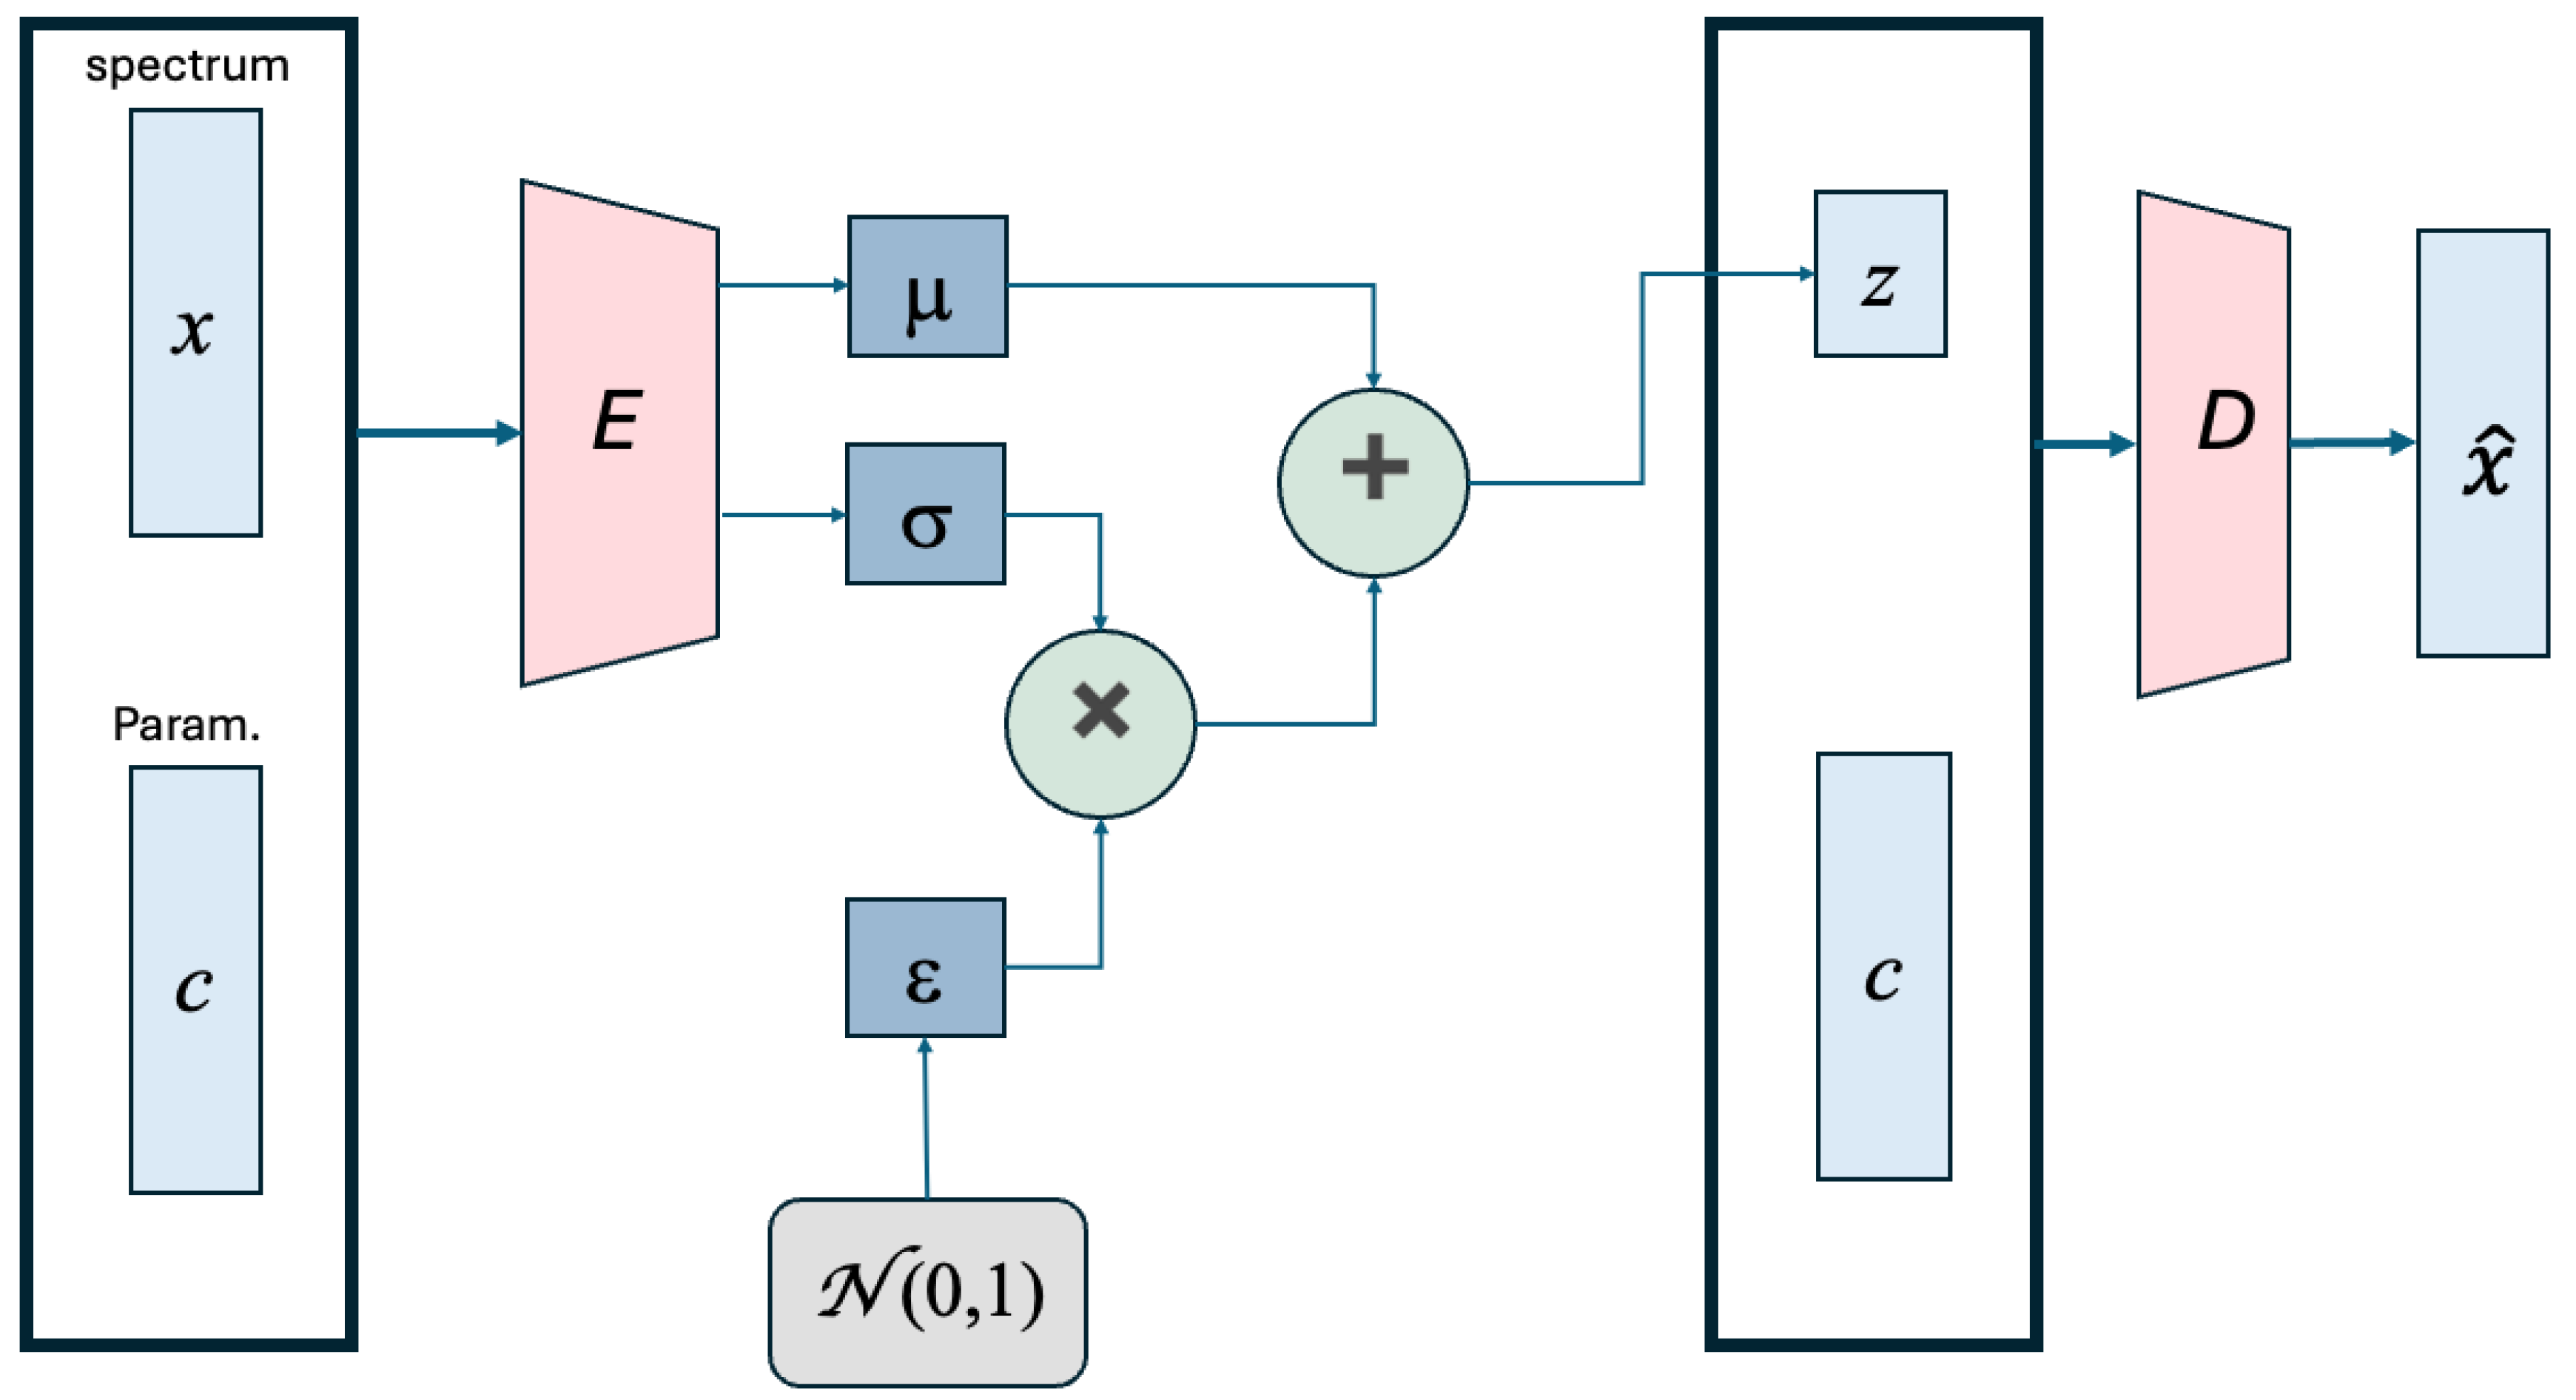
The choice of this network is based on the size of the data and on several trials that lead to an optimization of the time and errors. The training for the 300,000 spectra on a 52–2.1 Ghz core computer with 258 GB RAM and 48 GB Nvidia RTX A6000 graphic car took around 420 h. A flowchart of the network is presented in Figure 2 in which the encoder E contains the succession of the three dense layers of 4000, 2000, and 1000 nodes, respectively. In the same way, the decoder D contains a successions of 3 dense layers of 1000, 2000, and 4000 nodes, respectively.

3.3. Spectra Generation

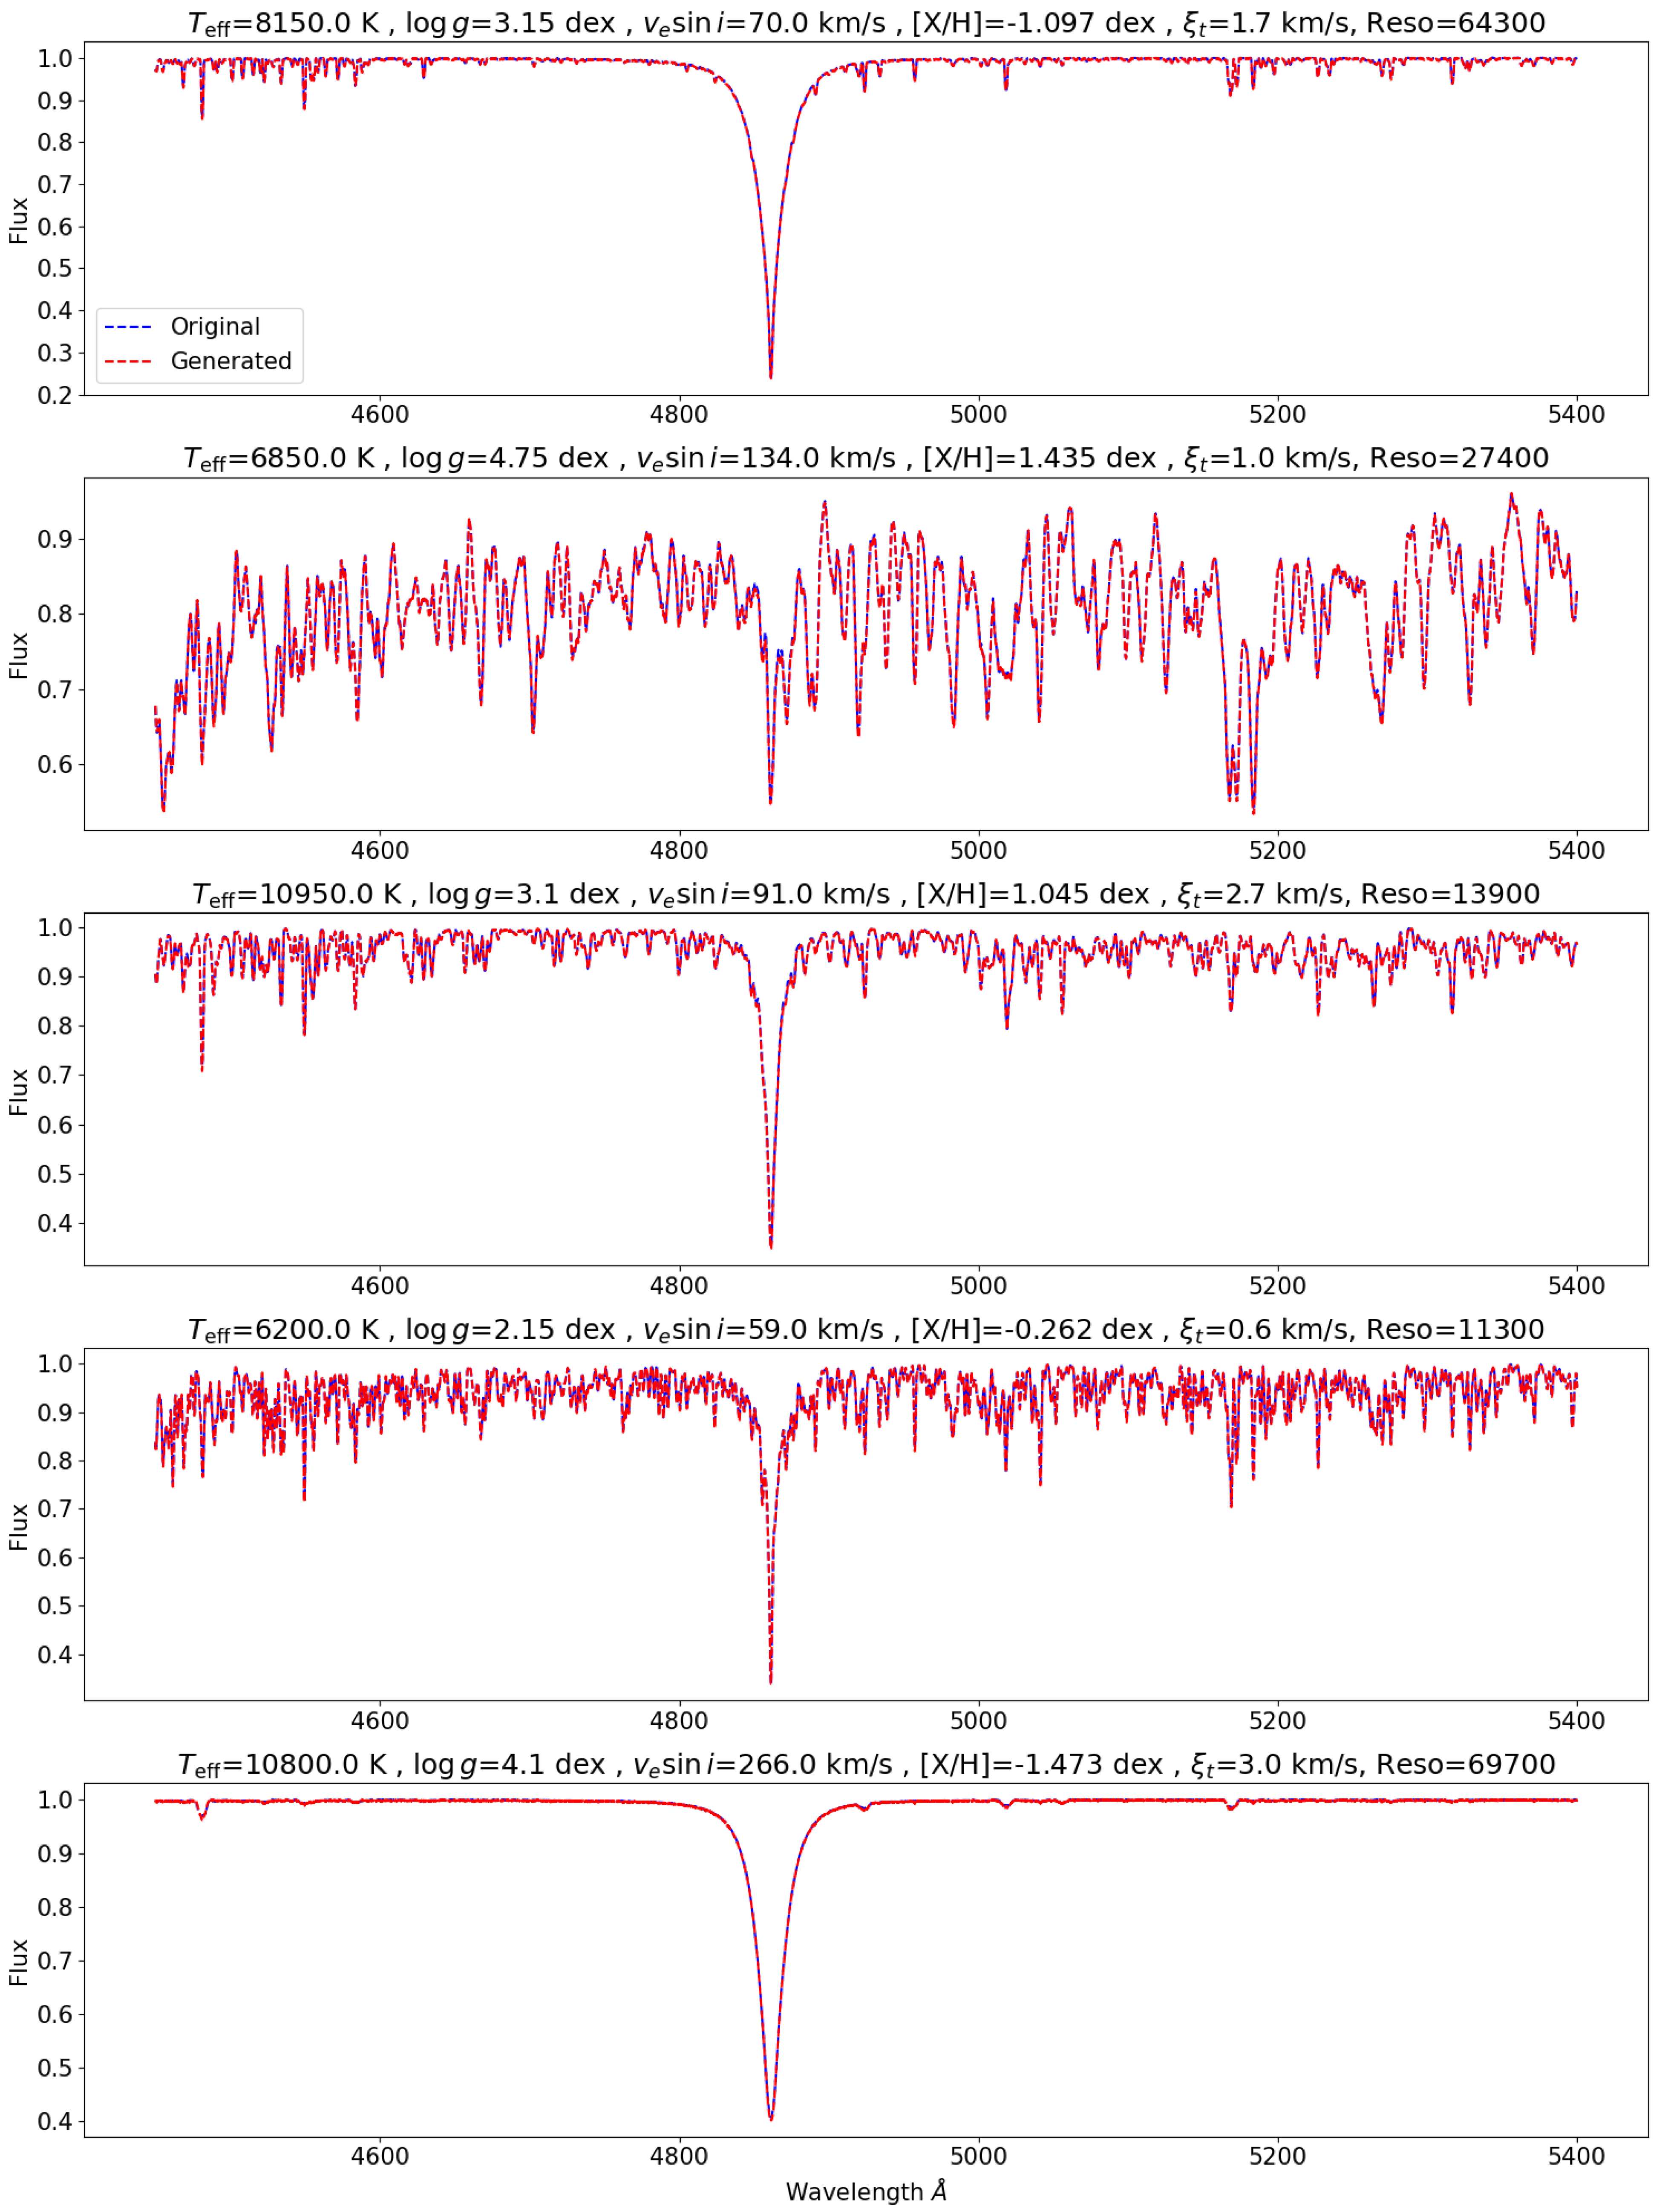
Once the model is trained, the generation of spectra are done using the decoder part and by choosing randomly a set of stellar and instrumental parameters that play the role of the conditional variable c. This is done using Equation (4), defined previously. The generated spectra are computed using any configuration of parameters within the bounds of Table 1 and not necessarily a combination that exists in the DB. Figure 3 represents a sample of randomly generated synthetic spectra (in red dashed line) displayed with the ones calculated using the radiative code SYNSPEC for the same parameters (in blue). This visual inspection shows that the CVAE is capable of reproducing all the features of the original spectra in this wavelength region. A more quantitative assessment of the generated spectra quality is performed in the next section. Furthermore, for that, we have constructed a generated database of 15,000 generated spectra that we will be analyzing.

4. Determination of Parameters

A quantitative assessment of the quality of the generated spectra is carried out using a technique that has been previously tested on the original synthetic spectra. By applying the same technique to both the synthetic spectra and the generated spectra, we can check if we observe identical results. If this is the case, this confirms that the generated spectra cannot be distinguished from the original ones.
We have performed a parameter determination and checked the inferred accuracies between the synthetic ones and the generated ones. The determination of the stellar and instrumental parameters are done according to the work of [17,25]. It consists of developing a NN that is trained on 6 parameters ( T eff , log g , v e sin i , [ M / H ] , ξ t , and resolution). The network involves a preprocessing of the original spectra using a Principal Component Analysis (PCA) transformation. The input data consists of a matrix of synthetic data having a dimension of 600,000 spectra × 19,000 wavelength points. This matrix is reduced to 600,000 spectra × 25 PCA coefficients. As explained in [17], this step is optional but recommended to increase the speed of the calculations. The choice of the number of coefficients is regulated by the reconstructed error from PCA (see [17,26] for more details). The 600,000 spectra are in fact the original ones of the DB augmented with the noisy ones according to [25]. We followed the same technique as in [17,25] by using the same DB and apply a random Gaussian noise, with a signal to noise ratio, SNR, between 5 and 300, to each spectrum of the DB. The choice of the number of coefficients is regulated by the PCA reconstructed error (see [17,26] for more details).

4.1. Accuracy of the Stellar Parameters

We have performed a parameter determination and compared the inferred accuracies between synthetic and generated spectra. The determination of stellar and instrumental parameters is based on the work of [17,25]. We developed a NN trained on six parameters: T eff , log g , v e sin i , [ M / H ] , ξ t , and resolution. Using the same architecture of [15], we have constructed a model that related the 25 PCA coefficients to the 6 stellar and instrumental parameters as displayed in Table 2.
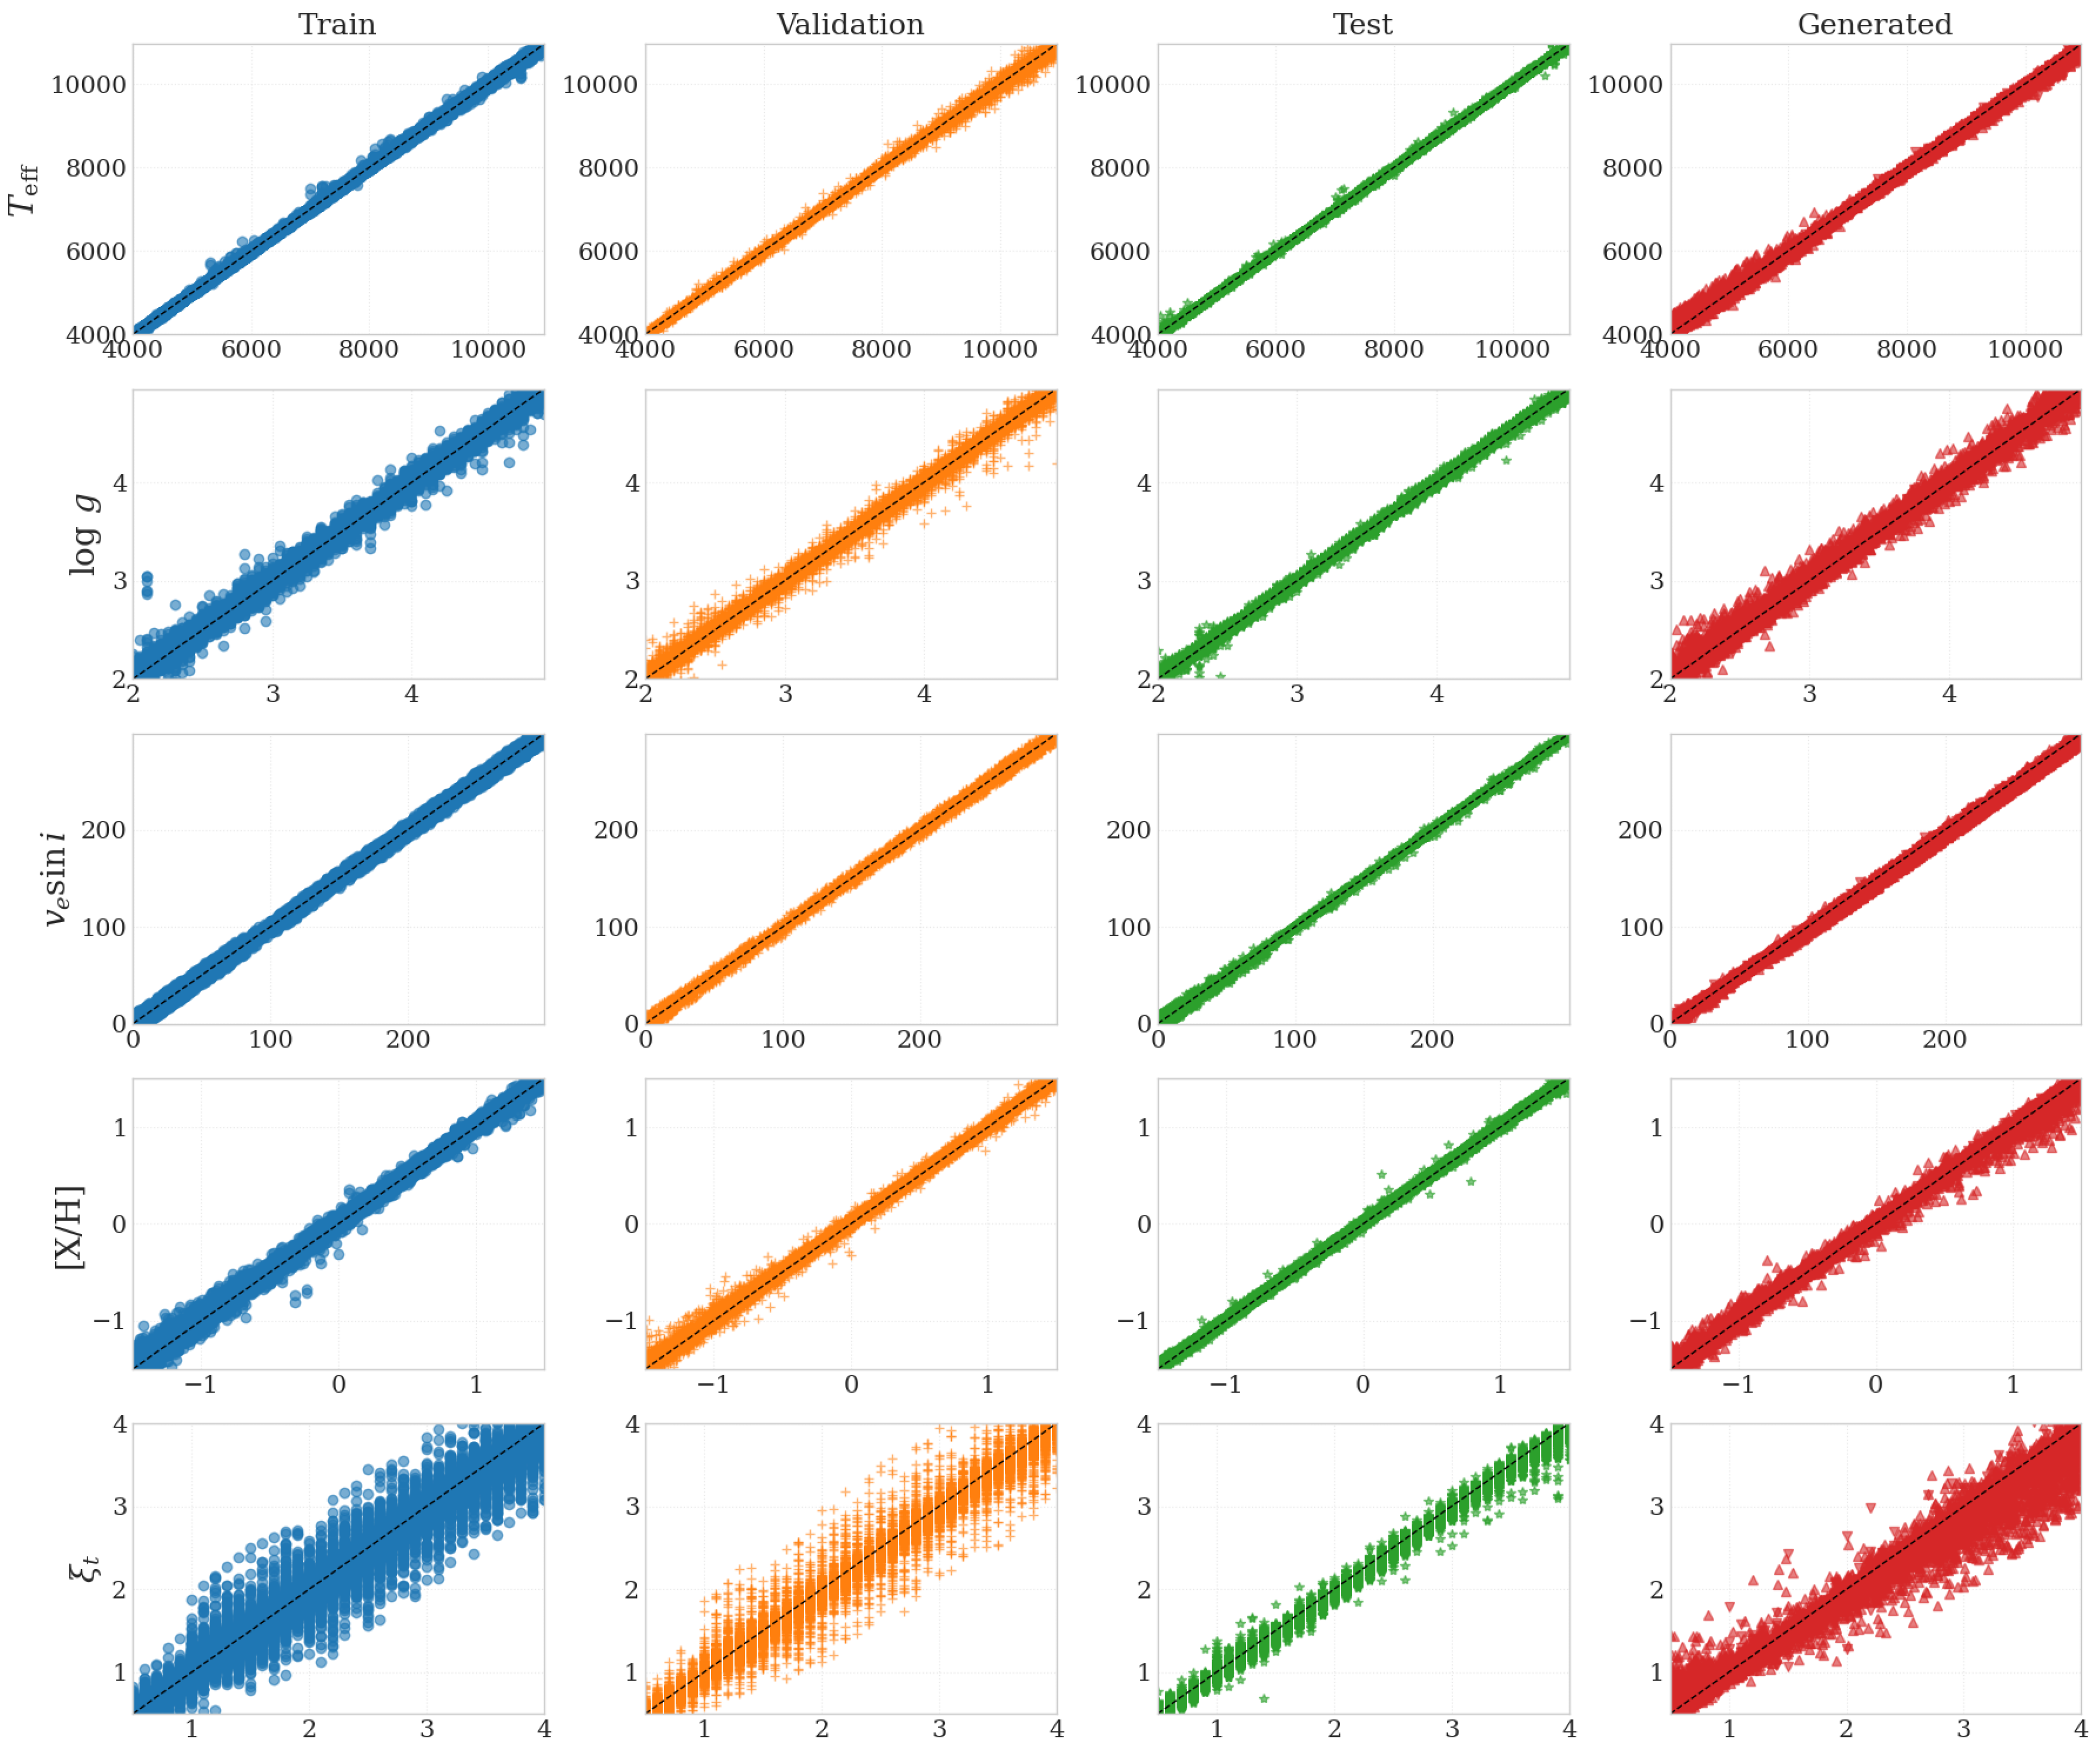
The data (i.e., the 600,000 spectra) has been divided in 70-15-15% for training, validation, and testing, respectively. The optimizer used is “Adamax” combined with a Mean Squared Error (MSE) loss function. We have also used a batch size of 1024. Once the model is trained and the loss function minimized, the results are displayed in Table 3 in which we have calculated the root of the MSE between the original and the derived stellar and instrumental parameters for the training, validation, test, and generated data. The purpose of this test is to show that the generated data represents the same features as the ones calculated using the radiative transfer code. Therefore, if the derived accuracies for the generated data are in the same order as the ones for the test data, it shows that our approach is capable of reproducing spectra as accurate as the radiative transfer code. We are not assessing the technique for deriving the parameters, the parameters derivations, this has been done in [15,17,25,27].
Figure 4 displays the predicted stellar parameters as a function of the original ones for the training, evaluation, test, and generated dataset. Table 3 and Figure 4 show the similarity in the behavior of the results for the test and generated databases.

4.2. Heat-Map of Residuals over Parameter Space

To visualize how the CVAE behaves on the stellar parameter grid, we calculate 2 new grids of spectra. These 2 grids have the same parameters except that one is calculated using SYNSPEC and the other one using the CVAE. It is worth mentioning that the gain in computation time between the CVAE and SYNSPEC is around ∼50×. We then have calculated, for each spectrum, the wavelength-averaged absolute residual | Δ F | between the two grids in the following way
| Δ F | = 1 N λ i = 1 N λ F gen ( λ i ) F syn ( λ i )
where F gen ( λ i ) represents the generated spectrum at the wavelength λ i and F syn ( λ i ) represents the SYNSPEC spectrum at the same wavelength λ i . The average is performed over the N λ = 19,000 wavelength points. A smaller | Δ F | indicates a closer match to the radiative transfer solution.
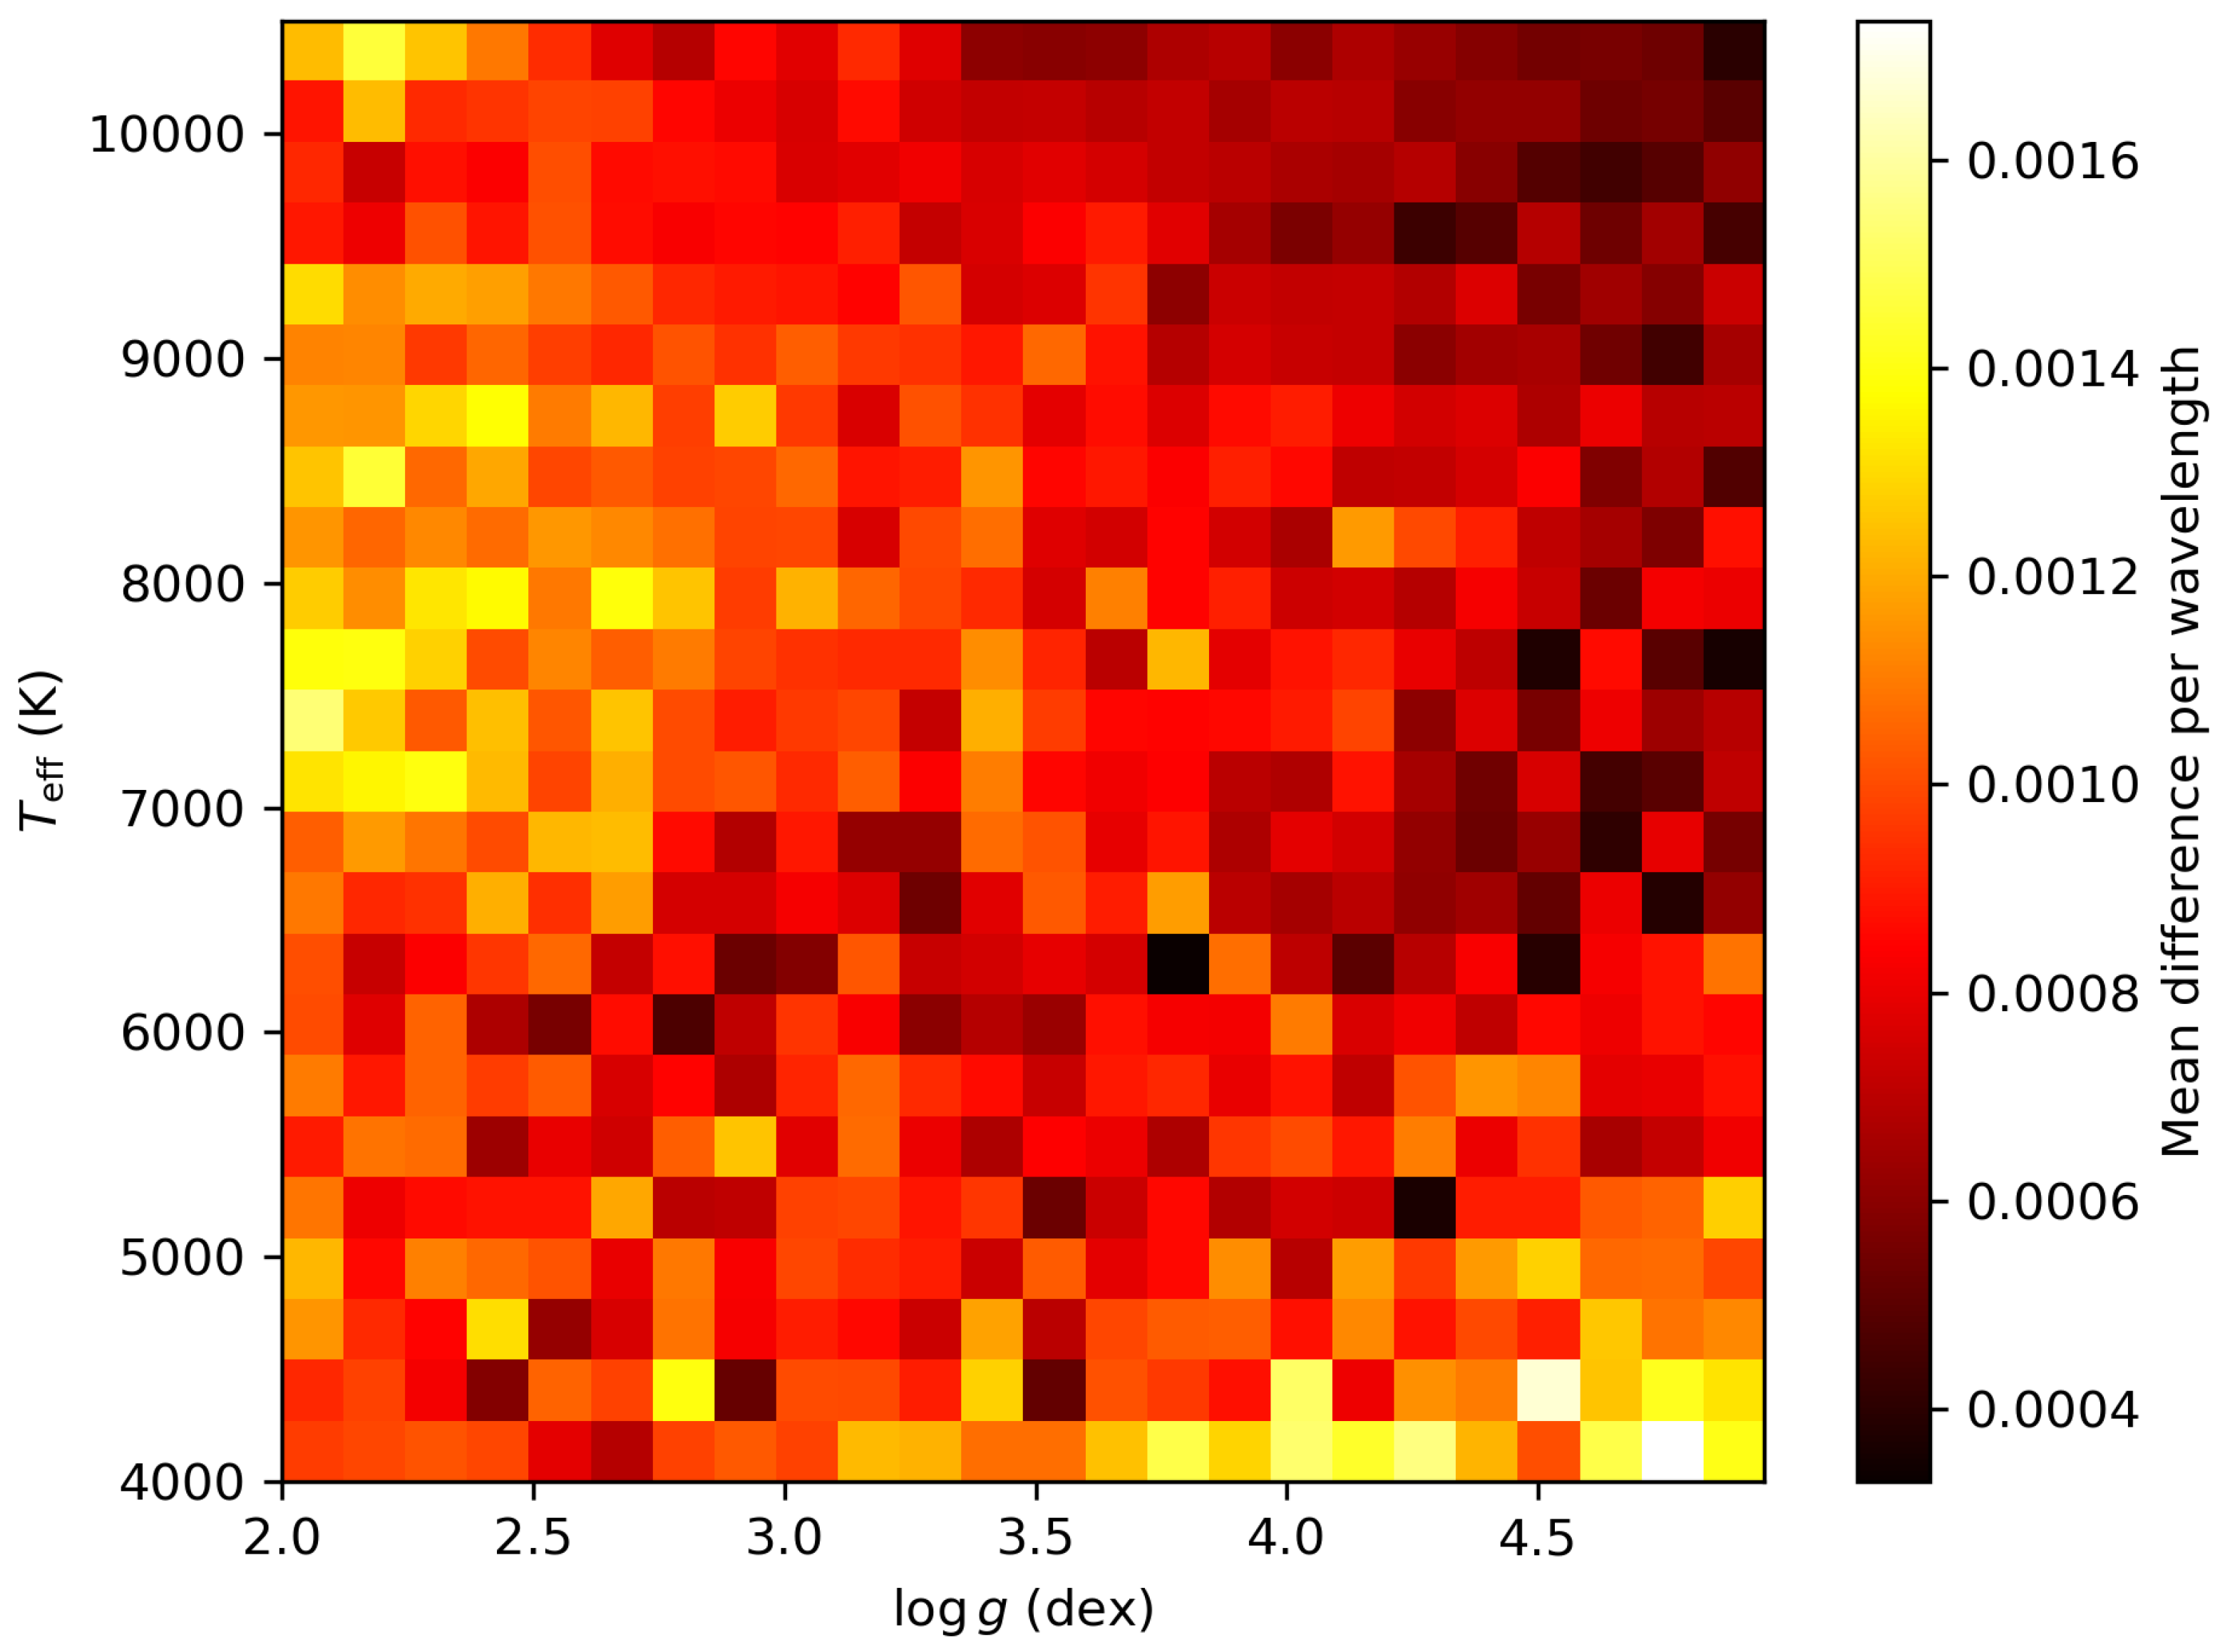
Each spectrum being associated with its effective temperature T eff and surface gravity log g , we have generated a heat map that represents the residual in a T eff log g plane. In each cell we average the residuals of all spectra falling into that bin. The main purpose of this task is to show that there is no specific trends in the residual and therefore no biases in the CVAE spectra generation procedure. The heat map is presented in Figure 5 in which we show that, in overall, the network achieves sub-percent accuracy throughout the region spanned by our data. The CVAE reproduces SYNSPEC with | Δ F | 1.8 × 10 3 across the bulk of the grid. Slightly higher residuals appear only at cool high gravity corner where spectral lines are intrinsically denser. No trend can be found in this data, and this is true in all the combinations of 2D planes confirming that the latent manifold learned by the CVAE interpolates smoothly in all stellar labels.

4.3. Marginal Residuals Versus Stellar Parameters

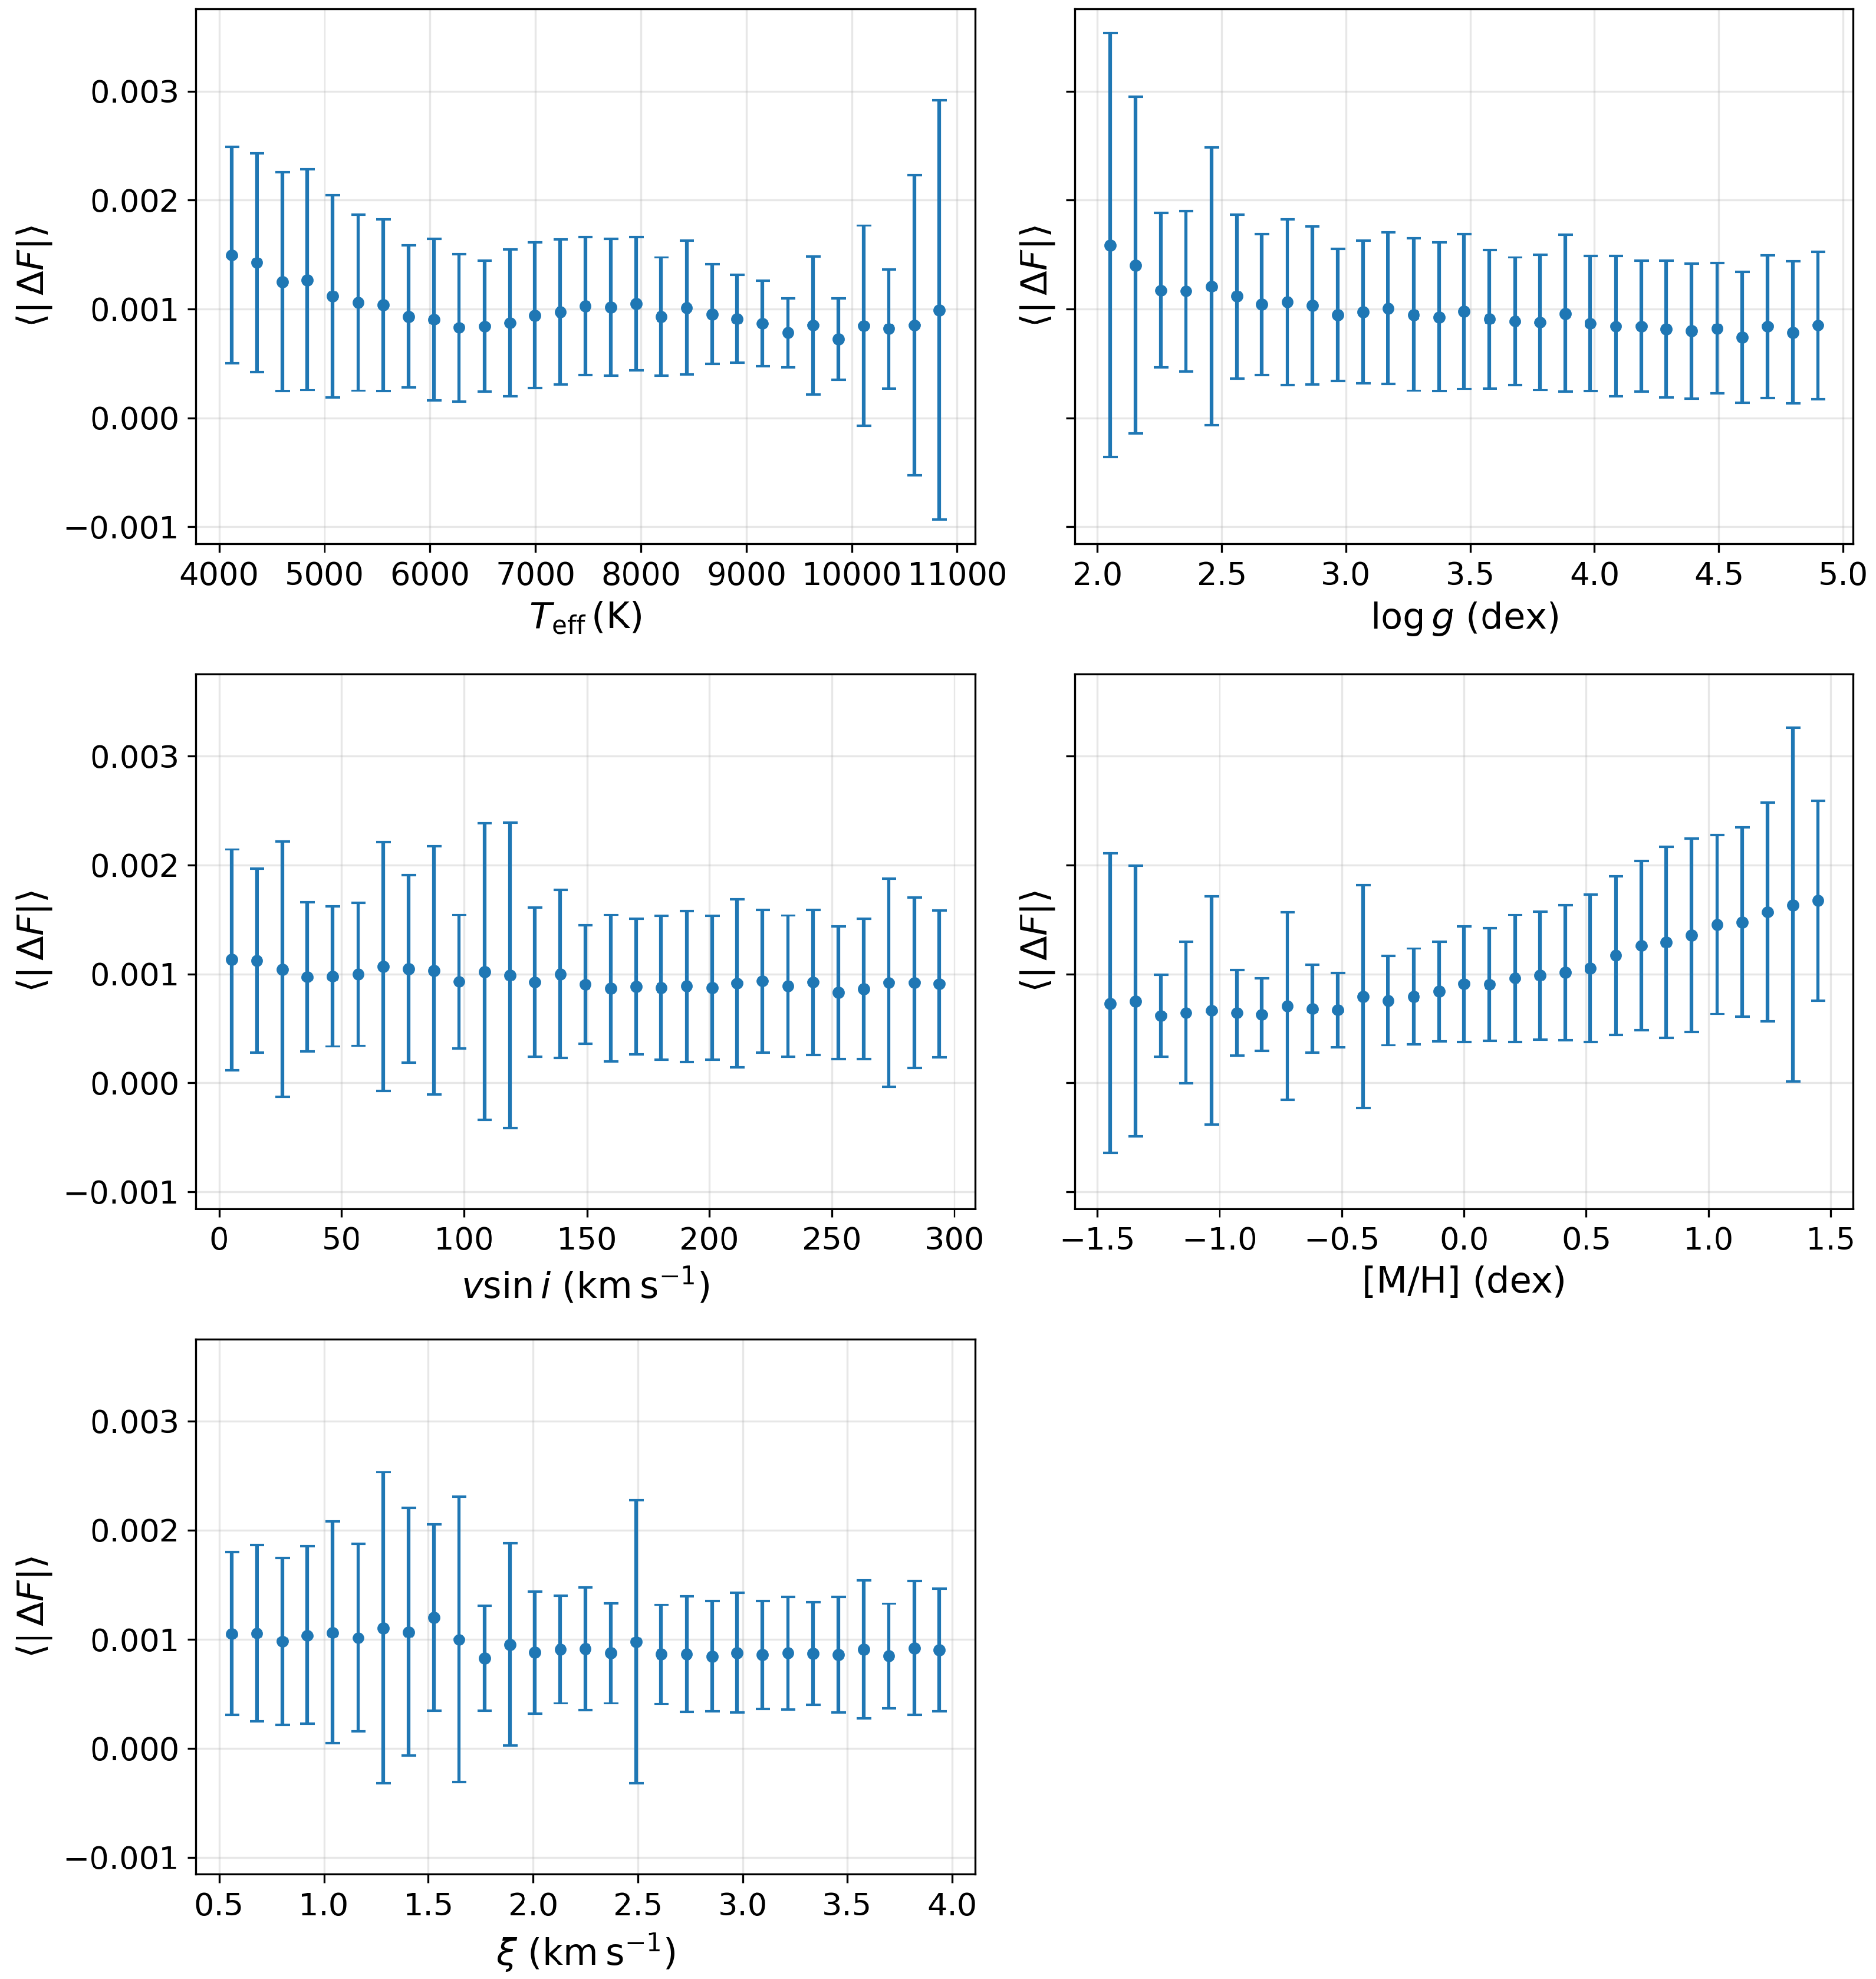
To complement the two–dimensional heat-map of Section 4.2, Figure 6 displays the one dimensional behavior of the wavelength averaged absolute residual, | Δ F | , as a function of four key stellar labels. The data are binned into equal-width intervals; solid points mark the mean residual in each bin and the error bars denote the 1 σ scatter of the spectra falling in that interval.
Although correlation tests return highly significant p-values owing to the large sample size, the effect sizes remain small: T eff , log g , v e sin i , and ξ t explain < 4 % of the variance in | Δ F | , and metallicity explains ∼10%. Even at the extremes of parameter space the mean residual never exceeds 2 × 10 3 , well below the pixel noise of spectra for a SNR of around a 100. We therefore regard the residual trends as astrophysically negligible; the CVAE reproduces SYNSPEC to better than 0.2% across the full grid.
This analysis combined with the previous scatters and acuracies on the stellar parameters, concludes that the CVAE introduces no systematic bias with respect to any of the stellar labels. The network therefore serves as a reliable, “physics-aware” surrogate for SYNSPEC over the full stellar parameter range explored in this work.

5. Conclusions and Future Work

We have demonstrated that a CVAE trained on a grid of SYNSPEC spectra can reproduce the underlying radiative-transfer physics to sub-percent accuracy while delivering spectra in a fast and reliable way. The derived parameters of the generated spectra reveal a similar accuracy to those of spectra synthesized with SYNSPEC.
Across 10 4 independent test cases the median wavelength-normalised residual is ∼ 10 3 and never exceeds 1.8 × 10 3 over the explored parameter space of Table 1. Residual heat-maps and one-dimensional marginal diagnostics reveal no astrophysically significant dependence on any individual label.
Because the CVAE learns the mapping between stellar labels and flux rather than the internal radiative-transfer equations, the same architecture can be trained on any large collection of synthetic spectra, regardless of which tools and codes are used, including the following:
  • Radiative transfer codes: SYNSPEC, TURBOSCPECTRUM [28], MOOG [29]...
  • Model atmospheres: ATLAS, TLUSTY [12,13,14], PHOENIX [11]...
  • Spectral window: ultraviolet, optical, infrared, or a combination thereof
  • Resolving power: high-resolution echelle down to broad-band photometric passbands.
Our next priority is to diversify the training corpus. This can be done by merging grids from multiple radiative transfer sources covering a broader range of physical parameter used in stellar population studies. Within that expanded database we plan to introduce individual modified chemical abundances. In parallel, we will retrain the network over an extended wavelength domain and not only limited to the one tested in this current work. To further suppress the mild metallicity trend detected in this work we will experiment with physics-informed losses that penalize deviations in equivalent widths, Balmer line wings, and/or continuum level.
Moreover, because training only requires input–output pairs, the method is equally applicable to real high-SNR observations. One can fine-tune the network on homogenized, normalized spectra in the same wavelength range. Once trained, the CVAE becomes a standalone spectra generator that eliminates the hassle of using model atmospheres and radiative transfer codes (combined with their compilers) or the use of online databases that are limited in resolution and parameter space. An example of real observations database in a large wavelength range is Melchiors [30]. This database combines around 3250 high-SNR spectra of O to M stars between 3900 and 9000 Å with a spectral resolution of 85,000.
By decoupling synthetic spectrum generation from first principles radiative transfer, our CVAE framework transforms spectrum synthesis from a computational bottleneck into a millisecond-scale, differentiable operation. A differentiable surrogate lets users back-propagate through spectral synthesis, enabling gradient-based Bayesian inference (e.g., MCMC) and automatic uncertainty propagation, neither of which is possible with traditional radiative-transfer codes. We anticipate that such learned surrogates will become a standard infrastructure component in stellar astrophysics, enabling the astronomical community to generate high-fidelity spectra on demand, without invoking traditional radiative-transfer codes.

Author Contributions

Conceptualization, M.G. and I.B.; methodology, M.G.; software, M.G.; validation, I.B.; formal analysis, M.G.; investigation, M.G.; resources, M.G. and I.B.; data curation, M.G.; writing—original draft preparation, M.G.; writing—review and editing, M.G. and I.B.; visualization, M.G.; supervision, M.G.; project administration, M.G. All authors have read and agreed to the published version of the manuscript.

Funding

This research received no external funding.

Acknowledgments

M.G. acknowledges Saint Mary’s College for providing the necessary computational power for the success of this project.

Conflicts of Interest

The authors declare no conflict of interest.

References

  1. Vaswani, A.; Shazeer, N.; Parmar, N.; Uszkoreit, J.; Jones, L.; Gomez, A.N.; Kaiser, L.; Polosukhin, I. Attention Is All You Need. arXiv 2017, arXiv:1706.03762. [Google Scholar] [CrossRef]
  2. Cao, J.; Xu, T.; Deng, L.; Zhou, X.; Li, S.; Liu, Y.; Zhou, W. Pulsar candidate identification using advanced transformer-based models. Chin. J. Phys. 2024, 90, 121. [Google Scholar] [CrossRef]
  3. Malik, R.; Garg, R.; Cengiz, K.; Ivković, N.; Akhunzada, A. MODAMS: Design of a multimodal object-detection based augmentation model for satellite image sets. Sci. Rep. 2025, 15, 12742. [Google Scholar] [CrossRef]
  4. Jarolim, R.; Veronig, A.M.; Pötzi, W.; Podladchikova, T. A deep learning framework for instrument-to-instrument translation of solar observation data. Nat. Commun. 2025, 16, 3157. [Google Scholar] [CrossRef]
  5. Doorenbos, L.; Sextl, E.; Heng, K.; Cavuoti, S.; Brescia, M.; Torbaniuk, O.; Longo, G.; Sznitman, R.; Márquez-Neila, P. Galaxy Spectroscopy without Spectra: Galaxy Properties from Photometric Images with Conditional Diffusion Models. ApJ 2024, 977, 131. [Google Scholar] [CrossRef]
  6. Chatterjee, S.; Muñoz-Jaramillo, A.; Malanushenko, A.V. Deep Generative model that uses physical quantities to generate and retrieve solar magnetic active regions. arXiv 2025, arXiv:2502.05351. [Google Scholar] [CrossRef]
  7. Leung, H.W.; Bovy, J. Towards an astronomical foundation model for stars with a transformer-based model. MNRAS 2024, 527, 1494. [Google Scholar] [CrossRef]
  8. O’Briain, T.; Ting, Y.-S.; Fabbro, S.; Yi, K.M.; Venn, K.; Bialek, S. Cycle-StarNet: Bridging the Gap between Theory and Data by Leveraging Large Data Sets. ApJ 2021, 906, 130. [Google Scholar] [CrossRef]
  9. Koblischke, N.; Bovy, J. SpectraFM: Tuning into Stellar Foundation Models. arXiv 2024, arXiv:2411.04750. [Google Scholar] [CrossRef]
  10. Chen, X.; Jeffery, D.J.; Zhong, M.; McClenny, L.; Braga-Neto, U.; Wang, L. Using Physics Informed Neural Networks for Supernova Radiative Transfer Simulation. arXiv 2022, arXiv:2211.05219. [Google Scholar] [CrossRef]
  11. Husser, T.-O.; Berg, W.; Dreizler, S.; Homeier, D.; Reiners, A.; Barman, T.; Hauschildt, P.H. A new extensive library of PHOENIX stellar atmospheres and synthetic spectra. A&A 2013, 553, A6. [Google Scholar] [CrossRef]
  12. Hubeny, I.; Lanz, T. Astrophysics Source Code Library. Record ascl:1109.022. 2011. Available online: https://ascl.net/1109.022 (accessed on 1 July 2024).
  13. Hubeny, I.; Lanz, T. A brief introductory guide to TLUSTY and SYNSPEC. arXiv 2017, arXiv:1706.01859. [Google Scholar] [CrossRef]
  14. Hubeny, I.; Allende Prieto, C.; Osorio, Y.; Lanz, T. TLUSTY and SYNSPEC Users’s Guide IV: Upgraded Versions 208 and 54. arXiv 2021, arXiv:2104.02829. [Google Scholar] [CrossRef]
  15. Gebran, M. Generating Stellar Spectra Using Neural Networks. Astronomy 2024, 3, 1. [Google Scholar] [CrossRef]
  16. Gebran, M.; Farah, W.; Paletou, F.; Monier, R.; Watson, V. A new method for the inversion of atmospheric parameters of A/Am stars. A&A 2016, 589, A83. [Google Scholar] [CrossRef]
  17. Gebran, M.; Paletou, F.; Bentley, I.; Brienza, R.; Connick, K. Deep learning applications for stellar parameter determination: II-application to the observed spectra of AFGK stars. Open Astron. 2023, 32, 209. [Google Scholar] [CrossRef]
  18. Kassounian, S.; Gebran, M.; Paletou, F.; Watson, V. Sliced Inverse Regression: Application to fundamental stellar parameters. Open Astron. 2019, 28, 68. [Google Scholar] [CrossRef]
  19. Kurucz, R.L. Model atmospheres for population synthesis. Symp. Int. Astron. Union 1992, 149, 225. [Google Scholar]
  20. Castelli, F.; Kurucz, R.L. New Grids of ATLAS9 Model Atmospheres. arXiv 2003, arXiv:astro-ph/0405087. [Google Scholar] [CrossRef]
  21. Smalley, B. Observations of convection in A-type stars. Proc. Int. Astron. Union 2004, 224, 131. [Google Scholar] [CrossRef]
  22. Grevesse, N.; Sauval, A.J. Standard Solar Composition. Space Sci. Rev. 1998, 85, 161. [Google Scholar] [CrossRef]
  23. Doersch, C. Tutorial on Variational Autoencoders. arXiv 2016, arXiv:1606.05908. [Google Scholar] [CrossRef]
  24. van de Ven, G.M.; Li, Z.; Tolias, A.S. Class-Incremental Learning with Generative Classifiers. arXiv 2021, arXiv:2104.10093. [Google Scholar] [CrossRef]
  25. Gebran, M.; Connick, K.; Farhat, H.; Paletou, F.; Bentley, I. Deep learning application for stellar parameters determination: I-constraining the hyperparameters. Open Astron. 2022, 31, 38. [Google Scholar] [CrossRef]
  26. Paletou, F.; Böhm, T.; Watson, V.; Trouilhet, J.-F. Inversion of stellar fundamental parameters from ESPaDOnS and Narval high-resolution spectra. A&A 2015, 573, A67. [Google Scholar] [CrossRef]
  27. Gebran, M.; Bentley, I.; Brienza, R.; Paletou, F. Deep learning application for stellar parameter determination: III-denoising procedure. OAst 2025, 34, 20240010. [Google Scholar] [CrossRef]
  28. Gustafsson, B.; Edvardsson, B.; Eriksson, K.; Jørgensen, U.G.; Nordlund, Å.; Plez, B. A grid of MARCS model atmospheres for late-type stars. A&A 2008, 486, 951. [Google Scholar] [CrossRef]
  29. Sneden, C.; Bean, J.; Ivans, I.; Lucatello, S.; Sobeck, J. Astrophysics Source Code Library. Record ascl:1202.009. 2012. Available online: https://ui.adsabs.harvard.edu/abs/2012ascl.soft02009S (accessed on 1 July 2024).
  30. Royer, P.; Merle, T.; Dsilva, K.; Sekaran, S.; Van Winckel, H.; Frémat, Y.; Van der Swaelmen, M.; Gebruers, S.; Tkachenko, A.; Laverick, M.; et al. The Mercator Library of High Resolution Stellar Spectroscopy. A&A 2024, 681, A107. [Google Scholar] [CrossRef]
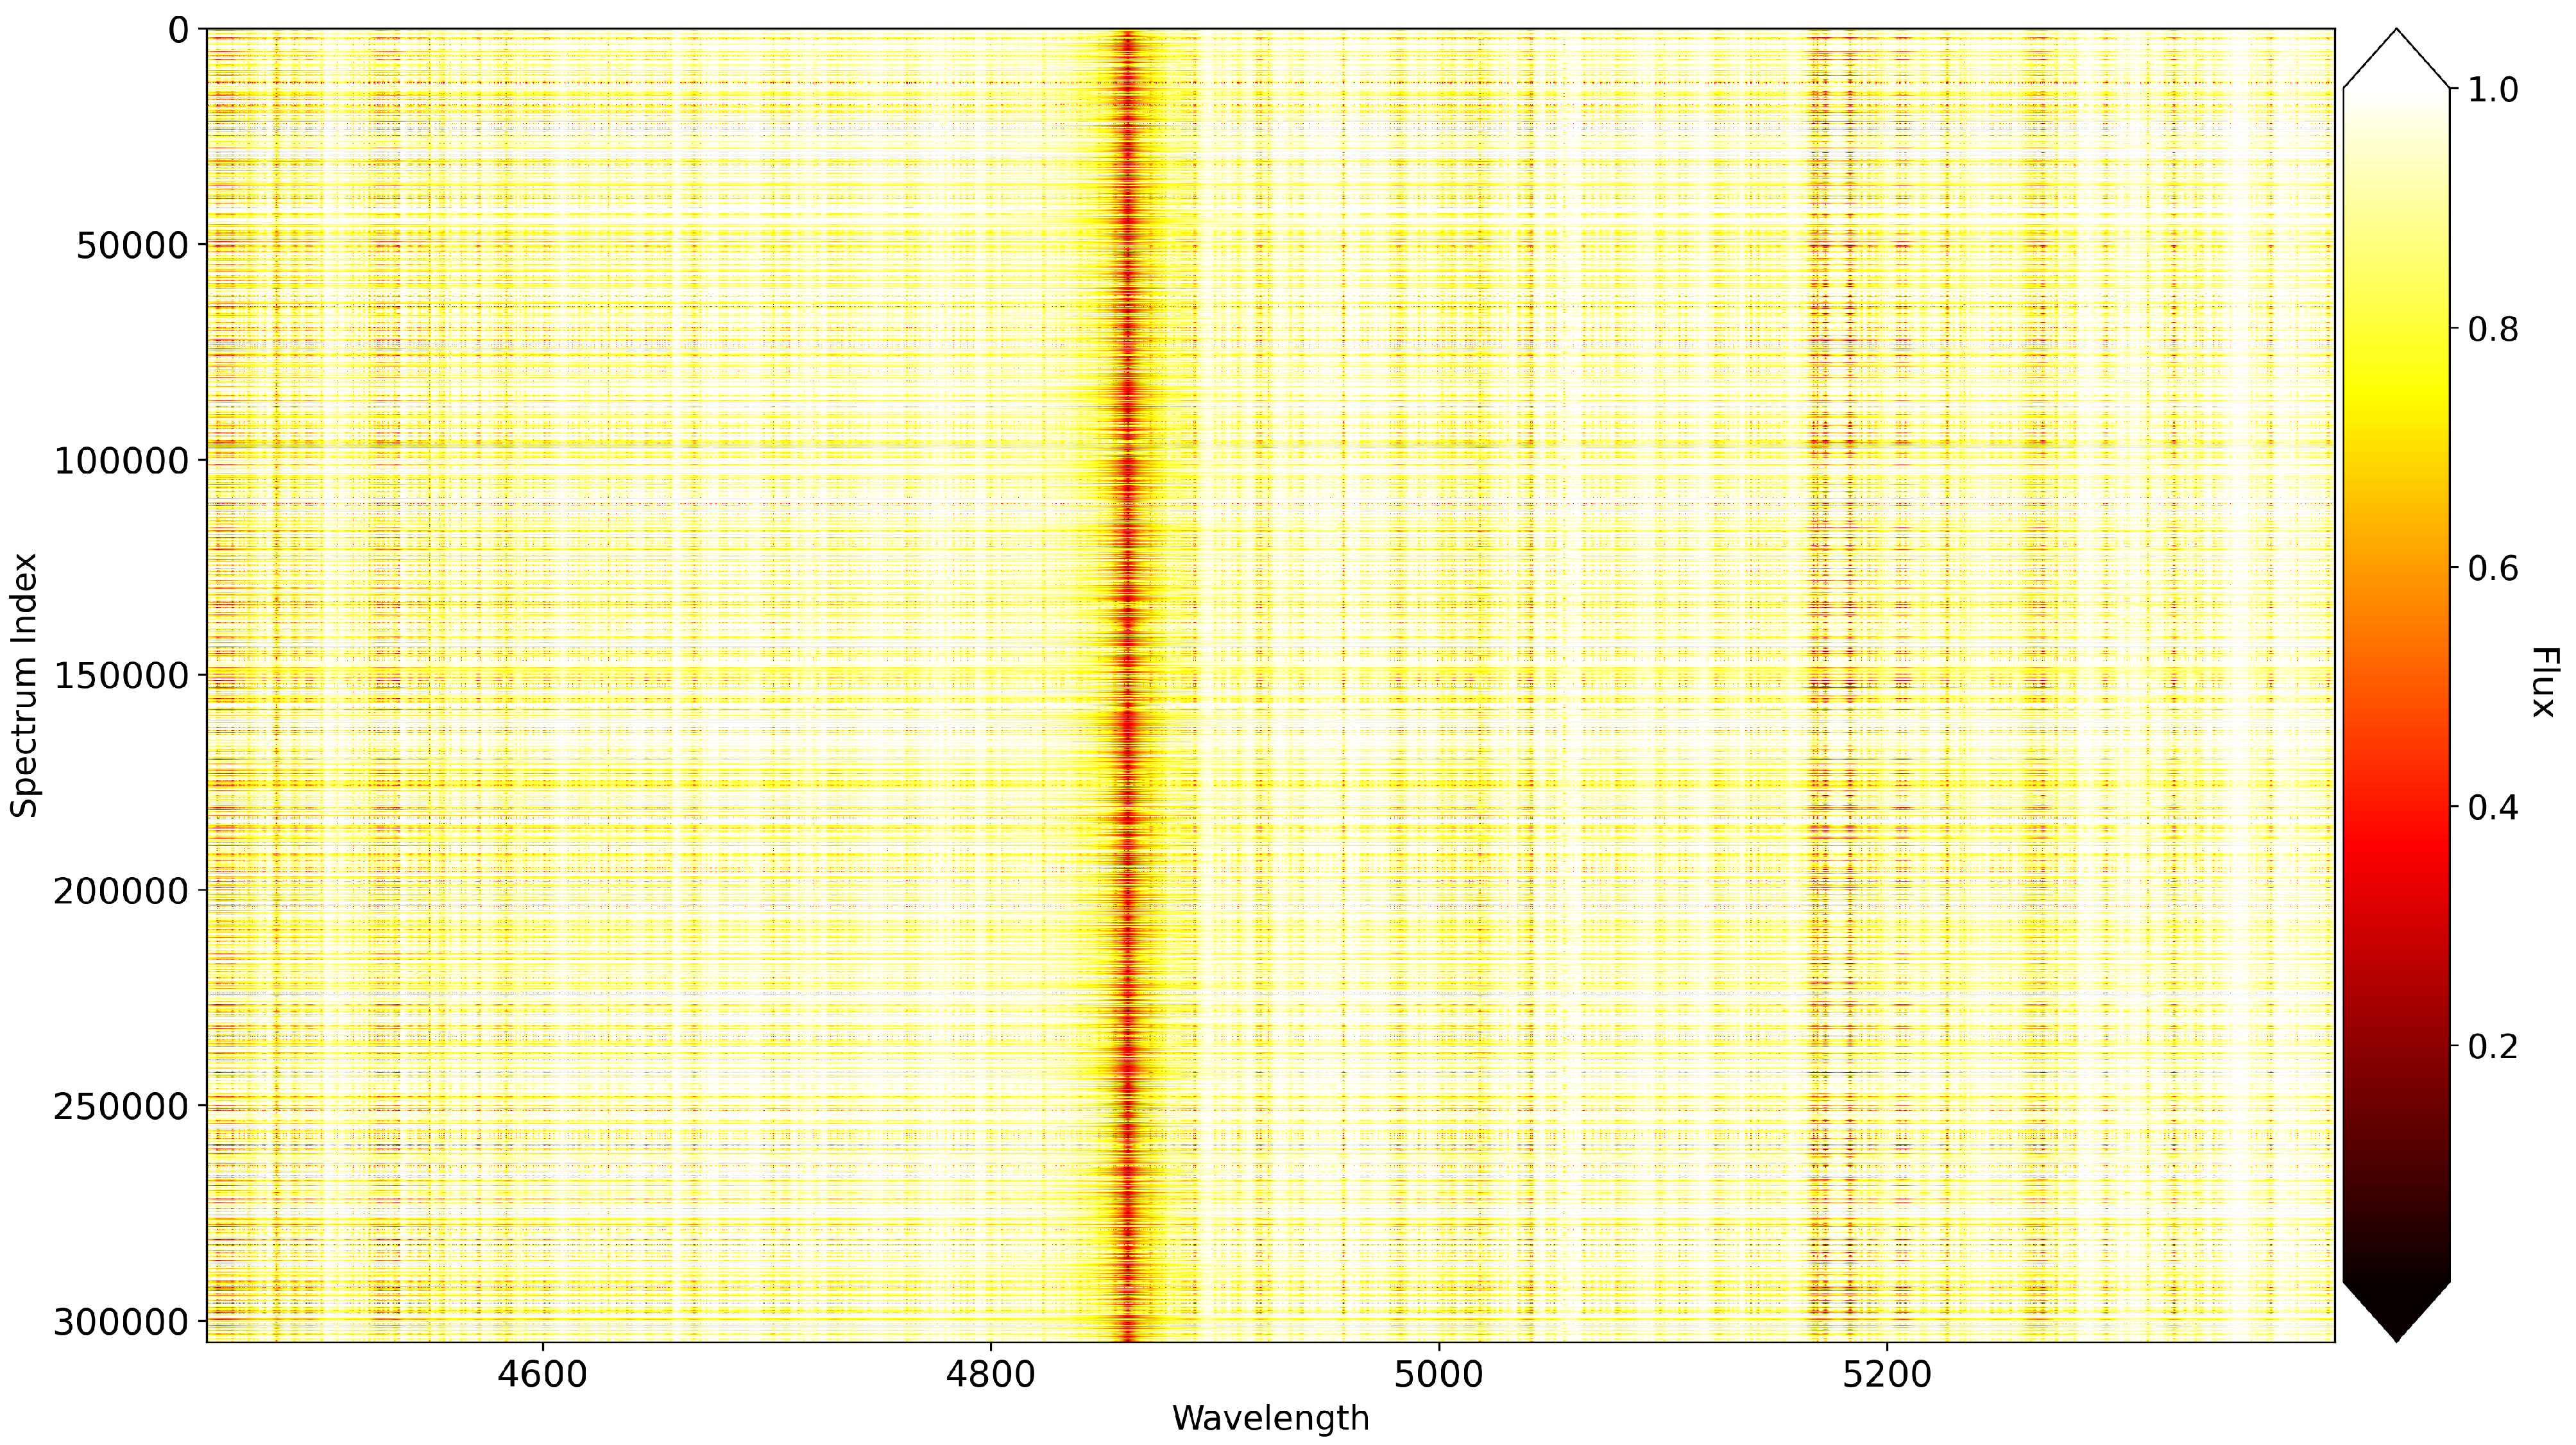
Figure 1. Color map representing the fluxes for our DB. Wavelengths are in Å. There are 19,000 wavelength points for each spectrum.
Astronomy 04 00013 g001
Figure 2. Flowchart of the CVAE used in this work. Boxes labelled E and D are the encoder and decoder; μ and σ are the latent-space mean and variance; z is the 100-dimensional latent vector; c is the 6-element conditioning vector ( T eff , log g , v e sin i , [ M / H ] , ξ t , Resolution). x is the input spectrum and x ^ is the output spectrum. The flowchart is inspired by a similar chart in [24].
Astronomy 04 00013 g002
Figure 3. Generated spectra (red) compared to the ones calculated using SYNSPEC (blue) having the same combination of stellar parameters and resolution. Each spectrum has a different combination of stellar parameters T eff , log g , v e sin i , [ M / H ] , ξ t , and resolution.
Astronomy 04 00013 g003
Figure 4. Predicted stellar parameters as a function of the actual ones for the training, validation, test, and generated datasets for T eff , log g , v e sin i , [ M / H ] , and Resolution. The scatter around the y = x line is represented quantitatively in Table 3.
Astronomy 04 00013 g004
Figure 5. Mean absolute residual r between CVAE-generated and SYNSPEC spectra across the T eff log g grid. White squares indicate bins with fewer than five test spectra.
Astronomy 04 00013 g005
Figure 6. Binned mean absolute residual | Δ F | (points) and 1 σ scatter (error bars) as a function of T eff , log g , v e sin i , [ M / H ] , and ξ t . No significant trend is observed in any parameter, corroborating the two–dimensional analysis of Section 4.2.
Astronomy 04 00013 g006
Table 1. Range of parameters used in the calculation of synthetic spectra. The upper part of the table includes astrophysical parameters of the stars, while the lower part includes instrumental parameters. All these spectra were calculated in a wavelength range of 4450–5400 Å.
ParameterRange
T eff 4000–11,000 K
log g 2.0–5.0 dex
v e sin i 0–300 km/s
[ M / H ] −1.5–1.5 dex
ξ t 0–4 km/s
Resolution ( λ Δ λ )1000–115,000
Table 2. Architecture of the Fully Connected Neural Network used to relate the 25 PCA coefficients to the 6 stellar and instrumental parameters.
LayerCharacteristicsActivation Function
InputPCA coefficient (25 data points per spectrum)-
Hidden5000 neuronsReLU
Hidden2000 neuronsReLU
Hidden1000 neuronsReLU
Hidden64 neuronsReLU
OutputStellar Parameters (6 data points per spectrum)-
Table 3. Derived accuracies of the stellar parameters for the training, validation, test, and generated database. These values are the MSE between the original and the derived stellar and instrumental parameters.
ParameterTrainingValidationTestGenerated
T eff (K)30456065
log g (dex)0.040.040.040.04
v e sin i (km/s)3.05.16.26.1
[ M / H ] (dex)0.0300.0350.0290.030
ξ t (km/s)0.080.100.080.09
Disclaimer/Publisher’s Note: The statements, opinions and data contained in all publications are solely those of the individual author(s) and contributor(s) and not of MDPI and/or the editor(s). MDPI and/or the editor(s) disclaim responsibility for any injury to people or property resulting from any ideas, methods, instructions or products referred to in the content.