Abstract
Liquid fossil fuel is anticipated to run out by the mid-2060s. The destruction of land, water, and air due to fossil fuel use contributes to environmental degradation. Policymakers, scientists, and researchers are looking into power generation from renewable sources, such as wind and solar energy, because of the threat of climate change owing to global warming brought on by greenhouse gas emissions. Although there have been substantial advancements in the use of large-scale wind turbines for power generation, small-scale wind turbines, which have the potential for solo power generation, have not received wider acceptance yet due to their lower-than-expected power generation performance. This study’s main goal is to analyse the limitations of harnessing wind energy by small-scale wind turbines for power generation in built-up areas for residential and commercial uses. The study focuses on the difficulties and potential of generating electric power from small wind turbines in urban settings. The state of wind characteristics in built-up areas, economic viability, aerodynamic limitations, and governmental regulations for small-scale wind turbines are also discussed.
1. Introduction
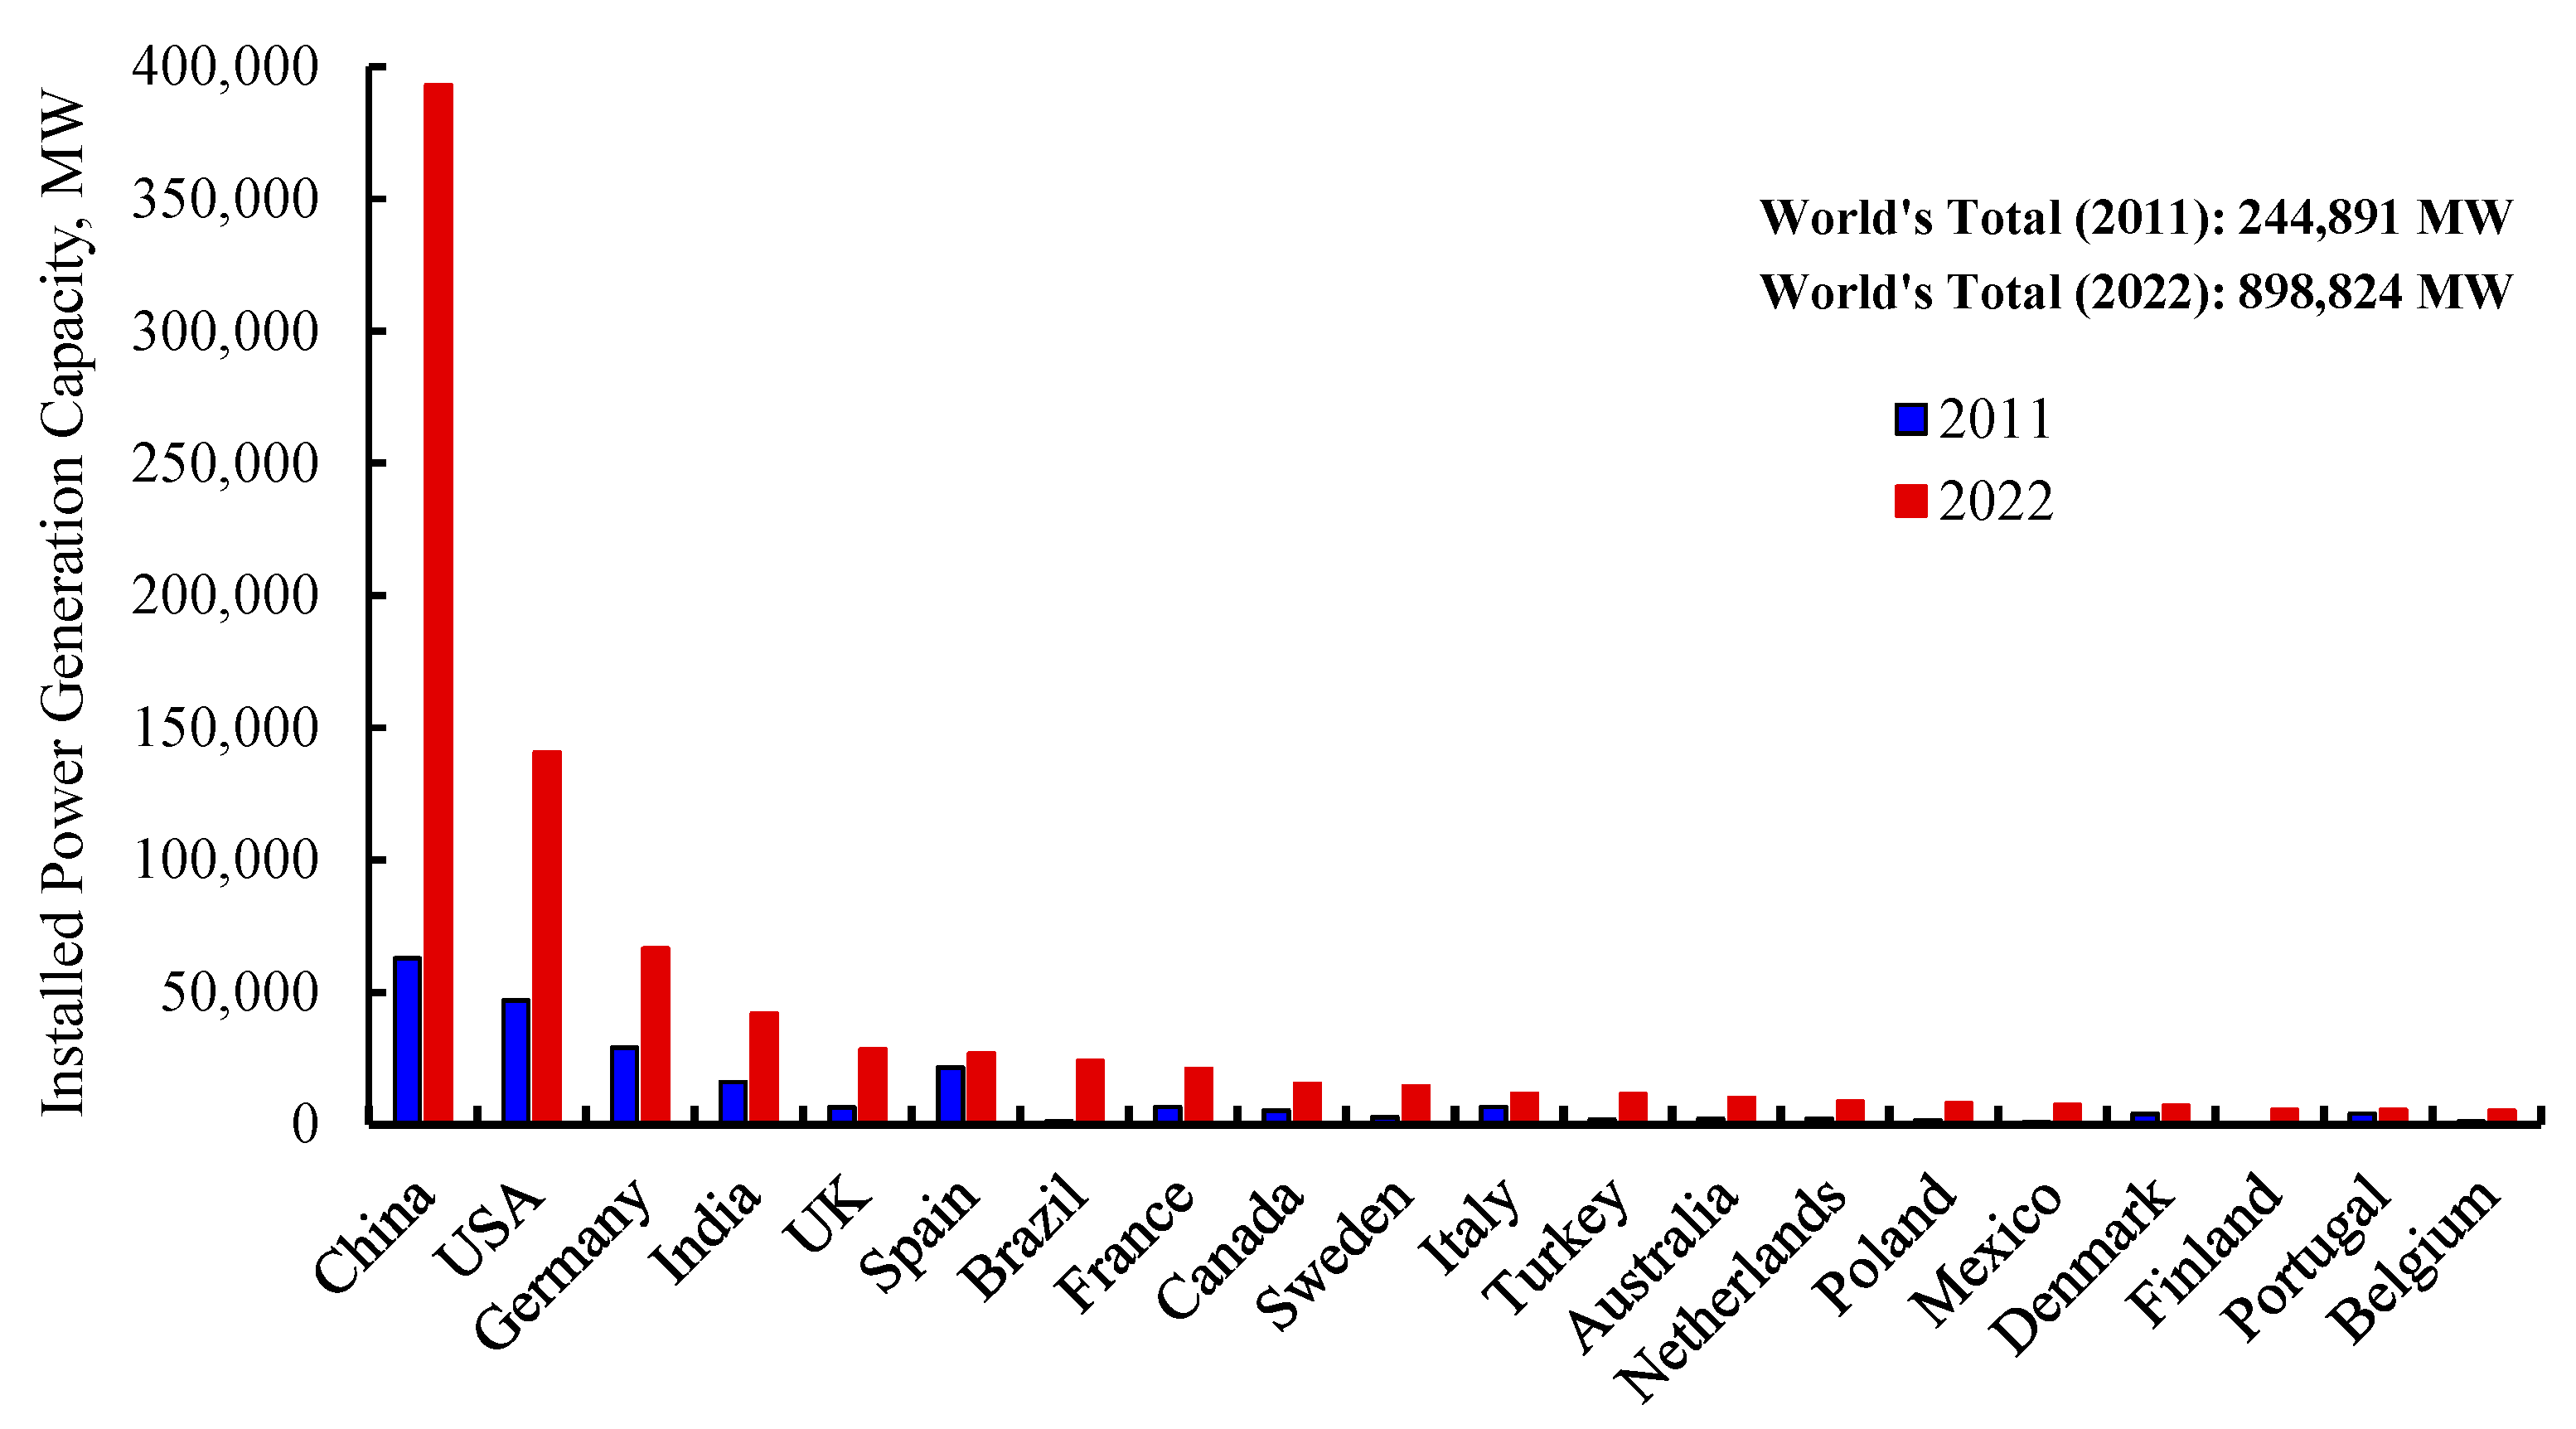
The global energy policy is heavily influenced by the dwindling supply of fossil fuels, the unpredictability of international energy markets, and the growing concerns posed by climate change due to greenhouse gas emissions [1,2,3,4]. Despite global power generation still being dominated by fossil fuels (36% coal, 22.2% natural gas, and 3% other fossil fuels), hydropower (15.2%), and nuclear energy (9.2%), renewable energy (7.5% wind, 4.3% solar, 2.2% bioenergy, and 0.4% other renewables) is slowly but steadily contributing more to the global power generation mix [5]. Among all renewable energy, wind is the most dominating and commercially competitive at present. The operating efficiency of wind power has significantly increased during the past ten years, particularly for big commercial wind turbines (>1 MW), making it more economically competitive than other power generation types. Wind energy is abundant, renewable, available everywhere on Earth (land and sea), clean, emits no greenhouse gases while being used, and occupies little land [2,4,5,6]. Environmental impacts are typically less detrimental than those from other energy sources. By December 2022, the world’s wind power generation had increased from 2.5% in 2010 to 899 GW, or 7.5% of total power generation. The overall cost of power generation per unit has decreased to levels that are comparable to those of conventional fossil fuels (coal and natural gas) thanks to technological advancements and a better understanding of wind characteristics [7,8,9]. The world’s top ten countries that generate power from the wind are shown in Figure 1 [10]. China is by far dominating the world, producing nearly 44% of the global wind power, followed by the USA (~16%), Germany (7.4%), India (~5%), and others. However, the utilisation of wind resources for the power generation in emerging and developing nations (except India) is still significantly lagging due to financial and technological constraints and lack of local wind resource mapping.
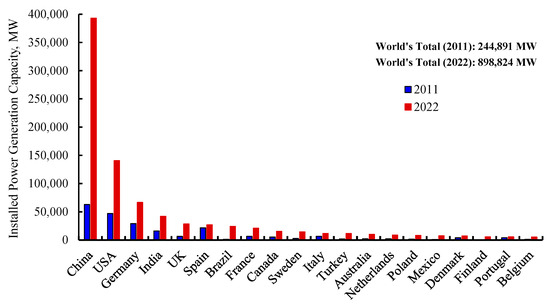
Figure 1.
The top 15 countries’ installed wind power generation capacity in 2022 and 2011.
At present most, wind power is generated through commercial wind turbines. Turbines are generally classified into three groups: small, intermediate, and large. Small wind turbines, usually with a power of less than 10 kW, are used for built-up residential, commercial, agricultural, and remote applications. The intermediate wind turbines, with powers between 10 and 250 kW, are ideal for village electric power, hybrid systems, and distributed power. Turbines with over 250 kW are designed to be large and used for commercial power generation. Most commercial wind turbines are generally in the 2–3 MW range. In 2021, the largest wind turbine in the world was Vestas “V236-15.0 MW”. Its three 115.5 m blades make a rotor diameter of 236 m and a wind-swept area of 43,743 square m. With a 280 m hub height, it was the world’s tallest wind turbine in 2021 [11]. In 2023, the world’s largest wind turbine was manufactured by CSSC Haizhuang for the Dongying City Offshore Wind Power Industrial Park in Shandong Province, China. The turbine’s rotor is 260 m in diameter, and its blades are 128 m long. Seven football fields’ worth of space (53,000 m2) is covered by the swept area of the H260-18 MW turbine. A single H260-18 MW turbine is expected to produce more than 74 million kWh of electric power annually, sufficient to power nearly 40,000 homes for a year [12].
At present, most commercial wind power (92%) is produced by onshore wind turbines built far from populated areas and offshore shallow-water turbines (8%), which require long-distance power transmission to the nearest load centre (power consumers), creating financial and engineering challenges [13]. Furthermore, the rapid urbanisation due to population growth and economic prosperity in emerging and developing nations in Asia, South America, and Africa is expected to reach over 70% of the global population in urban and suburban areas by 2070, creating the need for increased power consumption [13,14]. Wind-generated power in built-up areas for urban and suburban use can reduce the need for complete dependence on grid-connected power. On the other hand, while shallow-water offshore wind harnessing is still growing, deep-water offshore and urban (and sub-urban) areas remain untapped potential locations for additional wind energy collection for power generation [15]. Despite having immense potential for harnessing urban wind energy for power generation, utility-scale wind turbines’ footprint and penetration are negligible compared to utility-scale solar power generation. The ability of solar panels and wind turbines to convert sunlight into useful electric power determines their efficiency. Only approximately 22% of the solar energy captured by even the most efficient solar panels is converted into electric power. Up to 60% of the wind energy that wind turbines capture can be turned into useful electric power. Solar energy is significantly easier to use, while wind energy is more efficient but more difficult to harness, especially in built-up areas.
Hence, the objective of this article is to highlight the prospects and challenges of harnessing urban wind for power generation using small-scale wind turbines in built-up areas. The rest of this article is divided into the following sections: Section 2 talks about the prospects for small-scale wind turbines; Section 3 discusses small-scale wind turbines and contributing factors that affect their performance; Section 4 analyses several case studies of in situ performance measurements of small-scale wind turbines; Section 5 discusses the current limitations of small-scale wind turbines and their implications for built-up area power generation; and finally, the main conclusions and suggestions are enumerated in Section 6.
2. Prospects for Small-Scale Wind Turbines
A small-scale wind turbine typically produces power of less than 20,000 kWh annually. Such wind turbines include rotors that are installed on rooftops or free-standing towers and have swept-area diameters ranging from 1 to 9 m, as shown in Figure 2. Small-scale wind turbines are sub-grouped into (a) micro wind turbines, (b) mini wind turbines, and (c) domestic scale wind turbines [16].

Figure 2.
Small wind turbine classification.
- (a)
- Micro wind turbines produce roughly 1000 kWh annually at locations with an average wind speed of 5.5 m/s and have very small swept-area rotor diameters of around 1.5 m or less. In distant locations, they are frequently utilised for low-power purposes such as fence charging, simple illumination, powering sailboats, battery charging, and remote devices such as traffic warning signs.
- (b)
- Mini wind turbines typically produce 1000–2000 kWh per year at sites with wind speeds of around 5.5 m/s and have swept-area rotor diameters of 1.5–2.6 m.
- (c)
- Domestic-scale wind turbines are used for a variety of applications, including residential households, telecommunications, farms, ranches, and small businesses. Domestic-scale wind turbines include swept-area rotors with diameters between 2.7 and 9.0 m and speeds of 5.5 m/s and can produce power between 2000 and 20,000 kWh annually.
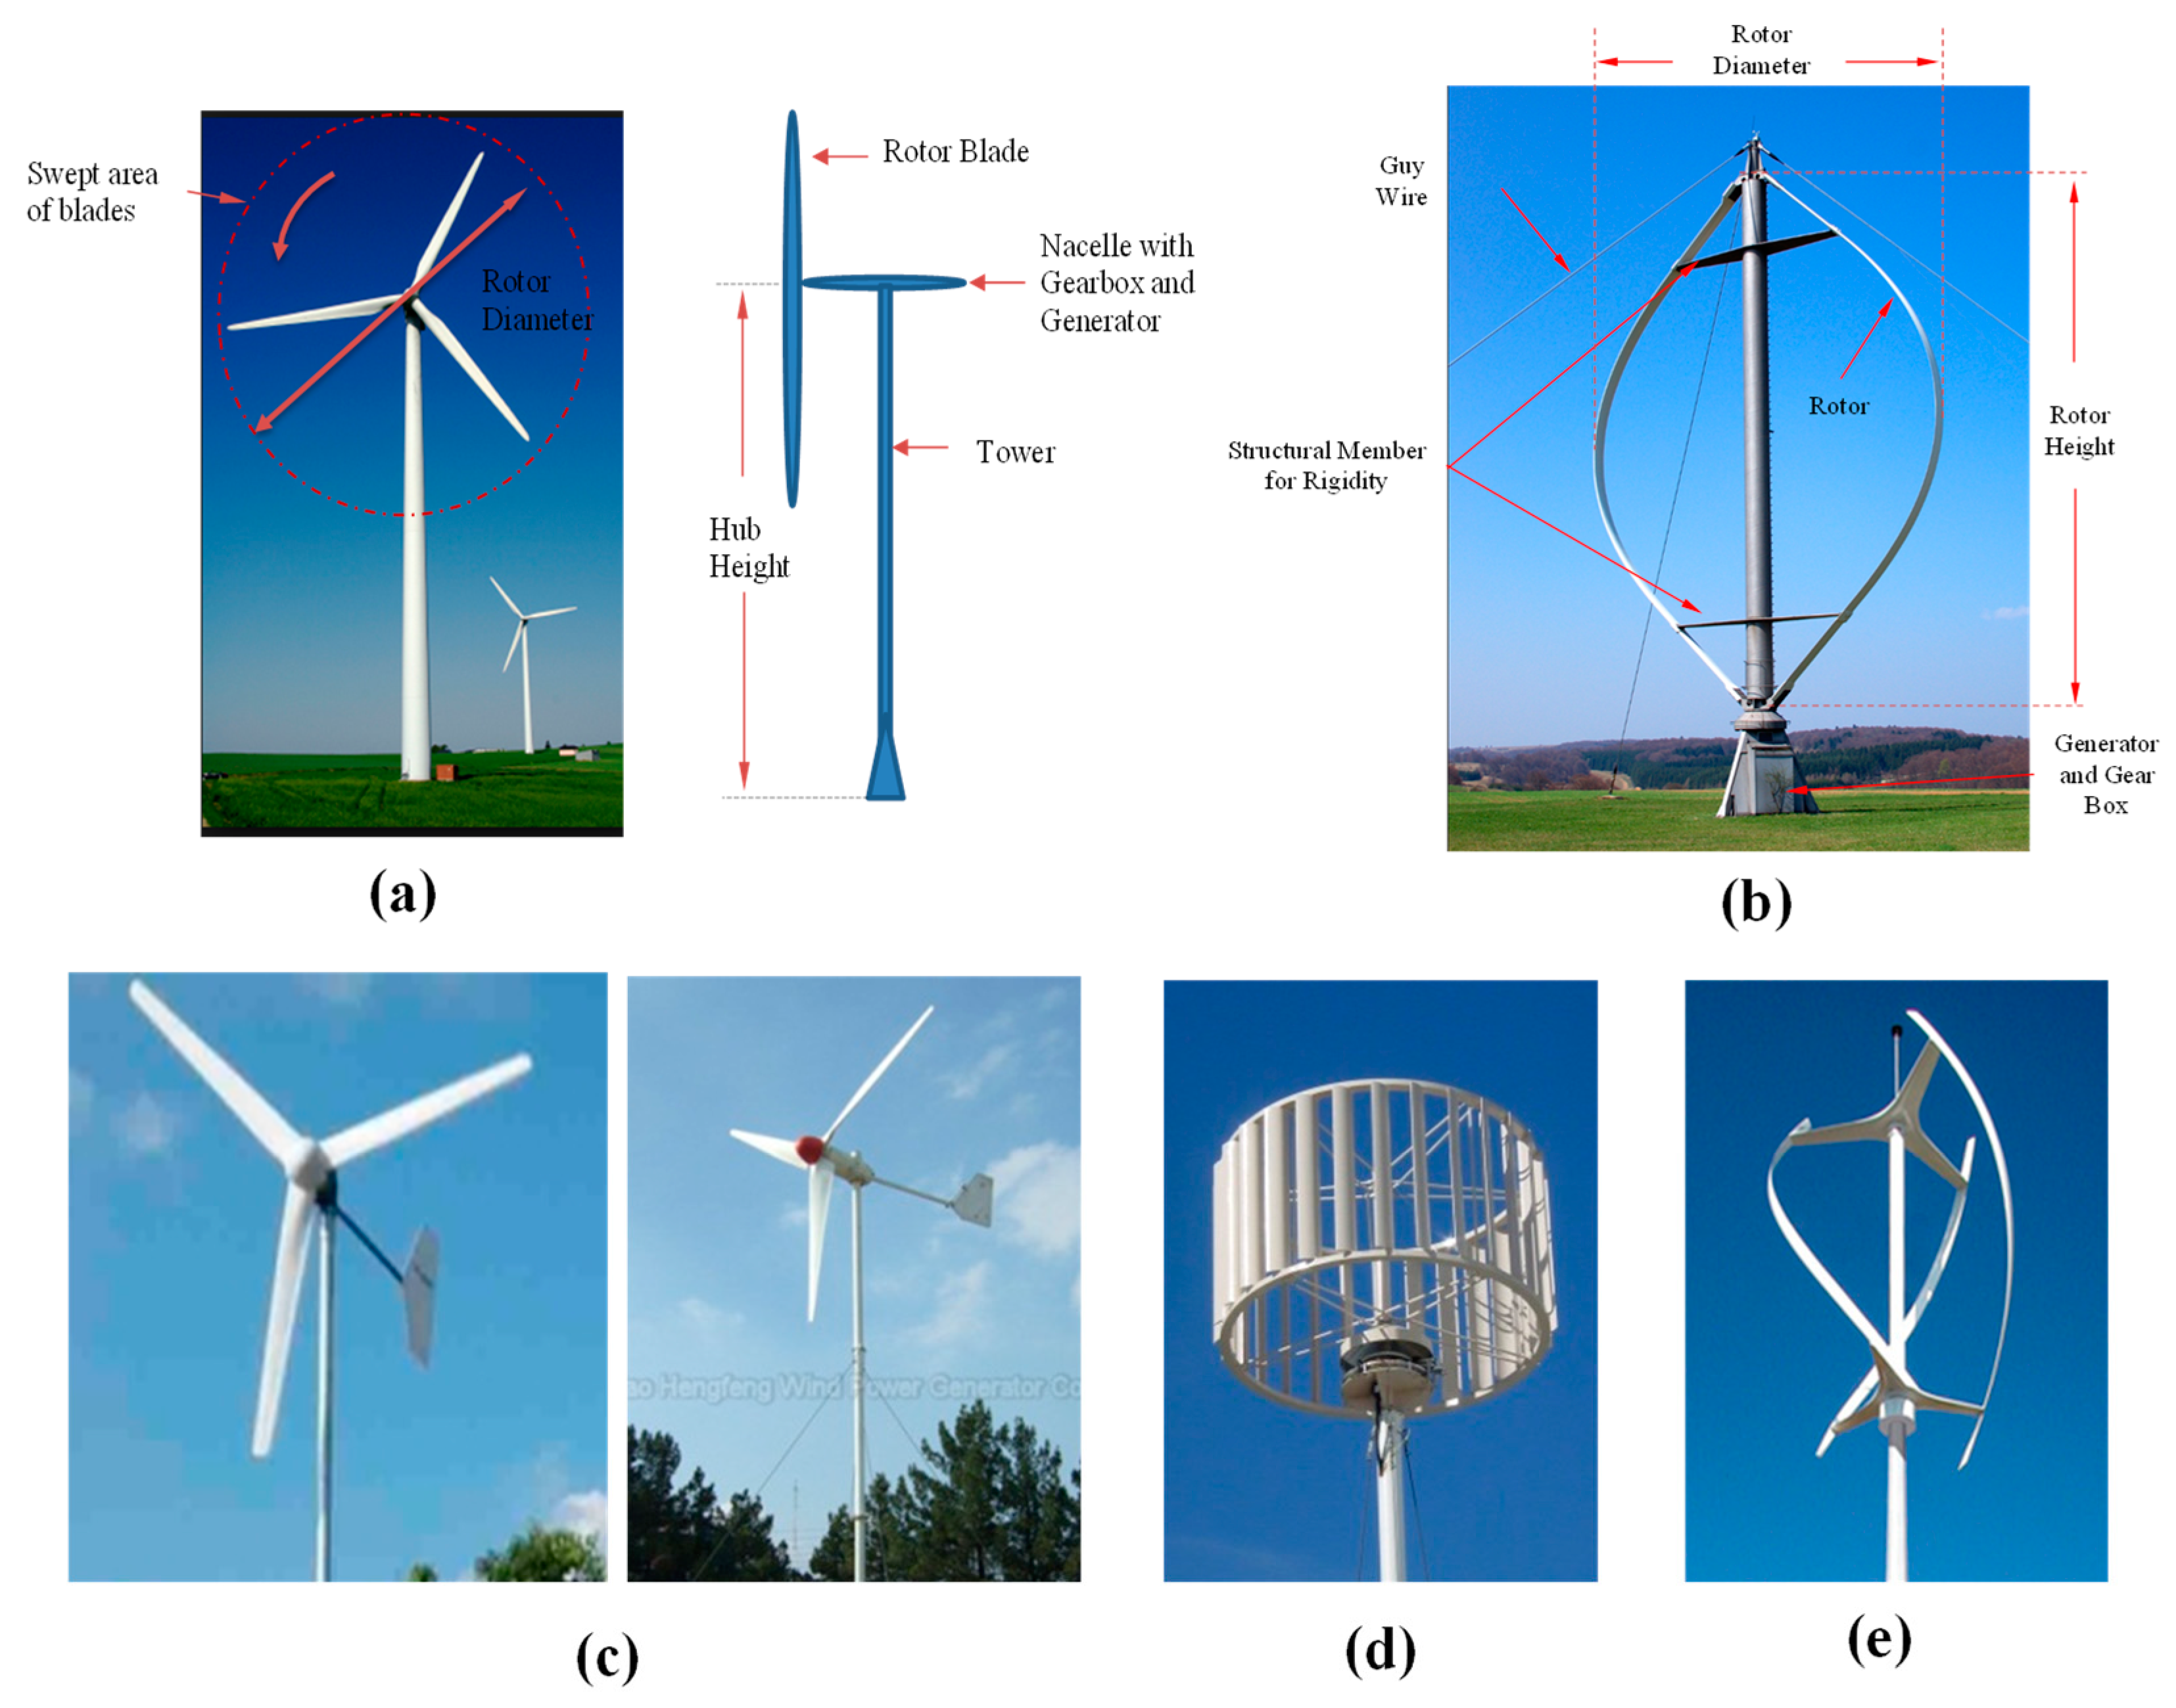
In general, there are two types of wind turbines: horizontal-axis wind turbines (HAWTs) and vertical-axis wind turbines (VAWTs), as shown in Figure 3a,b. The vertical-axis wind turbine (VAWTs) is considered to be better suited in built-up areas than the horizontal-axis wind turbine (HAWT) as VAWTs are relatively quieter than HAWT since they have fewer moving parts and a lower tip-speed ratio. As opposed to HAWTs, which must constantly ‘yaw’ (rotate about the vertical axis) towards the constantly shifting wind direction, VAWTs are less sensitive to shifting wind directions and, consequently, to turbulence. This is a key benefit for the application of VAWTs in urban and constructed environments [6]. However, the efficiency of VAWTs is generally lower than that of HAWTs. Most HAWTs are mast-mounted and mainly situated in rural and unobstructed areas. The other drawbacks of VAWTs are, however, their low efficiency, self-starting abilities, and inability to produce consistently positive torque. Computational and experimental research on various augmentation techniques to enhance the VAWT performance has been reported in the public domain. For the application in built-up areas, various small scale wind turbines are used as shown in Figure 3c–e. A summary of various performance-augmented devices and reported power coefficients for micro-vertical axis wind turbines that can be used in built-up areas is shown in Table 1. Almost all studies on micro-VAWTs are based on computational modelling and/or wind tunnel experimentation in smooth flow. There is scant study of in situ performance for micro-VAWTs in built-up areas for a prolonged duration (one year and over) reported in the open literature. More field studies are needed to understand the effectiveness of various micro-VAWTs with performance-augmented devices for their sustained utilisation in built-up and urban areas.
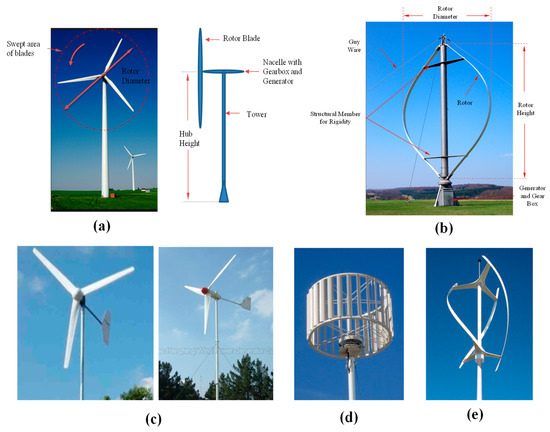
Figure 3.
(a) Horizontal Axis Wind Turbine (HAWT), (b) Vertical Axis Wind Turbine (VAWT), (c) Domestic (small scale) HAWTs, (d) Domestic (small scale) VAWT (Savonius type), (e) Domestic (small scale) VAWT (Darrius type), adapted from [1,17].

Table 1.
Coefficient of performance of various augmented micro-VAWTs, adapted from [18].
In addition to micro-VAWTs with augmenting devices, some studies have shown that the power coefficient of small-scale HAWTs can also be enhanced by using various augmenting devices [61]. As mentioned earlier, the efficacy of such turbines with augmentation devices needs to be evaluated through in situ performance measurement over a prolonged period of time in built-up areas.
The complicated wind characteristics caused by the presence of buildings and structures are one of the challenges for the deployment of small-scale wind turbines in urban and suburban areas. The atmospheric wind is very turbulent in built-up areas near the ground, and this is especially intense close to structures and buildings. Significant amplitude variations and considerable directional unpredictability are both characteristics of turbulent flow.
Reports that are publicly available in the open literature indicate that small-scale wind turbines, regardless of their type (HAWTs or VAWTs), do not perform well in built-up areas due to complex wind conditions and proximity to the ground. Furthermore, most small-scale wind turbines are developed by wind energy enthusiasts and small businesses, who typically lack the financial and technological resources to conduct comprehensive research (computational, laboratory, experimental, and in situ measurements) for customised wind turbine design to achieve better efficiency in built-up and urban areas [1]. According to a study undertaken by the Alternative Technology Association of Australia (ATAA), there is a significant difference between actual power generation and predicted power generation capacity in situ for domestic-scale HAWTs [1,6,62,63]. This is thought to be primarily because local wind characteristics in urban environments are overestimated, according to the study. Figure 3c–e display some widely used VAWTs and HAWTs in built-up areas.
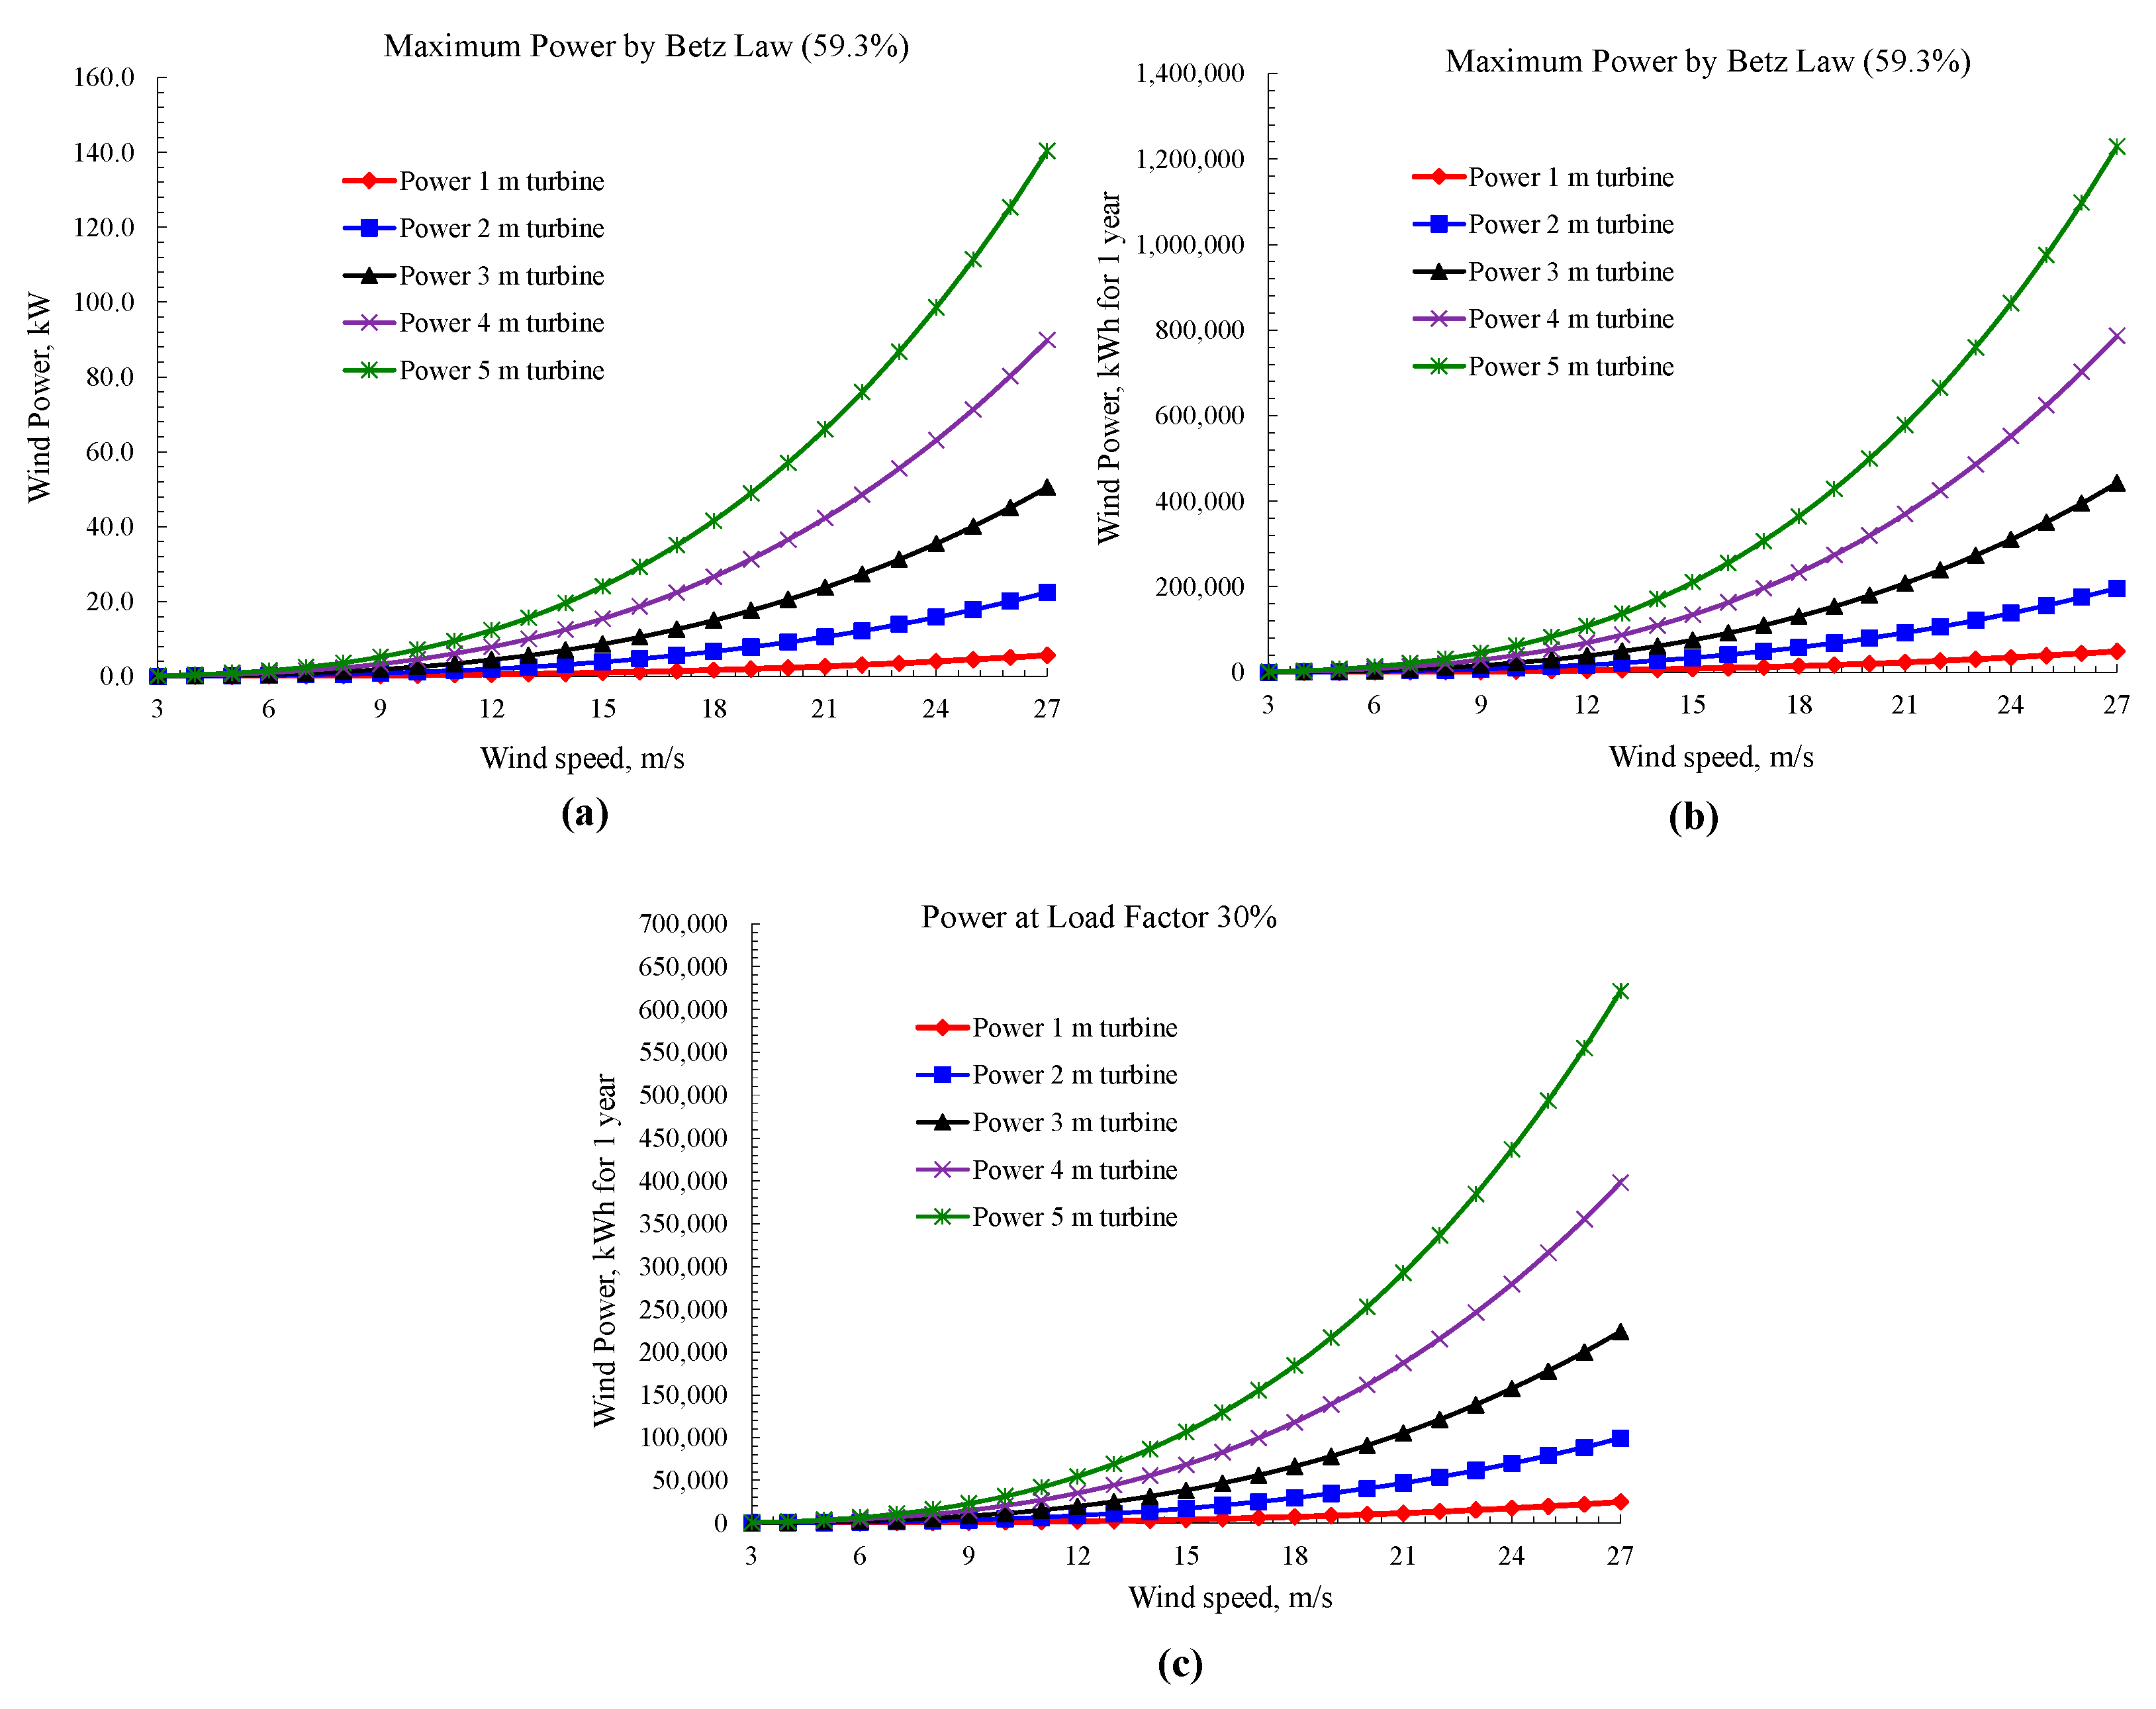
At present, the power curves of small-scale wind turbines are far from matching the wind’s potential power. While subsequent advancements in wind turbine technology may boost efficiency and close this gap, they will never bring it above the theoretical number (59.3%) predicted by German physicist Albert Betz in 1919. The turbine diameter and the available wind regime in built-up areas are the factors that determine the power-generating capacity. The power-generating capacity increases cubically with an increase in turbine diameter, as shown in Equation (1).
Here, P—aerodynamic power, CP—power coefficient (maximum value is 0.593 by Betz limit), A—turbine swipe area, ρ—air density, and v—wind speed.
Figure 4 indicates the maximum theoretical wind power generation possibility using small-scale wind turbines, with diameters ranging from 1 m to 5 m for wind speeds from 3 m/s to 27 m/s. The figure also shows hourly (Figure 4a), yearly (Figure 4b), and yearly with 30% load factor (Figure 4c) theoretical power generation capability, although the load factor in built-up areas mostly ranges from 10% to 30%. The load factor or power coefficient for small wind turbines ranges from 0.1 to 0.3 at wind speeds between 10 m/s and 12 m/s.
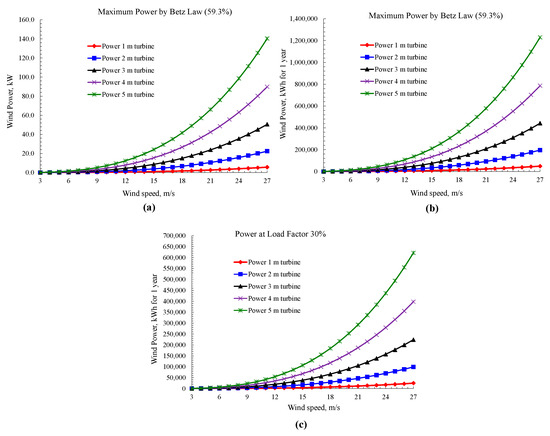
Figure 4.
Wind power extraction by turbines as a function of wind speeds and rotor diameters: (a) Maximum hourly power output by Betz Law, (b) Maximum yearly power output by Betz Law, (c) Maximum yearly power output with 30% load factor.
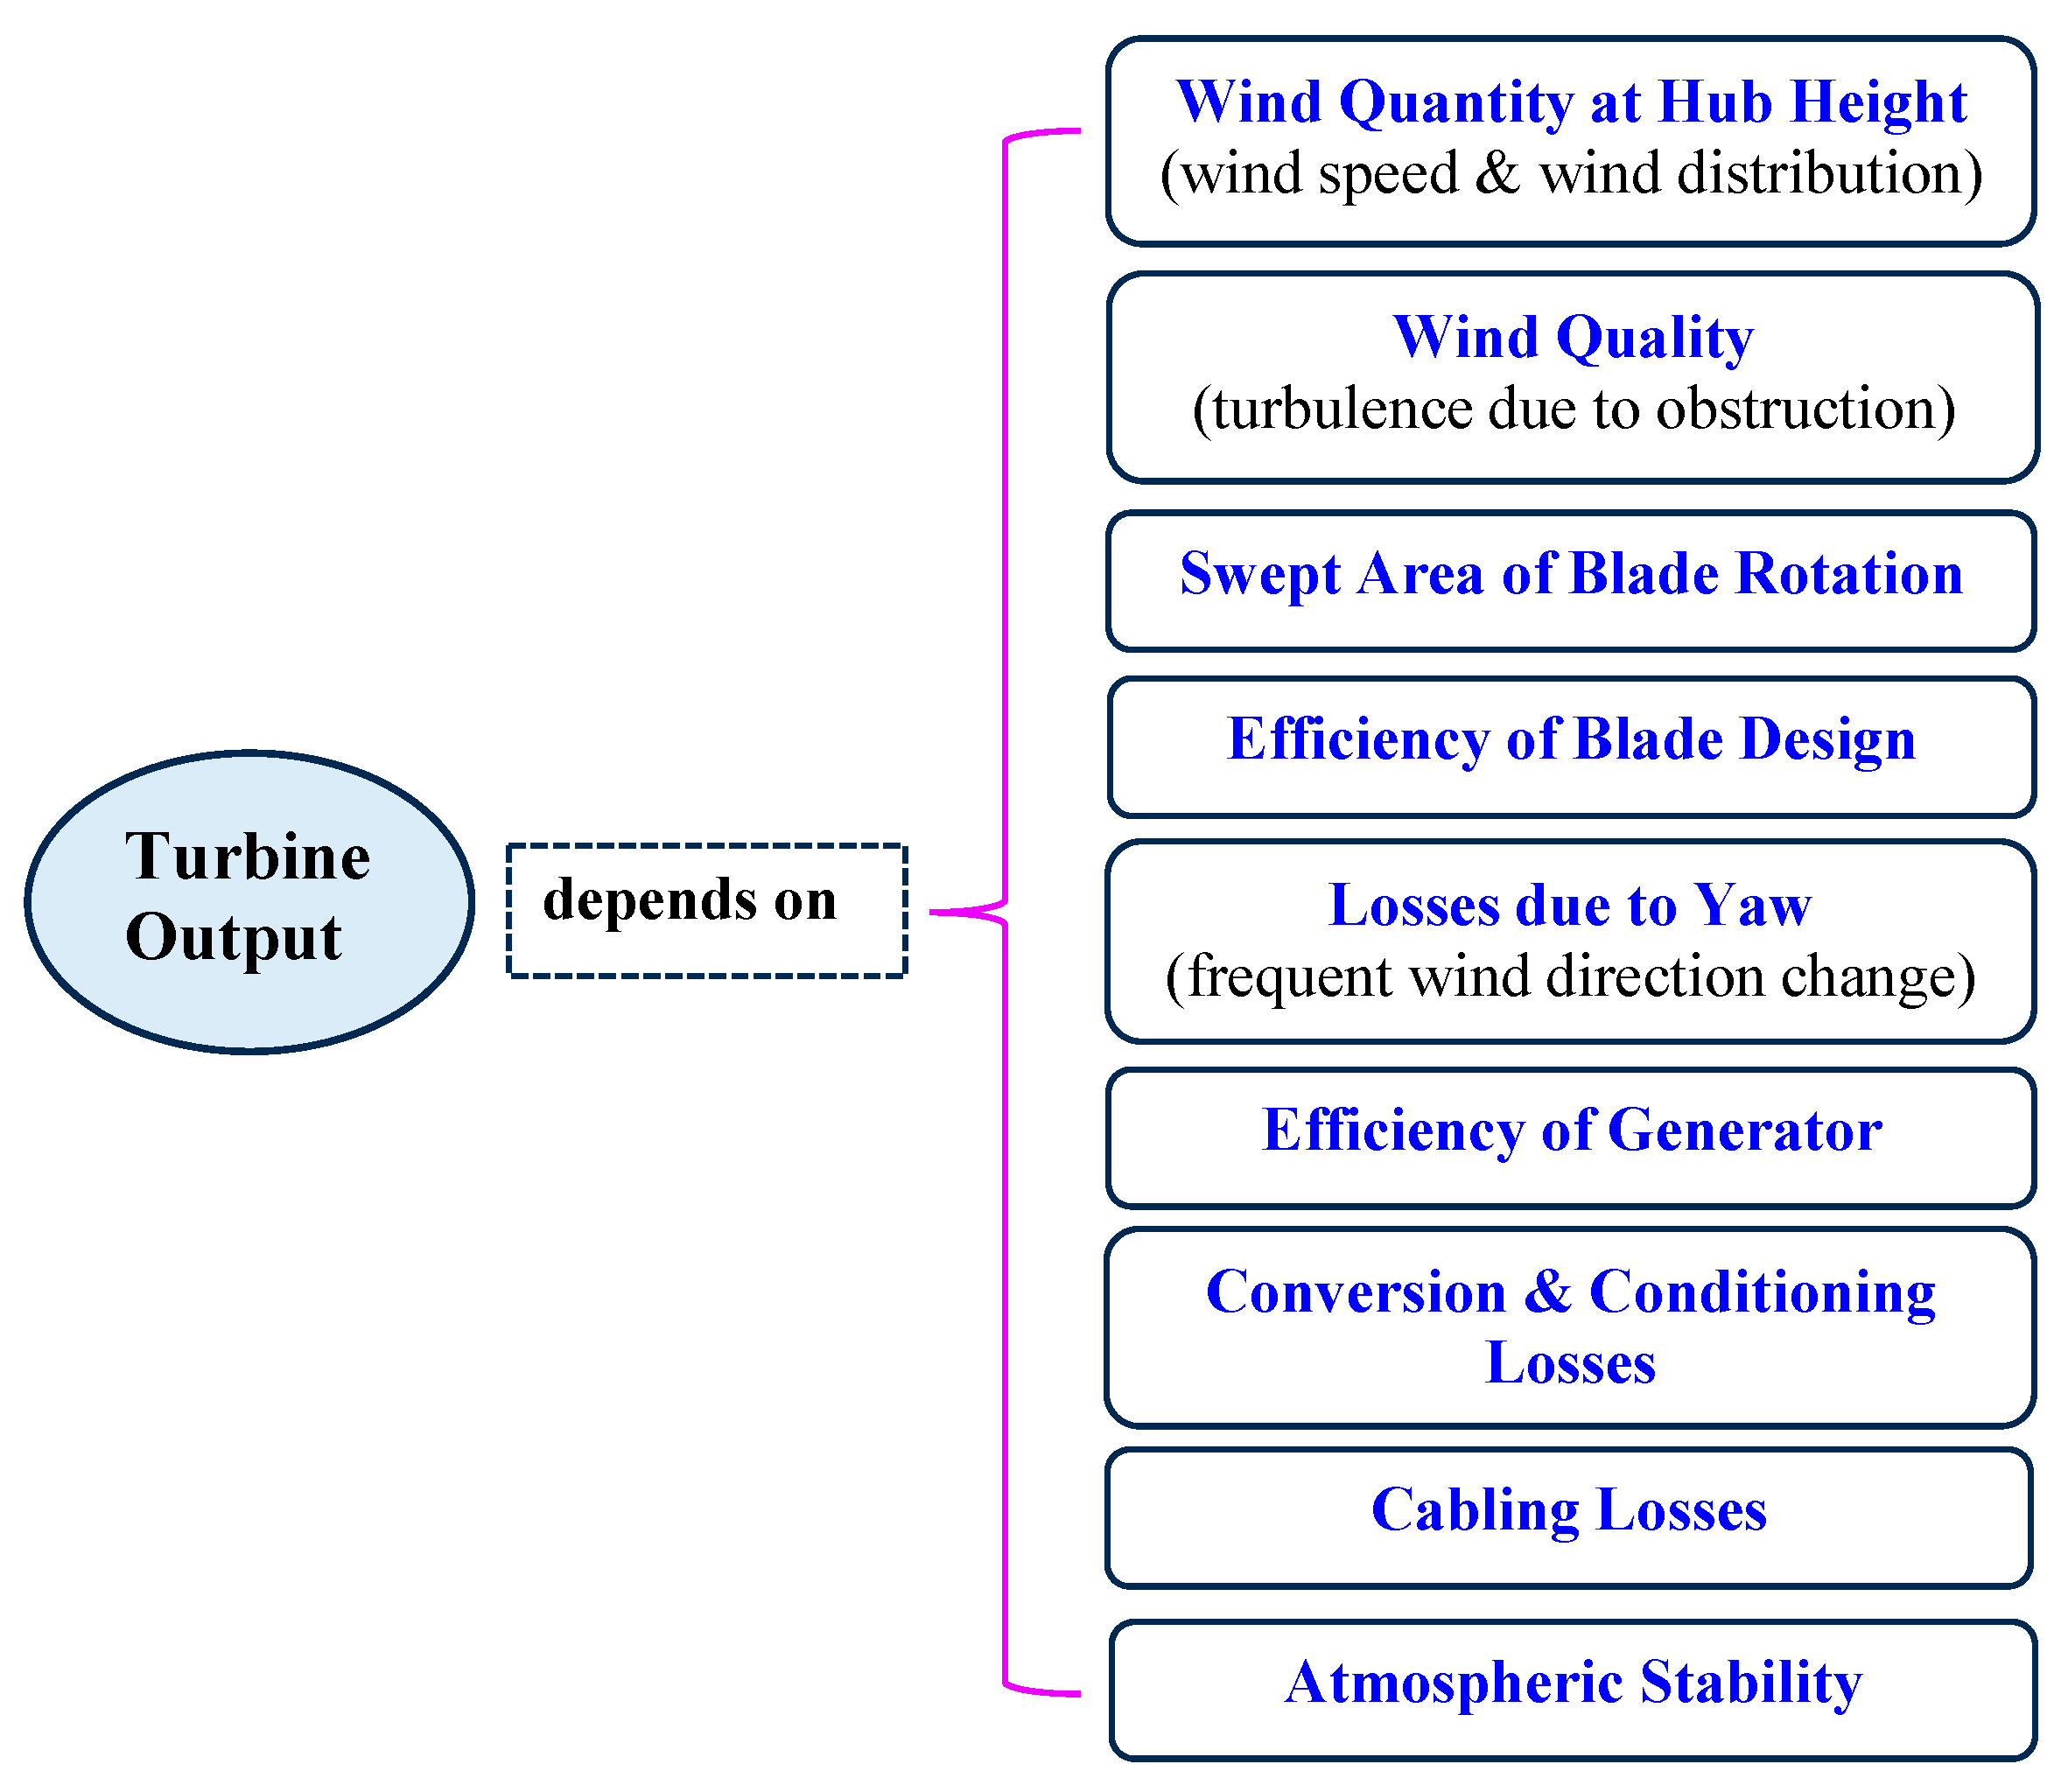
The wind turbine’s output depends on a variety of factors (including wind quantity at hub height), such as wind speed, distribution frequency, wind quality (which includes the turbulence created by various obstructions that lowers wind quality significantly), swept-area of blade (especially the rotor diameter), power losses due to crosswind effects (frequent wind direction-change allows less power generation), the efficiency of the generator, power conversion efficiency, atmospheric stability, and other factors, as shown in Figure 5 [64]. There are other factors that also significantly affect the turbine efficiency and overall power output, some of which are highlighted in Section 3.
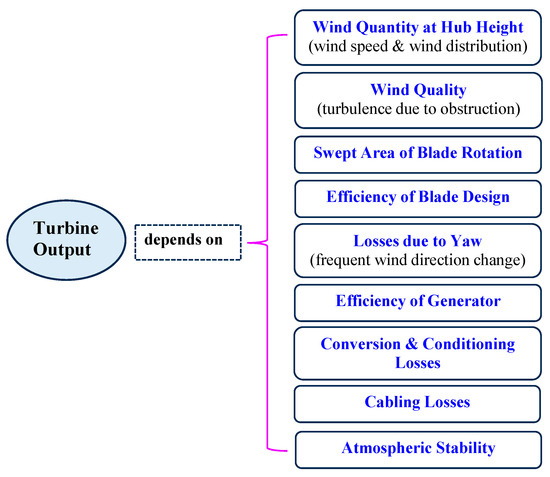
Figure 5.
Factors affecting turbine output.
3. Small-Scale Wind Turbines: Contributing Factors
3.1. Urban Wind Characteristics
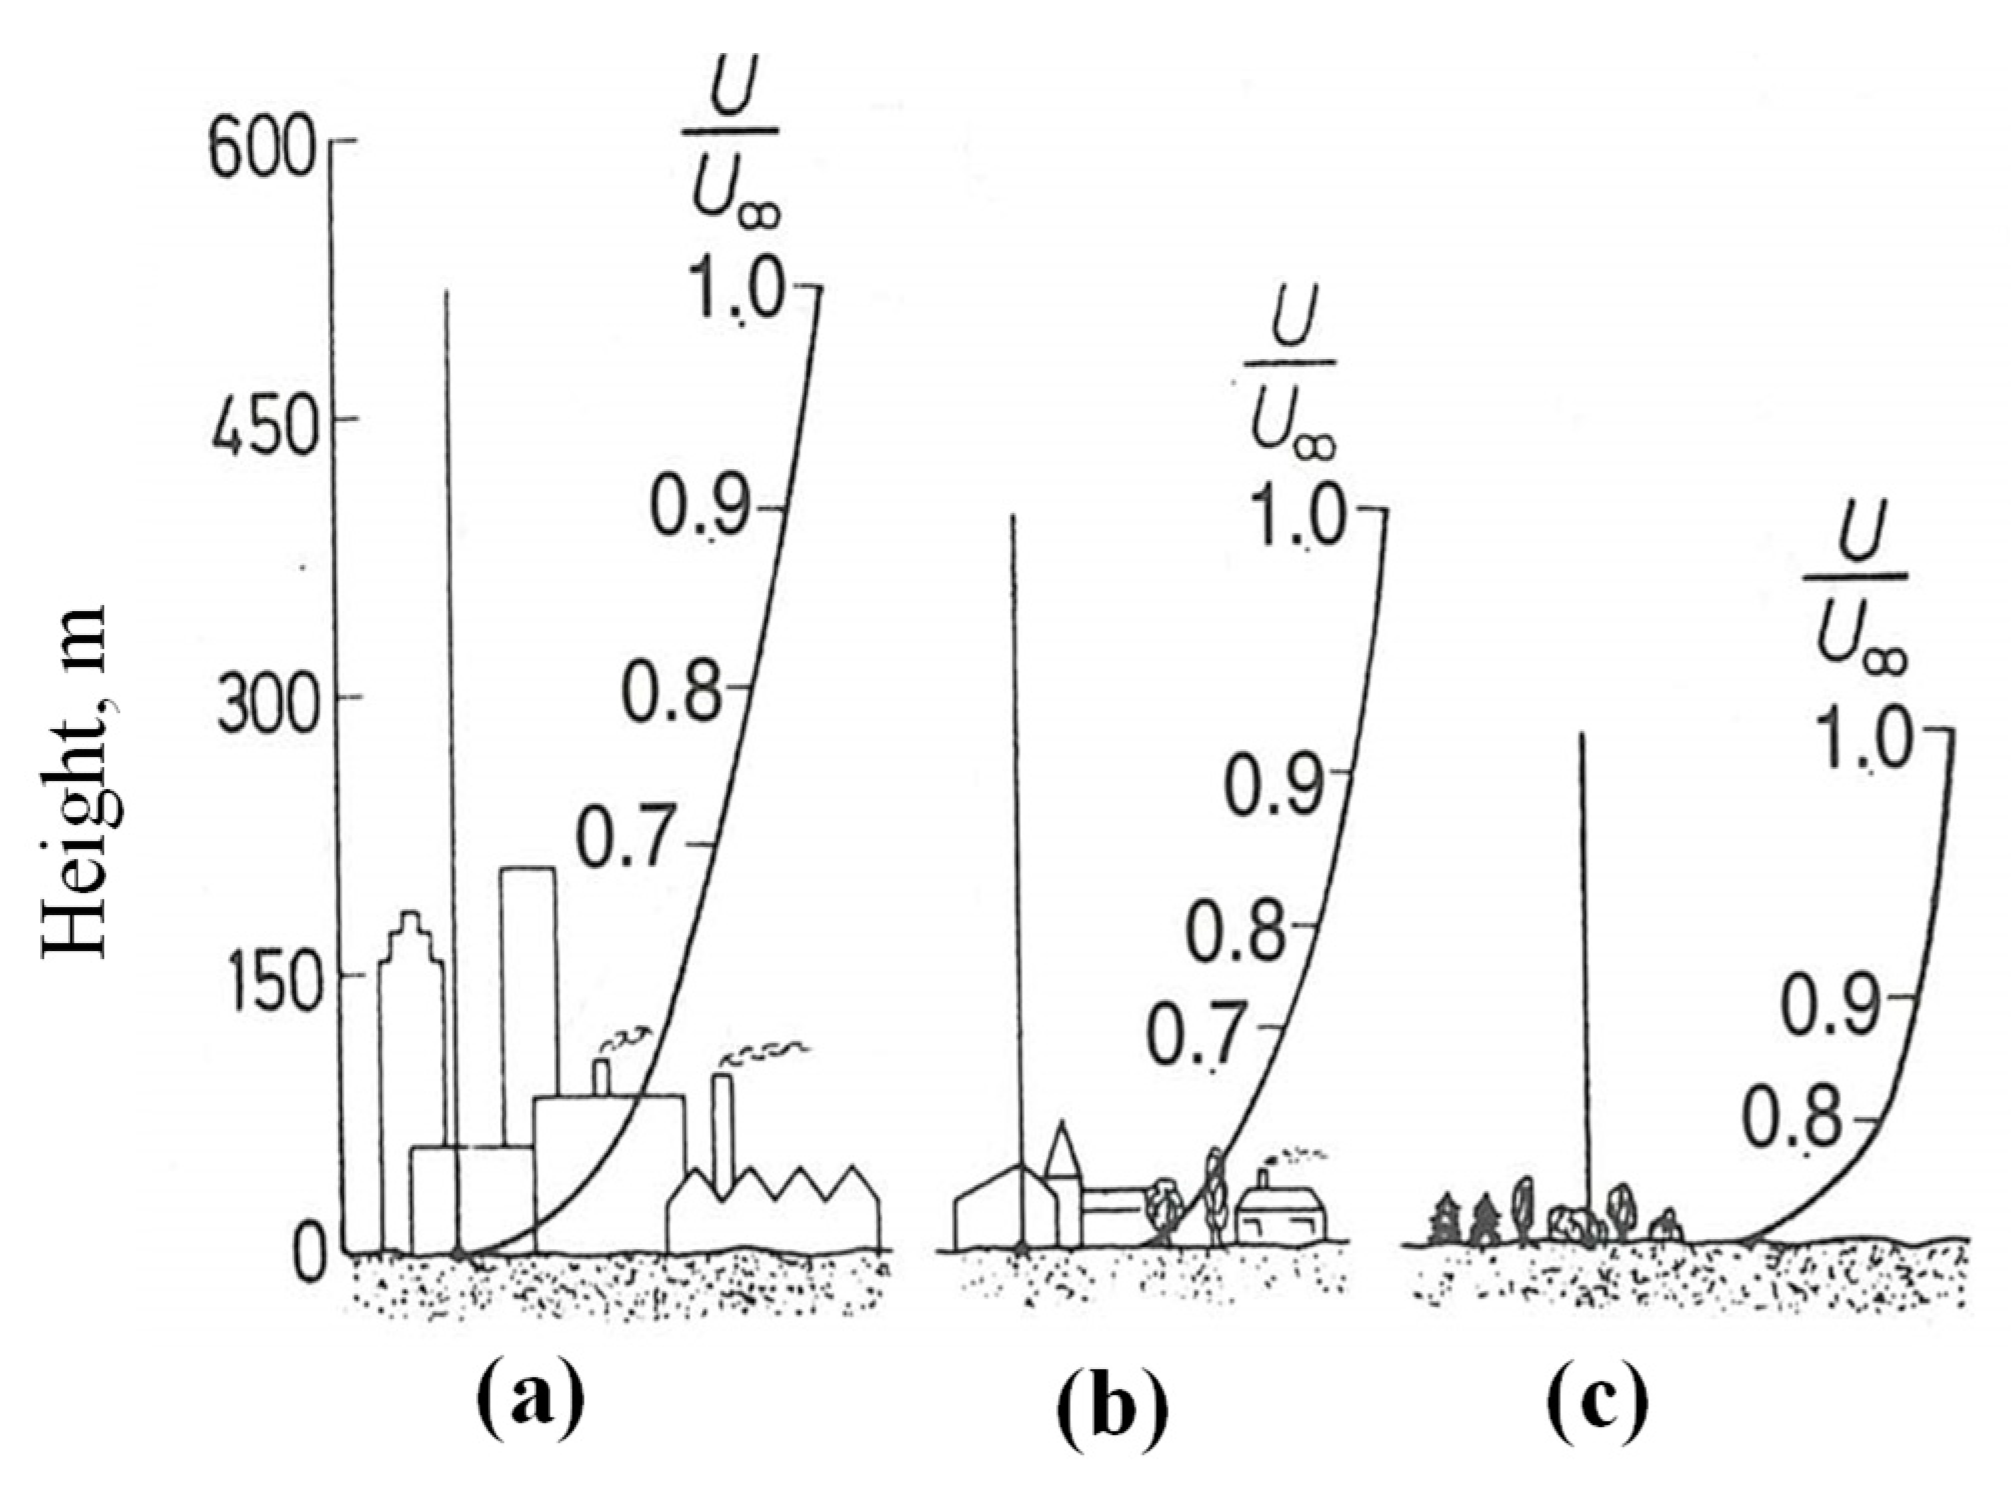
The geographic location, time of day, season, height above the Earth’s surface, weather, and local landforms all affect wind. Understanding wind characteristics will aid in developing wind measuring tools, choosing turbine installation sites, and optimising wind turbine design [65,66]. One of the most important factors in the production of wind power is wind speed. Due to variables like geomorphology and weather, wind speed fluctuates throughout both time and space. Since wind speed is a random characteristic, statistical approaches are typically used to handle measured wind speed data [67,68]. A representative of the complex atmospheric boundary layer is shown in Figure 6.
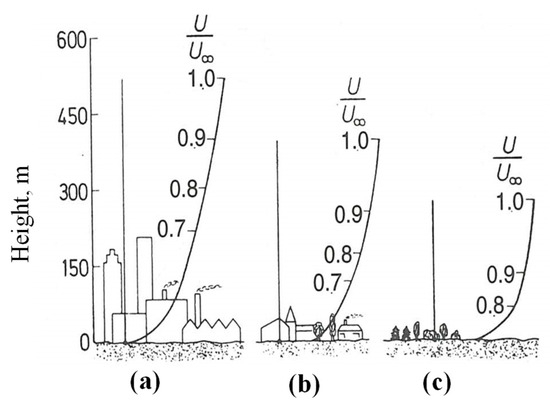
Figure 6.
Natural wind boundary layers over ground of various roughness: (a) Built-up area, (b) Residential area, (c) Rural area.
The Weibull distribution function, which shows the likelihood of various mean wind speeds occurring at the site over time, can be used to characterise the variance in wind speed at a specific location. Another crucial factor that significantly affects the power output fluctuations of wind turbines is wind turbulence. The expected turbine life may be shortened, or the turbine may break because of high turbulence producing significant dynamic fatigue loads operating on the turbine. The turbulence intensity is the ratio of the standard deviation of fluctuating wind speeds to the mean wind speed. Wind blasts with a sharp rise in wind speed over a brief period of time are referred to as wind gustiness. Wind gusts generate dynamic loads on the tower and the turbines, which may result in vibration and resonance in some turbine parts. Predictions of wind gusts are particularly desirable to enable the secure operation of wind turbines. In addition to wind speed, wind direction is a crucial factor. The location and configuration of turbines heavily rely on statistical data on wind directions over a lengthy period. The wind rose diagram is a useful tool for examining wind statistics that are related to wind directions at a specific location over a specific time period (year, season, month, week, day, etc.). The circular wind rose diagram (developed based on wind statistical data) illustrates the relative frequency of the eight or sixteen main directions of the wind. Wind speed information may be included in some wind rose graphics [65]. When wind speed rises with height above the earth, wind shear occurs. The Hellmann power equation, which compares wind speeds at two distinct heights, can be used to quantify the effect of height on wind speed, which is mostly caused by roughness on the earth’s surface. The wind speed at the hub height has a significant impact on the power output of wind turbines. In order to capture more wind energy and reduce the cost per unit of power generation, commercial wind turbines are constructed at heights greater than 80 m.
As mentioned earlier, compared to rural and unobstructed settings, the wind characteristics in urban (built-up) areas differ dramatically. Given how diverse and dynamic urban environments are, there is currently no forecast model for the wind characteristics of built-up areas that can be used to accurately anticipate the wind profile (wind velocity, wind direction, wind gustiness, turbulence intensities, etc.) [66,69,70]. Most of the wind data that are currently available lack the necessary resolution and are essentially useless for heights below 10 m. For instance, the wind data derived from modelling for Melbourne, Australia, are available at an elevation of 25 m, which is an unfeasible height for many urban buildings because a mast that high would make it difficult to obtain planning clearance. In addition, most Australian urban areas—aside from the city centre—are being developed horizontally (as opposed to vertically, as in Hong Kong, Singapore, mainland China, Russia, and other fast-growing metropolises), with houses that are no taller than 10 m [71,72]. As a result, urban wind characteristics are not sufficiently represented in current wind maps.
The wind flow around a typical house or building, both individually and within a cluster of buildings with various designs, needs to be understood in order to maximise the use of wind resources in urban environments. It is possible to choose a potential location for wind turbine installation once the wind behaviour has been fully mapped and understood. The results of using intricate computational models to represent the urban environment are constrained in a number of ways and can only be considered oversimplified [4,6,73]. Despite the restrictions, the computational modelling results provide an idea of predicted yields in the constructed environment. For the proper site selection of a wind turbine, an understanding of micro wind conditions is necessary. Software-based simulations cannot accurately forecast each site’s choice for the best power generation. The most accurate data with the lowest costs are provided by on-site observations and measurements of wind parameters [1,4,6,73].
For example, according to the Australian State of Victoria’s Wind Atlas, the mean wind speed across metropolitan Melbourne is 6.3 m/s. The Australian government research organisation “Commonwealth Scientific, Industrial, and Research Organisation (CSIRO)” Land and Water’s WindScape wind resource mapping program is used to predict yearly average wind speeds for the wind atlas. This software models the wind resource at 65 m above ground level to a resolution of 3000 m (3 km) using regional topography and atmospheric data. Since it misses any landscape effects within that 3000 m, where there are residential homes, buildings, trees, structures, tiny hills, ridges, etc., such a large resolution cannot include the microenvironment that is vital for wind turbine site selection. One of the best approaches to locating viable sites and maximising the power generation capacity of home-scale wind turbines is to conduct on-site measurements of the wind conditions for at least one year [1,4,6,73].
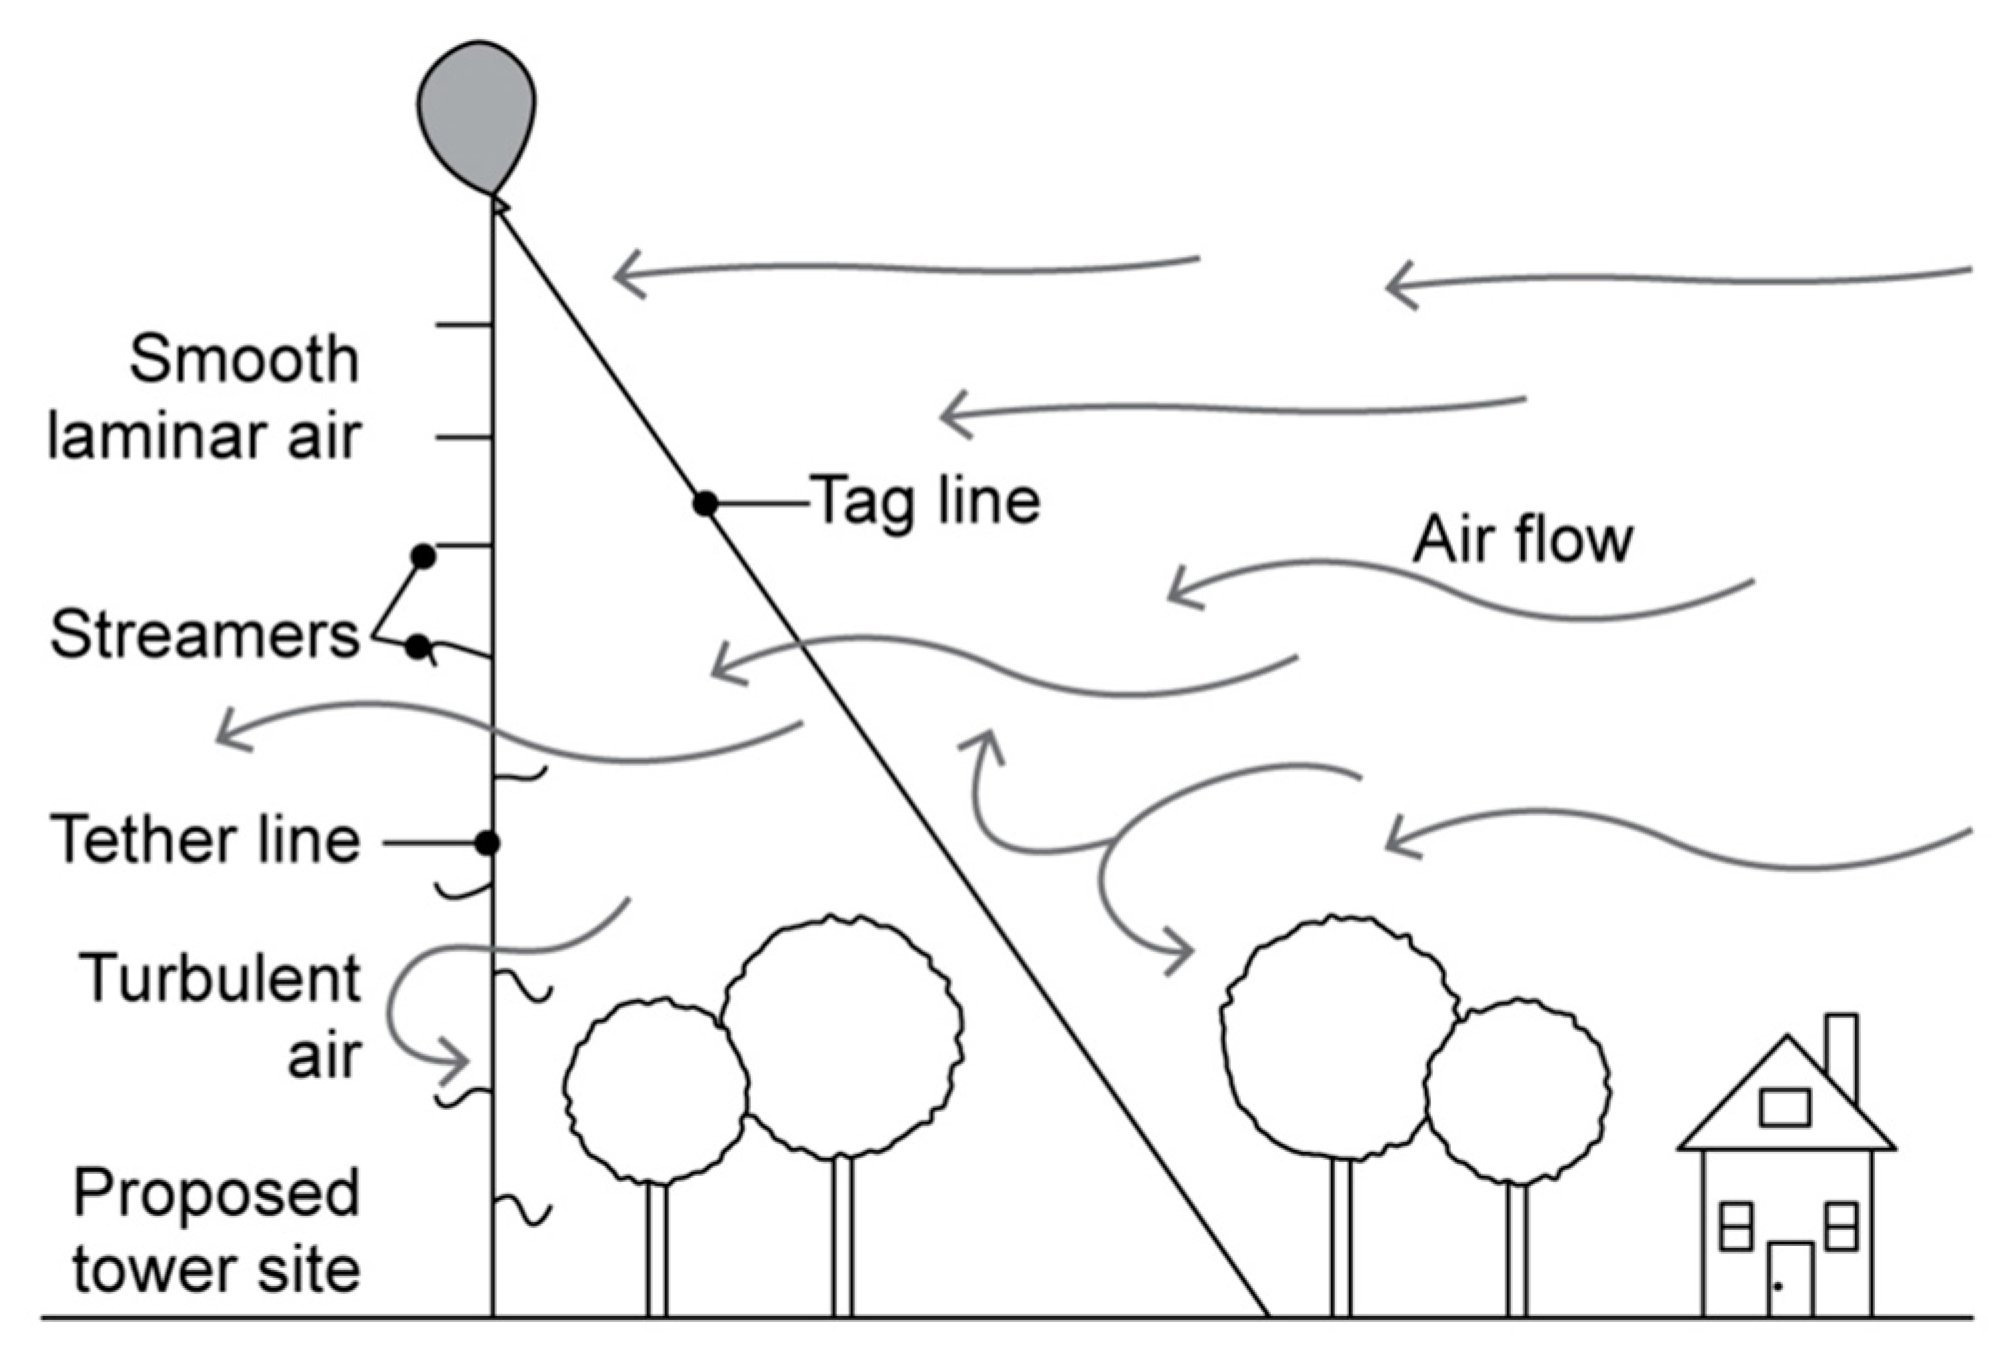
Figure 7 shows how to use a balloon, tag line, and tether line to check for smooth, undisturbed air in order to determine a potential turbine tower installation location. Once the potential location is determined, the wind characteristics at different heights in the installation location must be measured for at least one year to determine the installation location’s suitability. The optimum locations for wind power generation are generally on elevated, open territory where winds are unrestricted by trees and structures. Obstacle-induced turbulence in the wind is not ideal. An adequately tall tower is essential if wind systems cannot be sited far enough away from obstructions.
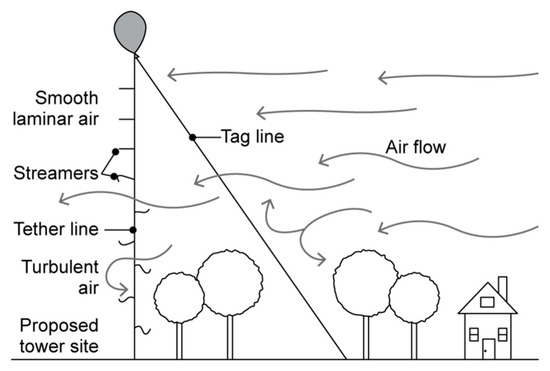
Figure 7.
Smooth air test with a balloon, adapted from [74].
3.2. Permits for Planning, Insurance, and Grid Connectivity
The laws governing the installation of wind turbines differ between different nations, states, counties, and municipalities. The setback distance between the turbine and close-by homes, the noise limit, and the drop shadow are examples of regulating standards. Small wind turbines up to 10 m tall and with a diameter under 7 m are exempt from some regulations in several countries. Before installing a tiny wind turbine, inspection by local authorities may still be necessary in some nations or regions.
There are no common criteria that apply to all of the European Union’s member states. Some nations just follow legally permissible advice, while others have strict regulations that must be followed. Local governments in the UK, Ireland, Spain, Italy, and Sweden only have legal recommendations for setback distance, noise limit, and drop shadow; there are no restrictions in these countries. The municipal governments in Portugal and the Netherlands have non-binding guidelines and laws governing noise restrictions only. It is necessary to abide by the setback distance, noise restriction, and drop shadow rules established by the municipal governments in France and Denmark. In Germany, most of the states—apart from Berlin, Bremen, Hamburg, Lower Saxony, Rheinland-Pfalz, and Schleswig-Holstein—exempt small-scale wind turbines from building requirements.
In Australia, the use of small-scale wind turbines in urban settings is still in its infancy. Therefore, no firm government laws and guidelines for the issuance of planning permits, the installation of tiny wind turbines in urban areas, insurance, or grid connectivity have been developed. However, some Australian local governments and municipalities have created policies and guidelines for the deployment of small-scale wind turbines, especially in rural settings. For most Australian councils and municipalities, planning approval is needed if the turbine is: (a) built in a heritage overlay or other overlay area; (b) has a sweeping blade area of more than 5 m2; and (c) is located in residential zone 1 [6]. In Australia, although most small-scale wind turbines are not grid-connected, for grid connection, the inverter must comply with Australian standards AS3100 and AS4777, in addition to a written contract with the power retailer [1,75].
Small-scale wind turbines mostly lack universally accepted standards. The International Electrotechnical Commission (IEC) developed the IEC 61400 standard in 2001 for wind turbines’ structural design, including site conditions prior to construction and the testing, assembly, and operation of turbine components to ensure the turbine is structurally sound over its designed life. The IEC 61400 describes the minimal design specifications that must be met by wind turbines; it is not meant to be used as a comprehensive design specification or instruction. For turbines with swept areas smaller than 200 m2, the IEC 61400-1 standard can be applied. Standards in the United States are expected to be consistent with IEC standards. The United States National Renewable Energy Laboratory (NREL) collaborated with IEC throughout the development of the IEC 61400 standard and tests turbines above ground in accordance with this standard. Several other standards, including ISO 19900: General requirements for offshore structures; ISO 19902: Fixed steel offshore structures; ISO 19903: Fixed concrete offshore structures; ISO 19904-1: Floating offshore structures—mono-hulls, semisubmersibles, and spars; and ISO 19904-2: Floating offshore structures—tension-leg platforms and API RP 2A-WSD: Recommended Practice for Planning, Designing, and Constructing Fixed Offshore Structures, are also applied to offshore wind turbines [76]. Many other countries, including Canada, are revising, or formulating their national standards to harmonise with IEC 61400.
Sadly, very few standard grid connection and feed-in tariff policies have been developed and implemented for small-scale wind turbine power generation in built-up areas. In contrast, the majority of nations have not put into place well-developed standards for grid connection, laws, and the feed-in tariff system for rooftop solar power in built-up regions.
3.3. Turbine Tower
The wind turbine should be located above and away from any obstructions. Buildings, trees, and hills block the wind, slowing it down and causing turbulence. A wind turbine should be placed at least 9 m above everything within 150 m horizontally. The rotor must be mounted far above any obstacles. The blade’s lowest point should be measured from tip to base to determine its nine-metre (9 m) vertical clearance length. The tower must bear the weight of the turbine and endure the loads that the wind places on it [77].
The minimum tower height is expressed in Equation (2).
Hmin = Ht + Hbuffer + Lblade
Here:
- Hmin is the minimum tower height (m);
- Ht is the height of tallest obstacle within 150 m;
- Hbuffer is the 10 m gap between the tallest obstacle and tip of the blade;
- Lblade is length of the turbine blade (m).
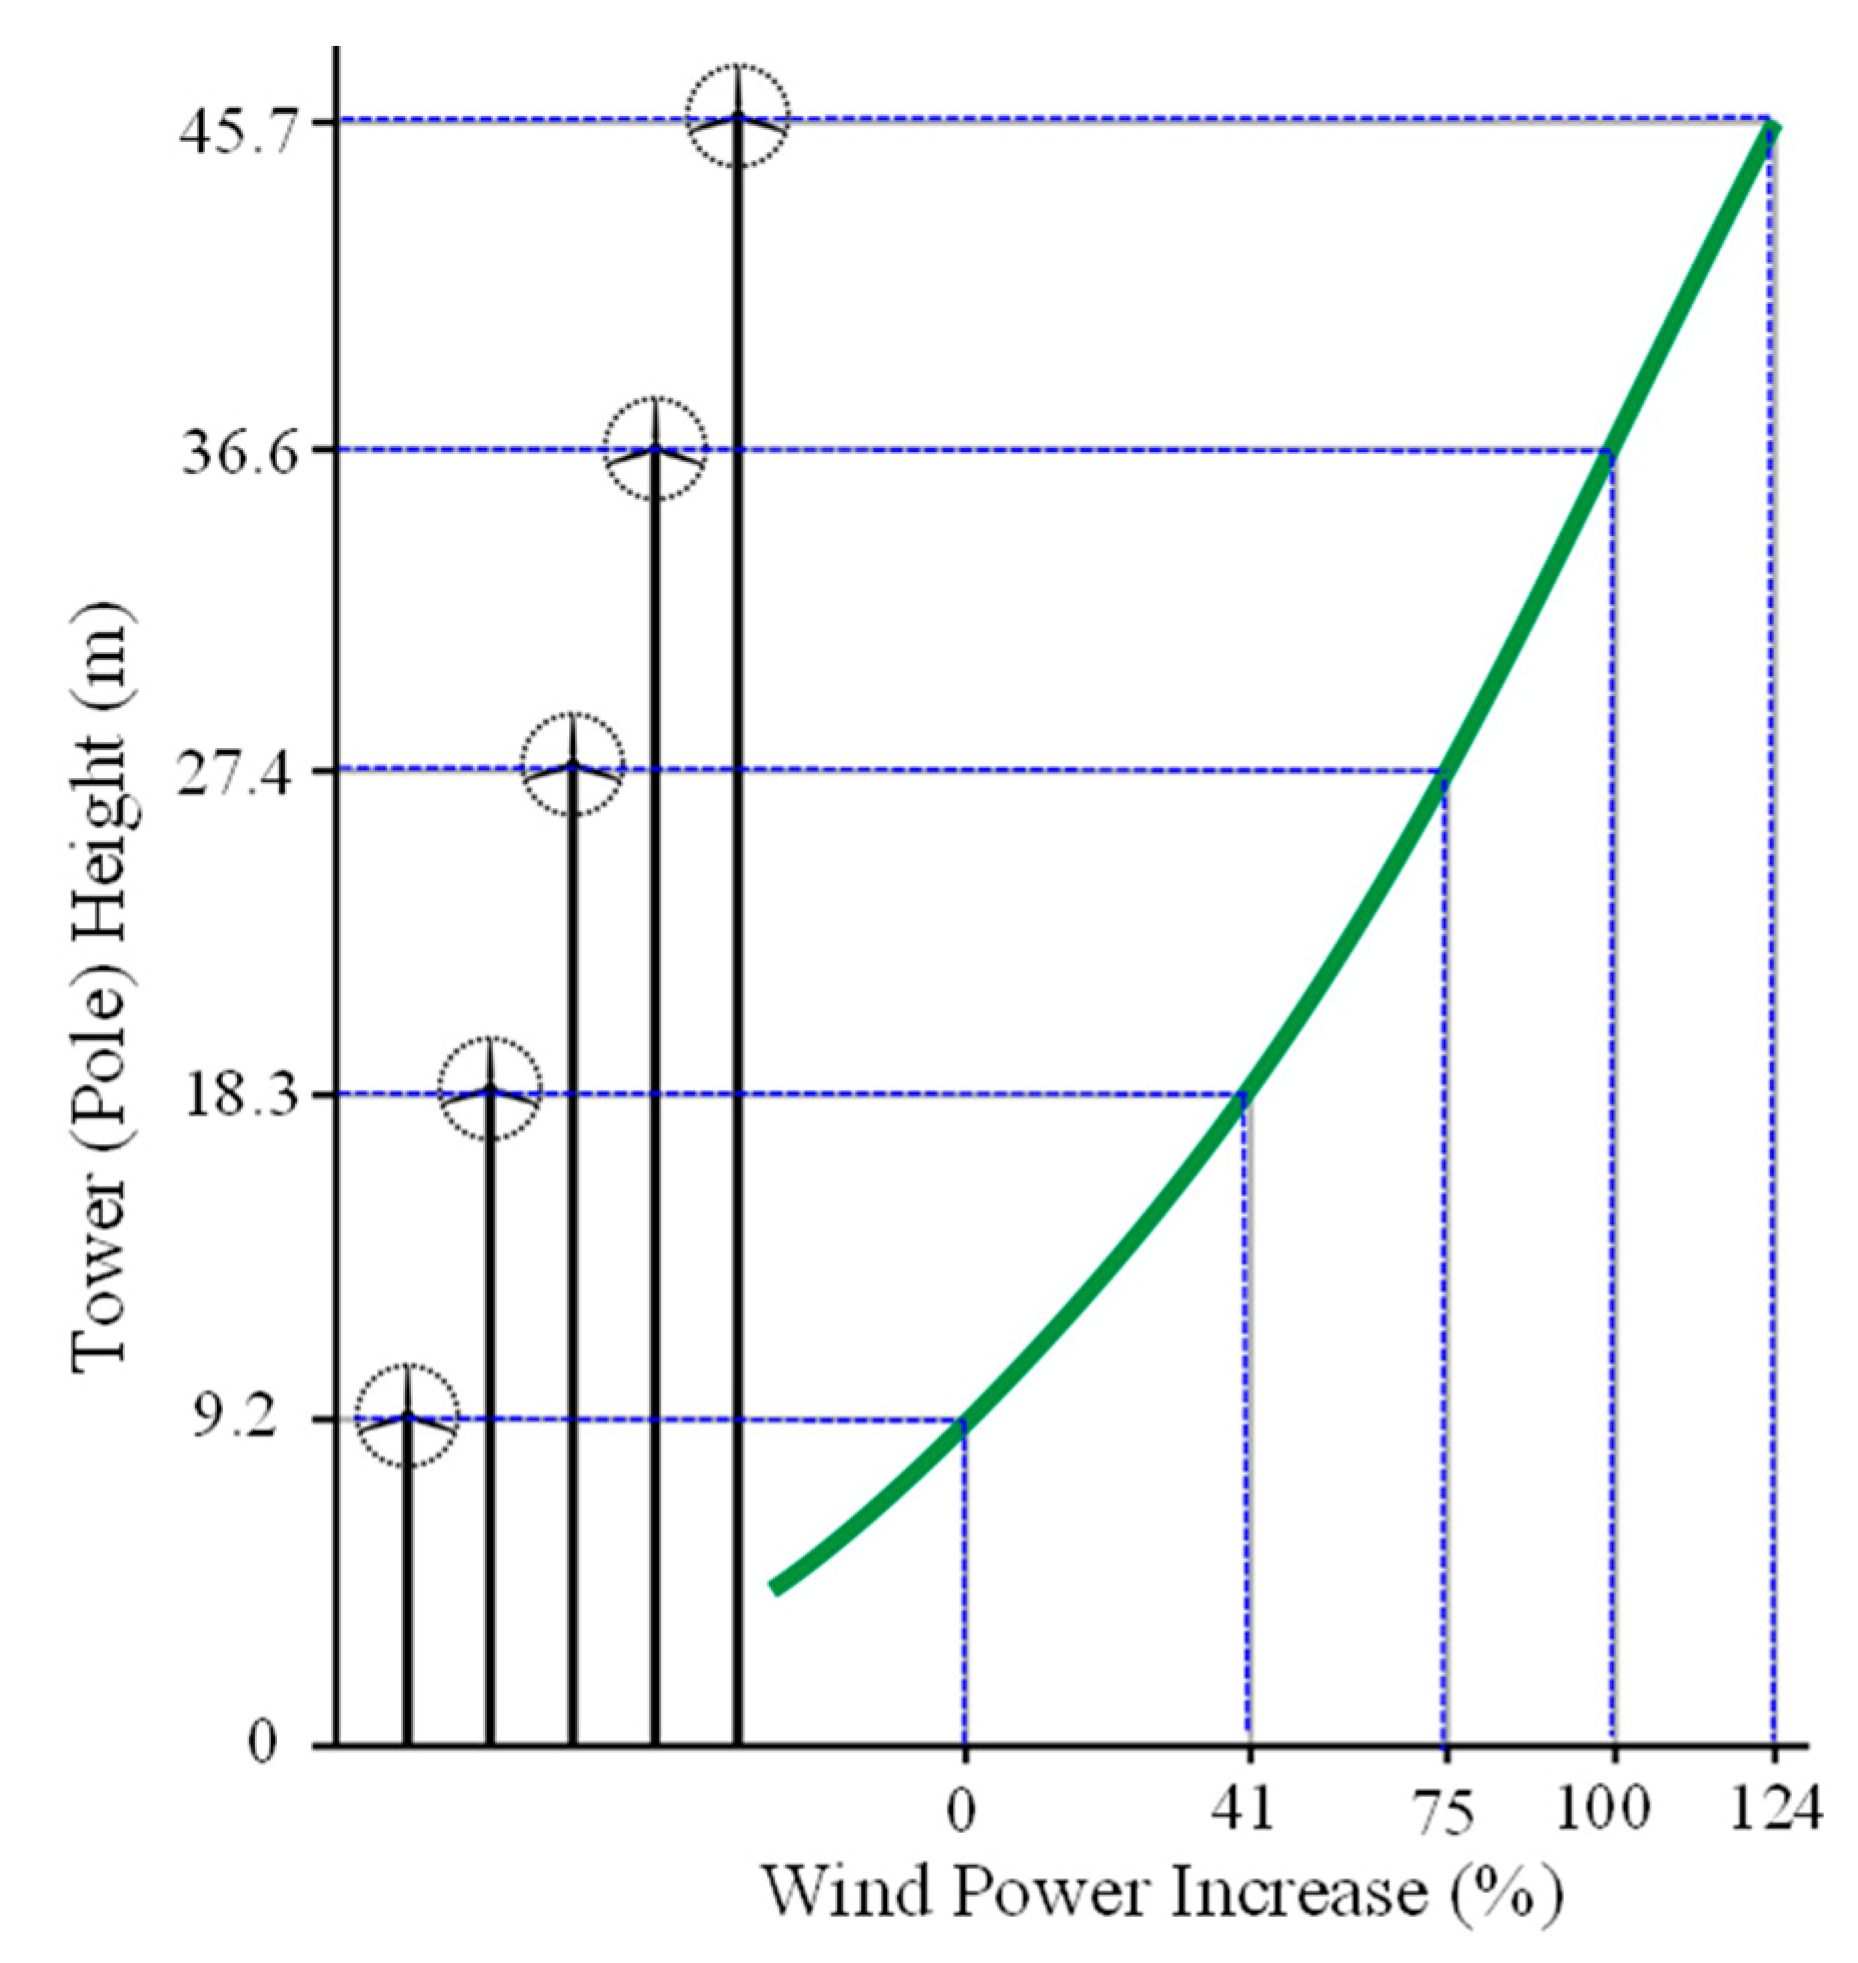
The wind power increases with the height of the turbine hub, as shown in Figure 8. Typically, a tower hub should be between 24 and 37 m high. A wind turbine should be installed high enough on a tower so that the tips of the rotor blades are at least 9 m above any obstructions within a horizontal distance of 90 m [78]. Towers with heights of 24 m, 30 m, or 36 m are commonly used for small wind turbine systems. In situations where there are a few taller barriers, like trees, a height of 42 m might be required [74]. In some cases, the higher hub height is required [79,80].
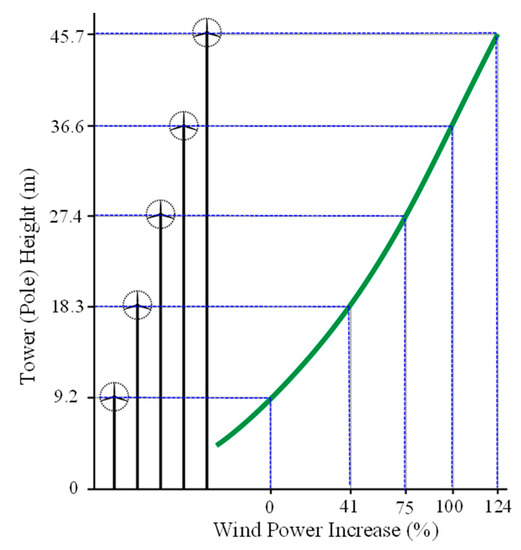
Figure 8.
Increase in wind power as a function of tower height and wind speeds, adapted from [81].
There are three basic types of towers: (a) tilt-up, (b) fixed-guy, and (c) freestanding, which are widely used for small-scale wind turbines. Tilt-up towers make repair and maintenance easy, as no climbing is required. A fixed-guy tower is the most common climbable tower, while a freestanding tower with no guy wires is costly but attractive and climbable [77].
The installation of a wind turbine on the roof of a house or other structure necessitates careful consideration of a range of factors, such as the need for building and works approval, noise levels, mounting and structural integrity of the house, and house insurance underwriting. Similar to solar PV or solar hot water panels, the mass of a typical household wind turbine can range from 10 kg to 80 kg. The turbine, in contrast to solar panels, can provide torque and bending moment to the mounting framework. For placing turbines on buildings, the national standards on minimum design loads on structures must be met. For example, in Australia, the Australian standard AS1170 needs to be adhered to. Similarly, for the UK, the British Wind Energy Association (BWEA) Small Wind Turbine Performance and Safety Standard BWEA 2008 is mandatory for manufacturers and installers to adhere to [1,4,6,74,82].
3.4. Turbine Control and Maintenance
With the increase in wind speeds, the wind generator spins faster and generates more power at a higher voltage. The generator would ultimately be damaged or worn out before its designed lifetime if wind speed increased over a particular point. As a result, most wind generators have a “cut-out” speed over which the generator either stops producing electricity or regulates rotational speed to maintain a consistent output. Mechanical braking and feathering are the two commonly used overspeed control techniques. In mechanical braking, centrifugal forces develop when the turbine approaches the cut-out speed and triggers a brake, similar to motor vehicle brakes. If operating at an average speed close to the cut-out speed, the turbine’s braking might be employed frequently, and the brakes would be worn out quickly. Two terms, ‘feathering’ and ‘furling,’ are widely used in turbine control. Feathering is the process by which a turbine turns each individual blade to change the angle of the rotor in the wind. Furling is the process through which a wind turbine turns completely against the wind [74].
In the event that the batteries are fully charged, any extra power is sent to a dummy load, which is generally an electrical heating element. The dummy load should be placed at a location where it would not be accidentally touched, or it would pose a fire or explosion risk due to excessive heating [74].
Regular maintenance is required for wind turbines, ideally twice a year but at least once. An average turbine spins for around 7000 h a year. The expected lifespan of well-designed wind turbines is 20 to 30 years. A routine maintenance schedule must be adhered to in order to guarantee system performance. Most maintenance entails careful examinations of the turbine and tower. The tower needs to be designed and built such that mechanical parts, including bearings, can be inspected and serviced with ease [74].
3.5. Small Wind Turbine Global Market
In built-up areas, people are encouraged through financial and economic incentives, including feed-in tariffs (FiT), production tax credits (PTC), and investment tax credits (ITC), to harness renewable energy (solar and wind) for power generation in order to reduce the dependency on grid-connected fossil-fuel-based power. According to a recent study, the size of the worldwide small wind turbine market is anticipated to reach USD 2.54 billion by 2030, growing at a compound annual growth rate (CAGR) of 9.2% during the projection period [83]. The small-scale wind turbine industry is expanding due to rising public awareness of renewable power generation by wind and government requirements to reduce the growing carbon footprint. The rising energy shortages, energy prices, and global population are also facilitating initiatives for wind power generation in built-up areas. Additionally, the gradual decline in wind turbine installation costs is expected to support business growth.
Given the simplicity of installation and low cost, both small-scale HAWTs and VAWTs are expected to gain popularity in the global built-up area wind market. The market for small-scale wind turbines is expected to rise by more than 9% between 2022 and 2030 as people become more conscious about greenhouse gas emissions and climate effects. Europe is anticipated to hold onto its leading position for small-scale wind turbine utilisation due to shifting attitudes about the use of renewable energy. By 2030, it is anticipated that significant expenditures and strong consumer awareness will boost the small-scale wind turbine industry. The expansion of the regional market is being aided by the abundance of onshore and offshore regions that are available for the installation of wind turbines.
3.6. Cost Analysis
An average Australian house consumes power amounting to 6570 kWh per year [84], while OECD nations’ typical residential house consumption yearly is around 11,000 kWh. A wind turbine rated between 5 and 15 kW is required for individual residential power needs [74]. The cost of a wind turbine depends on its size, tower type, and associated equipment. The turbine cost rises notably with the increase in size and tower height. For a residential main source of power, a turbine with 5 to 15 kW of capacity may cost between USD 15,000 and USD 75,000.
Typical small wind turbine installation costs include (a) tilt-up tower kit (38.7 m)—USD 5100, (b) inverter and power panel—USD 3439, (c) wind turbine, 3.7 m diameter rotor, controller, dump load—USD 2500, (d) 8 batteries, 6V, 415 Ah—USD 1500, (e) miscellaneous wire, conduit, etc.—USD 1200, (f) tower engineering (optional)—USD 1200, (g) concrete and rebar for footings—USD 800, (h) trenching and footings—USD 700, and (i) Watt-hour meter—USD 220 [77,83].
Along with the capital cost (price of the turbine, tower, electrical cable, inverter, data logger, controller, power meter, installation, and provision for grid connectivity), there is an ongoing maintenance or running cost. The task of maintenance often entails replacing worn-out parts, bearings, leading-edge blade tape, grease, oil, etc.
The payback period is calculated based on the price of power generated by a home wind turbine, the cost of using grid power in place of the turbine, and the annual return on investment from lower power expenses. The wind load factor, turbine type, and efficiency have a significant impact on the payback period. Larger turbines typically have quicker payback times. In general, a small-scale wind turbine has a longer payback period. However, the payback period for most small-scale wind turbines can be greatly reduced to less than 15 years if the wind load factor can be achieved close to 30%, the turbine manufacturing and retail prices are reduced, and the retail price of fossil fuel-based power is increased.
3.7. Wind Turbine Noise
Wind turbines are a source of environmentally friendly renewable energy, but they may also be visually intimidating and a source of infrasound. When wind turbines are built close to residential areas, the noise they produce has the potential to interrupt nearby residents’ sleep or wakefulness, which can lead to negative emotions like irritability and negativity as well as cognitive problems. Infrasound and audible sound, including possible effects on the inner ear’s non-auditory function, may have consequences for health and wellbeing [85].
Aerodynamic noise from moving blades and mechanical vibration noise from gearboxes and generators make up wind turbine noise. The blades’ aerodynamic noise is thought to be the main source of noise for large commercial wind turbines. Aerodynamic noise has two parts: (1) airfoil self-noise, which is the noise created by the blade in a smooth inflow and is brought on by the interaction of the blade’s trailing edge with the boundary layer, and (2) inflow turbulence noise, which is brought on by the interaction of the upstream atmospheric turbulence with the blades and is dependent on the atmospheric conditions. Inflow turbulence noise as well as airfoil self-noise are both influenced by a variety of variables, including wind speed, angle of attack, radiation direction, and airfoil form. There are several ways to lessen the aerodynamic noise made by wind turbine blades. One of them is the use of blades with serrated edges on the backs. It can lessen the noise produced by the von Karman vortex and enhance blade aerodynamic properties. Another strategy for reducing noise is to use turbulence-generating devices that are mounted on the blade’s outer section and leeward surface side [65].
Although noise limits differ greatly from nation to nation, the average nighttime noise level in most of Europe, Australia, Canada, and North America is between 35 and 40 dB (A) [85,86,87]. Furthermore, the wind turbine noise should not exceed 10% of the population’s irritation when exposed to it in Australia. Annoyance is the primary measurement criterion used to define wind turbine noise limits. This criterion ranges from 34 to 40 dB LAeq (10 min) outside the home, with a mean value of 37 dB LAeq (10 min) [85]. In Australia, it is mandatory to measure and monitor the commercial wind turbine noise generated by the wind turbine power generators [86,87]. The turbine power generators are required to submit an annual report to the regulatory authorities, where they must report on wind turbine noise monitoring details and any complaints they receive from the locality about the turbine wind noise. Currently, there are no such policies for small-scale wind turbine noise regulation in built-up areas. The general noise limit rules that are applicable for any fixed-machinery noise are shown in Table 2.

Table 2.
Fixed-machinery noise restrictions in various states in Australia for residential areas.
4. In Situ Performance Measurement Case Studies
Due to some discrepancies between in situ power generation and manufacturers or installers’ stated power generation capacities, a series of studies on the performance of installed small-scale wind turbines has been undertaken in different countries, mainly the UK, USA, and Netherlands. These studies are supported by the respective country’s government and/or organisations that subsidise and promote the use of small wind turbines in built-up areas. The main findings of these studies are summarised in Table 3. The performance of building-mounted and roof-mounted wind turbines is found to be poor due to limited and turbulent wind. Most small wind turbines’ performance in built-up areas is noted to be significantly less than that of their manufacturers’ rated power generation. The average wind speed is 50% or lower than the national wind speed databases. Generally, most installers overrate the available wind resources at the installation sites. As the power in the wind goes with the cube of the wind speed, doubling the wind speed makes the power eight times greater. This is why accurate measurement or prediction of wind speeds at installation sites is paramount.

Table 3.
Small wind turbine in situ performance case studies.
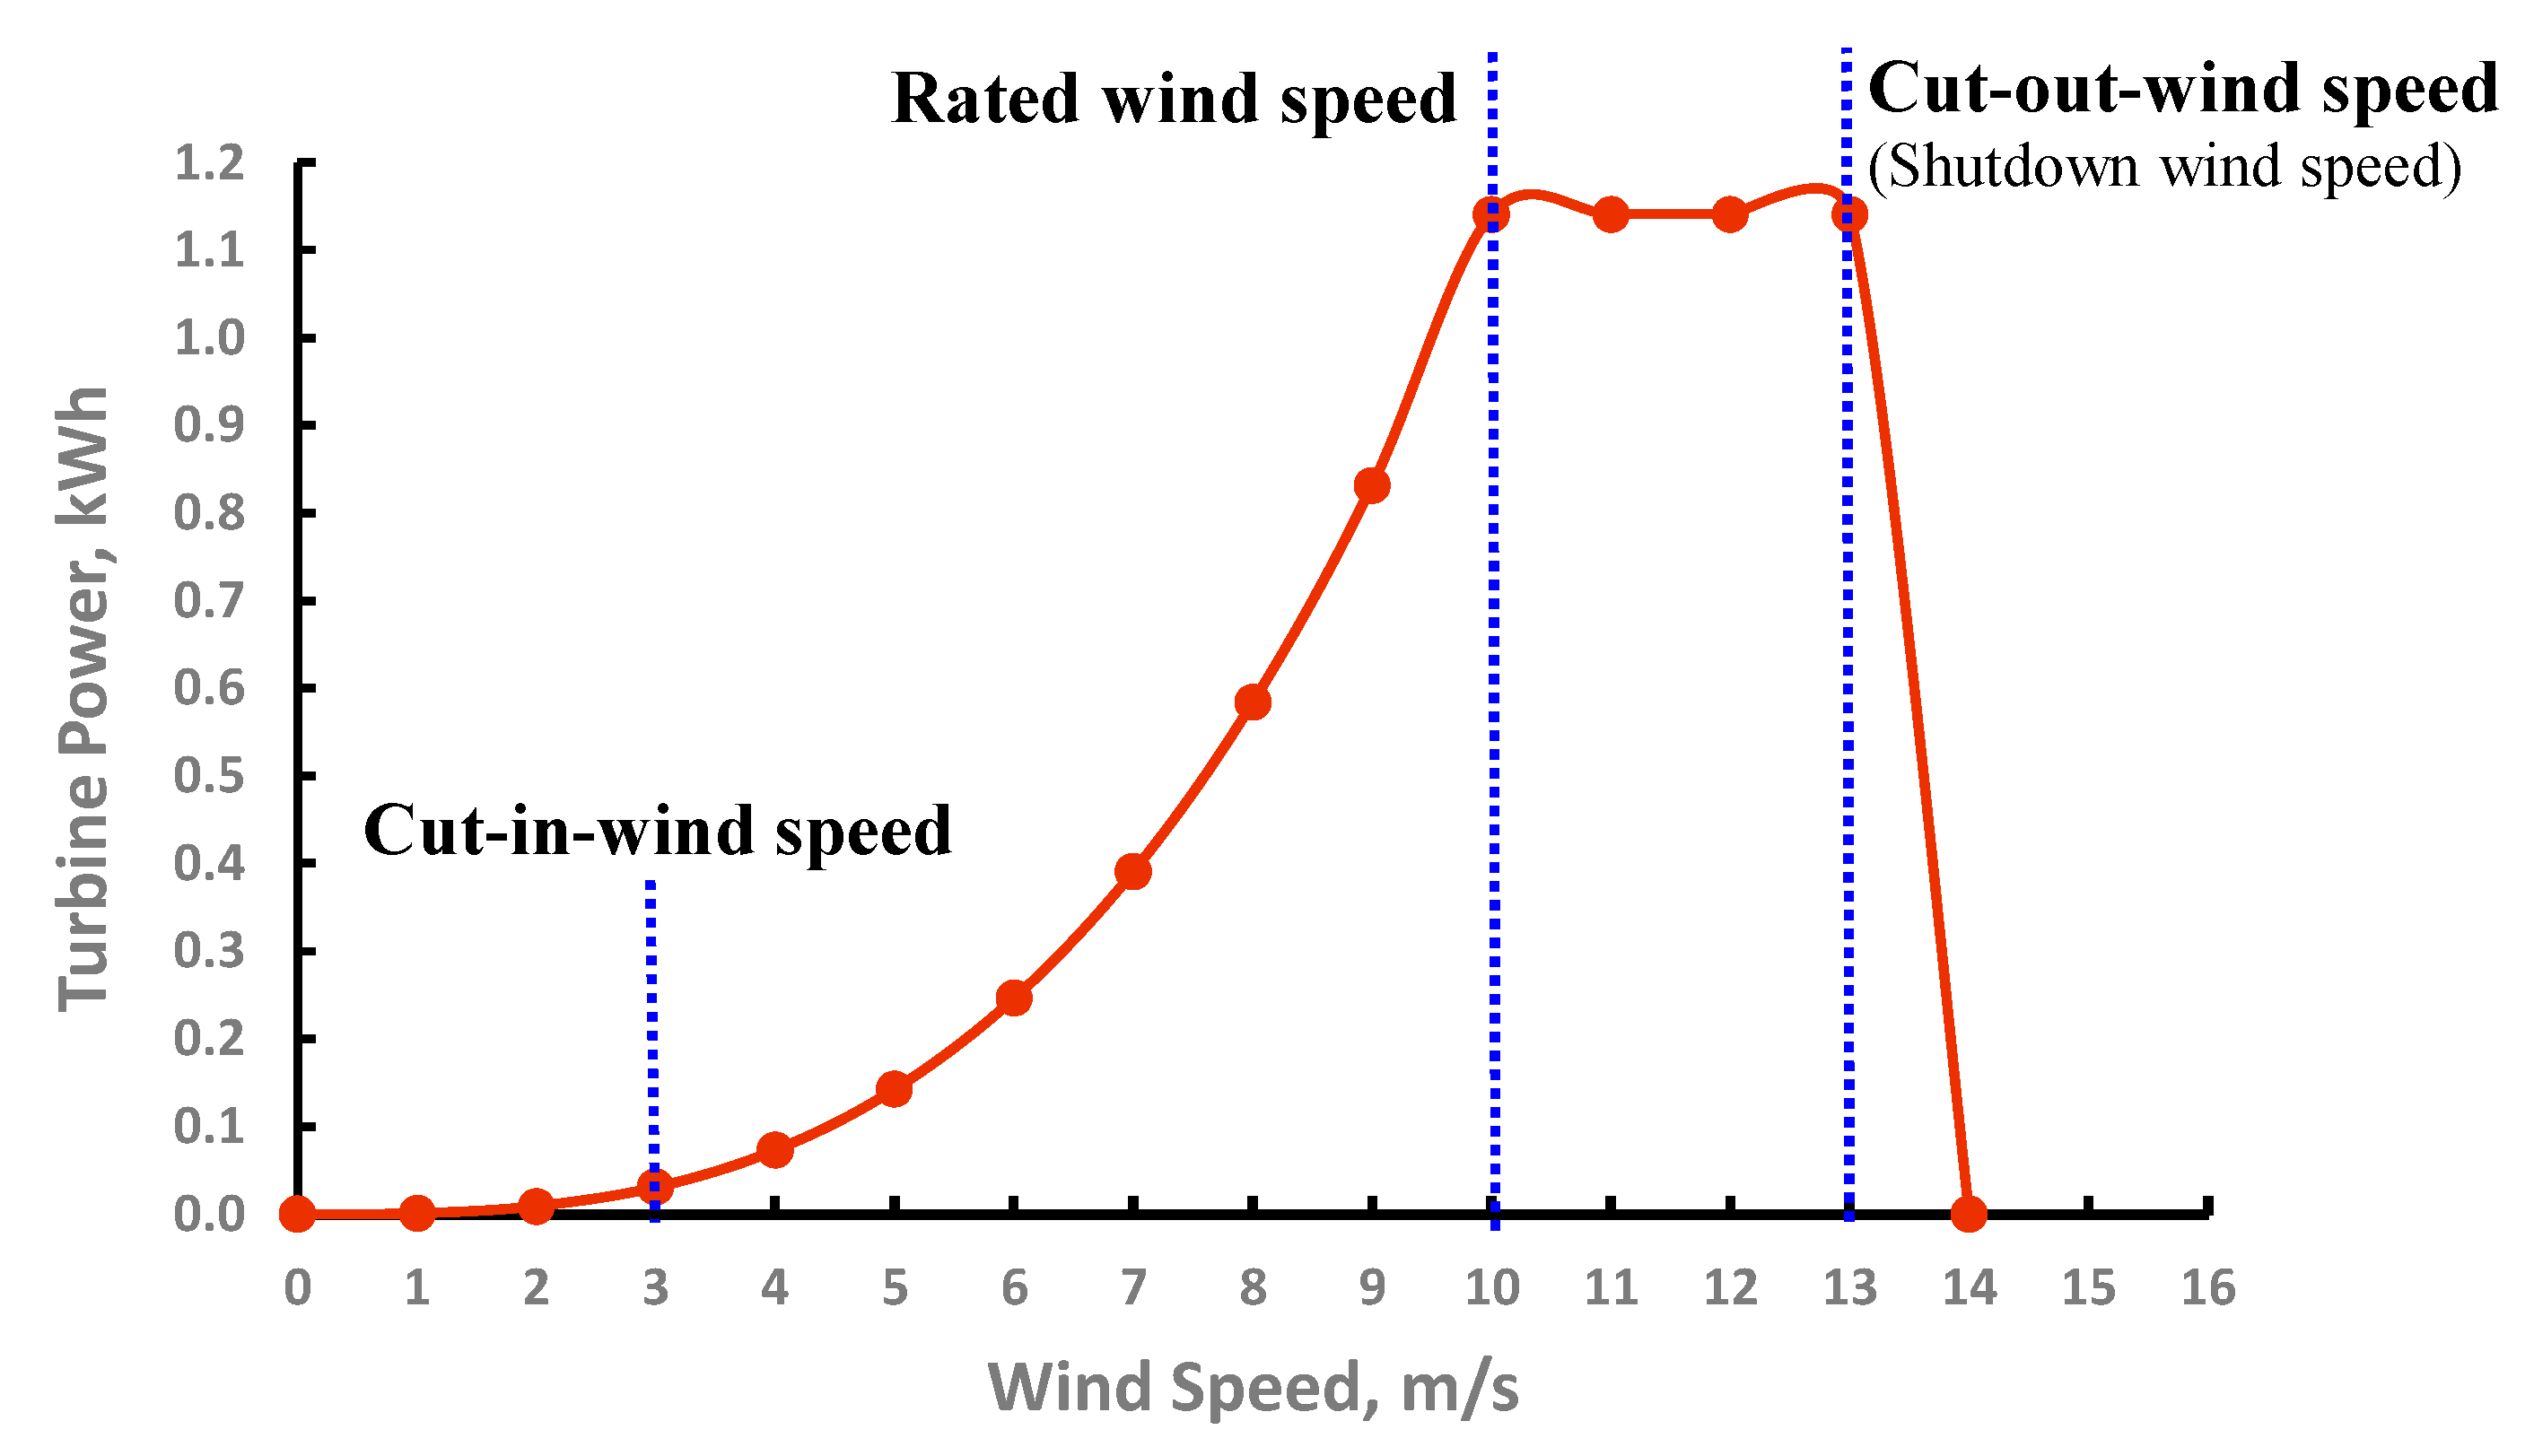
There are three terms (cut-in speed, rated wind speed, and cut-out wind speed) in wind turbine applications. The cut-in speed is the wind speed at which the turbine starts to generate any measurable power or the rotor just starts to rotate. In most cases, it ranges from 2.5 m/s to 3.5 m/s. The rated power is a measurement of the maximum amount of power that a turbine may safely produce while maintaining structural integrity and threshold vibration. A turbine’s rated power is merely a best-case scenario. For small-scale wind turbines, the window of rated wind speed varies from 10 to 14 m/s (see Figure 9). The turbine employs braking mechanisms to prevent structural damage at the speed that is called the “cut-out wind speed” or “shutdown wind speed”. The average cut-out speed is only a few m per second more than the rated wind speed. The other parameter for turbines is widely used and is called the turbine capacity factor. The turbine capacity factor is usually obtained by dividing the measured power output by the theoretical maximum power of a certain time period, often one year, and expressing it as a percentage (%). The rated output of the turbine is expressed as the product of the theoretical maximum power production and the number of hours included in the specified period (usually one year).
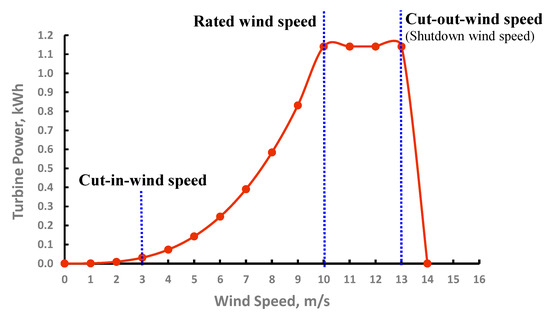
Figure 9.
Typical 1 kW turbine rated power curve.
5. Discussion
Small-scale wind turbine manufacturers reveal the rated power at certain wind speeds (often 10 to 12 m/s) along with the cut-in speed of around 3 m/s. The usual speed in built-up areas is between 3 and 6 m/s at a height of 10 m. The rated wind speed, at which the power of the turbine is benchmarked, cannot thus be at the height mentioned above. On a rooftop or adjacent to a building in a city or urban environment, however, neither of those scenarios is likely to occur [91]. A turbine’s rated power is its highest possible output. As mentioned earlier, it measures the amount of electric power the turbine can produce at the strongest wind speed that the turbine can withstand.
To estimate, one should use the turbine’s power curve. Figure 9 displays a typical power curve for a 1 kW turbine [92]. The graph shows that the turbine starts to generate power at a cut-in speed of around 3 m/s (10.8 km/h). Slower winds do not have enough kinetic energy to start the rotor rotating [92]. As wind speed climbs, power output increases quickly, but it does not reach the 1 kW rated output until the wind speed is around 11 m/s (about 40 km/h). In built-up areas, an average speed of 40 km/h is relatively uncommon. Additionally, a 1 kW turbine frequently produces less than one-tenth of its rated value because the average wind speed is more likely to be in the 3 to 5 m/s range.
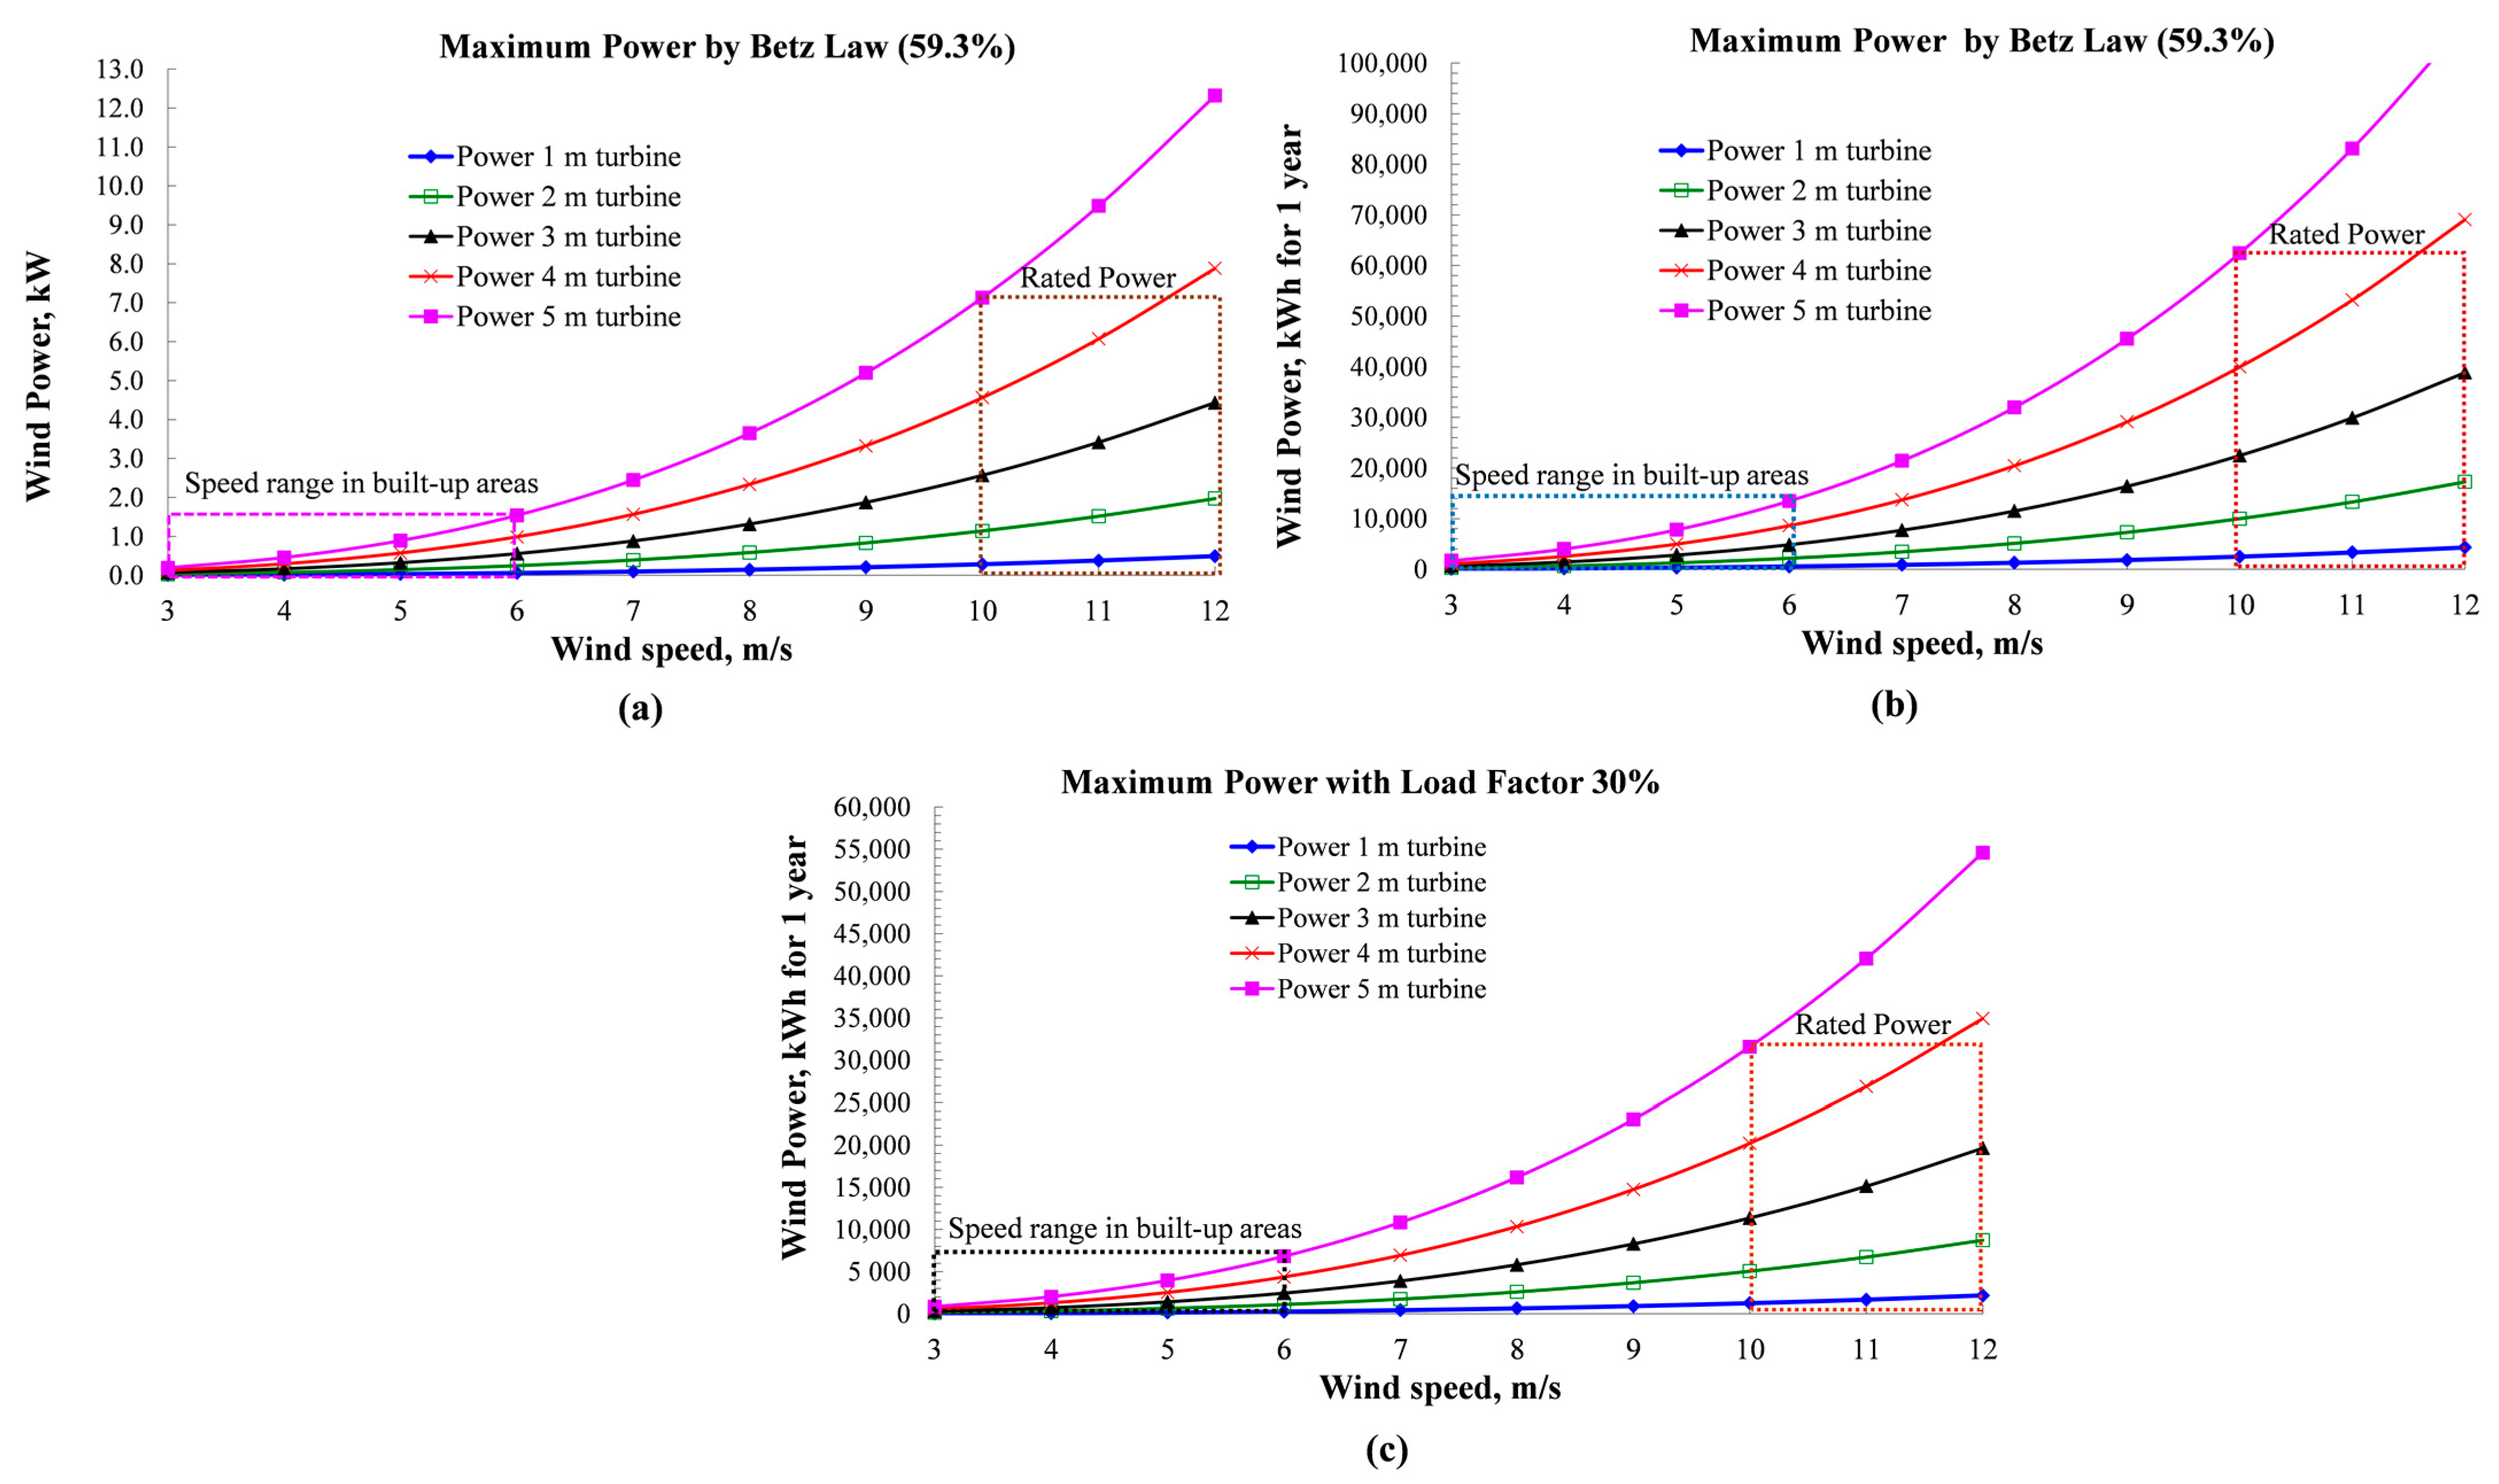
The power generation range for most small-scale wind turbines with 1 to 5 m rotor diameters is shown in Figure 10. The theoretical hourly, yearly, and yearly loads with 50% load factor power are shown in Figure 10a, Figure 10b and Figure 10c respectively. In each of these graphs, a typical wind speed zone in built-up areas (3 m/s to 6 m/s) and a turbine-rated power zone are illustrated with a dotted square box. Although in Figure 10c, the load factor is shown at 50%, generally, the load factor is lower than 30% in built-up areas, as evident by the case studies of in situ measurements. Thus, yearly power generation is expected to be much lower than that shown in the graph. The figure also indicates that turbines with less than 3 m diameter will not produce more than 2000 kWh of power even at an average 6 m/s wind speed in built-up areas with a load factor of 50%. It is important to note that the load factor can even be less than 20% in some complex built-up areas.
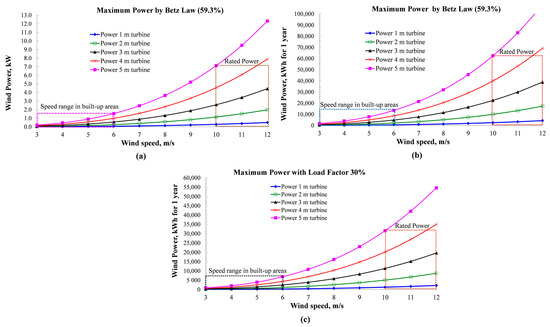
Figure 10.
Power generation range for most small-scale wind turbines (1–5 m rotor diameter): (a) Maximum hourly power output by Betz Law, (b) Maximum yearly power output by Betz Law, (c) Maximum yearly power output with load factor 30%.
Costs range from USD 6000 to USD 10,000 for a solar PV system that can generate 6000 to 10,000 kWh annually [92]. In contrast, the price of a wind turbine system of similar power generation capacity can reach USD 30,000, depending on the height, diameter, complex installation, and equipment used. The ability of a wind turbine to produce electric power in built-up areas depends on the turbine’s efficiency as well as the average annual wind speed, direction, and gustiness in the area of installation. Nevertheless, it is anticipated that the price of small-scale wind systems, including installation, will decrease due to ongoing technological advancements and an increase in localisation, as has been achieved for solar photovoltaic systems [35]. Therefore, a hybrid system that combines wind and solar energy seems more ideal for maximising the benefits of renewable power generation in built-up regions.
Operating wind turbines can make a variety of unwanted sounds, including a mechanical hum created by the generator and a whooshing sound produced by the blades moving through the air. The presence of wind turbine sound can be affected by atmospheric factors, such as air flow patterns and turbulence, as well as a person’s ability to perceive the sound, which varies depending on the topography (the shape of the terrain) specific to the site and the presence of other nearby sound sources, whether they are man-made or natural [93]. A wind turbine’s various components emit various sounds, including broadband sound, infrasonic sound, impulsive sound, and tonal sound. Most contemporary small- to medium-sized wind turbines produce a sound that is just somewhat louder than background wind noise (less than 6 dB). A small wind turbine generally does not make much noise in most wind conditions. When heard from 300 m away (the closest point a wind turbine is normally positioned to a house or building), the noise produced by land-based, utility-scale (big) wind turbines typically ranges from 35 to 45 dB. They produce much less noise pollution than typical city car traffic (70 dB), being just slightly louder than a typical refrigerator (50 dB). Underwater noise from different offshore wind turbines is at least 10–20 dB lower than ship noise in the same frequency range when it comes to offshore wind energy. Furthermore, although offshore wind farms are normally located close enough to the coast to be audible, they are unlikely to disturb nearby residents [93].
6. Conclusions
The potential for producing power from wind in urban areas with small-scale wind turbines is enormous. However, due to the lack of accurate local wind data measurements, it is challenging to generate any substantial power with the currently available small-scale wind turbines.
Site-specific wind data measurements are vital for the selection of suitable installation locations, hub heights, and turbine types and sizes. The choice of the site cannot be made only based on simulated or modelled data.
The design of the current small-scale wind turbines needs to be changed in order to take aerodynamic advantage of the local wind profile in built-up areas. Most wind turbines that are currently on the market are tuned for perfect or near perfect wind conditions that are scarce in built-up areas; thus, onsite performance data (at least over one year) must be used to improve the wind turbine design aimed at built-up areas.
Unlike commercial wind turbines, research and development work on small-scale wind turbines is extremely limited. As wind conditions in built-up areas are more complex, in-depth research on small-scale wind turbines ranging from turbine design, data bank compilation of urban wind characteristics measurements, selection of installation sites, and turbines is vital for harnessing urban and built-up areas’ wind energy for power generation. More importantly, substantial research and development are needed to increase the power generation capacity and efficiency of small-scale wind turbines.
Government incentives for installing small-scale wind turbines in urban areas are either scarce or non-existent. Incentives similar to those for PV panel installation should be used to encourage consumers to install turbines in built-up areas.
Government legislation and regulations for small-scale wind turbines are not well formulated in most countries. Such legislation and regulations should be created to improve the use of small-scale wind turbines and remove any uncertainty in this regard.
Since most small wind turbine manufacturers are hobbyists or small businesses, public and large enterprises’ financial involvement in this crucial industry is required and incentivised.
Apart from the power generation efficiency, the wind turbine noise can be an issue for the mass utilisation of turbines in built-up areas, especially in residential areas. Although many countries currently do not have the required regulations and policies on small-scale wind turbine noise restrictions, the enactment of such regulations and policies is warranted.
Author Contributions
Conceptualisation, methodology, validation, formal analysis, investigation, data curation, and writing—original draft preparation are by the first author, F.A.; conceptualisation, data curation, writing—review and editing and visualisation are by the second author, Y.J. All authors have read and agreed to the published version of the manuscript.
Funding
This research received no external funding.
Institutional Review Board Statement
Not applicable for studies not involving humans or animals.
Informed Consent Statement
Not applicable for studies not involving humans.
Data Availability Statement
Data supporting the reported results can be obtained from the authors upon reasonable request.
Conflicts of Interest
The authors declare no conflict of interest.
References
- Alam, F.; Ali, A.; Khan, I.; Mobin, S. Status of Power Generation by Domestic Scale Wind Turbines in Australia. Procedia Eng. 2012, 49, 205–212. [Google Scholar] [CrossRef][Green Version]
- Aldawi, F.; Alam, F.; Date, A.; Alghamdi, M.; Aldhawi, F. A New House Wall System for Residential Buildings. Energy Build. 2013, 67, 403–418. [Google Scholar] [CrossRef]
- Ahsan, S.; Ahmmed, T.; Alam, F. The COVID-19, power generation and economy—Case study of a developing country. Electr. J. 2022, 35, 107145. [Google Scholar] [CrossRef]
- Clean Energy Council, 2010 Clean Energy Australia Annual Report. Available online: http://www.cleanenergycouncil.org.au (accessed on 20 April 2023).
- Global Electricity Mix by Energy Source. 2022. Available online: https://www.statista.com/statistics/269811/world-electricity-production-by-energy-source/ (accessed on 21 July 2023).
- Webb, A. The Viability of Domestic Wind Turbines for Urban Melbourne; Alternative Technology Association (ATA): Melbourne, Australia, 2007; pp. 1–53. [Google Scholar]
- Noman, A.A.; Tasneem, Z.; Abhi, S.H.; Badal, F.R.; Rafsanzane, M.; Islam, M.R.; Alam, F. Savonius wind turbine blade design and performance evaluation using ANN-based virtual clone: A new approach. Heliyon 2023, 9, e156729. [Google Scholar] [CrossRef] [PubMed]
- Noman, A.A.; Tasneem, Z.; Sahed, M.F.; Muyeen, S.M.; Das, S.K.; Alam, F. Towards next generation Savonius wind turbine: Artificial intelligence in blade design trends and framework. Renew. Sustain. Energy Rev. 2022, 168, 112531. [Google Scholar] [CrossRef]
- Global Wind Energy Outlook. Available online: http://www.gwec.net/index.php?id=181&L=0%B4 (accessed on 30 June 2023).
- Renewable Capacity Statistics 2023, International Renewable Energy Agency (IRENA). Available online: https://www.irena.org/Publications/2023/Mar/Renewable-capacity-statistics-2023 (accessed on 15 May 2023).
- Ridden, P. Vestas Reveals Offshore Turbine with World’s Largest Sweep. New Atlas. 2021. Available online: https://newatlas.com/energy/vestas-v236-15-mw-offshore-wind-turbine/ (accessed on 2 June 2023).
- Mavrokefalidis, D. World’s Most Powerful Wind Turbine Emerges in China. Energy Live News. 2023. Available online: https://www.energylivenews.com/2023/01/11/worlds-most-powerful-wind-turbine-emerges-in-china/ (accessed on 2 June 2023).
- Kwok, K.C.S.; Hu, G. Wind energy system for buildings in an urban environment. J. Wind Eng. Ind. Aerodyn. 2023, 234, 105349. [Google Scholar] [CrossRef]
- World Population Prospects 2022: Summary of Results, UN Department of Economic and Social Affairs, Population Division. Available online: https://www.un.org/development/desa/pd/sites/www.un.org.development.desa.pd/files/wpp2022_summary_of_results.pdf (accessed on 21 June 2023).
- Rezaeiha, A.; Montazeri, H.; Blocken, B. A framework for preliminary large-scale urban wind energy potential assessment: Roof-mounted wind turbines. Energy Convers. Manag. 2020, 214, 112770. [Google Scholar] [CrossRef]
- Small-Scale Wind. Available online: https://energypedia.info/wiki/Small-Scale_Wind (accessed on 18 June 2023).
- Loganathan, B.; Chowdhury, H.; Mustary, I.; Rana, M.M.; Alam, F. Design of a micro wind turbine and its economic feasibility study for residential power generation in built-up areas. Energy Procedia 2019, 160, 812–819. [Google Scholar] [CrossRef]
- Karmakar, S.D.; Chattopadhyay, H. A review of augmentation methods to enhance the performance of vertical axis wind turbine. Sustain. Energy Technol. Assess. 2022, 53, 102469. [Google Scholar] [CrossRef]
- Takao, M.; Kuma, H.; Maeda, T.; Kamada, Y.; Oki, M.; Minoda, A. A straight-bladed vertical axis wind turbine with a directed guide vane row—Effect of guide vane geometry on the performance. J. Therm. Sci. 2009, 18, 54–57. [Google Scholar] [CrossRef]
- Kim, D.; Gharib, M. Efficiency improvement of straight-bladed vertical-axis wind turbines with an upstream deflector. J. Wind Eng. Ind. Aerodyn. 2013, 115, 48–52. [Google Scholar] [CrossRef]
- Kim, D.; Gharib, M. Unsteady loading of a vertical-axis turbine in the interaction with an upstream deflector. Exp. Fluids 2014, 55, 1658. [Google Scholar] [CrossRef]
- Jin, X.; Wang, Y.; Ju, W.; He, J.; Xie, S. Investigation into parameter influence of upstream deflector on vertical axis wind turbines output power via three dimensional CFD simulation. Renew. Energy 2018, 115, 41–53. [Google Scholar] [CrossRef]
- Stout, C.; Islam, S.; White, A.; Arnott, S.; Kollovozi, E.; Shaw, M.; Droubi, G.; Sinha, Y.; Bird, B. Efficiency improvement of vertical axis wind turbines with an upstream deflector. Energy Procedia 2017, 118, 141–148. [Google Scholar] [CrossRef]
- Nimvari, M.E.; Fatahian, H.; Fatahian, E. Performance improvement of a Savonius vertical axis wind turbine using a porous deflector. Energy Convers. Manag. 2020, 220, 113062. [Google Scholar] [CrossRef]
- Zhao, P.; Jiang, Y.; Liu, S.; Stoesser, T.; Zou, L.; Wang, K. Investigation of fundamental mechanism leading to the performance improvement of vertical axis wind turbines by deflector. Energy Convers. Manag. 2021, 247, 114680. [Google Scholar] [CrossRef]
- Hashem, I.; Mohamed, M.H. Aerodynamic performance enhancements of H-rotor Darrieus wind turbine. Energy 2018, 142, 531–545. [Google Scholar] [CrossRef]
- Kuang, L.; Su, J.; Chen, Y.; Han, Z.; Zhou, D.; Zhang, K.; Zhao, Y.; Bao, Y. Wind-capture-accelerate device for performance improvement of vertical-axis wind turbines: External diffuser system. Energy 2022, 39, 122196. [Google Scholar] [CrossRef]
- Ohya, Y.; Karasudani, T. A Shrouded Wind Turbine Generating High Output Power with Wind-lens Technology. Energies 2010, 3, 634–649. [Google Scholar] [CrossRef]
- Watanabe, K.; Takahashi, S.; Ohya, Y. Application of a Diffuser Structure to Vertical-Axis Wind Turbines. Energies 2016, 9, 406. [Google Scholar] [CrossRef]
- Mohamed, M.H.; Janiga, G.; Pap, E.; Thevenin, D. Optimization of Savonius turbines using an obstacle shielding the returning blade. Renew. Energy 2010, 35, 2618–2626. [Google Scholar] [CrossRef]
- Mohamed, M.H.; Janiga, G.; Pap, E.; Thevenin, D. Optimal blade shape of a modified Savonius turbine using an obstacle shielding the returning blade. Energy Convers. Manag. 2011, 52, 236–242. [Google Scholar] [CrossRef]
- Mohammadi, M.; Mohammadi, R.; Ramadan, A.; Mohamed, M.H. Numerical investigation of performance refinement of a drag wind rotor using flow augmentation and momentum exchange optimization. Energy 2018, 158, 592–606. [Google Scholar] [CrossRef]
- Altan, B.D.; Atılgan, M. An experimental and numerical study on the improvement of the performance of Savonius wind rotor. Energy Convers. Manag. 2008, 49, 3425–3432. [Google Scholar] [CrossRef]
- Altan, B.D.; Atılgan, M. The use of a curtain design to increase the performance level of a Savonius wind rotors. Renew. Energy 2010, 35, 821–829. [Google Scholar] [CrossRef]
- El-Askary, W.A.; Nasef, M.H.; Abdel-Hamid, A.A.; Gad, H.E. Harvesting wind energy for improving performance of Savonius rotor. J. Wind Eng. Ind. Aerodyn. 2015, 139, 8–15. [Google Scholar] [CrossRef]
- Irabu, K.; Roy, J.N. Characteristics of wind power on Savonius rotor using a guidebox tunnel. Exp. Therm. Fluid Sci. 2007, 32, 580–586. [Google Scholar] [CrossRef]
- Chong, W.T.; Fazlizan, A.; Poh, S.C.; Pan, K.C.; Hew, W.P.; Hsiao, F.B. The design, simulation and testing of an urban vertical axis wind turbine with the omnidirection-guide-vane. Appl. Energy 2013, 112, 601–609. [Google Scholar] [CrossRef]
- Wong, K.H.; Chong, W.T.; Yap, H.T.; Fazlizan, A.; Omar, W.Z.W.; Poh, S.C.; Hsiao, F.B. The design and flow simulation of a power-augmented shroud for urban wind turbine system. Energy Procedia 2014, 61, 1275–1278. [Google Scholar] [CrossRef]
- Nobile, R.; Vahdati, M.; Barlow, J.F.; Mewburn-Crook, A. Unsteady flow simulation of a vertical axis augmented wind turbine: A two-dimensional study. J. Wind Eng. Ind. Aerodyn. 2014, 125, 168–179. [Google Scholar] [CrossRef]
- Li, Y.; Zhao, S.; Tagawa, K.; Feng, F. Starting performance effect of a truncated-coneshaped wind gathering device on small-scale straight-bladed vertical axis wind turbine. Energy Convers. Manag. 2018, 167, 70–80. [Google Scholar] [CrossRef]
- Li, Y.; Zhao, S.; Qu, C.; Tong, G.; Feng, F.; Zhao, B.; Kotaro, T. Aerodynamic characteristics of Straight-bladed Vertical Axis Wind Turbine with a curved-outline wind gathering device. Energy Convers. Manag. 2020, 203, 112249. [Google Scholar] [CrossRef]
- Pope, K.; Rodrigues, V.; Doyle, R.; Tsopelas, A.; Gravelsins, R.; Naterer, G.F.; Tsang, E. Effects of stator vanes on power coefficients of a zephyr vertical axis wind turbine. Renew. Energy 2010, 35, 1043–1051. [Google Scholar] [CrossRef]
- Pope, K.; Dincer, I.; Naterer, G.F. Energy and exergy efficiency comparison of horizontal and vertical axis wind turbines. Renew. Energy 2010, 35, 2102–2113. [Google Scholar] [CrossRef]
- Kalluvila, J.B.S.; Sreejith, B. Numerical and experimental study on a modified Savonius rotor with guide blades. Int. J. Green Energy 2018, 15, 744–757. [Google Scholar] [CrossRef]
- Tian, W.; Mao, Z.; Ding, H. Numerical study of a passive-pitch shield for the efficiency improvement of vertical axis wind turbines. Energy Convers. Manag. 2019, 183, 732–745. [Google Scholar] [CrossRef]
- Yao, Y.X.; Tang, Z.P.; Wang, X.W. Design based on a parametric analysis of a drag driven VAWT with a tower cowling. J. Wind Eng. Ind. Aerodyn. 2013, 116, 32–39. [Google Scholar] [CrossRef]
- Ying, P.; Chen, Y.K.; Xu, Y.G.; Tian, Y. Computational and experimental investigations of an omni-flow wind turbine. Appl. Energy 2015, 146, 74–83. [Google Scholar] [CrossRef]
- Bhuyan, S.; Biswas, A. Investigations on self-starting and performance characteristics of simple H and hybrid H-Savonius vertical axis wind rotors. Energy Convers. Manag. 2014, 87, 859–867. [Google Scholar] [CrossRef]
- Hosseini, A.; Goudarzi, N. Design and CFD study of a hybrid vertical-axis wind turbine by employing a combined Bach-type and H-Darrieus rotor systems. Energy Convers. Manag. 2019, 189, 49–59. [Google Scholar] [CrossRef]
- Chong, W.-T.; Wong, K.-H.; Wang, C.-T.; Gwani, M.; Chu, Y.-J.; Chia, W.-C.; Poh, S.-C. Cross-axiswind-turbine: A complementary design to push the limit of wind turbine technology. Energy Procedia 2017, 105, 973–979. [Google Scholar] [CrossRef]
- Chong, W.-T.; Muzammil, W.K.; Wong, K.-H.; Wang, C.-T.; Gwani, M.; Chu, Y.-J.; Poh, S.-C. Cross axis wind turbine: Pushing the limit of wind turbine technology with complementary design. Appl. Energy 2017, 207, 78–95. [Google Scholar] [CrossRef]
- Reupke, P.; Probert, S.D. Slatted-blade Savonius wind-rotors. Appl. Energy 1991, 40, 65–75. [Google Scholar] [CrossRef]
- Mohamed, O.S.; Ibrahim, A.A.; Etman, A.K.; Abdelfatah, A.A.; Elbaz, A.M.R. Numerical investigation of Darrieus wind turbine with slotted airfoil blades. Energy Convers. Manag. 2020, 5, 100026. [Google Scholar] [CrossRef]
- Chen, J.; Yang, H.; Yang, M.; Xu, H. The effect of the opening ratio and location on the performance of a novel vertical axis Darrieus turbine. Energy 2015, 89, 819–834. [Google Scholar] [CrossRef]
- Yousefi, R.M.; Khaleghinia, J.; Eshagh, N.M.; Salarian, H. Performance improvement of Darrieus wind turbine using different cavity layouts. Energy Convers. Manag. 2021, 246, 114693. [Google Scholar] [CrossRef]
- Al-Ghriybah, M.; Zulkafli, M.F.; Didane, D.H.; Mohd, S. The effect of inner blade position on the performance of the Savonius rotor. Sustain. Energy Technol. Assess. 2019, 36, 100534. [Google Scholar] [CrossRef]
- Al-Ghriybah, M.; Fadhli, Z.M.; Hissein, D.D.; Mohd, S. The effect of spacing between inner blades on the performance of the Savonius wind turbine. Sustain. Energy Technol. Assess. 2021, 43, 100988. [Google Scholar] [CrossRef]
- Saad, A.S.; Elwardany, A.; El-Sharkawy, I.I.; Ookawara, S.; Ahmed, M. Performance evaluation of a novel vertical axis wind turbine using twisted blades in multistage Savonius rotors. Energy Convers. Manag. 2021, 235, 114013. [Google Scholar] [CrossRef]
- Krishnan, A.; Paraschivoiu, M. 3D analysis of building mounted VAWT with diffuser shaped shroud. Sustain. Cities Soc. 2016, 27, 160–166. [Google Scholar] [CrossRef]
- Li, D.; Li, C.; Zhang, W.; Zhu, H. Effect of building diffusers on aerodynamic performance for building augmented vertical axis wind turbine. J. Renew. Sustain. Energy 2021, 13, 023306. [Google Scholar] [CrossRef]
- Kanya, B.; Visser, K.D. Experimental validation of a ducted wind turbine design strategy. Wind Energy Sci. 2018, 3, 919–928. [Google Scholar] [CrossRef]
- Fthenakis, V.; Kim, H.C. Land use and electricity generation: A life-cycle analysis. Renew. Sustain. Energy Rev. 2009, 13, 1465. [Google Scholar] [CrossRef]
- Impact of Wind Power Generation in Ireland on the Operation of Conventional Plant and the Economic Implications. Available online: https://docs.wind-watch.org/EirGrid-WindImpact-Main.pdf (accessed on 28 June 2023).
- Small Wind Turbines, 1–6 kW. Available online: https://www.greenspec.co.uk/building-design/small-wind-turbines/ (accessed on 1 July 2023).
- Tong, W. Wind Power Generation and Wind Turbine Design; WIT Press: Southampton, UK, 2010; ISBN 978-1-84564-205-1. [Google Scholar]
- Tasneem, Z.; Noman, A.A.; Das, S.K.; Saha, D.K.; Islam, M.R.; Ali, M.F.; Badal, M.F.R.; Ahamed, M.H.; Moyeen, S.I.; Alam, F. An analytical review on the evaluation of wind resource and wind turbine for urban application: Prospect and challenges. Dev. Built Environ. 2020, 4, 100033. [Google Scholar] [CrossRef]
- Hucho, W.H. Aerodynamics of Road Vehicles; Society of Automotive Engineers (SAE): Warrendale, PA, USA, 1998; ISBN 0-7680-0029-7. [Google Scholar]
- Davenport, A.G. Some Aspect of Wind Loading; Paper EIC ′63-CIV 3; Transaction of the Institute of Canada: Toronto, ON, Canada, 1963. [Google Scholar]
- Tominaga, Y. CFD Prediction for Wind Power Generation by a Small Vertical Axis Wind Turbine: A Case Study for a University Campus. Energies 2023, 16, 4912. [Google Scholar] [CrossRef]
- Elkinton, M.R.; Rogers, A.L.; McGowan, J.G. An Investigation of Wind-Shear Models and Experimental Data Trends for Different Terrains. Wind Eng. 2006, 30, 341–350. [Google Scholar] [CrossRef]
- Karsten, L. Middle-class households with children on vertical family living in Hong Kong. Habitat Int. 2015, 47, 241–247. [Google Scholar] [CrossRef]
- Al-Kodmany, K.; Xue, Z.; Sun, C. Reconfiguring Vertical Urbanism: The Example of Tall Buildings and Transit-Oriented Development (TB-TOD) in Hong Kong. Buildings 2022, 12, 197. [Google Scholar] [CrossRef]
- Yusaf, T.; Goh, S.; Borserio, J.A. Potential of renewable energy alternatives in Australia. Renew. Sustain. Energy Rev. 2011, 15, 2214–2221. [Google Scholar] [CrossRef]
- Stapleton, G.; Milne, G.; Riedy, C.; Ross, K. Wind System. Available online: https://www.homebaseperth.com.au/wp-content/uploads/Your-home/05-Energy/Energy-WindSystems.pdf (accessed on 29 May 2023).
- Gipe, P. Wind Energy Basics: A Guide to Home and Community Scale Wind Energy Systems, 2nd ed.; Chelsea Green Publishing: Hartford, VT, USA, 2009; pp. 1–192. [Google Scholar]
- Musial, W.D.; Sheppard, R.E.; Dolan, D.; Naughton, B. Development of Offshore Wind Recommended Practice for U.S. Waters; National Renewable Energy Laboratory (NREL): Golden, CO, USA, 2013; pp. 1–13. Available online: https://permanent.access.gpo.gov/gpo41492/57880.pdf (accessed on 13 May 2023).
- Woofenden, I. Wind Generator Tower Basics. Available online: https://www.renewablereality.net/wp-content/uploads/2018/09/Wind-Generator-Tower-article-from-Home-Power-magazine-1.pdf (accessed on 3 June 2023).
- Clarke, S. Electricity Generation Using Small Wind Turbines for Home or Farm Use, Ontario Ministry of Agriculture, Food and Rural Affairs, Toronto, Canada. Available online: https://files.ontario.ca/omafra-electricity-generation-small-wind-turbines-home-farm-use-18-005-en-24-03-2021.pdf (accessed on 6 June 2023).
- Hadad, M.S.; Al-Jiboori, M.H. Choosing Minimum Height for Continuing Operation wind Energy Generation Over Urban Cities. J. Educ. Pure Sci.—Univ. Thi-Qar 2019, 9, 193–203. [Google Scholar] [CrossRef]
- Al-Jiboori, M.H.; Qassim, M.S. Choosing of relevant low height for operation wind turbine over urban Baghdad city. J. Phys. Conf. Ser. 2018, 1032, 012011. [Google Scholar] [CrossRef]
- Small Wind Electric Systems—A U.S. Consumer’s Guide, U.S. Department of Energy, USA. Available online: https://www.nrel.gov/docs/fy07osti/42005.pdf (accessed on 30 May 2023).
- Rhodes, M.; Brown, H.; Hailes, D. Encraft Warwick Wind Trials Project. 2009. Available online: https://s1.solacity.com/docs/Warwick%20Wind%20Trials%20Report.pdf (accessed on 10 May 2023).
- Small Wind Market, Research and Markets. Available online: https://www.researchandmarkets.com/reports/4375404/ (accessed on 22 May 2023).
- Davy, J.L.; Burgemeister, K.; Hillman, D.; Carlile, S. A Review of the Potential Impacts of Wind Turbine Noise in the Australian Context. Acoust. Aust. 2020, 48, 181–197. [Google Scholar] [CrossRef]
- Access Canberra. Overview Noise Standards. ACT Government, Canberra, Australia. Available online: https://www.accesscanberra.act.gov.au/s/article/noise-thresholds-tab-overview (accessed on 28 April 2023).
- Song, J.; Yorke, I. Wind Farms Environmental Noise Guidelines; Environment Protection Authority (EPA) South Australia: Adelaide, Australia, 2021; ISBN 978-1-876562-43-9.
- Domestic Small-Scale Wind Field Trial Report, Energy Saving Trust UK. Available online: https://eprints.soton.ac.uk/353113/1/Location_Location_Location_field_trial_small-scale_wind_report%25281%2529.pdf (accessed on 14 April 2023).
- Shaw, S.; Rosen, A.; Beavers, D.; Korn, D. Status Report on Small Wind Energy Projects, Massachusetts Renewable Energy Trust & The Cadmus Group, USA. Available online: https://archives.lib.state.ma.us/handle/2452/335409 (accessed on 11 May 2023).
- Mertens, S. Project Group Test Field Small Wind Turbines (kW) Zeeland, Netherlands. Available online: https://s1.solacity.com/docs/ZEE0900786.pdf (accessed on 18 May 2023).
- Lombardo, T. Rooftop Wind Turbines: Are They Worthwhile? Available online: https://www.engineering.com/story/rooftop-wind-turbines-are-they-worthwhile-qxrvl (accessed on 13 May 2023).
- Sun, W.; Tian, C.; Jin, Y. Cost and Reliability Analysis of a Hybrid Renewable Energy Systems—A Case Study on an Administration Building. MIST Int. J. Sci. Technol. 2022, 10, 29–35. [Google Scholar]
- How Much Electricity Does an Australian Home Use? Available online: http://www.arelectrical.com.au/average-electricity-usage-in-australia/ (accessed on 22 May 2022).
- Wind Turbine Sound, Office of Energy Efficiency & Renewable Energy, Wind Exchange, US Department of Energy, USA. Available online: https://windexchange.energy.gov/projects/sound#:~:text=Do%20Wind%20Turbines%20Make%20Sound,blades%20moving%20through%20the%20air (accessed on 21 July 2023).
Disclaimer/Publisher’s Note: The statements, opinions and data contained in all publications are solely those of the individual author(s) and contributor(s) and not of MDPI and/or the editor(s). MDPI and/or the editor(s) disclaim responsibility for any injury to people or property resulting from any ideas, methods, instructions or products referred to in the content. |
© 2023 by the authors. Licensee MDPI, Basel, Switzerland. This article is an open access article distributed under the terms and conditions of the Creative Commons Attribution (CC BY) license (https://creativecommons.org/licenses/by/4.0/).

