Abstract
Type 2 Diabetes (T2D) is a prevalent metabolic disease with a strong association with cardiovascular complications. This study evaluated glycemic control and lipid profiles (total cholesterol, low-density lipoprotein cholesterol, high-density lipoprotein cholesterol, and triglycerides) in patients with T2D, based on glycated hemoglobin and fasting glucose levels, through a cross-sectional analysis of 4814 individuals (mean age: 66.2 ± 16.07 years with normal distribution; 51.5% male) from the Hospital Universitario Lucus Augusti in Northwest Spain. The aim was to assess the metabolic differences and potential influences of age, sex, and geographic setting. We observed that patients with T2D had lower low-density lipoprotein cholesterol, but higher triglycerides and high-density lipoprotein cholesterol levels compared to patients without T2D. A positive correlation was found between age and fasting glucose levels (r = 0.182; p < 0.05), with the highest glucose concentrations occurring in postmenopausal women. No significant differences were observed between rural and urban participants. These findings support the integration of targeted nutritional strategies and education programs in the clinical management of T2D, particularly in older adults.
1. Introduction
Diabetes mellitus (DM) is a chronic metabolic disorder characterized by persistent hyperglycemia due to defects in insulin secretion, insulin action, or both. According to the World Health Organization (WHO), over 422 million people suffer from diabetes worldwide, with an estimated 1.5 million deaths annually [1,2]. The global rise in diabetes, especially in middle- and high-income countries, has made it one of the leading causes of mortality [2].
In Spain, the reported prevalence varies significantly depending on diagnostic criteria. While the WHO estimates a prevalence of 6.7%, the American Diabetes Association (ADA) criteria suggest figures closer to 14%, highlighting a high number of undiagnosed or poorly managed cases [3]. Obesity is one of the most significant modifiable risk factors for the development of type 2 diabetes (T2D) and its complications [3]. Clinically, it is associated with increased insulin resistance, systemic inflammation, and beta-cell dysfunction. In Spain, the prevalence of adult obesity is estimated at approximately 21.6%, with rates exceeding 25% in older populations [3]. Importantly, the coexistence of obesity and diabetes, often referred to as “diabesity”, is present in more than 50% of adults with T2D, representing a substantial burden for public health and healthcare systems alike. [4,5].
1.1. Pathophysiology and Risk Factors for Type 2 Diabetes
T2D is a multifactorial disease involving genetic predisposition and modifiable lifestyle factors, such as obesity, sedentary behavior, and poor dietary habits [6,7]. Genome-wide association studies have identified over 150 genetic loci linked to increased T2D risk, though the underlying mechanisms remain under investigation [8]. Diets rich in saturated fats and refined carbohydrates exacerbate insulin resistance and hyperglycemia [9]. Visceral adiposity further contributes to metabolic dysfunction through chronic low-grade inflammation and ectopic fat accumulation [10].
T2D significantly increases the risk of complications, particularly cardiovascular disease (CVD), which remains the leading cause of morbidity and mortality in this population [11,12]. In addition, glycemic variability and dyslipidemia—such as elevated triglycerides (TG), low high-density lipoprotein (HDL) cholesterol, and small dense low-density lipoprotein (LDL) particles—are associated with endothelial dysfunction and atherogenesis [13]. Variability in lipid levels has also been independently linked to cardiovascular events and all-cause mortality [14].
Other metabolic abnormalities, such as hypertension and hyperuricemia, worsen the cardiometabolic profile and long-term prognosis of T2D patients [15]. Comprehensive management involving both pharmacological and lifestyle interventions is essential to reduce complications and to improve quality of life.
1.2. Diabetes and Cardiovascular Disease
The association between T2D and CVD is well established. Diabetic individuals face a two- to four-fold increased risk of CVD due to metabolic, inflammatory, and hemodynamic disturbances [6,12,16,17]. Notably, heart failure is a prevalent complication, even in the absence of coronary artery disease, attributed to diabetic cardiomyopathy [16,17].
Diabetic patients also experience poorer outcomes after cardiovascular events, including higher rates of rehospitalization and mortality [16]. While the overall burden has declined in recent years due to better risk factor control, maintaining adequate glycemic control remains a key target. Even modest reductions in glycated hemoglobin (HbA1c) are associated with significant reductions in cardiovascular events [18].
1.3. Importance of Therapeutic Education and Therapeutic Attention and Education Programs
Therapeutic education and structured programs, known as therapeutic education and support programs in Spain, play a central role in T2D self-management. These interventions enhance patient understanding, promote behavioral change, and improve treatment adherence [19,20,21]. The evidence supports their impact on long-term outcomes, with participants achieving improved glycemic control, self-efficacy, and quality of life [22,23].
Moreover, patient empowerment is a critical outcome of education programs, giving individuals the confidence to take an active role in managing their disease [24,25]. Multidisciplinary approaches involving dietitians, nutritionists, and T2D educators have demonstrated success in implementing personalized, sustainable lifestyle changes [23,26,27], ultimately reducing complications and healthcare costs [28,29].
1.4. Regional Dietary Habits and Eating Patterns in Northwest Spain
In Galicia (Northwest Spain), traditional dietary patterns based on the Southern Europe Atlantic Diet (SEAD) have demonstrated metabolic health benefits [30]. The SEAD emphasizes fish, legumes, vegetables, fruits, and seasonal foods. The GALIAT clinical trial showed that adherence to the SEAD improves lipid profiles, lowers body mass index (BMI), and increases HDL while reducing LDL and TG [31].
The high intake of omega-3 fatty acids from fish provides anti-inflammatory effects that may benefit individuals with T2D [32]. Additionally, the SEAD promotes sustainability by encouraging local and seasonal consumption [33]. Considering its potential impact, SEAD-based interventions could play a significant role in both T2D prevention and management [34].
The objective of this study is to examine the relationship between glycemic control, lipid profile, and CVD risk among diabetic patients in Lugo, Galicia. Using a cross-sectional population-based approach with 4800 subjects, we also assess the influence of regional dietary and lifestyle patterns on metabolic health outcomes.
2. Materials and Methods
2.1. Study Design
An epidemiological, cross-sectional study involving both diabetic and nondiabetic patients who were referred to the Endocrinology Department of the HULA during the year 2023 was conducted. This study included outpatients referred to the Clinical Laboratory of the Lucus Augusti University Hospital (HULA) during 2023 for routine analyses. Patients were not hospitalized nor classified by inpatient ward and, therefore, no stratification by hospital department was applicable.
All the data were collected and processed in a dissociated manner, ensuring that patient identities could not be accessed outside the HULA facilities, in compliance with Spanish data protection regulations. The variables collected for analysis included age, sex, residential environment (urban or rural), HbA1c, fasting blood glucose, total cholesterol (TC), HDL, LDL, and TG.
2.2. Procedure, Instruments and Measurements
Blood and urine samples were collected by qualified nursing staff in accordance with the standard protocols established at the HULA. All clinical analyses were conducted in the hospital’s central laboratory via fully automated analyzers and in compliance with the ISO 15189:2012 quality standards for medical laboratories [35].
Demographic and clinical data were retrieved from the electronic health record system IANUS®, which is used throughout the Galician public healthcare network to support the delivery and coordination of medical services.
At the Clinical Analysis Service of the HULA, blood and urine samples were collected from patients for the determination of glucose levels, HbA1c, and a complete lipid profile, including TC, HDL, LDL, and TG. All the analyses were carried out in-house by certified laboratory personnel via standardized procedures and validated equipment.
In addition, basic demographic variables—including sex, age, and place of residence—were recorded during the endocrinology consultations. The geographical origin of the referral (city of Lugo vs. surrounding areas) was specifically noted to assess potential urban–rural differences in the study population.
2.3. Population and Samples
Patients were taken from the electronic health records of individuals who attended the Clinical Analysis Service at the HULA for routine laboratory testing in February 2023. All patients who met the established requirements and gave their express consent were included in this study. An initial dataset comprising 4925 individual patient records was collected. After removing duplicate entries to avoid statistical bias, the dataset was reduced to 4814 unique patients. Only individuals for whom both HbA1c and fasting glucose levels were simultaneously available from a single blood test were included in the final analysis. Patients were excluded if they lacked either of these measurements or had multiple blood test records within the study period to ensure consistency and comparability of the data. The classification of patients with T2D was based on HbA1c values, utilizing a threshold of >6.5% as a diagnostic criterion in accordance with current clinical guidelines [20]. This decision was based on the unreliability of fasting status among patients, as noncompliance with fasting prior to blood sampling compromised the diagnostic accuracy of fasting plasma glucose.
A total of 4814 individuals met the inclusion criteria, with a mean age of 66.19 ± 16.07 years. Among these, 51.5% were male, and 48.5% were female. Notably, 85.13% of the sample (n = 4098) were over the age of 50, reflecting a predominantly older population. This age distribution mirrors the demographic profile of the Lugo region, which is characterized by a high degree of population aging due to low birth rates and the emigration of younger individuals.
The classification of the participants’ residence as urban or rural was based on criteria established by the Galician Health Service (SERGAS). Specifically, municipalities with populations exceeding 10,000 inhabitants or serving as administrative or healthcare hubs were considered urban, while those below this population threshold were designated as rural.
To contextualize the findings, the study sample was compared with demographic data from the general population of Lugo. The province is recognized as having one of the oldest populations in Spain, with a substantial proportion of residents over 65 years of age. The advanced mean age in the study cohort underscores the relevance of chronic disease management and the increasing need for targeted healthcare services in aging populations.
Although individuals under 18 years of age were included, their proportion was small and reflects the general population accessing hospital laboratory services. We acknowledge that glycemic control during adolescence is influenced by pubertal changes; however, due to the cross-sectional nature of this study and the limited sample size in this subgroup, no separate pediatric stratification was conducted. This is recognized as a limitation in the interpretation of age-related trends.
2.4. Statistical Analysis
All the statistical analyses were conducted via Microsoft Excel (Microsoft, Mountain View, CA, USA) and the Addinsoft XLSTAT Statistical and Data Analysis Solution (Long Island, NY, USA, 2019). The analytical approach was designed to provide a comprehensive evaluation of the dataset, combining descriptive statistics, inferential comparisons, and correlation analyses.
First, a descriptive analysis was performed to characterize the study population. Measures of central tendency were calculated for continuous variables, such as age, whereas categorical variables, such as sex, T2D status, and place of residence (urban vs. rural), were summarized using frequencies and percentages. Measures of dispersion, such as standard deviation, were also computed to assess the variability of the data across different subgroups.
To evaluate the differences between the key demographic and the clinical groups, inferential statistical tests were applied. Student’s t test was used to compare the mean values of two independent groups, such as male versus female participants and patients with DM versus patients without DM. This allowed for the identification of significant differences in parameters such as glycemic and lipid profiles across these subpopulations.
Additionally, correlation analyses were carried out to examine the strength and direction of associations between continuous variables. Pearson’s correlation coefficient (r) was used to assess the relationships between glycemia and other variables, such as age, TC, and TG, as well as between TC and both HDL and LDL cholesterol levels. A significance value (p) of less than 0.05 was considered statistically significant for all analyses.
3. Results and Discussion
3.1. Data Selection and Patient Demographics
Among the 1500 patients with DM identified, the mean age was significantly higher than that of the non-DM individuals (72.1 ± 11.5 years vs. 63.4 ± 17.2 years; p < 0.001), reflecting the age-related increase in T2D prevalence. Regarding sex distribution, 53.2% of patients with DM were male compared to 50.5% of the non-DM participants, a difference that did not reach statistical significance (p = 0.08). Unfortunately, BMI data were not consistently recorded across the dataset and thus could not be included in the comparative analysis. The observed age differences suggest that age may act as a confounder in subsequent comparisons of the metabolic parameters, and should be considered when interpreting group differences.
The mean age across the total sample was 66.19 ± 16.07 years, indicating a broad age distribution. Of the 4814 patients included, 2790 (58%) were aged 65 years or older, reflecting a predominantly older population—a demographic typically associated with increased CVD risk.
The prevalence of T2D identified in this hospital-based cohort (31.2%) was considerably higher than the estimated prevalence in the general adult population in Spain, which is approximately 14.8% [36]. This disparity is likely due to the nature of the hospital setting, where patients often present with more complex health conditions and a greater burden of comorbidities [37].
The use of HbA1c as a diagnostic criterion is consistent with international guidelines, particularly when fasting cannot be reliably ensured [38]. Unlike fasting plasma glucose, HbA1c reflects long-term glycemic exposure, and is less influenced by acute fluctuations or patient preparation, making it a more stable marker in routine clinical practice [39]. However, certain conditions, such as anemia, chronic kidney disease, or hemoglobinopathies—which are more common in older adults—can impact HbA1c accuracy [40].
The predominance of older individuals in this sample further highlights the increased vulnerability of this age group to developing T2D and related complications. Aging is associated with physiological changes that contribute to insulin resistance and impaired pancreatic beta-cell function, increasing T2D risk [41]. Furthermore, older adults face unique challenges in T2D management, including polypharmacy, cognitive decline, reduced physical function, and social isolation, all of which can affect adherence to treatment [42].
In this context, although our hospital provides basic educational resources through the Endocrinology and Nutrition Departments, no structured therapeutic education program is currently implemented. We recognize this as an opportunity for institutional improvement. Structured education programs have been shown to improve self-care behaviors, adherence, and metabolic outcomes [22,23,25]. These findings support the potential value of implementing such initiatives in our healthcare setting.
3.2. Age Stratification and Prevalence of Diabetes
Figure 1 illustrates the prevalence of T2D across distinct age brackets. A marked increase in T2D incidence was observed with advancing age. Among patients under 50 years of age (n = 766), 16.6% were patients with DM. This prevalence increased to 30.3% in those aged 50–64 years (n = 1258), 34.4% among patients aged 65–74 years (n = 1063), 35.8% in those aged 75–84 years (n = 1015), and 38.9% in those aged ≥ 85 years (n = 712). Overall, 1373 of the 4048 patients aged over 50 years (33.9%) had HbA1c levels indicative of T2D, confirming the strong age-related gradient of disease incidence.
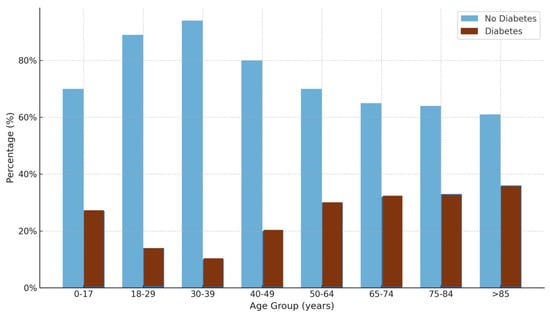
Figure 1.
Percentages of individuals with and without diabetes across different age groups. The light blue bars represent individuals without diabetes, whereas the dark dark red bars represent individuals with diabetes. The percentages are shown on the y-axis, and the age groups are shown on the x-axis.
This pattern is consistent with epidemiological evidence showing that the risk of T2D increases significantly with age, largely due to physiological changes, such as declining beta-cell function, increasing insulin resistance, and the accumulation of comorbidities [42,43]. The particularly steep increase in prevalence among individuals over 65 years of age underscores the high metabolic vulnerability of older adults, a population often underdiagnosed or undertreated owing to atypical symptom presentation and overlapping geriatric syndromes [38].
Furthermore, studies have shown that undiagnosed T2D is common in elderly populations, suggesting that the true prevalence may be even higher than previously reported [44]. The increasing trend observed in the ≥85 age group aligns with findings from the National Health and Nutrition Examination Survey (NHANES), which reported similarly elevated T2D rates in the oldest old individuals [45]. These data collectively reinforce the need for proactive screening and individualized management strategies that address the unique challenges of aging individuals with diabetes, including frailty, polypharmacy, and increased CVD risk [43].
3.3. Lipid Profile Characteristics
Patients with DM presented notably lower levels of TC compared to nondiabetic individuals. The mean TC concentration in diabetic patients was 160.88 ± 41.77 mg/dL, whereas in nondiabetic patients it was 177.46 ± 41.74 mg/dL. In terms of distribution, the median TC values were 158 mg/dL for patients with DM (interquartile range, (IQR): 131–188 mg/dL) and 177 mg/dL for nondiabetic patients (IQR: 149–205 mg/dL) (Figure 2). This is compatible with those previously reported, that there is not a clear relation between T2D and TC serum levels [45].
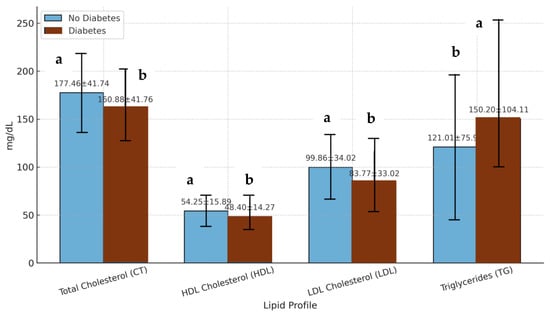
Figure 2.
Lipid profile parameters in individuals with and without diabetes. The values are expressed as the mean values ± standard deviations. The light blue bars represent individuals without diabetes, and the dark red bars represent individuals with diabetes. CT: total cholesterol; HDL: high-density lipoprotein cholesterol; LDL: low-density lipoprotein cholesterol; TG: triglyceride. a,b: Different letters in the columns denote statistically significant differences (p < 0.05).
The median TC values were 158 mg/dL for patients with DM and 177 mg/dL for non-DM patients, with interquartile ranges of 131–188 mg/dL and 149–205 mg/dL, respectively. Similarly, the mean LDL concentration was lower in patients with DM (83.77 ± 33.02 mg/dL) than in non-DM patients (99.86 ± 34.02 mg/dL). Notably, over 70% of patients with DM have LDL levels below the 100 mg/dL threshold recommended for individuals at high CVD risk [46,47]. These findings may reflect both a higher rate of pharmacological lipid management, particularly the use of statins, and metabolic changes intrinsic to T2D, including altered lipoprotein metabolism. However, it is important to acknowledge that this study did not include data on medication use, which limits the ability to isolate the effects of pharmacological treatment on lipid profiles.
In contrast to the favorable LDL profile, patients with DM exhibited a more atherogenic pattern in terms of HDL and TG. The mean HDL level in patients with DM was 48.40 ± 14.27 mg/dL, which was significantly lower than the 54.25 ± 15.89 mg/dL observed in non-DM individuals. The median HDL values were 45 mg/dL and 51 mg/dL, respectively. With respect to TG, patients with DM presented markedly elevated levels, with a mean of 150.48 ± 103.24 mg/dL, in comparison with 121.01 ± 75.93 mg/dL in nondiabetic patients. This difference reached high statistical significance (p < 0.01) when assessed with Student’s t test. These results are consistent with the well-described diabetic dyslipidemia pattern, which is typically characterized by elevated TG and reduced HDL, both of which are strongly associated with increased CVD risk [48,49]. Garjardo-Navarrete et al. [50] showed that diabetic patients without previous myocardial infarction (MI) have a similar risk of coronary heart disease mortality as nondiabetic individuals with prior MI, underscoring the heavy cardiovascular burden of T2D.
Participants (n = 4779) were classified by diabetes status (HbA1c > 6.5%) and hyperlipidemia (total cholesterol ≥ 200 mg/dL). Of these, 4.54% (n = 217) had both T2D and hyperlipidemia; 23.71% (n = 1133) had T2D alone; 20.23% (n = 967) had hyperlipidemia alone; and 51.52% (n = 2462) had neither condition. This stratification complements the continuous lipid profile data presented above and highlights the clinical overlap between dyslipidemia and T2D in our cohort.
3.4. Correlation Analysis
A Pearson’s correlation analysis revealed a weak but statistically significant inverse relationship between glucose and TC levels (r = −0.121; p < 0.01; n = 4508), suggesting that increased blood glucose levels may be associated with lower cholesterol concentrations. By contrast, the association between glucose and TG levels was positive and stronger (r = 0.2097; p < 0.01), indicating a trend toward hypertriglyceridemia in patients with higher glucose levels.
Moreover, when patients were stratified by HbA1c categories (<6.5%, 6.5–8%, and ≥8%), a clear ascending pattern of TG levels was evident (Figure 3). Individuals with poorer glycemic control presented significantly higher TG concentrations. This finding reinforces the hypothesis that hyperglycemia contributes to, or is at least associated with, worsening lipid parameters, potentially serving as a surrogate marker of disease progression or suboptimal metabolic management [51].
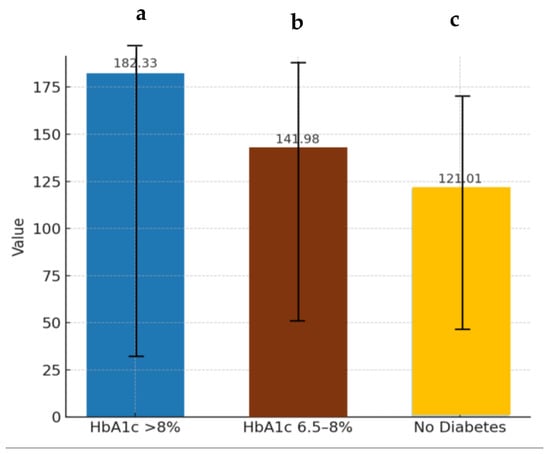
Figure 3.
Triglyceride levels in relation to glycated hemoglobin values. TG: triglyceride; HbA1c: glycated hemoglobin. a–c: Different letters in the columns denote statistically significant differences (p < 0.05).
3.5. Geographic and Sex-Based Variations
When stratified by residence, 2894 patients (60.1%) lived in urban settings, and 1919 (39.9%) lived in rural areas. The proportion of individuals aged 65 years or older was comparable in both groups (urban: 57.3%, rural: 59.0%), and the overall metabolic differences were minimal. The mean values of TC and TG varied only slightly between rural and urban patients, differing by 1.63 mg/dL and 4.04 mg/dL, respectively (Figure 4), indicating that area of residence, in isolation, does not exert a major influence on lipid profiles in this cohort.
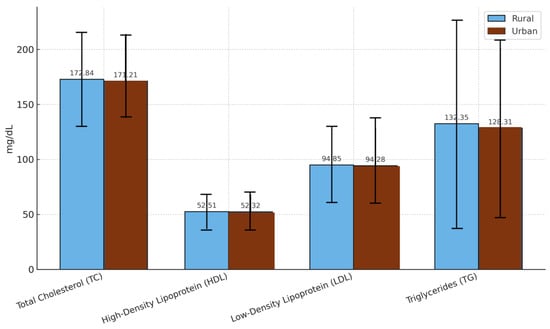
Figure 4.
Comparison of lipid profile parameters between rural and urban populations. The data are presented as the mean values ± standard deviations. TC: total cholesterol; HDL: high-density lipoprotein; LDL: low-density lipoprotein; TG: triglycerides.
However, more detailed analysis by sex and age revealed subtle distinctions. Among women aged 65 years and older, those residing in urban areas had marginally better glycemic and lipid parameters, with lower average glucose (145.94 ± 45.20 mg/dL) and TG (148.64 ± 71.00 mg/dL) values than their rural counterparts (glucose: 156.80 ± 76.36 mg/dL; TG: 155.70 ± 109.67 mg/dL) (Figure 5).
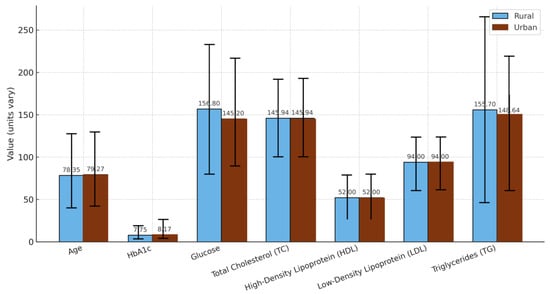
Figure 5.
Comparison by origin in women with diabetes mellitus over 65 years of age. The graph shows the mean values ± standard deviations for age, HbA1c: glycated hemoglobin, glucose, TC: total cholesterol, HDL: high-density lipoprotein, LDL: low-density lipoprotein, and TG: triglycerides in rural and urban populations.
Conversely, urban men in the same age group presented slightly worse metrics than rural men (Figure 6), although these differences were modest and did not reach statistical significance. These findings suggest that, contrariwise to other works, geographic location may not significantly affect T2D rate [52]. Contrariwise, in agreement with other works, both sex and age modify disease expression in more nuanced ways [53].
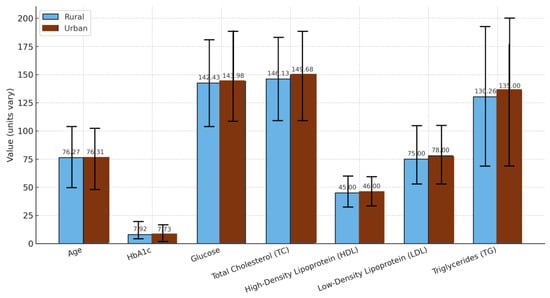
Figure 6.
Comparison by origin in men with diabetes mellitus over 65 years of age. The graph shows the mean values ± standard deviations for age, HbA1c: glycated hemoglobin, glucose, TC: total cholesterol, HDL: high-density lipoprotein, LDL: low-density lipoprotein, and TG: triglycerides in rural and urban populations.
3.6. Glucose Trends by Age and Sex
A mild but statistically significant correlation between age and glucose level was detected (r = 0.182, p = 0.041), suggesting a trend toward increasing glycemia with increasing age. However, further stratification by sex revealed divergent trajectories.
Specifically, in women, both glucose levels markedly increased beginning at approximately age 50 (Figure 7).
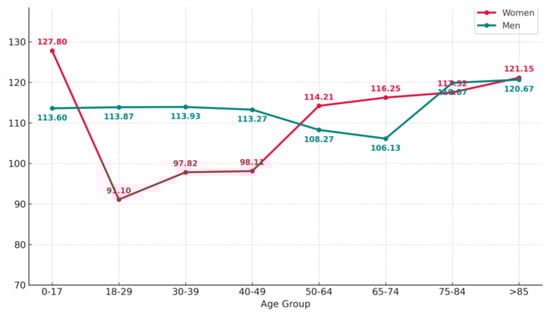
Figure 7.
Fasting blood glucose values by age group and sex. The graph shows the mean fasting blood glucose levels (mg/dL) across age groups, comparing male and female patients.
A similar trend was observed for HbA1c, although in this case in all age groups the HbA1c values obtained for woman were lower than those obtained for men except in the over 85 years old group (Figure 8).
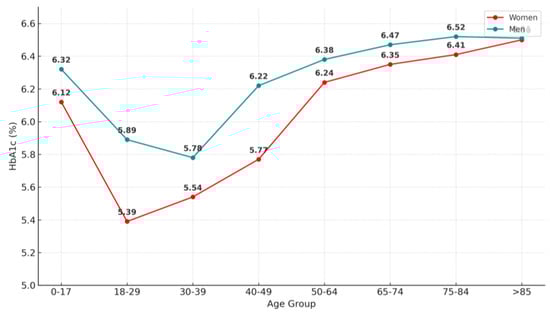
Figure 8.
Mean glycated hemoglobin (HbA1c) values by age group and sex.
This pattern coincides with the typical age of the onset of menopause, during which a decline in estrogen levels is known to contribute to increased insulin resistance, visceral adiposity, and unfavorable changes in body composition. These physiological alterations, compounded by age-related declines in physical activity and muscle mass, likely explain the observed metabolic worsening in postmenopausal women [54].
Estrogen deficiency has been shown to impair insulin sensitivity and glucose homeostasis through various mechanisms, including alterations in adipokine secretion and reductions in mitochondrial function [55,56]. Moreover, studies using the NHANES data have demonstrated a greater prevalence of undiagnosed T2D among postmenopausal women, underscoring the importance of targeted screening strategies in this population [57].
These findings are further supported by longitudinal evidence indicating that menopause is an independent risk factor for the development of T2D, even after adjusting for age, BMI, and lifestyle factors [58,59]. Taken together, the intersection of hormonal, behavioral, and age-related factors appears to significantly shape the glycemic trajectory in aging women.
As men and women age, the metabolic differences typically seen between the sexes tend to diminish. This convergence may be driven in part by declining levels of sex hormones in both sexes. In women, menopause leads to a significant drop in estrogen levels, which is associated with increased visceral adiposity, insulin resistance, and dyslipidemia. In men, aging is accompanied by a gradual decrease in testosterone, which has also been linked to reduced muscle mass, increased fat accumulation, and impaired glucose metabolism. These hormonal shifts may explain why glycemic and lipid markers tend to align more closely between older men and women [60].
4. Limitations
This study presents some limitations that must be acknowledged. First, due to the nature of the hospital-based dataset and the use of the IANUS® electronic health record system, we were unable to access information related to patients’ socioeconomic status, such as income level or educational background. These factors are known to influence health behaviors, access to care, and metabolic outcomes, and their absence may limit the scope of the analysis. Future studies incorporating these variables could offer a more comprehensive understanding of the relationship between socioeconomic determinants and T2D-related outcomes.
Although the SEAD is traditionally associated with the Galician region, we recognize that its current adherence levels, particularly among younger individuals, may be declining due to dietary westernization. Our study did not include direct dietary assessments, so we are unable to quantify adherence to the SEAD within our sample. Therefore, references to the SEAD in this work are based on the existing literature and cultural context, rather than participant-specific dietary data. Future studies should include validated tools to objectively evaluate adherence to traditional dietary patterns in different demographic groups.
Another important limitation of this study is the lack of information regarding lipid-lowering therapies, such as statins, which may significantly influence LDL cholesterol levels and confound comparisons between patients with DM and patients without DM.
One further limitation of this study is the inclusion of adolescents, whose glycemic regulation is subject to pubertal hormonal fluctuations and growth-related variability. While their proportion in the total sample was small, future studies may benefit from dedicated pediatric analyses or exclusion of this group to enhance comparability. Additionally, menopausal status was approximated using age 50 as a population-level proxy, which does not capture interindividual variation.
5. Conclusions
This study has examined the current evidence on lipid profile evaluation in patients with DM, the significance of nutrition in T2D management, and the eating habits specific to the Galician region.
Data from over 4800 individuals at the HULA revealed that glucose levels were positively associated with age, particularly among postmenopausal women. Patients with DM generally have lower total and LDL cholesterol levels but higher TG levels than nondiabetic patients, indicating the importance of comprehensive metabolic monitoring. Interestingly, no significant differences were observed between rural and urban populations, suggesting that lifestyle differences in these areas may not strongly influence lipid or glucose parameters.
Author Contributions
Conceptualization, A.L.-S. and J.M.M.; methodology, A.L.-S. and J.M.M.; writing—original draft preparation, F.B.-G., N.N.-R. and V.M.-V.; writing—review and editing, A.L.-S., J.M.C.d.R. and J.M.M.; visualization, A.L.-S. and J.M.M.; supervision, A.L.-S.; project administration, J.M.M. All authors have read and agreed to the published version of the manuscript.
Funding
Aroa Lopez-Santamarina is grateful for a predoctoral grant funded by the Universidade de Santiago de Compostela (USC), Campus Terra, Lugo, (Contratos predoutorais do campus de especialización Campus Terra).
Institutional Review Board Statement
Comité de Ética de la Iinvestigación de Santiago-Lugo, Approval Code: 2018/270, approved on 17/09/2019.
Informed Consent Statement
Informed consent was obtained from all subjects involved in this study. The trial was authorized by the Galician Bioethics Committee (trial 270/2018).
Data Availability Statement
Not applicable.
Acknowledgments
The authors would like to thank Hospital Universitario Lucus Augusti for their support and collaboration during the conduct of this study.
Conflicts of Interest
The authors declare that they have no conflicts of interest.
References
- World Health Organization. Diabetes; WHO: Geneva, Switzerland, 2022; Available online: https://www.who.int/health-topics/diabetes#tab=tab_1 (accessed on 17 October 2024).
- World Health Organization. The Top 10 Causes of Death; WHO: Geneva, Switzerland, 2019; Available online: https://www.who.int/es/news-room/fact-sheets/detail/the-top-10-causes-of-death (accessed on 17 October 2024).
- Menéndez Torre, E.L.; Ares Blanco, J.; Conde Barreiro, S.; Rojo Martínez, G.; Delgado Álvarez, E.; Grupo de Epidemiología de la Sociedad Española de Diabetes. Prevalencia de diabetes mellitus en 2016 en España según la base de datos clínicos de atención primaria (BDCAP). Endocrinol. Diabetes Nutr. 2021, 68, 109. [Google Scholar] [CrossRef]
- Hamdy, O.; Tasabehji, M.W.; Elseaidy, T.; Tomah, S.; Ashrafzadeh, S.; Mottalib, A. Fat versus carbohydrate-based energy-restricted diets for weight loss in patients with type 2 diabetes. Curr. Diab. Rep. 2018, 18, 128. [Google Scholar] [CrossRef]
- De-La-Vega, D.; Morquecho-Nava, J.; Isidro-Perez, O.; Ramírez-Girón, N. Análisis del concepto “Diabesidad”. Index Enferm. 2022, 31, 289–293. [Google Scholar] [CrossRef]
- Einarson, T.R.; Acs, A.; Ludwig, C.; Panton, U.H. Prevalence of cardiovascular disease in type 2 diabetes: A systematic literature review of scientific evidence from across the world in 2007–2017. Cardiovasc. Diabetol. 2018, 17, 83. [Google Scholar] [CrossRef] [PubMed]
- Ali, O. Genetics of type 2 diabetes. World J. Diabetes 2013, 4, 114–123. [Google Scholar] [CrossRef] [PubMed]
- Mahajan, A.; Taliun, D.; Thurner, M.; Robertson, N.R.; Torres, J.M.; Rayner, N.W.; Payne, A.J.; Steinthorsdottir, V.; Scott, R.A.; Grarup, N.; et al. Fine-mapping type 2 diabetes loci to single-variant resolution using high-density imputation and islet-specific epigenome maps. Nat. Genet. 2018, 50, 1505–1513. [Google Scholar] [CrossRef]
- Ley, S.H.; Hamdy, O.; Mohan, V.; Hu, F.B. Prevention and management of type 2 diabetes: Dietary components and nutritional strategies. Lancet 2014, 383, 1999–2007. [Google Scholar] [CrossRef]
- Arneth, B. Mechanisms of insulin resistance in patients with obesity. Endocrines 2024, 5, 153–165. [Google Scholar] [CrossRef]
- La Sala, L.; Prattichizzo, F.; Ceriello, A. The link between diabetes and atherosclerosis. Eur. J. Prev. Cardiol. 2019, 26, 15–24. [Google Scholar] [CrossRef]
- Rawshani, A.; Rawshani, A.; Franzén, S.; Sattar, N.; Eliasson, B.; Svensson, A.M.; Zethelius, B.; Miftaraj, M.; McGuire, D.K.; Rosengren, A.; et al. Risk factors, mortality, and cardiovascular outcomes in patients with type 2 diabetes. N. Eng. J. Med. 2018, 379, 633–644. [Google Scholar] [CrossRef]
- Moore, J.X.; Chaudhary, N.; Akinyemiju, T. Metabolic syndrome prevalence by race/ethnicity and sex in the United States, National Health and Nutrition Examination Survey, 1988–2012. Prev. Chronic Dis. 2020, 14, E24. [Google Scholar] [CrossRef]
- Kim, M.K.; Han, K.; Park, Y.M.; Kwon, H.S.; Kang, G.; Yoon, K.-H.; Lee, S.-H. Associations of variability in blood pressure, glucose and cholesterol concentrations, and body mass index with mortality and cardiovascular outcomes in the general population. Circulation 2018, 138, 2627–2637. [Google Scholar] [CrossRef]
- Chakraborty, S.; Verma, A.; Garg, R.; Singh, J.; Verma, H. Cardiometabolic risk factors associated with type 2 diabetes mellitus: A mechanistic insight. Clin. Med. Insights Endocrinol. Diabetes 2023, 16, 11795514231220780. [Google Scholar] [CrossRef]
- Shah, A.D.; Langenberg, C.; Rapsomaniki, E.; Denaxas, S.; Pujades-Rodriguez, M.; Gale, C.P.; Deanfield, J.; Smeeth, L.; Timmis, A.; Hemingway, H. Type 2 diabetes and incidence of cardiovascular diseases: A cohort study in 1.9 million people. Lancet Diabetes Endocrinol. 2015, 3, 105–113. [Google Scholar] [CrossRef] [PubMed]
- Jia, G.; Hill, M.A.; Sowers, J.R. Diabetic cardiomyopathy: An update of mechanisms contributing to this clinical entity. Circulation Res. 2018, 122, 624–638. [Google Scholar] [CrossRef]
- Stratton, I.M.; Adler, A.I.; Neil, H.A.; Matthews, D.R.; Manley, S.E.; Cull, C.A.; Hadden, D.; Turner, R.C.; Holman, R.R. Association of glycaemia with macrovascular and microvascular complications of type 2 diabetes (UKPDS 35): Prospective observational study. BMJ 2000, 321, 405–412. [Google Scholar] [CrossRef] [PubMed]
- Spanish Diabetes Society SED. 1954. Available online: https://www.sediabetes.org/ (accessed on 26 October 2024).
- Spanish Heart Foundation FEC. 1967. Available online: https://fundaciondelcorazon.com/ (accessed on 26 October 2024).
- Martorell, M.; Opazo, M.; Ramírez-Alarcón, K.; Labraña, A.M.; Nazar, G.; Villagrán, M.; Mardones, L.; Concha-Cisternas, Y.; Díaz-Toro, F.; Lanuza, F.; et al. Prevalencia de prediabesidad y diabesidad en Chile: Resultados de la Encuesta Nacional de Salud 2016–2017. Rev. Med. Chil. 2024, 152, 178–186. [Google Scholar] [CrossRef]
- Peyrot, M.; Rubin, R.R.; Lauritzen, T.; Skovlund, S.E.; Snoek, F.J.; Matthews, D.R.; Landgraf, R.; Kleinebreil, L.; International DAWN Advisory Panel. Resistance to insulin therapy among patients and providers: Results of the cross-national Diabetes Attitudes, Wishes, and Needs (DAWN) study. Diabetes Care 2005, 28, 2673–2679. [Google Scholar] [CrossRef]
- Chrvala, C.A.; Sherr, D.; Lipman, R.D. Diabetes self-management education for adults with type 2 diabetes mellitus: A systematic review of the effect on glycemic control. Patient Educ. Couns. 2016, 99, 926–943. [Google Scholar] [CrossRef]
- Riddell, M.C.; Zaharieva, D.P.; Yavelberg, L.; Cinar, A.; Jamnik, V.K. Exercise and the development of the artificial pancreas: One of the more difficult series of hurdles. J. Diabetes Sci. Technol. 2015, 9, 1217–1226. [Google Scholar] [CrossRef]
- Anderson, R.M.; Funnell, M.M. Patient empowerment: Myths and misconceptions. Patient Educ. Couns. 2010, 79, 277–282. [Google Scholar] [CrossRef]
- American Diabetes Association ADA. 1939. Available online: https://diabetes.org/es/vivir-con-diabetes/tratamiento-cuidado/hiperglucemia (accessed on 28 October 2024).
- Delahanty, L.M.; Nathan, D.M.; Lachin, J.M.; Hu, F.B.; Cleary, P.A.; Ziegler, G.K.; Wylie-Rosett, J.; Wexler, D.J. Diabetes control and complications Trial/Epidemiology of diabetes. Association of diet with glycated hemoglobin during intensive treatment of type 1 diabetes in the Diabetes Control and Complications Trial. Am. J. Clin. Nutr. 2009, 89, 518–524. [Google Scholar] [CrossRef] [PubMed]
- Refardt, J.; Winzeler, B.; Christ-Crain, M. Diabetes insipidus: An update. Endocrinol. Metab. Clin. North Am. 2020, 49, 517–531. [Google Scholar] [CrossRef] [PubMed]
- Refardt, J.; Winzeler, B.; Christ-Crain, M. Diabetes self-management education and support in adults with type 2 diabetes: A consensus report. Diabetes Educ. 2020, 46, 350–369. [Google Scholar] [CrossRef] [PubMed]
- Roca-Saavedra, P.; Mariño-Lorenzo, P.; Miranda, J.M.; Porto-Arias, J.J.; Lamas, A.; Vazquez, B.I.; Franco, C.M.; Cepeda, A. Phytanic acid consumption and human health, risks, benefits and future trends: A review. Food Chem. 2017, 221, 237–247. [Google Scholar] [CrossRef]
- Franch-Nadal, J.; Roura-Olmeda, P.; Benito-Badorrey, B.; Rodriguez-Poncelas, A.; Coll-de-Tuero, G.; Mata-Cases, M.; GEDAPS (Grupo de Atención Primaria para el estudio de la Diabetes). Control metabólico y factores de riesgo cardiovascular en pacientes con diabetes mellitus tipo 2 según la duración de la diabetes. Medic. Fam. 2015, 1, 27–34. [Google Scholar]
- Guisado-Barral, B.; Chacón-Vargas, K.A.; Andrés-Rodríguez, N.F.; Fornos-Pérez, J.A.; Mera-Gallego, R.; Busto-Domínguez, I.; Mera-Gallego, I.; León-Rodríguez, L. Dispositivos de monitorización continua de glucosa en mayores de 65 años: Revisión bibliográfica (Continuous glucose monitoring devices in people over 65 years: Literature review). Farm. Comunitarios 2024, 16, 29–42. [Google Scholar] [CrossRef]
- Gedawy, A.; Martinez, J.; Al-Salami, H.; Dass, C.R. Oral insulin delivery: Existing barriers and current counter-strategies. J. Pharm. Pharmacol. 2018, 70, 197–213. [Google Scholar] [CrossRef]
- Mateu-Salat, M.; Moreno-Fernández, J.; Mangas, N.; Genua, I.; Martínez, M.J.; López, A.; González, C.; Chico, A. Evaluation of the usefulness of and satisfaction with the flash glucose monitoring system (FreeStyle Libre®) guide for use in patients with type 1 diabetes. Endocrinol. Diabetes Nutr. 2021, 24, 316–321. [Google Scholar] [CrossRef]
- ISO 15189:2012; Medical Laboratories—Requirements for Quality and Competence. 3rd ed. International Organization for Standardization: Geneve, Switzerland, 2012.
- International Diabetes Federation. IDF Diabetes Atlas (11th ed.). 2025. Available online: https://idf.org (accessed on 12 January 2025).
- Soriguer, F.; Goday, A.; Bosch-Comas, A.; Bordiú, E.; Calle-Pascual, A.; Carmena, R.; Casamitjana, R.; Castaño, L.; Castell, C.; Catalá, M.; et al. Prevalence of diabetes mellitus and impaired glucose regulation in Spain: The Di@bet.es Study. Diabetologia 2012, 55, 88–93. [Google Scholar] [CrossRef]
- American Diabetes Association. Standards of medical care in diabetes—2023. Diabetes Care 2023, 46, S1–S291. [Google Scholar] [CrossRef]
- Saudek, C.D.; Herman, W.H.; Sacks, D.B.; Bergenstal, R.M.; Edelman, D.; Davidson, M.B. A new look at screening and diagnosing diabetes mellitus. J. Clin. Endocrinol. Metab. 2008, 93, 2447–2453. [Google Scholar] [CrossRef]
- Weykamp, C. HbA1c: A review of analytical and clinical aspects. Ann. Lab. Med. 2013, 33, 393–400. [Google Scholar] [CrossRef]
- Leung, E.; Wongrakpanich, S.; Munshi, M.N. Diabetes Management in the Elderly. Diabetes Spectr. 2018, 31, 245–253. [Google Scholar] [CrossRef]
- Kirkman, M.S.; Briscoe, V.J.; Clark, N.; Florez, H.; Haas, L.B.; Halter, J.B.; Huang, E.S.; Korytkowski, M.T.; Munshi, M.N.; Odegard, P.S.; et al. Consensus Development Conference on Diabetes and Older Adults. Diabetes in older adults: A consensus report. Diabetes Care 2012, 35, 2650–2664. [Google Scholar] [CrossRef]
- Sinclair, A.; Dunning, T.; Rodriguez-Mañas, L. Diabetes in older people: New insights and remaining challenges. Lancet Diabetes Endocrinol. 2015, 3, 275–285. [Google Scholar] [CrossRef]
- Menke, A.; Casagrande, S.; Geiss, L.; Cowie, C.C. Prevalence of and trends in diabetes among adults in the United States, 1988–2012. JAMA 2015, 314, 1021–1029. [Google Scholar] [CrossRef] [PubMed]
- Trisna, C.; Sufiyanti, A.; Nizar, M.; Armal, H.; Lissentiyana, S.; Wardoso, S.; Pramudita, J.J. Total cholestarol and blood sugar levels in type 2 diabetes mellitus patients. Mod. Med. 2024, 31, 337–343. [Google Scholar] [CrossRef]
- García Aguado, M. ¿Cómo medir el colesterol LDL? Carprimaria. 2022. Available online: https://www.carprimaria.com/leer-ci/ldl-colesterol-trigliceridos (accessed on 26 October 2024).
- Fernández-Prendes, C.; Castro Castro, M.J.; Sánchez Navarro, L.; Rapún Mas, L.; Morales-Indiano, C.; Arrobas Velilla, T. Manejo de muestras lipémicas en el Laboratorio Clínico. Adv. Lab. Med. 2023, 4, 16–27. [Google Scholar] [CrossRef]
- González-Juanatey, J.R.; Millán, J.; Alegría, E.; Guijarro, C.; Lozano, J.V.; Vitale, G.C. Prevalence and characteristics of lipid abnormalities in patients treated with statins in primary and secondary prevention in Spain. DYSIS-Spain Study. Rev. Esp. Cardiol. 2011, 64, 286–294. [Google Scholar] [CrossRef]
- Addinsoft. XLSTAT Statistical and Data Analysis Solutions; Addinsoft: New York, NY, USA, 2019. [Google Scholar]
- Gregg, E.W.; Cheng, Y.J.; Srinivasan, M.; Lin, J.; Geiss, L.S.; Albright, A.L.; Imperatore, G. Trends in cause-specific mortality among adults with and without diagnosed diabetes in the USA: An epidemiological analysis of linked national survey and vital statistics data. Lancet 2018, 391, 2430–2440. [Google Scholar] [CrossRef]
- Gonzalez, P.; Lozano, P.; Ros, G.; Solano, F. Hyperglycemia and Oxidative Stress: An Integral, Updated and Critical Overview of Their Metabolic Interconnections. Int. J. Mol. Sci. 2023, 24, 9352. [Google Scholar] [CrossRef]
- McAlexander, T.P.; Malla, G.; Uddin, J.; Lee, D.C.; Schwartz, B.S.; Rolka, D.B.; Siegel, K.R.; Kanchi, R.; Pollak, J.; Andes, L.; et al. Urban and rural differences in new onset type 2 diabetes: Comparisons across national and regional samples in the diabetes LEAD network. SSM Popul. Health 2022, 19, 101161. [Google Scholar] [CrossRef]
- Kautzky-Willer, A.; Leutner, M.; Harreiter, J. Sex differences in type 2 diabetes. Diabetologia 2023, 66, 986–1002. [Google Scholar] [CrossRef]
- Gajardo-Navarrete, J.; Ibieta, G.; Concha, M.; Garcés, P.; Robles, I.; Vera-Calzaretta, A.; González-Burboa, A.; Gajardo, I.; Gutiérrez, M.; Villarroel, M.; et al. Enfermedad coronaria en mujeres pre y postmenopáusicas y su relación con la diabetes mellitus tipo 2. Rev. Med. Chil. 2020, 148, 145–150. [Google Scholar] [CrossRef] [PubMed]
- Carr, M.C. The emergence of the metabolic syndrome with menopause. J. Clin. Endocrinol. Metab. 2003, 88, 2404–2411. [Google Scholar] [CrossRef] [PubMed]
- Mauvais-Jarvis, F. Estrogen and androgen receptors: Regulators of fuel homeostasis and emerging targets for diabetes and obesity. Trends Endocrinol. Metab. 2011, 22, 24–33. [Google Scholar] [CrossRef] [PubMed]
- Demmer, R.T.; Zuk, A.M.; Rosenbaum, M.; Desvarieux, M. Prevalence of diagnosed and undiagnosed type 2 diabetes mellitus among US adolescents: Results from the continuous NHANES, 1999–2010. Am. J. Epidemiol. 2013, 178, 1106–1113. [Google Scholar] [CrossRef]
- Atsma, F.; Bartelink, M.L.; Grobbee, D.E.; van der Schouw, Y.T. Postmenopausal status and early menopause as independent risk factors for cardiovascular disease: A meta-analysis. Menopause 2006, 13, 265–279. [Google Scholar] [CrossRef]
- Xu, J.; Goto, A.; Konishi, M.; Kato, M.; Mizoue, T.; Terauchi, Y.; Tsugane, S.; Sawada, N.; Noda, M. Development and validation of prediction models for the 5-year risk of type 2 diabetes in a Japanese population: Japan Public Health Center-based Prospective (JPHC) Diabetes Study. J. Epidemiol. 2024, 34, 170–179. [Google Scholar] [CrossRef]
- De Paoli, M.; Zakharia, A.; Werstuck, G.H. The role of estrogen in insulin resistance: A review of clinical and preclinical data. Am. J. Pathol. 2021, 191, 1490–1498. [Google Scholar] [CrossRef]
Disclaimer/Publisher’s Note: The statements, opinions and data contained in all publications are solely those of the individual author(s) and contributor(s) and not of MDPI and/or the editor(s). MDPI and/or the editor(s) disclaim responsibility for any injury to people or property resulting from any ideas, methods, instructions or products referred to in the content. |
© 2025 by the authors. Licensee MDPI, Basel, Switzerland. This article is an open access article distributed under the terms and conditions of the Creative Commons Attribution (CC BY) license (https://creativecommons.org/licenses/by/4.0/).