Abstract
By using Brillouin’s perspective on Maxwell’s demon, we determine a new way to describe investor behaviors in financial markets. The efficient market hypothesis (EMH) in its strong form states that all information in the market, public or private, is accounted for in the stock price. By simulations in an agent-based model, we show that an informed investor using alternative data, correlated to the time series of prices of a financial asset, is able to act as a Maxwell’s demon on financial markets. They are then able to perform statistical arbitrage consistently with the adaptive market hypothesis (AMH). A new statistical test of market efficiency provides some insight into the impact of the demon on the market. This test determines the amount of information contained in the series, using quantities which are widespread in information theory such as Shannon’s entropy. As in Brillouin’s perspective, we observe a cycle: Negentropy->Information->Negentropy. This cycle proves the implication of the investor depicted as a Maxwell’s demon in the market with the knowledge of alternative data.
1. Introduction
In finance, the information flow characterizes the efficiency of the market. According to Eugene Fama [1], an efficient market is “a market in which prices always fully reflect available information”. There exists three forms of market efficiency. The weak form says that the information set is just historical prices, while the semi-strong form includes public information as announcements of annual earnings or stock splits. Furthermore, the strong form includes private information for some investors.
There exist several methods for measuring efficiency as the Hurst exponent [2] or methods from information theory such as permutation entropy [3], which quantifies the uncertainty in a symbolic sequence. Entropy is presented as a gradual indicator of efficiency, so the market can be more or less efficient. In this present work, we build a statistical test of market efficiency.
The Maxwell’s demon is a thought experiment where a foreign creature to a closed thermodynamic system is capable of decreasing the entropy of the system and then violate the second law of thermodynamics. In a closed thermodynamic system at uniform temperature, there are moving molecules with velocities which are by no means uniform. The thermodynamic system is divided into two portions. The demon controls a door between these two portions. It has the information about the velocities of the molecules and decides whether the molecule can pass through the door knowing the velocities of the molecule and the mean of the velocities of all the molecules in the portion. He is then able to warm up one portion while cooling down the other by moving molecules from the door. This action would decrease the entropy of the system and then violate the second law of thermodynamics. With this work, Maxwell wanted to question the role of knowledge in the flow of entropy of a thermodynamic system. This experiment has been very controversial and many scientists tried to exorcise the Maxwell’s demon. One of these is Brillouin, and we will take a similar approach while applying this experiment to financial markets.
2. A Statistical Test of Market Efficiency Based on Information Theory
In order to work with the various equations used in information theory, we build a binary sequence from a financial time series of n+1 prices . We do the following: . We assume that the random series is stationary. As an example of a symbolic representation of a sequence of consecutive prices, we have: which represents a decrease followed by two daily price increases. We work with a number of lags , so sequences are possible, ordered with Gray’s binary code. A Gray’s binary code is an ordering of the binary numeral system such that two successive values differ in only one binary digit, we use this code to order the sequences but another order is also possible and does not change the following computations. For example, if L = 3, then the eight possible sequences are . Then, we introduce the probability to draw a particular sequence of length L, , with . We determine the probabilistic choice system in order to define the amount of uncertainty in this probabilistic choice system with the Shannon entropy [4] defined by:
We are now able to introduce the market entropy by decomposing a sequence (observed in time L) in:
- -
- An observed prefix of probability ;
- -
- A random suffix whose conditional distribution is Bernoulli of parameter .
The sequence is thus equal to with a probability and with a probability of . The market entropy is then:
The EMH asserts that, conditionally, on the prefix , the values of suffix and are equiprobable. This leads to a particular case with , and the entropy of an efficient market is then:
With (2) and (3), we can define the market information as the difference between the entropy of an efficient market and the entropy of the market:
The theoretical value of the market information is 0 if and only if the market is efficient. We have as soon as EMH does not hold. We start by evaluating the empirical probabilities and in order to obtain the empirical market information . If the EMH holds, we may have slightly higher than 0. It is mandatory to build a statistical test for answering the question of the efficiency of the market.
The null hypothesis is: the market is efficient and we have .
Because we only have access to the estimator , we need its distribution under the null hypothesis.
In this work, we compute the moment-generating function of under the null hypothesis.
Theorem 1.
For , the moment-generating function of , conditionally on the event (using the conventions and ), is:
where: .
We are then able to express all the moments of under the null hypothesis.
Theorem 2.
The conditional moment of order r of for is
where: .
Theorems 1 and 2 are proven in [5]. We also define an asymptotic market information . We compute the asymptotic conditional moment-generating function and we demonstrated that when n tends to infinity [5]:
We recognize the gamma distribution of shape parameter and scale parameter . We observed that the result neither depends on nor on , which is a non-conditional moment-generating function.
By applying a Kolmogorov–Smirnov test, we observe that the asymptotic distribution is validated for with [5].
3. Maxwell’s Demon in Financial Markets
The history of financial markets shows us that EMH often does not hold true [6]. Andrew Lo introduces the adaptive markets hypothesis (AMH) [6] which states that statistical arbitrage is possible and that the EMH depends on the time scale. With the statistical test depicted above and working with high frequency data from the EURUSD as of 2 January 2007 (1:31 AM) to 31 December 2007 (10:59 PM), we observe that the market is inefficient for a frequency of one minute but is efficient on a daily frequency.
The statistical arbitrage of an investor reminds us of the action of a Maxwell’s demon on a thermodynamic system. Statistical arbitrage refers to trading strategies that use statistical techniques to make profit with an element of market risk reduction. Even if the link between physical entropy and information is not easy to determine, we study how an informed investor can act on financial markets with the knowledge of alternative data. In 1978, Ed Thorp’s question was not “Is the market efficient ?” but rather “How inefficient is the market ?”. Our statistical test and the Maxwell’s demon experiment are thus in line with Ed Thorp’s idea.
In this work, we study the evolution of the market entropy and the market efficiency with an informed investor acting as a Maxwell’s demon by performing statistical arbitrage.
We then work with two symbolic representations of consecutive prices. One time series, , corresponds to the successive increments in the market price. The other, , corresponds to a series of alternative data that the Maxwell’s demon is the only one to possess and which has a predictive power on . Alternative data are becoming popular among hedge fund managers and financial institutions, and comprise data from all sources including non-financial sources (web traffic, satellites, mobile devices, etc.).
We model the action of the demon in the market and simulate the prices with the following model:
With: : the weight of all the participants in the market without knowledge of alternative data;
: The weight of the Maxwell’s demon;
;
r: the risk-free rate;
: the volatility;
: the Bernoulli variable corresponding to an efficient market implied by noise traders;
;
corresponding to the action of the demon on the market (0: it is shorting the security, 1: it is buying the security)—it depends on
We have the constraint: . With and , the actualized price is a martingale. Thus, .
If we have and , we recognize the Black–Scholes model under the risk-neutral measure Q: with
For the simulations, we work with two binary sequences and , respectively, the sequence of prices on the market and the sequence of alternative data.
We first create the sequence corresponding to an efficient sequence, meaning that . Then, we create the sequence correlated to the sequence of the alternative data. The correlation between the market at instant t and the demon’s alternative data at instant t − 1 is important in the explanation of the action of the Maxwell’s demon; if the correlation is 0, then the alternative data do not allow to make predictions.
In this section, we work with . The probability available for the informed investor is: .
The demon knows the probability of a rise in the security at the moment t knowing the value of the alternative data and of the market at the moment t − 1. While a non-informed investor only knows the probability of a rise in the security knowing the value of the market at the moment t − 1.
If we have , then the demon is buying the security at the moment t if and (so ).
Brillouin’s Perspective
Brillouin made a thought experiment about Maxwell’s demon to understand whether it can operate on the thermodynamic system described by Maxwell [7]. For the demon, if the thermodynamic system is at a constant temperature at the beginning of the experiment, then the radiation is the one of a “blackbody” [8], thus the demon is not able to see the molecules because a blackbody absorbs all incident electromagnetic radiation. It is then unable to violate the second principle because it is unable to determine the velocity of the molecules. Thus, Brillouin introduces a source of light so that the demon can see the molecules. However, this action increases the overall entropy. Brillouin then thinks about the following cycle: Negentropy->Information->Negentropy. He then suggests an increase in entropy related to the loss of information. The Negentropy phase corresponds to the time when the demon is using light to see the molecules. It then has information to move the molecules, but after this action, the demon will have to use the light again to restart the cycle with a new phase of Negentropy.
One is then able to create an analogy with the market information (4): if the entropy of the market increases, then the market information decreases. An informed investor is then acting as a Maxwell’s demon on financial markets. The light of the informed investor is the alternative data they use, however, while using this information, they reduce the overall information and then they will have to use the alternative data again to discover new opportunities of statistical arbitrage.
For the simulations, we compute several quantities to determine the demon’s behaviors. With , we can introduce with . With . We determine the probabilistic choice system , and the Shannon entropy is then defined by:
We are then able to introduce the demon entropy by using the same decomposition used for the market entropy. We then have:
- -
- An observed prefix of probability with ;
- -
- A random suffix whose conditional distribution is a Bernoulli of parameter . The sequence is thus equal to with probability and with probability . The demon entropy is then:
We can then introduce corresponding to a particular case with .
We can finally define the demon information with:
We also introduce the correlation between and informing us about the correlation for the prediction of the time series of alternative data. This correlation is important in explaining the action of the demon. If the time series of alternative data does not explain well the time series of the financial markets, then the alternative data are not useful for a Maxwell’s demon.
4. Simulations of the Maxwell’s Demon on Financial Markets
We are now able to simulate the price of an asset on financial markets with the action of Maxwell’s demon. We take and , which is reasonable considering the Kyle’s model and the informed investor’s schizophrenia [9]. This schizophrenia corresponds to the fear that informed investors have about their information. In Kyle’s model, we understand that informed investors only use half of the information they have to avoid giving their information to the other participants. We compute the market information with and . We performed the simulation for 1000 business days. For the first 200 days, the Maxwell’s demon does not invest in the financial security . The vertical lines in Figure 1a,b represents the separation between the moments when and . We have . We take and .
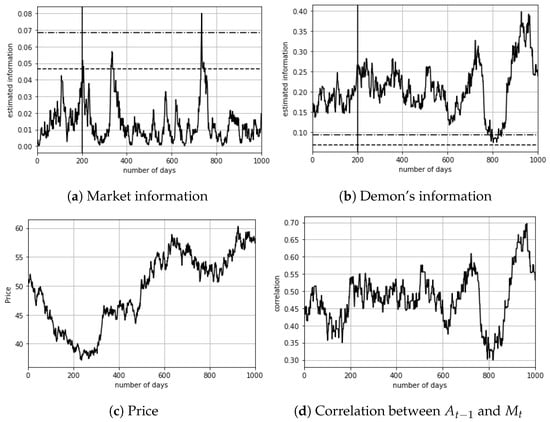
Figure 1.
Market simulation. The horizontal lines are the confidence intervals of the statistical test of absence of information, with probabilities of and .
We can see from Figure 1 that the demon’s information is strongly correlated with the correlation between and . The correlation between the time series in Figure 1b,d is 0.92. This explains the importance of the correlation between the alternative data and the market price: if the correlation decreases, then the informed investor is unable to predict well the future return, so its information decreases. As in Brillouin’s perspective, if the intensity of light is not sufficient to determine the position and speed of molecules, then the Maxwell’s demon is not able to move the molecules in order to change the entropy of the thermodynamic system.
We could also think that after the demon’s first transaction on the market, the market information would decrease in order to reach better market efficiency. Even if this pattern seems to be true on Figure 1a, it is not always the case. However, the mean of the market information is lower when the demon invests than when it is passive. As in physics, the second law of thermodynamics is statistical, so a decrease in the market information does not always happen. However, in the long term, we always observe a decrease in the market information (and thus an increase in market entropy) as in physics with an increase in the entropy of the thermodynamic system.
Another interesting analogy to mention is that, in physics, the entropy of two systems is higher than the entropy of each of them. This means that we cannot create order by adding disorder to disorder. Figure 2 shows this property comparing the entropy of the system including the Maxwell’s demon and the entire financial market to, respectively, the entropy of the financial market (Figure 2a) and the entropy of the time series of alternative data (Figure 2b).
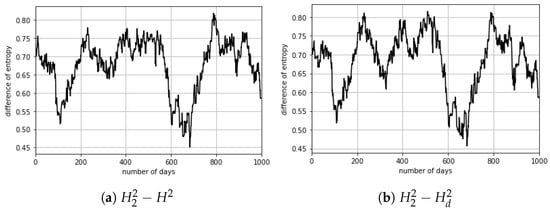
Figure 2.
Difference in entropy for the two systems corresponding to the demon’s entropy while observing only the time series of alternative data.
We can observe in Figure 2 that the entropy of the system {Maxwell’s demon+financial market} is higher than the entropy of the system {financial market} and higher than the system {Maxwell’s demon}. Then, an investor using alternative data is always able to send entropy to the financial markets and make the market more efficient by reducing the market information.
If the correlation between and is low, then the demon’s information is in the interval of the absence of information. The demon is then unable to adequately predict the future behavior of the market because we have near from . Figure 3. represents the simulation of the evolution of the demon’s information (Figure 3a) with the evolution of the correlation between and (Figure 3b) with a value of correlation between and lower than in Figure 1. We remind that has a predictive power on , then a lower correlation between these two values means that the time series of alternative data cannot give enough information to the investor using the data.
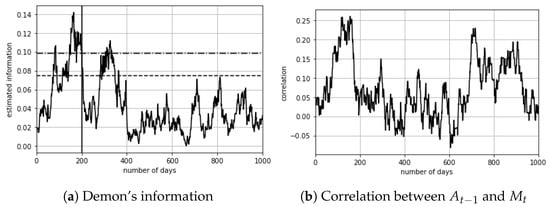
Figure 3.
Demon’s information simulation. The horizontal lines are the confidence intervals of the statistical test of absence of information, with probabilities of and (The vertical lines in (a) represents the separation between the moments when and . We have ).
In Figure 3, we observe that the correlation is nearer to 0 than in Figure 1 and that the demon’s information prevents them investing in financial markets with a strong probability of gain ( near from ). We can also observe that the correlation between the demon’s information and the correlation between and is lower, and that the correlation between the time series in Figure 3a,b is 0.07. Thus, a lower correlation between and implies lower information for the demon and a lower explainability of the correlation between and for the demon. Thus, the alternative data he uses are less informative.
We also observe in Figure 1 that the market information does not stay above the confidence bound for a long period of time. If the market is inefficient (meaning arbitrage is possible), then the participants and Maxwell’s demon take advantage of this situation and the market quickly becomes efficient. This cycle reminds us of Brillouin’s cycle, meaning that, after a peak in information we lose it by intervening in the system.
5. Conclusions
In this work, we showed the behaviors of an investor using alternative data. This investor can be seen as a Maxwell’s demon acting on financial markets. By using analogy with thermodynamics, we made links between the concepts of market efficiency and information theory.
We also introduced a new statistical test of market efficiency allowing us to understand and quantify the action of the demon in financial markets.
Author Contributions
Both authors have contributed equally to all aspects of this manuscript. All authors have read and agreed to the published version of the manuscript.
Funding
This research received no external funding.
Institutional Review Board Statement
Not applicable.
Informed Consent Statement
Not applicable.
Data Availability Statement
Not applicable.
Conflicts of Interest
The authors declare no conflict of interest.
References
- Fama, E.F. Random Walks in Stock Market Prices. Financ. Anal. J. 1965, 21, 55–59. [Google Scholar] [CrossRef]
- Ammy-Driss, A.; Garcin, M. Efficiency of the financial markets during the COVID-19 crisis: Time-varying parameters of fractional stable dynamics. Phys. A Stat. Mech. Appl. 2021, 609, 128335. [Google Scholar] [CrossRef]
- Bandt, C.; Pompe, B. Permutation entropy: A natural complexity measure for time series. Phys. Rev. Lett 2002, 88, 174102. [Google Scholar] [CrossRef] [PubMed]
- Shannon, C. A mathematical theory of communication. Bell Syst. Tech. J. 1948, 27, 379–423. [Google Scholar] [CrossRef]
- Brouty, X.; Garcin, M. A statistical test of market efficiency based on information theory. arXiv 2022, arXiv:2208.11976. [Google Scholar]
- Lo, A. The adaptive markets hypothesis. J. Portf. Manag. 2004, 30, 15–29. [Google Scholar] [CrossRef]
- Brillouin, L. Scientific Uncertainty, and Information; Academic Press: New York, NY, USA, 1964. [Google Scholar]
- Brillouin, L. Maxwell’s demon cannot operate: Information and Entropy. J. Appl. Phys. 1951, 22, 334–337. [Google Scholar] [CrossRef]
- Kyle, A.S. Continuous Auctions and Insider Trading. Econometrica 1985, 53, 1315–1335. [Google Scholar] [CrossRef]
Publisher’s Note: MDPI stays neutral with regard to jurisdictional claims in published maps and institutional affiliations. |
© 2022 by the authors. Licensee MDPI, Basel, Switzerland. This article is an open access article distributed under the terms and conditions of the Creative Commons Attribution (CC BY) license (https://creativecommons.org/licenses/by/4.0/).