1. Introduction
The non-destructive testing and evaluation (NDT&E) of the stress state in steel construction components exploited in industry is still a very important technical issue of great practical significance due to the obvious need to reduce the risk of failure of such elements. Our scientific experience with evaluation of magneto-mechanical properties, with the Barkhausen effect (BE), in various steels [
1,
2] allows us to state that this phenomenon enables quick and low cost detection of stress states in an industrial environment. We present here the relevant examples of the application of such a technique, where two innovative devices elaborated by our spin-off company NNT Ltd. are used. These devices analyze the BE voltage signal and provide within a few second’s time information about the stress level directly in absolute values (MPa units). This particular property seems to be very desirable and useful when it is necessary to perform a non-destructive and quick stress state testing in the industrial environment.
2. Stress Evaluation Methodology with Novel BE Meters
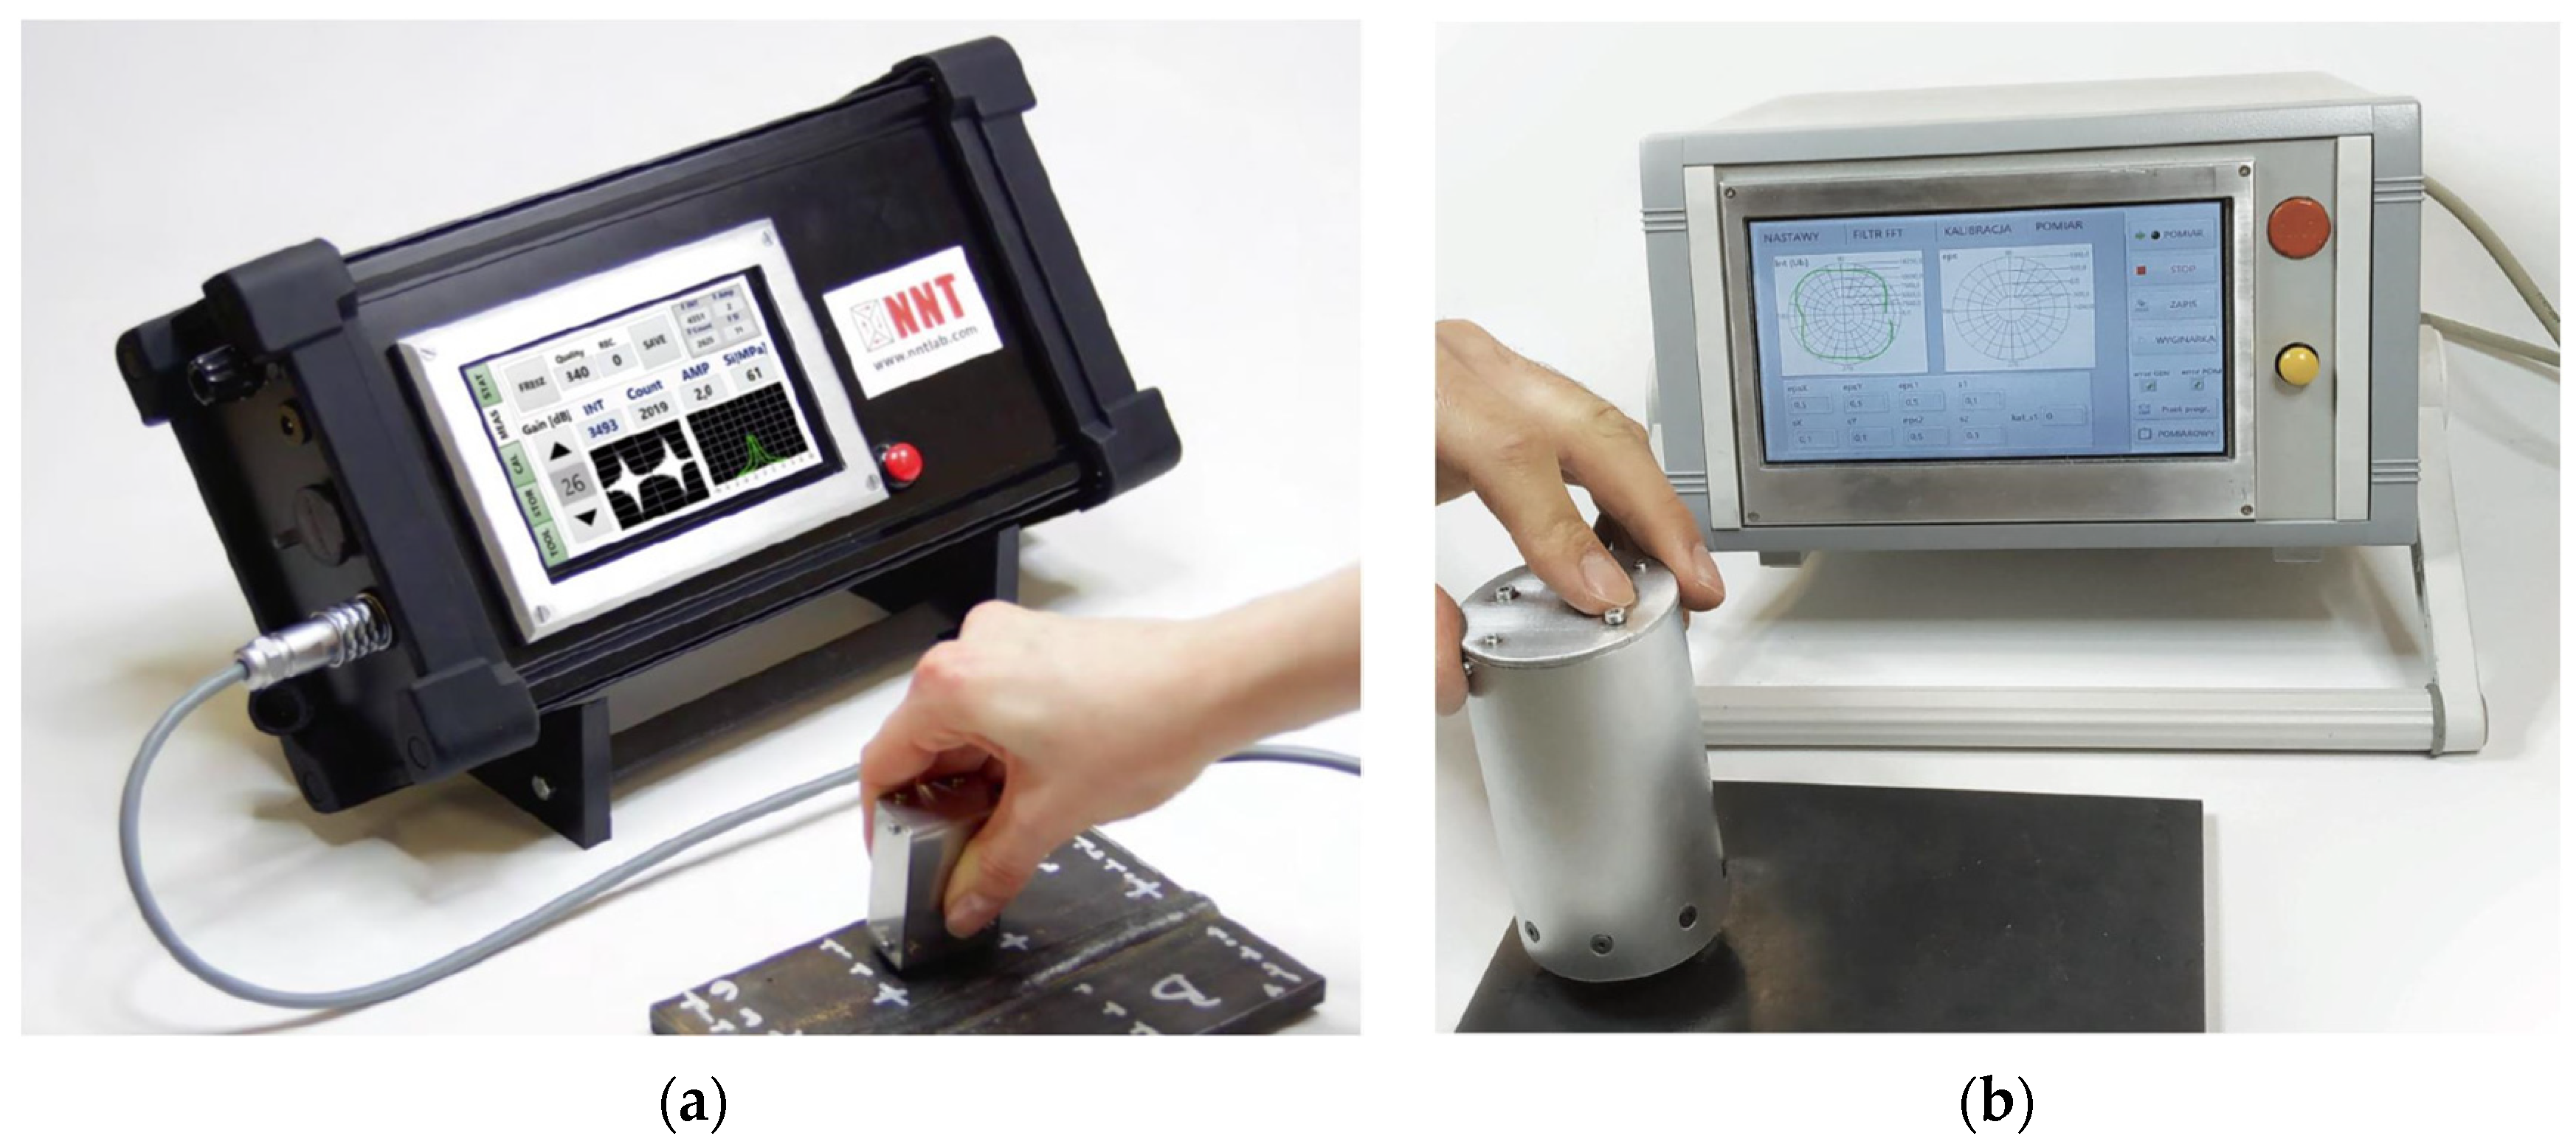
The first meter MagStress5C is shown in
Figure 1a. It locally magnetizes the tested material with a standard unidirectional sensor and analyzes the electromagnetic signals of BE, which exist due to the dynamic magnetization of the material. The intensity of the BE voltage signal induced in the sensor is quantified by the
Int parameter. The relationship between the
Int value and the strain level is stored in the memory of the meter in the form of a calibration function. Calibration functions are determined experimentally for reference samples for elastic deformation range. The stress level
sigma (displayed by this meter) is calculated directly from the strain value
eps deduced from this calibration function. This methodology provides quick estimator of stress level in a given direction of magnetization for isotropic steels. When searching for the principal components,
S1 and
S2, of stress, the directions and extreme values of EB intensity are determined by rotating the sensor. The two principal components
S1 and
S2 of stress can also be determined with MagStress5C taking EB intensity measurements in three directions differing by 45 degrees and using the relationship known from theoretical mechanics between these three strains and those two components of stress.
The second meter MagStress5D (shown in
Figure 1b) enables finding the principal components of stress
S1 and
S2 automatically within a few seconds. The BE sensor contains two crossed electromagnets and magnetizes the material in a stepwise fashion. In this way, the angular distribution of the BE intensity
Int(
alpha) is determined. This angular distribution of BE intensity is converted using a calibration function to the angular distribution of strain
eps(
alpha). The calibration function used in the MagStress5D meter is two-dimensional and describes the dependence of the EB intensity on the strains
eps given in the orthogonal X and Y directions, respectively. From
eps(
alpha) distribution, the strain principal components
eps1 and
eps2 and the corresponding values of the stress principal components
S1 and
S2 are finally determined and displayed on the meter screen. Stress components in the X and Y directions as well as the angle
fi between
S1 and sensor axis X direction are also displayed.
The calibration functions are determined for a given steel grade.
3. Examples of Stress State Evaluation
The results of a stress state evaluation where the distribution of stress over the tested element is determined by performing a set of BE measurements on this element are presented. We propose to provide the 2D map of a given stress component distribution because this way of stress state presentation allows one to perform quick and deep quantitative analysis of the stress state. These examples deal with the typical technologies of component production.
3.1. Residual Stress Due to Welding
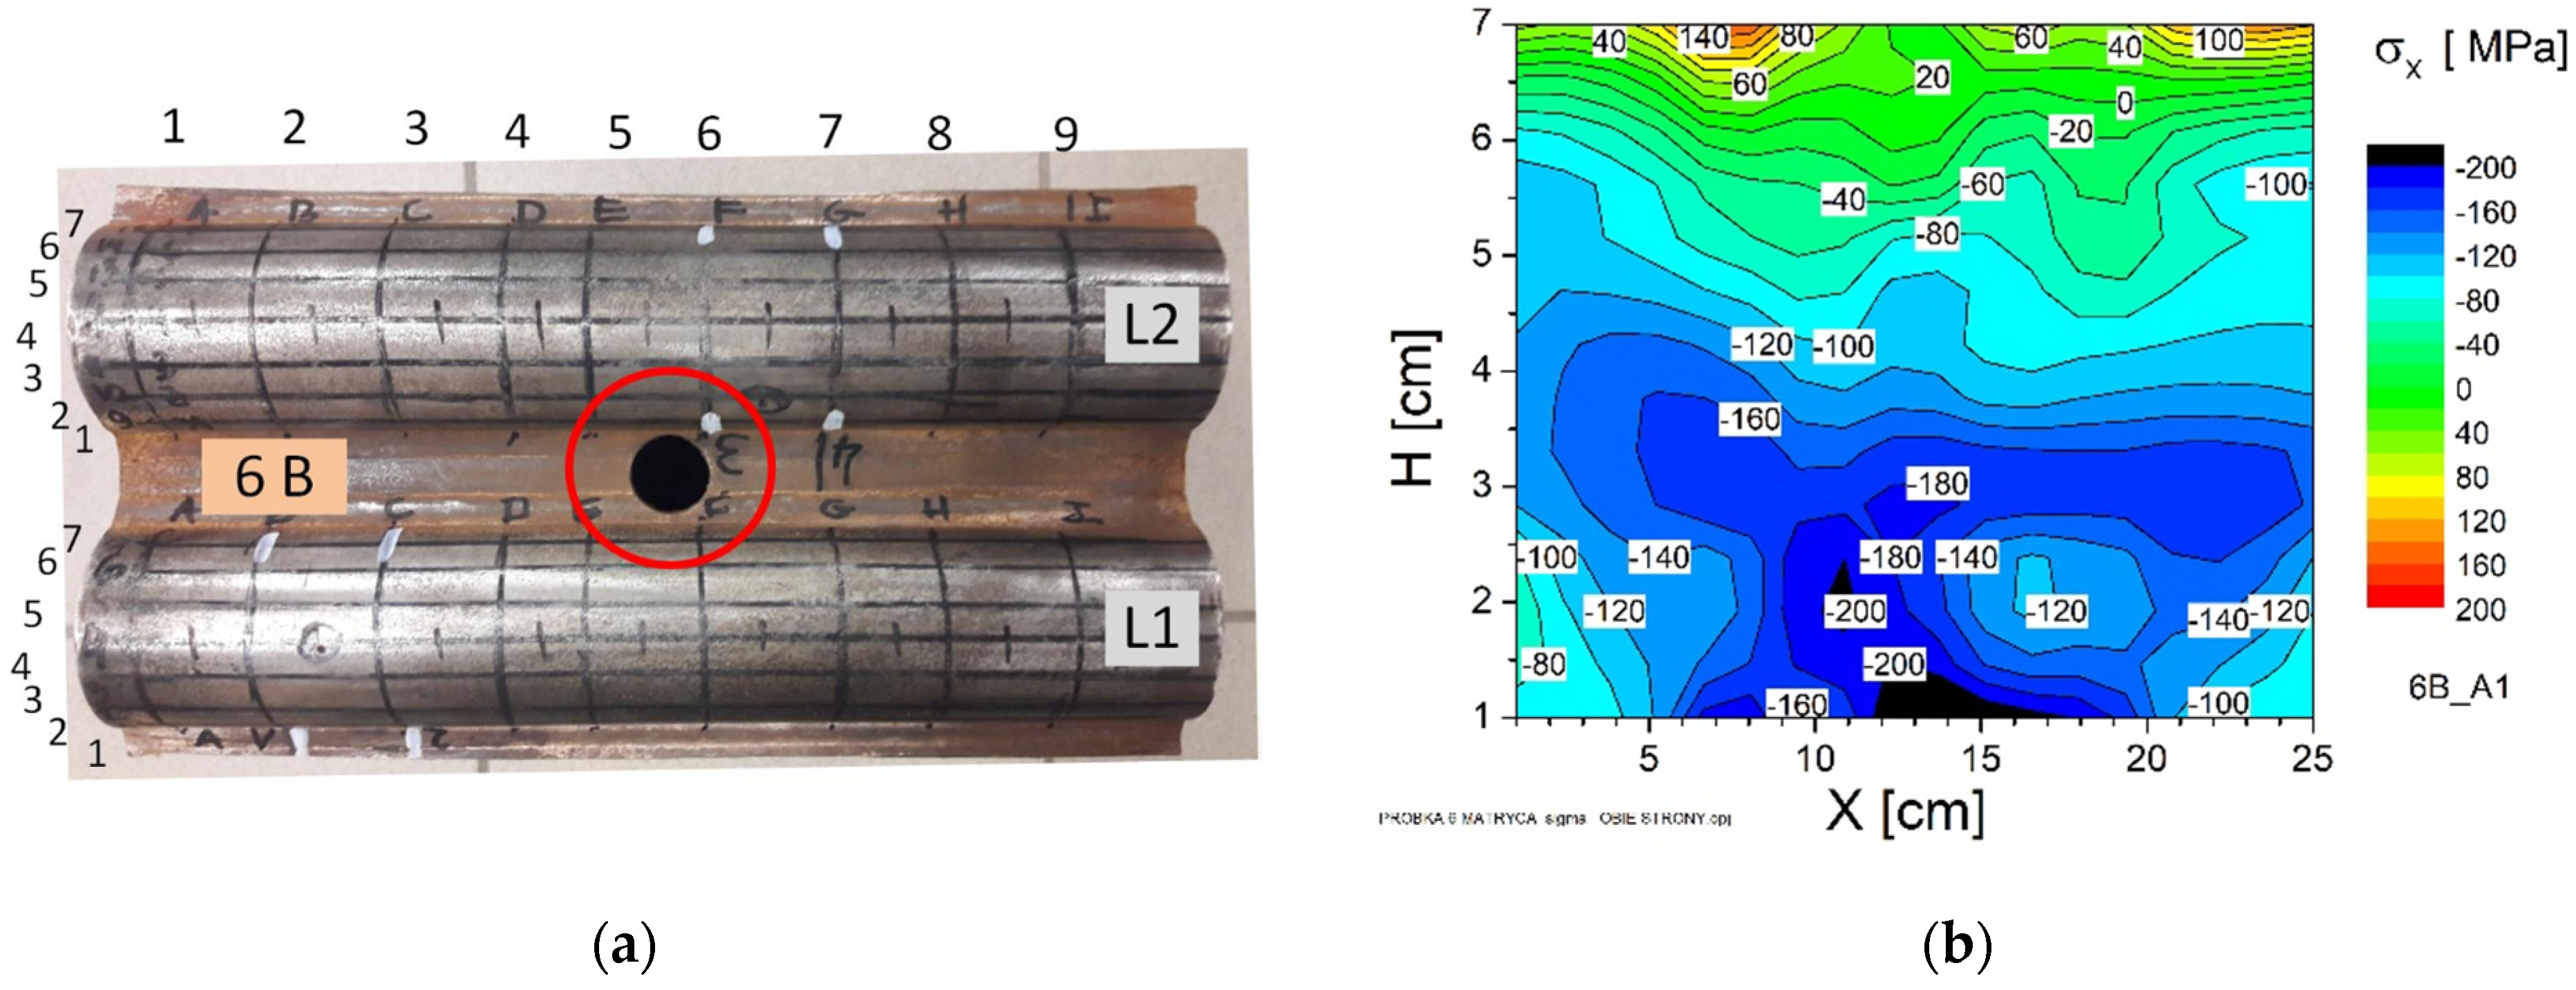
Figure 2a depicts a section of the power plant boiler curtain wall with two tubes welded in parallel and with a third tube welded in perpendicular direction to this section (seen as a black hole). The intensity of the BE (
Int) and corresponding strain
eps was recorded with a MagStress5c meter at selected points on the pipe surface in three main directions (circumferential direction (H), axial direction (A) and intermediate (T)). Those
Int values were transformed into three corresponding strain levels using the appropriate calibration function, and from them the stress components in any direction can be calculated. The 2D map of stress in the axial direction shown in
Figure 2b reveals the complex nature of stress distribution of such a section—mainly compressive stress at the central part and tensile near the weld seam of the L1 tube.
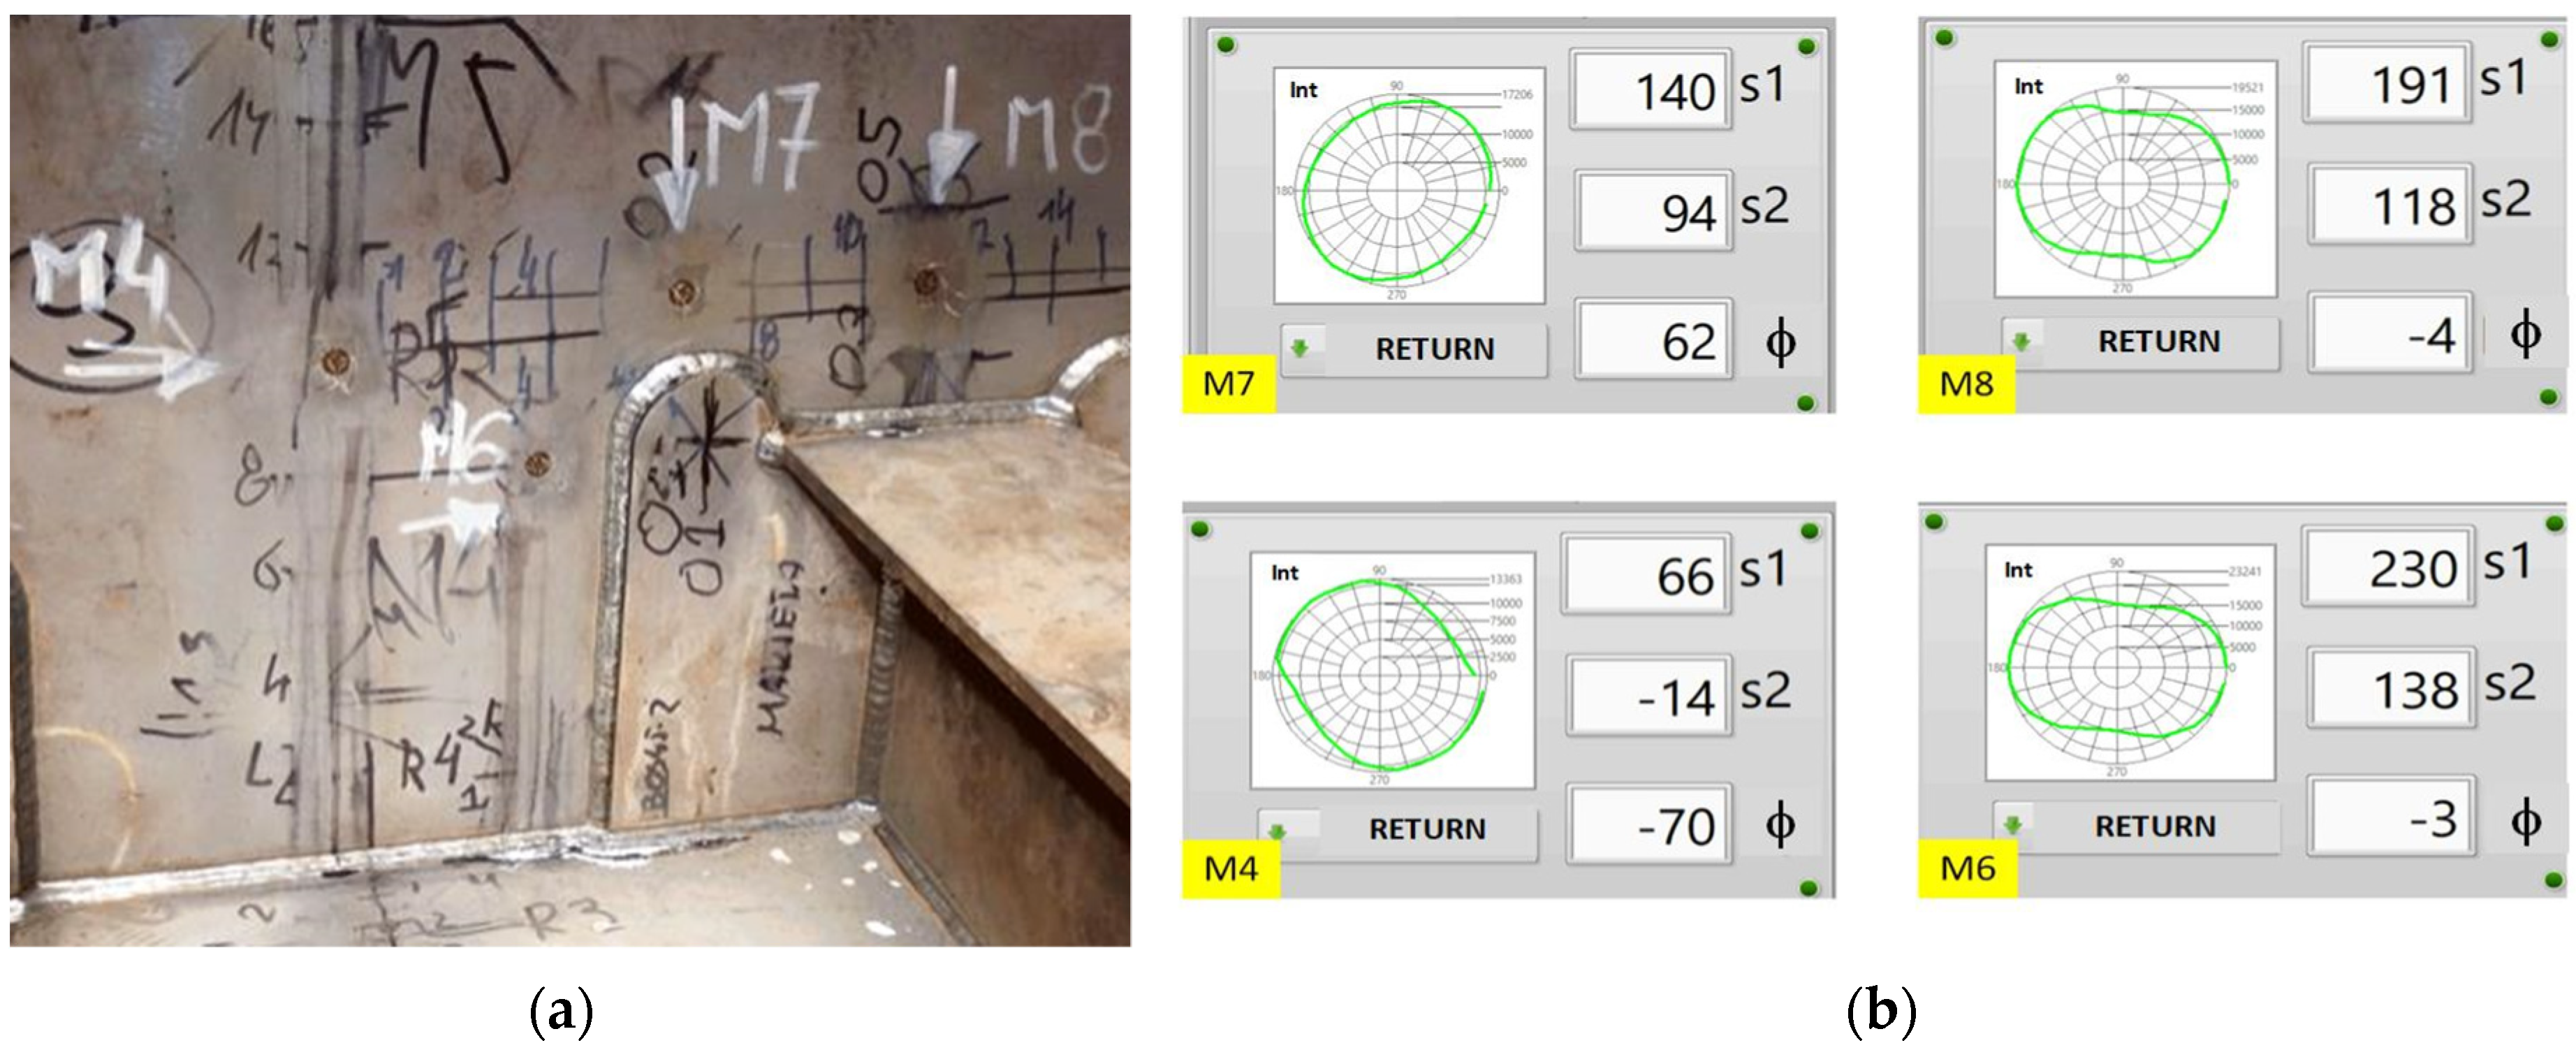
An exemplary result of bi-axial stress state determination in a welded ship section (shown in
Figure 3a) performed with the Magstress5D device is presented in
Figure 3b. Angular distributions of BE intensity recorded at the points M7, M8, M4 and M6 with resulting values in MPa of components
S1 and
S2 and angle
fi between
S1 and the axis of the sensor are shown. Axis
X is chosen as parallel to the horizontal axis of the section. One can find very complex states of residual stress distribution mainly close to the additionally welded plate (labeled with O) in the central part of this section.
3.2. Residual Stress Due to Mechanical Manufacturing Procedures
First, some relevant results of residual stress state investigation performed on the surface of the series of constructional components, which had undergone various manufacturing procedures in the foundry, are presented. The BE intensity was measured with a MagStress5C meter on the surface in three directions, and stress component
sigma along axis
X of the component is shown. Two samples that are here reported (labelled as St1 and St2) had undergone the following foundry procedures—St1: hot rolling, cooling, bending, straightening and sand blasting; and St2: St1 + cold drawing and straightening. The straightening is performed by means of a rolling leveling procedure, while cold drawing was made by tensile leveling. The 2D map of residual stress state distributions for state St1 shown in
Figure 4a reveals a highly compressive stress state of the order of −120 MPa with local extrema and with an amplitude of about 40 MPa.
Figure 4b presents the 2D map of residual stress for state St2. One can see that the compressive state is now changed to nearly zero stress state (mean value of sigma 5 ± 10 MPa) when final cold drawing and straightening are applied.
The next example deals with rolling leveling procedure of steel sheets applied commonly in various industry sectors in order to prevent bending of the parts which are cut out from the initial sheet. We report here some results of stress state evaluation performed on steel sheets used in a shipyard to make ship hulls. The tested sheet had dimensions
L = 12 m in length (
X direction) and
W = 2.5 m in width (
Y direction). The BE measurements were performed with the multi-directional sensor, and 2D maps of stress component in
X direction are here presented.
Figure 5a reveals the stress distribution on the upper side of the sheet in an as delivered state. One can find, that the stress component in
X direction is not uniform with the length and is mostly tensile (from 20 MPa up to 60 MPa). The result of multi-pass rolling straightening of this sheet is shown in
Figure 5b. Modification of stress state is evident, but not as good as could be expected. The main part of the sheet reveals nearly zero state, while at the border area of the sheet, “new” tensile stress appears. This non-uniform stress distribution results from the poor mechanical condition of the rolling machine. The machine was later repaired, and its further operation was correct.
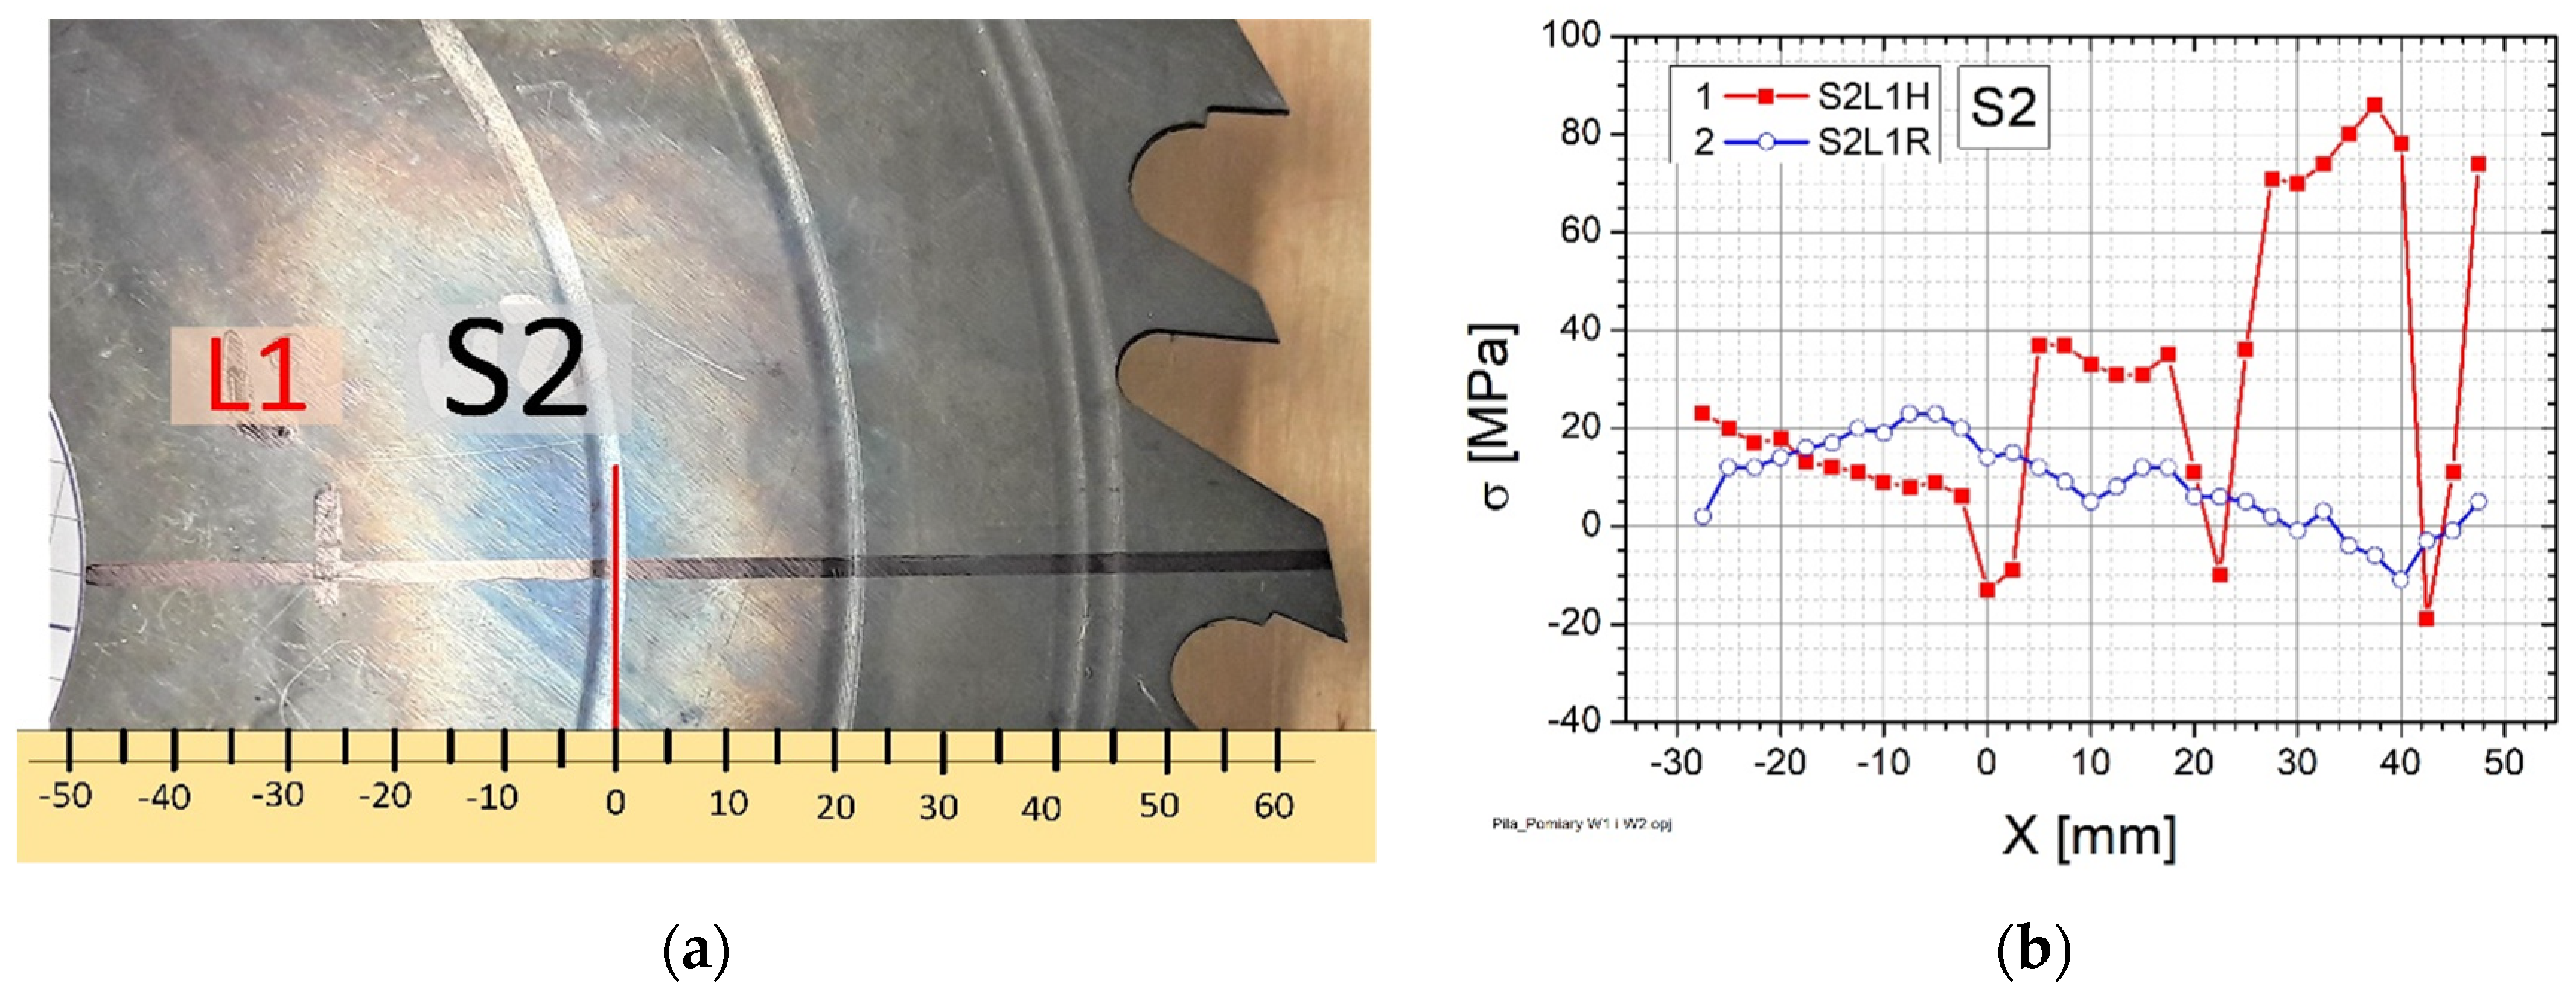
The last example of stress state evaluation deals with non-typical mechanical treatment of a metal component. This is a saw blade used for woodcutting. Part of this saw S2 is shown in
Figure 6a. Numerous circular indentations are visible in this photo. These have been introduced to improve the performance of the disc by reducing the risk of cracking. The BE measurements were performed with MagStress5c meter along line L1 in hoop (1) and radial (2) directions, respectively. The resulting distributions along line L1 of both components of stress in those directions are shown in
Figure 6b.
The stress component in the hoop direction varies in a specific way: it is mostly tensile and increases (up to 80 MPa) along the disk radius and drops down at indentation areas to a compressive state of the order of −20 MPa. The stress component in a radial direction is nearly constant and close to zero level along the disk radius.
4. Conclusions
Our research on stress state determination included ferromagnetic steel components from the various industry sectors. The research was focused on the objects and technological processes where the high stress levels cause problems both at the construction and exploitation stages.
The reported results prove that the demonstrated innovative concept of BE device application for stress state evaluation enables an effective and fast control of the many technological processes (e.g., welding, shot peening, as well as rolling or tensile leveling) as well as monitoring of safe operation of industrial components.
Author Contributions
Conceptualization, B.A. and M.C.; methodology, B.A., M.C. and L.P.; formal analysis, B.A.; investigation, B.A., M.C. and L.P.; writing—original draft preparation, B.A.; writing—review and editing, B.A., M.C. and L.P.; supervision, B.A., M.C. and L.P.; funding acquisition, B.A. All authors have read and agreed to the published version of the manuscript.
Funding
This research was funded by National Centre for Research and Development grant number POIR.01.01-00-1094/18-00 and the APC was funded by B.A.
Institutional Review Board Statement
Not applicable.
Informed Consent Statement
Not applicable.
Data Availability Statement
Data available on request.
Conflicts of Interest
The authors declare no conflict of interest.
| Publisher’s Note: MDPI stays neutral with regard to jurisdictional claims in published maps and institutional affiliations. |
© 2022 by the authors. Licensee MDPI, Basel, Switzerland. This article is an open access article distributed under the terms and conditions of the Creative Commons Attribution (CC BY) license (https://creativecommons.org/licenses/by/4.0/).


