Abstract
Digital image correlation (DIC) is a widely used technique that makes it possible to obtain full field displacements, as well as 3D shapes, even at high speeds. However, it requires a pattern of random spots to be sprayed onto the surface, which would be a major drawback in some applications, such as biomechanical studies. In this work, a new methodology (DIC) is presented by means of thermal marking to carry out mechanical analysis, obtaining data of interest such as deformations and displacements. Two types of tests were carried out. In the first, 2D DIC was used to evaluate the displacement of a rigid solid and thus validate the technique. In the second, 3D DIC was used in different parts of the human body, in, among others, the face, hand and arm to demonstrate the potential of the technique.
1. Introduction
One of the most widely used optical techniques in experimental mechanics is digital image correlation, known as DIC. This technique allows the measuring of deformations and displacements in two and three dimensions without contact between the measuring instrument and the object under analysis [1]. The main advantage of this technique compared to other traditional experimental techniques is the high spatial resolution in the measurement. In addition, one of the great advantages of digital image correlation in two and three dimensions is the possibility of its use in dynamic processes, since high-speed cameras can be used to capture vibration or impact events [2]. However, this technique requires the printing or adhesion of a physical pattern on the surface of the object [1] which could be a limitation. This pattern is based on a homogeneous background, normally white, on which a pattern of high-contrast speckle (usually black) is randomly sprayed.
In this work, a novel methodology has been developed to offer an interesting advance over traditional digital image correlation. As mentioned, it is normally required to spray a speckle pattern on the study surface. This coating may be inappropriate for situations such as biomechanics tests or elements incompatible with paint. In fact, authors intend to replace this sprayed speckle pattern with a thermal pattern that will be observed by the use of thermal cameras. This thermal pattern will completely disappear after a certain time, leaving a free studied surface. In this way, it has great potential in various fields such as biomechanics [3,4,5]. This application of thermal marking developed in this work is especially interesting, since the physical impression of a speckle pattern on in vivo biological tissues is usually preventable. Since most biological systems are composed of elastic membranes, this type of thermal speckle pattern would allow with DIC biomechanical valuable data of displacement and deformation of tissues, joints, etc.
Thus, in this work, the viability of the development and experimental validation of this new methodology is evaluated. Specifically, two types of tests were carried out: tests with 2D DIC and with 3D DIC. To use 2D DIC, rigid solid displacement tests were carried out using different surface finishes. This type of test makes it possible to evaluate and validate that the methodology is capable of obtaining results similar to those obtained using the pattern traditionally used (sprayed speckle pattern). On the other hand, three-dimensional tests were also carried out on more complex elements, such as a rubber sphere and, what is more illustrative, tests on different parts of the human body.
2. Materials and Methods
2.1. Thermal Speckle Pattern
As previously mentioned, this work proposes the replacement of speckle spraying with a thermal marking, which will enable the use of the temperature distribution presented by the surface under study as a guide to obtain displacements and mechanical deformations with DIC.
However, it must be taken into account that the temperature will vary during the performance of the test or analysis, mainly for two reasons. The first, and main, will be due to heat transfer, especially by conduction, but also by convection, which will tend to reduce the temperature gradient until the temperature at the different points of the body find an equilibrium. The second factor will be the possible thermoelastic effect. These effects will reduce the duration of the thermal speckle pattern.
To achieve thermal marking, there are two main possibilities: thermal marking by contact or thermal marking by the radiation emitted by, for instance, an infrared projector. The duration of the thermal pattern will especially depend on the diffusivity of the study material and the amount of heat applied, which is normally greater by contact [6].
The main advantage of performing thermal marking using an infrared projector is, logically, the unnecessity of contact, which, under certain circumstances, could allow re-marking when speckle is lost over time without having to interfere with the performance of the test. It presents very good results in 3D parts with complex geometries [6]. The main drawback is that it requires an important source of heat radiation that could be uncomfortable for the patient and, while the object is being marked, it must be ensured that the relative movement between the source and the object is negligible so as not to affect the marking. If a low power infrared source is employed, the thermal speckle could not be enough to study strains, but could be interesting for shape digitalization [7].
Therefore, in this work contact marking was chosen. In addition, the operation of the contact thermal marking tools is very simple since it will only be enough to press them against the surface for a certain time that will depend mainly on the material of the part to be marked. For this, a marking tool was designed which can be adapted to complex shapes. This tool consists of three polymer sheets, which guide a system of randomly distributed metallic rods of 2.5 mm of diameter, which have 15 mm travel along their axis. This travel enables a good adaption to the complex surface of the specimen. This tool was placed on a heated surface to maintain at a temperature of 50 °C and then it is applied on the studied surface. This thermal speckle application tool is observed in Figure 1.
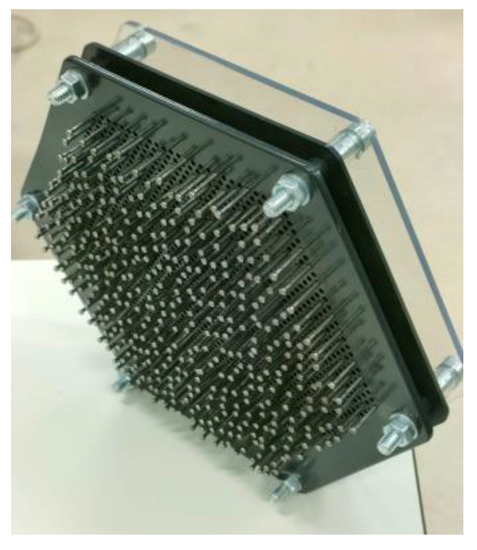
Figure 1.
Thermal speckle application tool.
2.2. Experimental Set-Up
In this section, the experimental methodology required to carry out DIC tests with thermal marking are discussed. As mentioned above, two-dimensional tests were carried out, in which the main objective is the validation of the procedure, and additionally, 3D-dimensional tests in which the potential of the methodology is intended to be illustrated.
2.2.1. 2D DIC Tests
To evaluate the capacity of thermal speckle for 2D-DIC, in this set of tests, it was intended to measure the solid rigid displacement of a specimen. In fact, a 205 × 26 × 6 mm rectangular polycarbonate specimen was employed. Firstly, different surface coatings were studied in order to determine possible differences in the behaviour of the speckle thermal pattern. Those coatings included blue peelable lacquer and white, liquid vinyl, matte black paint, and the polycarbonate specimen itself without any type of surface finish. Hence, five different previous tests were performed. After that, one specific coating was selected and three similar tests were performed, but measuring simultaneously on the other side of the specimen with traditional sprayed speckle.
In this way, the specimen in reference state was thermally marked and then moved at intervals of 1 mm up to 5 mm and then returned to the initial state. The velocity of the test was of 1 mm/s, so that the entire test lasted 10 s. At each 1 mm interval, an image was captured to be processed with 2D DIC. Both the specimen displacement and TTL pulses for camera triggering were commanded by an Instron 5960 universal testing machine. The thermal camera perpendicularly observing the specimen was specifically a microbolometer Flir FLIR A35 with 336 × 256 resolution and 9 mm focal length lens. The lateral magnification relation was 1.507 px/mm. This low resolution limits the size of the speckle pattern and the accuracy of the measurement but allows a correct evaluation of the methodology.
Additionally, for the second set of solid rigid tests, on the other side of the specimen, a traditional visible spectrum camera registered images at the same time in order to compare the results and validate the proposed approach. Specifically, an Allied Vision Mako U U130B with a resolution of 1280 × 1024 pixels and 25 mm focal length lens was used. With this set-up, the magnification relation obtained was 14.29 px/mm. The images obtained with this experimental methodology were processed using Ncorr software [8] employing a subset size of 12 pixels and 17 pixels for microbolometer and visible images, respectively. In this way, the experimental set up is presented in Figure 2.
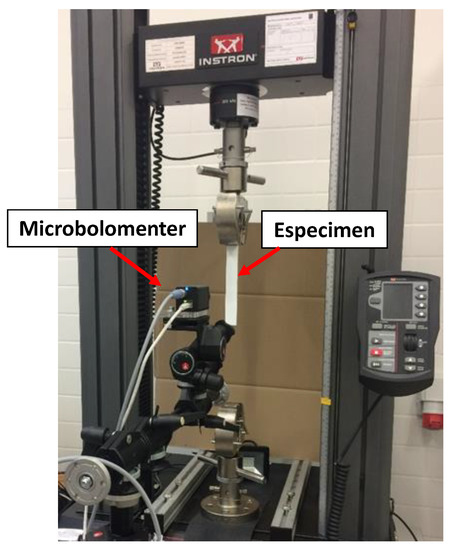
Figure 2.
Set-up for solid rigid test for 2DDIC.
2.2.2. 3D DIC Tests
In this case, it was necessary to use a stereoscopic vision system. Specifically, two cameras of the same model that was previously used for 2D DIC (FLIR A35 with 9 mm focal length lens) were used with the same optics as for 2D-DIC tests. The optical set up for the different set-ups was the same.
An assembly was designed to generate the TTL signal, which simultaneously triggered both cameras synchronously. This aspect is necessary for 3D calibration and tests since images captured by both cameras should observe exactly the same deformation state of the specimen from two different points of view. In fact, a Function Generator (Wavetek Model 19, San Diego, CA, USA) generated a single trigger signal for both cameras.
The 3D DIC processing was carried out using the VIC 3D software from Correlated Solutions Inc. DIC 3D needs to calibrate the cameras by employing a specific calibration target. This procedure allows the software to know the relative position of one camera with respect to the other, as well as its orientation and intrinsic camera properties. This calibration was performed by simultaneously capturing images of the calibration target at different positions and orientations. However, traditional calibration targets for visible spectrum cameras are not suitable for this test as no temperature change is observed by microbolometers and the structured calibration pattern is not being observed. Hence, the specific calibration target composed of two different materials was designed and mechanized in a CNC milling machine. In fact, this plate was made of aluminum with specific circles according the geometric specifications of the VIC 3D software. The mechanized holes were filled with plaster, so that, since both materials had very different emissivity, the thermal cameras detected the calibration pattern as shown in Figure 3.
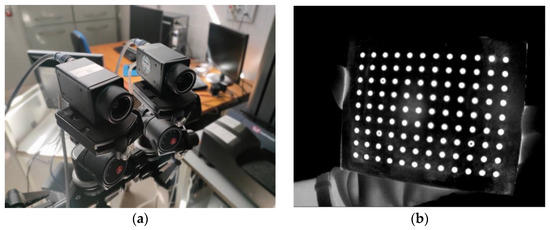
Figure 3.
(a) Camera set up for 3D-DIC. (b) Thermal image of calibration plates.
3. Results
3.1. 2D-DIC Results
Firstly, the results obtained from the rigid body motion test with different coatings using 2D DIC are presented. The main results obtained from the processing were the displacement maps in the vertical direction corresponding to each of the images from 0 to 5 mm and back to 0 mm in steps of 1 mm. From those displacement maps, the mean value of the region of interest was calculated together with the standard deviation.
Figure 4 shows the evolution of those displacements measured along each step for each of the different surface coatings. As can be seen, the displacement measurement is quite similar for all the coatings. However, it is true that all of them tend to measure less displacement than the real one. This is especially noticeable for larger displacements and for the type of paint called ‘Blue Peelable Lacquer’. This may be due to the fact that the paint makes the Speckle pattern vanish more quickly. By observing the standard deviation presented in Figure 4b, it was noticed that this value reached up to 0.8 mm, with a similar value for all the coatings, so no special difference was observed. Even so, it was observed that the results of the White Peelable Lacquer and the unpainted polycarbonate are quite close to those commanded. Specifically, there were differences of 0.27 mm for the White Peelable Lacquer 7 s after the marking and 0.39 mm for the polycarbonate specimen without any type of surface finish 6 s after the thermal marking. These are considered good results, taking into account the resolution available.
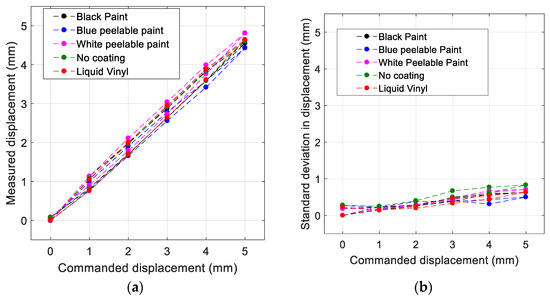
Figure 4.
Results for solid rigid displacement test for different coatings. (a) Mean displacement. (b) Standard deviation.
Once White Peelable Lacquer was selected as a suitable coating, the rigid solid displacement test was repeated on this specimen three times, also using the visible spectrum camera to measure the back of the specimen. Both cameras were synchronized with the test, capturing simultaneously; this again allowed a comparative analysis between the results obtained with both cameras, with respect to the real displacement.
The comparative results are shown in Figure 5. As can be seen, the difference between the displacement value commanded by the machine and that obtained with thermal and visible DIC is 0.19 and 0.17 mm, respectively. However, taking into account that the uncertainty of the DIC is a function of the resolution [1], the uncertainty of the thermal camera is logically greater than for the visible spectrum camera.
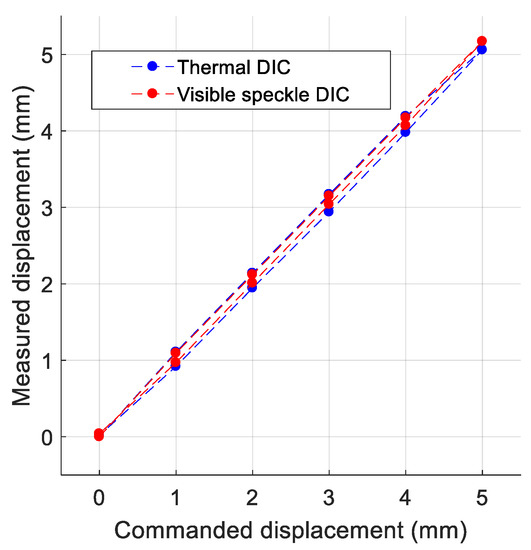
Figure 5.
Comparative of displacement measured by employing thermal speckle (blue) and traditional sprayed speckle (red).
3.2. 3D-DIC Resutls
Once the validity of this technique in 2D DIC was demonstrated, it was then tested on a three-dimensional object. In a first attempt, a rubber ball was digitalized, as shown in Figure 6. In this figure, it can be seen that the digitalized area was reduced, logically to a section of the sphere, which was observed by both cameras. However, an analysis of a 3D geometry can be achieved.
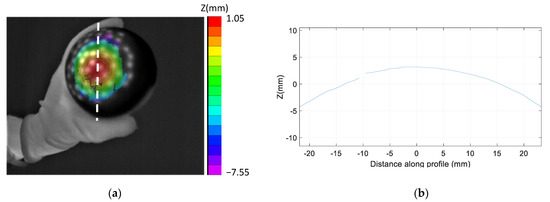
Figure 6.
Results for digitalization a rubber ball. (a) Image of digitalization. (b) Shape profile along whit dashed line in (a).
Focusing on applications related to biomechanics, a first test was performed in the abdominal area of a human. During the test, the duration of which was around 5 s, the person forced an expansion of the abdominal area, followed by a compression of it. As a consequence, in Figure 7a, the out-of-plane displacement maps were observed, measured in an area of approximately 100 × 140 mm. The yellow cross indicates the point analyzed in Figure 7b, where the out-of-plane displacement was studied along time. In this graph, the red dashed line indicates the moments associated with the displacement maps in Figure 7a.
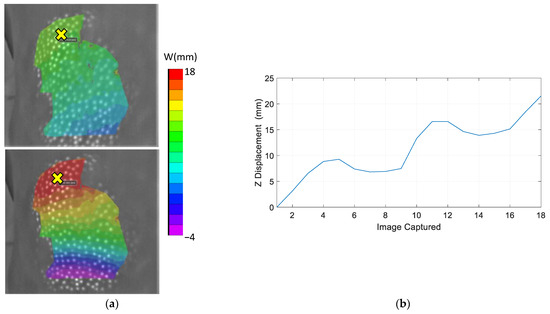
Figure 7.
Abdominal area test. (a) Digitalization at two different moments. (b) Displacement of the point marked with yellow cross.
An additional test for determining shape was performed on a human hand. In Figure 8a, the image captured by one of the microbolometers is presented, upon which the shape map is superimposed. This shape map is shown in 3D in Figure 8b.
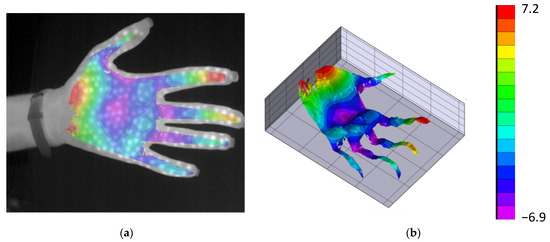
Figure 8.
Results for digitalization a human hand. (a) Shape-map on image. (b) 3D map of the shape.
However, previous tests employing 3D DIC do not exploit all the potential of the technique in biomechanics. In the next test, we were interested in the measuring of strains on the skin of the human body. For that purpose, the strains during arm flexion were analysed. Figure 9a shows the shape of the arm in a straight reference state. As observed, a specific coordinate reference system was chosen to facilitate the interpretation of results. In fact, the X-axis was considered the longitudinal direction of the arm and the Y-axis was the transversal one. In next figure, Figure 9b, the strains along the former axis are shown. As observed, some tension was presented in the main area of the bicep muscle, but what is more notorious is the compression in the area where the bicep muscle joins the area of the elbow. In Figure 9c, a strain map in the direction transversal to the humerus is presented. It was noticed that the strain along that axis was associated with tension in the area of the biceps, and that this is significant. Some tension in the skin close to the elbow was also observed.
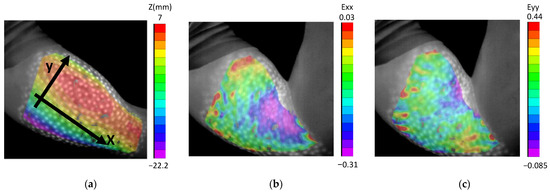
Figure 9.
Results from strain analysis on arm flexion. (a) Image of digitalization of the arm with the reference coordinates system. (b) Strain along humerus direction (x) during flexion. (c) Strain along transversal direction to humerus (y) during flexion.
4. Conclusions
In this work, a new methodology is presented to perform digital image correlation by means of thermal marking, that is, employing an infrared speckle pattern and infrared cameras such as microbolometers. This approach presents an interesting novelty in experimental mechanics which has great potential in biomechanics.
All the results obtained during the rigid solid displacement test satisfactorily meet the value of the displacement. demonstrating that the thermal speckle and microbolometers are suitable for performing DIC. It should be noted that the large size of the thermal speckle compromised the resolution of the system, together with the low resolution of the camera. At this moment, the resolution of this kind of cameras is not similar to visible-spectrum cameras, and it is difficult to achieve the same level of accuracy. However, that is not a limitation for obtaining satisfactory results in a different kind of study.
In fact, static and dynamic tests with 3D DIC have shown great versatility for the measurement of shapes, displacement and strain maps, which will establish an interesting tool for the study of biomechanics, as well as new tools for the field of physiotherapy or dermatology.
It is important to keep in mind that this work is a preliminary validation study of the method. Therefore, certain improvements were detected that could be implemented in future assemblies and some additional analysis will be performed.
Author Contributions
Conceptualization, L.F.-S.; methodology, L.F.-S. and F.A.-C.; software, L.F.-S., Á.M.-V. and F.A.-C.; validation, L.F.-S. and F.A.-C.; formal analysis, L.F.-S. and F.A.-C.; investigation, L.F.-S., Á.M.-V. and F.A.-C.; resources, L.F.-S.; data curation, L.F.-S. and F.A.-C.; writing—original draft preparation, L.F.-S. and F.A.-C.; writing—review and editing, L.F.-S.; visualization, L.F.-S. and F.A.-C.; supervision, L.F.-S.; project administration, L.F.-S.; funding acquisition, L.F.-S., E.L.-A. and F.D.-G. All authors have read and agreed to the published version of the manuscript.
Funding
This research received no external funding.
Institutional Review Board Statement
Not applicable.
Informed Consent Statement
Informed consent was obtained from all subjects involved in the study.
Data Availability Statement
Not applicable.
Acknowledgments
We acknowledge the student of the EPS of Linares (University of Jaén) who collaborated voluntary on this study.
Conflicts of Interest
The authors declare no conflict of interest.
References
- Sutton, M.A.; Orteu, J.J.; Schreier, H.W. Image Correlation for Shape, Motion and Deformation Measurements—Basic Concepts, Theory and Applications; Image Rochester: New York, NY, USA, 2009; Volume 341. [Google Scholar] [CrossRef]
- Reu, P.L.; Miller, T.J. The application of high-speed digital image correlation. J. Strain Anal. Eng. Des. 2008, 43, 673–688. [Google Scholar] [CrossRef]
- Nordin, M.; Frankel, V.H. Basic Biomechanics of the Musculoskeletal System, 5th ed.; Wolters Kluwer Health: Philadelphia, PA, USA, 2021. [Google Scholar]
- Evans, S.L.; Holt, C.A. Measuring the mechanical properties of human skin in vivo using digital image correlation and finite element modelling. J. Strain Anal. Eng. Des. 2009, 44, 337–345. [Google Scholar] [CrossRef]
- Miura, N.; Arikawa, S.; Yoneyama, S.; Koike, M.; Murakami, M.; Tanno, O. Digital Image Correlation Strain Analysis for the Study of Wrinkle Formation on Facial Skin. J. Solid Mech. Mater. Eng. 2012, 6, 545–554. [Google Scholar] [CrossRef][Green Version]
- Eduardo, M.; Ortiz, H. Novel Developments of Moire Techniques for Industrial Applications. Doctoral Dissertation, University of Sheffield, Sheffield, UK, 2004. [Google Scholar]
- Nguyen, H.; Wang, Z.; Jones, P.; Zhao, B. 3D shape, deformation, and vibration measurements using infrared Kinect sensors and digital image correlation. Appl. Opt. 2017, 56, 9030–9037. [Google Scholar] [CrossRef]
- Blaber, J.; Adair, B.; Antoniou, A. Ncorr: Open-Source 2D Digital Image Correlation Matlab Software. Exp. Mech. 2015, 55, 1105–1122. [Google Scholar] [CrossRef]
Publisher’s Note: MDPI stays neutral with regard to jurisdictional claims in published maps and institutional affiliations. |
© 2022 by the authors. Licensee MDPI, Basel, Switzerland. This article is an open access article distributed under the terms and conditions of the Creative Commons Attribution (CC BY) license (https://creativecommons.org/licenses/by/4.0/).