


Proceeding Paper

Fourier Transform Infrared Emission Spectroscopy of Si ii  †

by
Zaid Mustafa
and
Haris Kunari
*
Department of Physics, Aligarh Muslim University, Aligarh 202002, Uttar Pradesh, India
*
Author to whom correspondence should be addressed.
Presented at the 1st International Online Conference on Atoms, 29–30 January 2026; Available online: https://sciforum.net/event/IOCAT2026.
Phys. Sci. Forum 2026, 13(1), 7; https://doi.org/10.3390/psf2026013007
Published: 29 May 2026
(This article belongs to the Proceedings of The 1st International Online Conference on Atoms)

Abstract

Accurate and precise spectral data for singly ionized silicon (Si ii) are important for numerous applications. In this work, we present high-resolution Fourier transform IR emission spectroscopy of Si ii, using spectra recorded with the 1 m FTS at the Kitt Peak National Observatory. A total of 18 lines were measured in the region 780 nm to 4000 nm, and an immediate comparison of our data with the NIST ASD shows that our measurements offer at least a tenfold improvement in precision.

1. Introduction

Silicon (Si), the eighth most abundant element in the universe and an important α –element, is primarily produced inside massive stars via nuclear fusion processes and during supernova explosions; specifically, they are produced during supernova Type-Ia explosions, and its interstellar medium abundances are mainly created through the explosions of massive stars (supernova Type-II) [1]. Though precise atomic data are, in general, indispensable diagnostic probes used across a wide range of studies, including atomic physics, astrophysics, and industrial plasma physics, silicon spectral data are particularly important for the study of astrophysical environments and nuclear fusion [2]. Particularly, the accuracy of transition data for singly ionized silicon (Si ii) in the infrared (IR) region is of great importance because corrections for non-local thermodynamic equilibrium (NLTE) effects are found to be larger for infrared lines compared to those in the optical region [1]. Another important point is that the fourth cycle of the James Webb Space Telescope (JWST) observation program, titled “Resolving Multi-phase Outflow/Inflow via Gas Dynamics and Chemical Abundance Distribution in a Sub-L* Dwarf Galaxy at z = 6.1.” explicitly plans to use the NIRSpec instrument of the JWST to detect a suite of key absorption lines, including Si ii, O i, C ii, and Si iv. By accurately measuring the Doppler shift and strength of these lines (which requires accurate and precise data on line positions), astronomers can map the velocity and structure of gas being blown out of a galaxy, which they can see as this occurred just ∼1 billion years after the Big Bang [3].
However, the currently available spectral data on Si ii in the Atomic Spectra Database (ASD) of the National Institute of Standards and Technology (NIST) do not provide explicit uncertainty estimates for wavelengths or energy levels; hence, their applications are limited. Moreover, particularly in the IR region, the currently available data on wavelengths/wavenumbers are Ritz-computed quantities, except for just three measured wavelengths out of 186 lines in the range 1800 cm 1 to 12,800 cm 1 [4]. These experimental measurements in the IR region were reported by Shenstone [5]. It is worth mentioning that all 186 lines were provided with their transition rates and estimated uncertainties [4].
The objective of this work is to procure more accurate and precise spectral data for Si ii in the near- and mid-IR region. To achieve this, we used high-resolution Si spectra, recorded with the 1 m Fourier transform spectrometer (FTS) at the Kitt Peak National Observatory (KPNO) in Arizona, USA.
Si ii belongs to the aluminium (Al i) isoelectronic sequence with the ground configuration [Ne]3 s 2 3p, comprising two levels, 2 P 1 / 2 , 3 / 2 , the level with J = 1 / 2 being the lowest one. Excitation of the 3 p electron creates configurations of the type 3 s 2 n ( n 3 , = s , p , d , f , ) with doublet ( 2 L J ) levels. The 3 s 3 p 2 configuration containing the 4 P , 2 D , 2 P , and 2 S terms is created from the ground configuration 3 s 2 3 p by excitation of the s p electron within n = 3 . Further excitation from 3 s 3 p 2 leads to the 3 s 3 p ( 3 P ) n ( n 3 , = s , p , d , f , ) and 3 p 3 types of excited configurations with several multiplets.

2. Materials and Methods

The last comprehensive analysis of the Si ii spectrum was performed by Shenstone [5]. His observations covered a broad wavelength region of 70 nm to 950 nm. For the IR region, he used a hollow-cathode (HC) lamp as a light source, and the spectra were recorded on a 21ft Wadsworth mounting spectrograph equipped with a 15,000-lines-per-inch grating. A total of 300 lines were listed, in addition to 110 lines that were previously assigned to this spectrum by Fowler [6]. In comparison, Shenstone [5] found that the difference between his observed and calculated values did not exceed 0.1 cm 1 . Thus, the same may be considered a conservative indicator of his measurement uncertainty. Since these comprehensive studies, there have been many additions to spectroscopic techniques in terms of materials, sources, and instruments. Therefore, it appeared necessary to make our knowledge of the spectra of Si ii much more complete than it had been. A major advancement in atomic spectroscopy (since the 1960s) has been the shift from conventional dispersive spectrometers to Fourier transform spectrometers (FTS), which enabled high-resolution studies with multiple advantages, such as multiplex/Fellgett, throughput/Jacquinot, and precision/Connes’ advantages [7].
In this work, we used two silicon spectrograms (hereafter, named 8202 and 9303), which we obtained from the Virtual Solar Observatory (VSO) [8] repository at KPNO. All of these spectrograms are recorded in a 1 m (f/55 IR–visible–UV) FTS facility that works in conjunction with either the McMath telescope’s main beam or with laboratory sources. The spectrogram 8202 covers a broader wavenumber region (7664–44,591 cm 1 ) with a spectral resolution of 0.057 cm 1 and was taken at a gas pressure of 0.7 Torr using a low-current HC discharge. In contrast, spectrogram 9303 covers the IR region (1746–9937 cm 1 ) at a resolution of 0.013 cm 1 , and was obtained at a gas pressure of 1.8 Torr using a similar HC discharge source. For both spectra, the noise levels were determined, and the background was removed to improve the signal-to-noise ratio (S/N). Then, the wavenumbers, S/N, and line widths were determined using the DECOMP program, implemented for the X-windows graphical environment on Unix-based operating systems in the code XGREMLIN [9], which finds a least-squares fit to the Voigt profile for each line.
It is well known that the measured FT spectra require a small multiplicative correction to their measured wavenumbers ( σ meas ). Although a well-controlled He–Ne sampling laser beam produces a fairly linear wavenumber scale, some degree of imperfection remains in the alignment of the laser and light source beams, along with effects due to the finite entrance aperture size. The correction factor ( k eff ± δ k eff ) is derived from a set of accurately known reference wavenumbers ( σ ref ) of buffer-gas lines present in the spectrogram [10]. For the spectrograms 8202 and 9303, we used Ne i and Ar i, respectively, as calibration standards, and the weighted mean of their k eff and δ k eff was used to calculate corrected wavenumbers ( σ corr ). To ensure a statistically consistent set of data for the calculation of k eff and δ k eff , we employed the Mandel–Paule (MP) estimator, provided in the statistical toolbox as described in ref. [11]. The corrected wavenumbers ( σ corr ) were then derived as σ corr = ( 1 + k eff ) σ meas , and the systematic ( δ σ sys ) and statistical uncertainties ( δ σ stat ) of each line were also computed using the standard procedure given in ref. [10]. The total uncertainty ( δ σ tot ) for each line was computed by taking the quadrature sum of these uncertainties.

3. Results and Discussion

The multiplicative correction factor ( k eff ± δ k eff ) was derived from a set of 15 Ne i ( 3 s 3 p ) and 37 Ar i ( 4 p 3 d ) lines for the spectrograms 8202 and 9303, respectively. The deviation of individual correction factors ( k i ) as a function of wavenumbers is illustrated in the calibration plots in Figure 1.
In this work, a total of eighteen Si ii lines (five in the 8202 and fourteen in the 9303 spectra), involving nine configuration arrays and six levels, ranging from (2530 to 12,740) cm 1 or (4000 to 780) nm, were measured, as listed in Table 1. While most lines exhibited relatively good line profiles, a few of them were found to be peculiar. The lines at 2531 cm 1 and 2533 cm 1 were observed to be in very close proximity with strong Ar i ( 5 p 6 s ) and Ne i ( 4 d 5 f ) transitions, respectively. Additionally, the transition at line 7299 cm 1 displayed a wide profile, whereas line at 7323 cm 1 appeared to be blended with an unidentified line of relatively lower S/N.
Notably, the 4 f 5 g transitions were resolved in our spectrogram. Previously, an unresolved feature of these transitions was reported by Shenstone [5] at 10,621.01 cm 1 . In our spectrogram, we found there two strong lines, 2 F 5 / 2 o 2 G 7 / 2 and 2 F 7 / 2 o 2 G 9 / 2 , within a difference of 0.128 cm 1 (see Table 1).
The average difference in wavenumbers observed in this work and those in the NIST ASD, excluding those for 4 f 5 g transitions, was found to be 0.019 cm 1 with a standard deviation of 0.016 cm 1 , which in turn verifies the present line identifications. Moreover, for most of the observed transitions, a good correlation was found between the observed relative S/N ratios and weighted-transition probabilities ( g A ki ) .

4. Conclusions

This study provided an accurate and at least 10-fold more precise set of eighteen measured lines of Si ii, spanning the range from 2530 cm 1 to 12,740 cm 1 . To the best of our current knowledge, the previously unresolved 4 f 5 g transitions have been resolved in this work and their accurate wavenumbers have been provided.
The accurate and precise data provided in this work may serve as an essential diagnostic probe for plasma physics, the investigation of solar and stellar environments, and mapping galactic gas dynamics using the James Webb Space Telescope’s NIRSpec instrument. Future directions of this work may involve the visible as well as UV regions of Si ii, including their extension to the Si i spectrum, and could involve the application of advanced techniques, such as the judicious implementation of the level optimization (LOPT) for the Si ii spectrum, together with theoretical modeling using extensive Cowan’s code calculations to substantiate its energy levels; hence, the most accurate atomic structure along with radiative transition parameters could be provided for the Si ii spectrum.

Author Contributions

Conceptualization, H.K.; methodology, H.K.; software, Z.M. and H.K.; validation, Z.M. and H.K.; formal analysis, Z.M. and H.K.; investigation, Z.M. and H.K.; resources, H.K.; data curation, Z.M. and H.K.; writing—original draft preparation, Z.M.; writing—review and editing, H.K.; visualization, Z.M. and H.K.; supervision, H.K.; project administration, H.K. All authors have read and agreed to the published version of the manuscript.

Funding

This research received no external funding.

Institutional Review Board Statement

Not applicable.

Informed Consent Statement

Not applicable.

Data Availability Statement

The original contributions presented in the study are included in the article; further inquiries can be directed to the corresponding author.

Conflicts of Interest

The authors declare no conflicts of interest.

References

  1. Pehlivan Rhodin, A.; Hartman, H.; Nilsson, H.; Jönsson, P. Accurate and Experimentally Validated Transition Data for Si I and Si II. Astron. Astrophys. 2024, 682, A184. [Google Scholar] [CrossRef]
  2. Gonzalez, V.R.; Aparicio, J.A.; Val, J.A.D.; Mar, S. Stark Broadening and Shift Measurements of Visible Si II Lines. J. Phys. B At. Mol. Opt. Phys. 2002, 35, 3557–3573. [Google Scholar] [CrossRef]
  3. Fujimoto, S.; Chisholm, J.; Abraham, R.G.; Ao, Y.; Bartosch Caminha, G.; Bauer, F.; Berg, D.; Bergeron, L.; Bradley, L.; Brammer, G.; et al. Resolving Multi-phase Outflow/Inflow via Gas Dynamics and Chemical Abundance Distribution in a Sub-L* Dwarf Galaxy at z = 6.1. JWST Propos. Cycle 2025, 4, 6796. [Google Scholar]
  4. Kramida, A.; Ralchenko, Y.; Reader, J.; NIST ASD Team. NIST Atomic Spectra Database; ver. 5.12; National Institute of Standards and Technology: Gaithersburg, MD, USA, 2026. Available online: https://physics.nist.gov/asd (accessed on 3 March 2026).
  5. Shenstone, A.G. The Second Spectrum of Silicon. Proc. R. Soc. Lond. Ser. A 1961, 261, 153–174. [Google Scholar] [CrossRef]
  6. Fowler, A. Bakerian Lecture: The Spectrum of Silicon at Successive Stages of Ionisation. Philos. Trans. R. Soc. Lond. Ser. A 1926, 225, 1–48. [Google Scholar] [CrossRef][Green Version]
  7. Davis, S.P.; Abrams, M.C.; Brault, J.W. Fourier Transform Spectrometry; Academic Press: San Diego, CA, USA, 2001. [Google Scholar] [CrossRef]
  8. Hill, F.; Bogart, R.S.; Davey, A.; Dimitoglou, G.; Gurman, J.B.; Hourcle, J.A.; Martens, P.C.; Suarez-Sola, I.; Tian, K.; Wampler, S.; et al. The Virtual Solar Observatory: Status and Initial Operational Experience. In Proceedings of the Optimizing Scientific Return for Astronomy through Information Technologies, Glasgow, UK, 24–25 June 2004; pp. 163–169. [Google Scholar]
  9. Nave, G. Xgremlin: A Code for Analyzing Interferograms and Spectra from Fourier Transform Spectrometers. GitHub Repository. 2025. Available online: https://github.com/gnave/Xgremlin (accessed on 1 July 2024).
  10. Haris, K.; Kramida, A. Critically Evaluated Spectral Data for Neutral Carbon (C i). Astrophys. J. Suppl. Ser. 2017, 233, 16. [Google Scholar] [CrossRef]
  11. Kramida, A. Evaluation of Uncertainties in Atomic Data on Spectral Lines and Transition Probabilities. Eur. Phys. J. D 2024, 78, 36. [Google Scholar] [CrossRef]
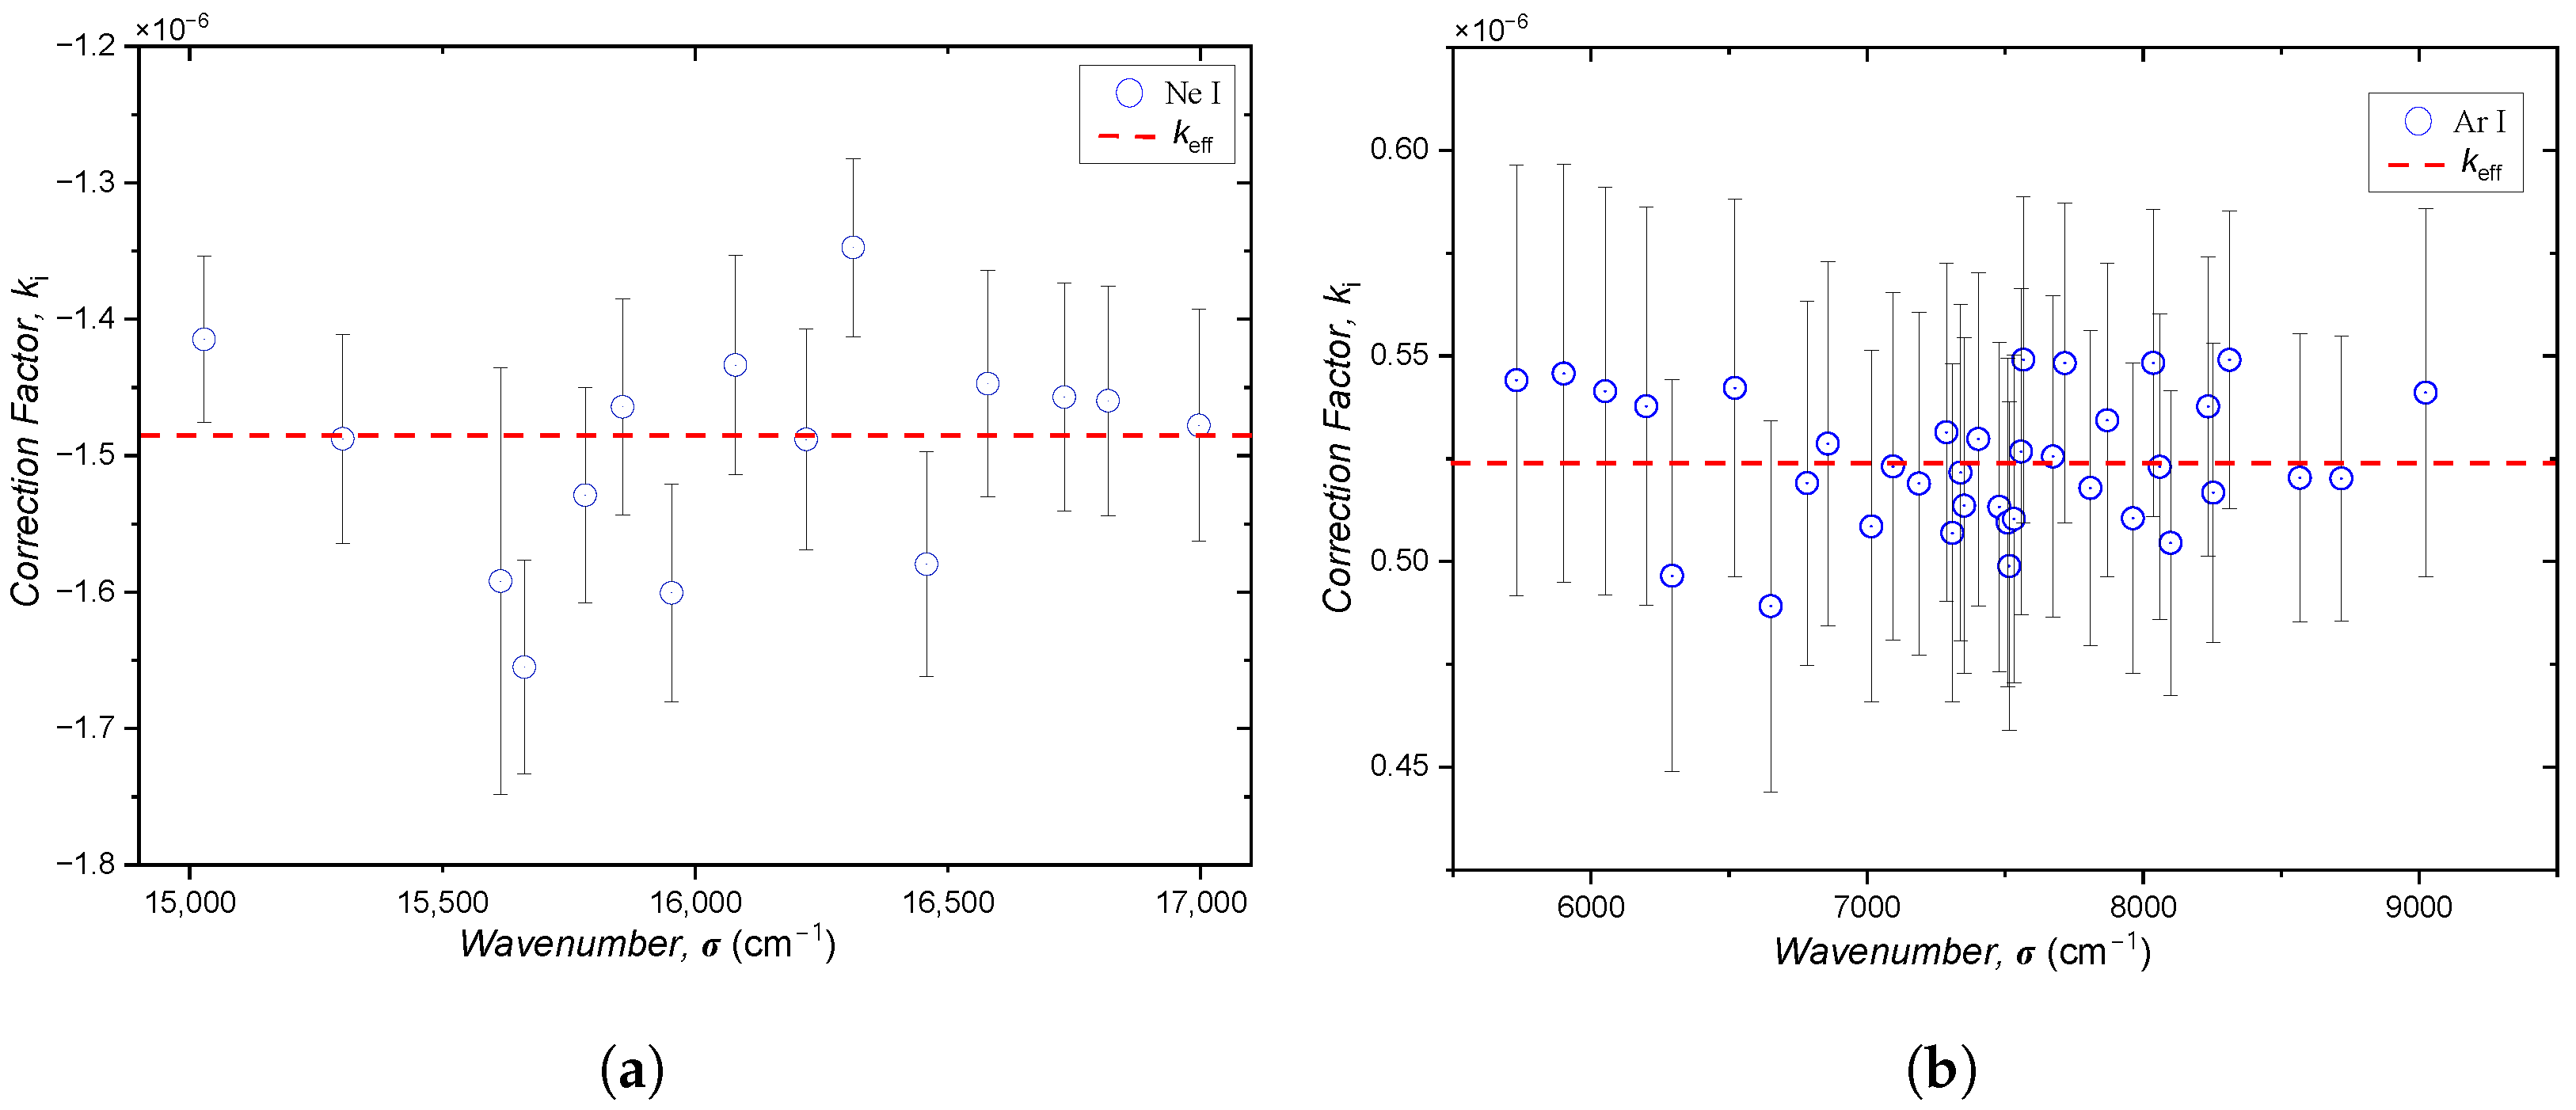
Figure 1. Calibration plots of spectrograms (a) 8202 and (b) 9303.
Psf 13 00007 g001
Table 1. Observed lines of Si II in the IR region.
This Work NIST ASD Δ σ A c
σ corr  a (cm−1)S/NTransition σ ASD  b (cm−1) g A ki × 10 7 (s−1) E1 (cm−1)E2 (cm−1)(cm−1)
2531.715(2)164d 2 D 5 / 2 -4f 2 F 7 / 2 2531.680.67101,024.35103,556.03−0.035
2533.100(6)74d 2 D 3 / 2 -4f 2 F 5 / 2 2533.110.47101,023.05103,556.160.010
2837.724(2)224d 2 D 3 / 2 -5p 2 P 1 / 2 2837.690.43101,023.05103,860.74−0.034
2860.917(1)484d 2 D 5 / 2 -5p 2 P 3 / 2 2860.90.79101,024.35103,885.25−0.017
5888.685(1)1235s 2 S 1 / 2 -5p 2 P 1 / 2 5888.652.5897,972.09103,860.74−0.035
5913.178(1)2995s 2 S 1 / 2 -5p 2 P 3 / 2 5913.165.2497,972.09103,885.25−0.018
7299.216(1)705p 2 P 3 / 2 -6s 2 S 1 / 2 7299.214.88103,885.25111,184.46−0.006
7323.746(1)505p 2 P 1 / 2 -6s 2 S 1 / 2 7323.722.46103,860.74111,184.46−0.026
8509.312(4)165p 2 P 3 / 2 -5d 2 D 3 / 2 8509.312.28103,885.25112,394.56−0.002
8509.527(1)1805p 2 P 3 / 2 -5d 2 D 5 / 2 8509.4720.46103,885.25112,394.72−0.057
8533.837(1)895p 2 P 1 / 2 -5d 2 D 3 / 2 8533.8211.48103,860.74112,394.56−0.017
12,735.802(4)634d 2 D 5 / 2 -5f 2 F 7 / 2 12,735.8 *31.92101,024.35113,760.15−0.002
12,735.96(3)64d 2 D 5 / 2 -5f 2 F 5 / 2 12,735.971.60101,024.35113,760.320.009
12,737.296(5)444d 2 D 3 / 2 -5f 2 F 5 / 2 12,737.27 *22.38101,023.05113,760.32−0.026
2777.660(1)326s 2 S 1 / 2 -6p 2 P 1 / 2 2777.620.69111,184.46113,962.08−0.040
2792.260(1)1166s 2 S 1 / 2 -6p 2 P 3 / 2 2792.261.40111,184.46113,976.720.000
10,620.949(1)1954f 2 F 5 / 2 -5g 2 G 7 / 2 10,621.01 *3.72103,556.16114,177.10.061
10,621.077(1)2544f 2 F 7 / 2 -5g 2 G 9 / 2 10,621.01 *4.65103,556.03114,177.1−0.067
a The quantity given in the parentheses represents the total uncertainty ( δ σ t o t ) in the last digit. b Ritz wavenumbers from the NIST ASD, except those marked with asterisks ‘*’, are experimental values reported by Shenstone [5].
Disclaimer/Publisher’s Note: The statements, opinions and data contained in all publications are solely those of the individual author(s) and contributor(s) and not of MDPI and/or the editor(s). MDPI and/or the editor(s) disclaim responsibility for any injury to people or property resulting from any ideas, methods, instructions or products referred to in the content.


