Abstract
Magnetic confinement nuclear fusion offers a promising solution to the world’s growing energy demands. The DEMO reactor presented here aims to bridge the gap between laboratory fusion experiments and practical electricity generation, posing unique challenges for magnetic plasma diagnostics due to limited space for diagnostic equipment. This study employs Bayesian inference and Gaussian process modeling to integrate data from pick-up coils, flux loops, and saddle coils, enabling a qualitative estimation of the plasma current density distribution relying on only external magnetic measurements. The methodology successfully infers total plasma current, plasma centroid position, and six plasma–wall gap positions, while adhering to DEMO’s stringent accuracy standards. Additionally, the interchangeability between normal pick-up coils and saddle coils was assessed, revealing a clear preference for saddle coils. Initial steps were taken to utilize Bayesian experimental design for optimizing the orientation (normal or tangential) of pick-up coils within DEMO’s design constraints to improve the diagnostic setup’s inference precision. Our approach indicates the feasibility of Bayesian integrated data analysis in achieving precise and accurate probability distributions of plasma parameter crucial for the successful operation of DEMO.
1. Introduction
Humanity’s demand for energy is continually growing. Known reserves of energy sources are rapidly depleting and the consequences of global warming are increasingly being felt. Renewable energy is essential to address these issues, but it faces challenges such as fluctuating supply, energy storage, and land use. There is a clear need for a large-scale, safe, and clean baseload energy supply. This is what nuclear fusion can offer.
The upcoming demonstration fusion reactor, DEMO, will form the bridge between nuclear fusion as a predominantly lab-based scientific endeavour to a practical source of electricity. Unlike ITER, DEMO will not be an experimental setup and will thus have limited space for diagnostics. This necessitates maximal exploitation of the limited available information to a degree that, to the authors’ knowledge, has not been explored previously. Therefore, it is advantageous to combine all available data from diagnostic measurements providing information on a certain plasma parameter, instead of performing the analysis sequentially. Bayesian inference provides such a methodology and delivers a probability distribution of the plasma parameters instead of only a point estimate.
In this work, relying on pick-up coils, flux loops, and saddle coils, we simulate the analysis of external magnetic diagnostics on DEMO with the objective of inferring moments of the plasma current distribution (such as total current and centroid position) and boundary shape parameters. As opposed to the full current density profile, these quantities can be robustly inferred by applying Gaussian process modelling of the current distribution, aided by physical priors. Using the inferred current distribution, we calculated the total plasma current, plasma centroid position, and six plasma–wall gap positions, and evaluated their accuracy and precision. We specifically aimed to obtain the accuracy standards set out for DEMO and assessed the substitutability between saddle coils and normal pick-up coils. Though not part of the specified tolerances, we also analysed the quality of the inferred plasma current density distributions and subsequent poloidal flux density distributions. Furthermore, we explored Bayesian experimental design (BED) to infer the optimal placement of pick-up coils, subject to a number of design limitations at DEMO.
2. Materials and Methods
2.1. Diagnostics
Only magnetic diagnostics were used. The entire set consists of 30 pick-up coils mounted tangentially to the vacuum vessel, 30 normally oriented pick-up coils, 6 flux loops, and 24 saddle coils [1].
A Green’s functions solution to the homogeneous Grad–Shafranov equation results in the following linear model for the vertical () and radial () components of the poloidal magnetic field measured at position , originating from a unit filamentary current located at point [2]:
In addition, the poloidal flux per radian is given by
where K and E are the elliptic integral of the first and second kind [3,4] and
All data used in this work were provided by Consorzio CREATE (Italy) [5] and consisted of 180 synthetic plasma equilibria inside a single poloidal cross-section, together with the corresponding synthetic measurements. Realistic noise levels were added to the measurements, based on ITER-like sources of error [6,7] (and references therein), which were also used to construct the covariance matrix of the diagnostic measurements, assuming conditional independence. The measurement errors are considered as zero-mean Gaussian stochastic variables with a standard deviation dependent on the type of diagnostic, as shown in Table 1.

Table 1.
Measurement error budget (in terms of 2) of ITER.
The noisy measurement m is constructed from the synthetic measurement by adding relative noise and absolute noise , both drawn from Gaussian distributions:
2.2. Gaussian Process Prior for Inference of Current Distribution
The current density distribution along the poloidal cross-section was divided into square pixels with a side length of 10 cm. A Gaussian process (GP) was used for the prior distribution, using a similar approach as previously taken at EAST [8]. Departing from the standard squared exponential (SE) kernel, an advanced squared exponential (ASE) kernel was developed, based on a reference plasma current distribution:
and represent the locations of two pixels of the cross-section. The kernel determines the level of smoothness of the reconstructed current distribution, encoded in the standard deviations and length scales . To determine the and , the currents from the reference distribution were used as a rough template for the current distribution to be inferred:
Here, and are the currents from the reference distribution at locations and , respectively. and are hyperparameters to be determined by numerically optimizing the closed-form expression of the marginal likelihood. Note that we used the Laplacian of the current field instead of the gradient as done in [8]. This yields better results and also better matches the interpretation as a length scale [9].
Each equilibrium was matched with another equilibrium based on their shape parameters, such as elongation and triangularity, creating 90 pairs wherein each equilibrium served as the reference distribution for the other equilibrium and vice versa.
2.3. Calculating Plasma Current and Centroid Position from Inferred Current Distribution
From the current distribution, the distribution of the first main quantity of interest for DEMO operation could be calculated, i.e., the total plasma current . In addition, the distributions of the vertical coordinate and radial coordinate of the current centroid were calculated from [10]
Here, and are the coordinates of the center of the ith pixel with surface area S.
A distribution is often summarized by its mean and standard deviation, which we will use to assess, respectively, the accuracy and precision of our plasma parameter inferences. The accuracy will be evaluated by the root mean square error (RMSE) of the means over the number of different equilibria and the number of different realizations of values for the magnetic measurements with different seeds for the random noise. Similarly, the precision will be summarized by taking the median of all standard deviations.
All total plasma current values were around 19 MA. Therefore, we used a percentage error in the calculation of the RMSE allowing direct comparison to the required accuracy for DEMO, as shown in Table 2. For the RMSE on and , an absolute error was used.

Table 2.
DEMO required accuracy for the estimation of the plasma parameters [6,11].
At present, there are no specified precision requirements for DEMO. We chose to use the absolute standard deviation in the calculation of all three MPSDs.
2.4. Determining Plasma–Wall Gaps from Inferred Current Distribution
The poloidal flux at is the magnetic flux through a disk with center and radius r. A surface connecting points of the same poloidal flux is called a flux surface. The plasma border is defined as the last closed flux surface. This surface self-intersects in the so-called X-point, which is a saddle point of the poloidal flux function. The poloidal magnetic field at the X-point is therefore zero [12]. The poloidal flux along the plasma border is equal to the poloidal flux at this point.
Figure 1a shows six predefined line segments, along with a hypothetical plasma border. DEMO will utilize the positions where the plasma border intersects these six lines to monitor the overall shape of the plasma boundary. Figure 1b illustrates the variation of the plasma border within the dataset.
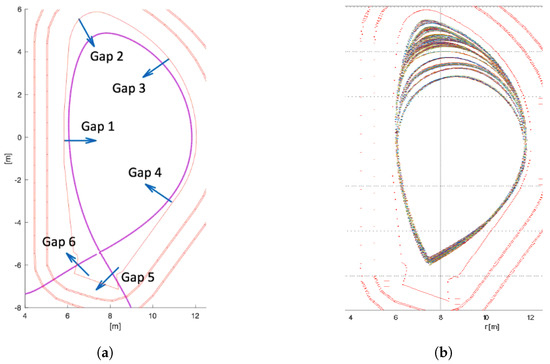
Figure 1.
Graphical representation of the six line segments used to quantify the overall shape of the plasma. (a) The six line segments along which six positions of the plasma border (in purple) are inferred. The poloidal flux function at gaps five and six tends to vary slowly compared to the variation at the other four gaps. (b) The 180 plasma borders in the dataset overlaid on top of each other. Note the higher variability of the plasma border along gaps two and three.
Table 2 specifies that the six inferred locations need to be determined within one centimetre of their true positions. The inference process consisted of first identifying the X-point using the forward model (1) and a classical optimizer. Subsequently, the value of the poloidal flux and its uncertainty at this location were calculated using the forward model (2). Finally, along each of the six line segments, we determined the most probable location of the plasma border (and its uncertainty), relying on a Laplace approximation for the posterior [13]. As before, the RMSE and MPSD quantified the accuracy and precision of our inferences.
2.5. Bayesian Experimental Design for Pick-Up Coil Orientations
The next step involves using BED to determine the optimal design parameters for the magnetic diagnostics at DEMO. The design parameters (position, angle, etc.) influence the corresponding diagnostic measurements D (magnetic field at pick-up coils, flux in saddle coils, etc.), which in turn determine the inferred physical parameters (total plasma current, centroid position, etc.). The goal is to maximize the expected utility (EU) of a diagnostic setup, characterized by design parameters . The Kullback–Leibler divergence is used as the utility function, measuring the similarity between the prior and posterior distribution of the physical parameters [14]. In other terms, BED aims to vary the design parameters in order to maximize the information gain regarding the physical parameters. The general expression of the EU is [15]
The present design restrictions of DEMO specify 60 predetermined candidate positions for the pick-up coils. This limits the design parameters to a choice of tangential or normal coil at each location. We used normalized, sufficiently wide, uniform priors for all plasma parameters across all diagnostic setups. Then, with Gaussian posterior distributions, the Kullback–Leibler divergence solely depends on the posterior uncertainties. Therefore, in our case, the goal is to achieve D-optimality by maximizing the determinant of the Fisher information matrix of the plasma parameters [16]. For computational reasons, only the total plasma current and centroid position, excluding the six plasma–wall gaps, were used as plasma parameters in the BED. The uncertainties of these plasma parameters are calculated as before, by propagating the errors from the inferred current distribution covariance matrix. The parameter O to be optimized is therefore given by
For computational reasons, BED is usually implemented using a one-step-ahead algorithm, as N-step-ahead BED leads to repeated embedded maximizations and integrations. The added precision from optimizing all design parameters at once does not warrant the additional computational cost [17]. Therefore, the first step consisted of calculating the value of O at each of the 60 available locations, both for the option of a tangential or normal pick-up coil, averaged over the 180 equilibria. Among these 120 values, the optimal candidate position and type of the first pick-up coil was determined by the highest value of O. This diagnostic was added to our set of fixed diagnostics. We repeated the process for the next 118 possibilities and added the best diagnostic to the set. This process continued until all 60 available places were filled.
3. Results
3.1. Plasma Current, Centroid Position, and Plasma–Wall Gaps
Three “experiments”, using different sets of available diagnostics, were performed. In each experiment, we evaluated our inference method relying on all 180 equilibria. Each equilibrium was used ten times with a different value for the noise on the diagnostic measurements. This resulted in a total of 1800 inferences. The three experiments always used flux loops and tangential coils, and these two diagnostics will be referred to as “basis”. To this basis, we added normal coils in the first experiment, saddle coils in the second, and both normal and saddle coils in the third.
Figure 2 shows the results for the total plasma current and current centroid position . Figure 3 shows the RMSE for the plasma–wall gaps and Figure 4 the MPSD for the z- and r-coordinate. In Figure 4a, the RMSE on the z-position for gap 1 is trivially zero due to line segment 1 being a horizontal line, as seen in Figure 1a.
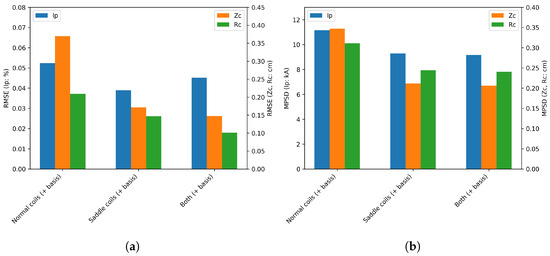
Figure 2.
Summarized evaluations of the inference method on the total plasma current and current centroid position . (a) Accuracy (RMSE), over all 1800 inferences for the three experiments, of the total plasma current and current centroid position . (b) Precision (MPSD), over all 1800 inferences for the three experiments, of the total plasma current and current centroid position .
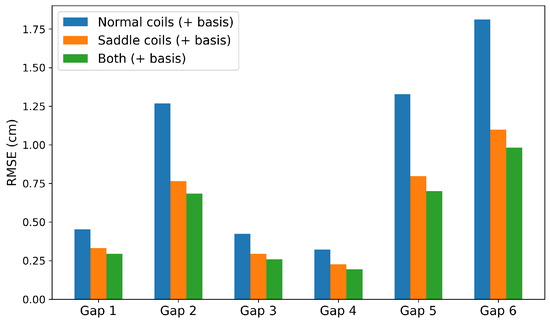
Figure 3.
Root mean square error (RMSE) on the six plasma–wall gaps over all 1800 inferences for the three experiments.
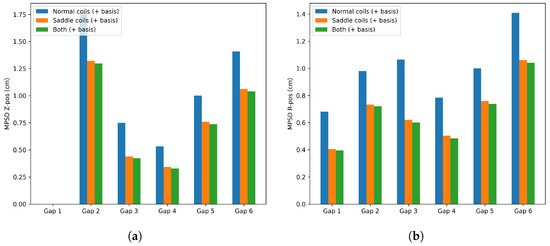
Figure 4.
Median posterior standard deviation (MPSD) on the six plasma–wall gaps over all 1800 inferences for the three experiments. (a) Median posterior standard deviation (MPSD) on the Z-coordinate of the six plasma–wall gaps. (b) Median posterior standard deviation (MPSD) on the R-coordinate of the six plasma–wall gaps.
3.2. Poloidal Current and Flux Distribution
In Figure 5, one representative 2D sample is used to showcase the reconstruction error of the poloidal current and flux distribution.
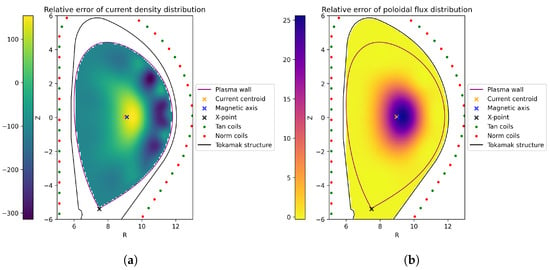
Figure 5.
Percent error per pixel on the inference of the poloidal current and flux distribution of one representative sample. (a) Distribution of the reconstruction error on the poloidal current density. (b) Distribution of the reconstruction error on the poloidal flux.
3.3. Distribution of Pick-Up Coils
Next, preliminary results are presented from a study on the effects of including the 24 saddle coils and 6 flux loops in the set of fixed diagnostics, as well as the impact of noise in the diagnostic measurements.
Figure 6a shows that including saddle coils and flux loops in the set of fixed diagnostics resulted in a lower total number of normal coils in the final configuration. The addition of normal coils mainly happened in the last 20 (out of 60) steps of the step-by-step addition of pick-up coils. Adding pick-up coils to the set of diagnostics marginally decreased the reconstruction error of the current centroid position and slightly increased the reconstruction error of the total plasma current. The tangential coils were mostly located on the inner, top, and bottom sides of the vacuum vessel, while the normal coils were on the outer side.
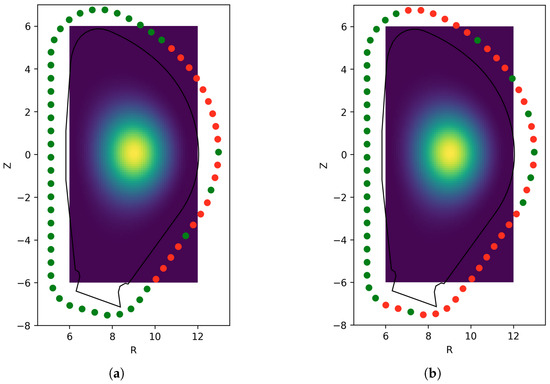
Figure 6.
Final design configuration of the 60 pick-up coils resulting from our BED. Tangential and normal coils are, respectively, indicated with green and red. (a) Distribution of pick-up coils when including saddle coils and flux loops in the set of fixed diagnostics. (b) Distribution of pick-up coils when omitting saddle coils and flux loops.
As seen in Figure 6b, relying on only pick-up coils resulted in approximately the same number of tangential and normal coils after the 60 addition steps. The addition of normal coils was now more evenly distributed throughout the process, rather than mainly occurring in the last 20 steps. On the high-field side, only tangential coils were selected. The bottom region predominantly featured normal coils. The top-left quadrant had tangential coils, whilst the top-right quadrant had normal coils. The low-field side had a mix of both orientations. The step-by-step improvement in the reconstruction error for both total plasma current and centroid position saturated after a certain number of coils, with the point of saturation differing for each plasma parameter.
These effects were observed when we did not add noise to the diagnostic measurements. Both experiments were repeated with noisy diagnostic measurements, yet the inferred design choices did not differ from our inferences that used noise-free measurements.
4. Discussion and Outlook
The presented results enable us to draw conclusions on the validity of our current tomography inference method and inform potential design choices for DEMO. They also highlight gaps in our knowledge that should be addressed in future work.
Our equilibrium inference method differs from other methods in that it requires a reference equilibrium, making it crucial to assess its influence on the results. We found that relying on another reference equilibrium did not substantially alter the outcomes of the experiments. Additionally, utilizing optimized hyperparameters and from other equilibria did not significantly impact the results. This is in part because the 180 sets of optimized hyperparameters did not differ much from one another. This suggests that our method demonstrates robustness across different reference equilibria and slightly different hyperparameter values. In practical real-time implementations, the equilibrium inferred in the previous time step could serve as the reference, and a general pair of hyperparameter values could be used without the need for hyperparameter optimization for each inference.
Figure 2 indicates that our method can be used to infer the total plasma current and centroid position with the needed DEMO accuracy from Table 2. Either normal coils, saddle coils, or both can be used. Implementing saddle coils instead of normal coils results in an improvement in both accuracy and precision. Employing both marginally improves the inference.
The RMSEs on the plasma–wall gaps in Figure 3 are all below 2 cm. However, when checking the individual inferences, 9.5% are above 2 cm when utilizing normal coils. With saddle coils, this is only the case for 2.7%. This value further reduces to 0.8% when employing both types of diagnostics. Therefore, we advise relying on saddle coils for the plasma–wall gaps inferences. When used instead of normal coils, the accuracy of our inferences increased almost two-fold. The location of gap 2 varies the most across the dataset and the lower accuracy can therefore be explained by the effect of the reference prior. The lower accuracies for gaps 5 and 6 are the result of the more slowly changing poloidal flux as a function of position at the region of the X-point.
From Figure 5, one can see that the reconstruction of the current density distribution is affected by relatively large relative errors, yet is in the same order of magnitude as the ground truth. The ground truth and inferred distribution are therefore qualitatively similar. The relative error on the poloidal flux distribution is small on the outside of the plasma, resulting in a good reconstruction of the plasma border, although it becomes larger towards the plasma center. Both reconstructions could benefit from additional diagnostics that provide internal information on the plasma, such as interferometry and polarimetry [18].
D-optimality allowed us to confirm that normal coils are not as important when saddle coils are present, but they are just as important as tangential coils when no other diagnostics are used. The method allowed us to identify regions of the vacuum vessel where placement of tangential or normal coils would lead to improved reconstructions. It also yielded a ranking of coil importance.
To measure the total plasma current, in principle, tangential pick-up coils would be needed all along a poloidal contour around the plasma. The results in Figure 6 do not reflect that need. The reason for this design choice is not yet clear, but it may be related to the rather informative prior or a relatively aggressive optimization leading to low redundancy of the tangential coils. Indeed, a design with alternating pick-up coil orientation along the vacuum vessel has a quite high redundancy, as the missing information from the failure of a tangential coil can easily be compensated by other close-by tangential coils. The final configuration achieved via experimental design is characterized by relatively long poloidal segments with only a few tangential coils. Future work will examine the effect of sensor failure on the inference and the optimal design. Additionally, the plasma–wall gaps should be added to the set of plasma parameters used in the experimental design.
Author Contributions
Conceptualization, J.D.R., A.P., M.A., A.Q. and G.V.; methodology, J.D.R. and G.V.; software, J.D.R.; validation, J.D.R.; formal analysis, J.D.R. and A.P.; investigation, J.D.R., A.P., M.A. and A.Q.; resources, A.P., M.A., A.Q. and G.V.; data curation, J.D.R., A.P., M.A. and A.Q.; writing—original draft preparation, J.D.R.; writing—review and editing, A.P., M.A., A.Q. and G.V.; visualization, J.D.R.; supervision, G.V.; project administration, G.V.; funding acquisition, J.D.R. and G.V. All authors have read and agreed to the published version of the manuscript.
Funding
The Research Foundation—Flanders (FWO) is acknowledged for co-financing the research via PhD Fellowship 1SH6424N.
Institutional Review Board Statement
Not applicable.
Informed Consent Statement
Not applicable.
Data Availability Statement
Data sharing is not applicable to this article.
Acknowledgments
This work has been carried out within the framework of the EUROfusion Consortium, funded by the European Union via the Euratom Research and Training Programme (Grant Agreement No 101052200—EUROfusion). The views and opinions expressed are, however, those of the author(s) only and do not necessarily reflect those of the European Union or the European Commission. Neither the European Union nor the European Commission can be held responsible for them.
Conflicts of Interest
There are no conflicts to declare.
References
- Biel, W.; Ariola, M.; Bolshakova, I.; Brunner, K.J.; Cecconello, M.; Duran, I.; Franke, T.; Giacomelli, L.; Giannone, L.; Janky, F.; et al. Development of a concept and basis for the DEMO diagnostic and control system. Fus. Eng. Des. 2022, 179, 113122. [Google Scholar] [CrossRef]
- Ariola, M.; Pironti, A. Magnetic Control of Tokamak Plasmas, 1st ed.; Springer: London, UK, 2008; pp. 143–144. [Google Scholar]
- Olver, F.; Lozier, D.; Boisvert, R.; Clark, C. The NIST Handbook of Mathematical Functions; Cambridge University Press: New York, NY, USA, 2010; Online Version: NIST Digital Library of Mathematical Functions; Version 1.2.1 of 15-06-2024. Available online: http://dlmf.nist.gov/ (accessed on 22 June 2024).
- Abramowitz, M.; Stegun, I.A. Handbook of Mathematical Functions, 1st ed.; National Bureau of Standards: Washington, DC, USA, 1964; pp. 608–609. [Google Scholar]
- Pironti, A. (University of Naples Federico II, Napoli, Italy); Mattei, M. (University of Naples Federico II, Napoli, Italy). Private communication, 2022.
- Quercia, A.; Albanese, R.; Fresa, R.; Minucci, S.; Arshad, S.; Vayakis, G. Performance analysis of Rogowski coils and the measurement of the total toroidal current in the ITER machine. Nucl. Fusion 2017, 57, 126049–126070. [Google Scholar] [CrossRef]
- Quercia, A.; Pironti, A.; Bolshakova, I.; Holyaka, R.; Duran, I.; Murari, A. Long term operation of the radiation-hard Hall probes system and the path toward a high performance hybrid magnetic field sensor. Nucl. Fusion 2022, 16, 106032. [Google Scholar] [CrossRef]
- Zijie, L.; Zhengping, L.; Tianbo, W.; Yao, H.; Yuehang, W.; Qingze, Y.; Wangyi, R.; Qiping, Y.; Bingjia, X.; Jiangang, L. An advanced plasma current tomography method based on Bayesian inference and neural networks for real-time application. Plasma Phys. Control. Fusion 2022, 64, 125005. [Google Scholar] [CrossRef]
- Hastie, T.J.; Tibshirani, R.J. Generalized Additive Models, 1st ed.; Chapman & Hall/CRC: Washington, DC, USA, 1990; pp. 27–28. [Google Scholar]
- Braams, B.J. The interpretation of tokamak magnetic diagnostics. Plasma Phys. Control Fusion 1990, 33, 720–722. [Google Scholar] [CrossRef]
- Quercia, A.; Pironti, A.; Lucca, F.; Duran, I.; Turjanica, P.; Renko, G.; Luis, R. Design Description Document (DDD) for magnetic diagnostics on DEMO. University of Naples Federico II, Napoli, Italy. 2025; in preparation. [Google Scholar]
- Deshko, G.N.; Kilovataya, T.G.; Kuznetsov, Y.K.; Pyatov, V.N.; Yasin, I.V. Determination of the plasma column shape in a tokamak from magnetic measurements. Nucl. Fusion 1983, 23, 1309. [Google Scholar] [CrossRef]
- Kass, R.E.; Tierney, L.; Kadane, J.B. Laplace’s method in Bayesian analysis. In Statistical Multiple Integration; Flournoy, N., Tsutakawa, R.K., Eds.; American Mathematical Society: Providence, RI, USA, 1991; pp. 89–100. [Google Scholar]
- Lindley, V.D. On a measure of the information provided by an experiment. Ann. Math. Stat. 1956, 27, 986. [Google Scholar] [CrossRef]
- von der Linden, W.; Dose, V.; Von Toussaint, U. Bayesian Probability Theory: Applications in the Physical Sciences, 1st ed.; Cambridge University Press: Cambridge, UK, 2014; pp. 491–492. [Google Scholar]
- Pukelsheim, F. Optimal Design of Experiments, 1st ed.; Society for Industrial and Applied Mathematics: Philadelphia, PA, USA, 2006; pp. 210–212. [Google Scholar]
- Pronzato, L. Optimal experimental design and some related control problems. Automatica 2008, 44, 303. [Google Scholar] [CrossRef]
- Zijie, L.; Zhengping, L.; Tianbo, W.; Yao, H.; Yuehang, W.; Qingze, Y.; Wangyi, R.; Qiping, Y.; Bingjia, X.; Jiangang, L. Plasma profile tomography for EAST based on integrated data analysis. Plasma Phys. Control. Fusion 2022, 64, 094001. [Google Scholar] [CrossRef]
Disclaimer/Publisher’s Note: The statements, opinions and data contained in all publications are solely those of the individual author(s) and contributor(s) and not of MDPI and/or the editor(s). MDPI and/or the editor(s) disclaim responsibility for any injury to people or property resulting from any ideas, methods, instructions or products referred to in the content. |
© 2025 by the authors. Licensee MDPI, Basel, Switzerland. This article is an open access article distributed under the terms and conditions of the Creative Commons Attribution (CC BY) license (https://creativecommons.org/licenses/by/4.0/).