Proceeding Paper

Life Cycle Assessment of Argentinian Dry Bean Flour †

by
María Gimena Torres
1,*,
Silvina Cecilia Andrés
2,
Nadia Florencia Nagai
2,
Gabriel Lorenzo
1,2 and
Germán García Colli
1,3
1
Departamento de Ingeniería Química, Universidad Nacional de La Plata (UNLP), La Plata B1900TAG, Argentina
2
Centro de Investigación y Desarrollo en Ciencia y Tecnología de los Alimentos (CIDCA), CONICET, CICPBA, Facultad de Ciencias Exactas (UNLP), La Plata B1900AJJ, Argentina
3
Centro de Investigación y Desarrollo en Ciencias Aplicadas ‘Dr. J. J. Ronco’ (CINDECA), CONICET, CICPBA, Facultad de Ciencias Exactas (UNLP), La Plata B1900AJK, Argentina
*
Author to whom correspondence should be addressed.
Presented at the 6th International Electronic Conference on Foods, 28–30 October 2025; Available online: https://sciforum.net/event/foods2025.
Biol. Life Sci. Forum 2026, 56(1), 27; https://doi.org/10.3390/blsf2026056027
Published: 26 March 2026
(This article belongs to the Proceedings of The 6th International Electronic Conference on Foods)

Abstract

Plant-based sources are being assessed as alternatives to animal-based foods as a strategy to reduce environmental impacts. This study aimed to calculate the environmental footprint of dry bean flour made from Phaseolus vulgaris sp. cultivated in the Argentine Northwest. Since grain pre-treatment influences the flour’s nutritional value, three different processing methods were evaluated. A comparative Life Cycle Assessment was conducted for 1 kg of flour. Primary stages assessed were seed and grain production, transportation, processing, and flour production. Agrochemicals used in the field stages had a significant impact on ecotoxicity. Energy consumption from non-renewable sources represents a significant burden on pretreated flour.

1. Introduction

Dry bean (Phaseolus vulgaris sp.) production is one of the most important legume crops in Argentina. For the 2023/2024 campaign, almost 580,000 hectares were cultivated. The two main varieties are: black and white dry beans. The Argentine Northwest, a semi-arid region that includes the provinces of Salta, Jujuy, and Tucumán, is the most suitable for the cultivation of this species [1].
Furthermore, it is a short-cycle crop that grows during the rainy season; therefore, watering is not necessary. On the other hand, chemical fertilizers are not used since leguminous plants naturally fix atmospheric nitrogen. Dry beans are an excellent source of energy and nutrients, notable for their high protein, vitamins, and mineral content. One-hundred grams of raw beans represent 333 kcal, 23% w/w protein, 60% w/w carbohydrates, and significant amounts of calcium, iron, potassium, folate, and thiamin, among others [2]. Despite their nutritional properties and availability, consumption of dry beans in Argentina remains extremely low (legume consumption was 800 g per person in 2020) [3]. Therefore, some efforts are currently underway to include this legume in the Argentinian diet by developing nutritious recipes using bean flour. Pretreating the grain is an alternative to improve the nutritional value of the resulting flour. In a previous work, soaking and soaking–cooking were studied to reduce the presence of non-nutritional compounds (protease inhibitors, phytates, and condensed tannins) that could cause several negative effects when ingested [4]. As soaking does not significantly alter the non-nutritional compounds, it was necessary to add a cooking process afterwards. This process reduced the content of trypsin inhibitors by 93.1%, phytates by 38.2%, flavonoids by 81.7%, and tannins by 82.3%, compared to untreated beans. In the case of nutritional compounds, proteins and lipids remained practically the same, with a slight increase of 2.2% and 7.2%, respectively. Furthermore, the dietary fiber content increased significantly by 66.5% and 105.1% of total and insoluble fractions, respectively [4].
In summary, dry beans offer multiple benefits in terms of agricultural management and human health. Moreover, based on their environmental profile, they could be a better alternative to other food sources [5]. For this purpose, Life Cycle Assessment (LCA) is a widely applied and accepted methodology that allows the classification of foods according to their environmental performance [6]. In recent years, various LCAs have been carried out in North America and Europe to quantify the environmental footprint of dry beans [7,8,9,10]. Significant differences were found in the process involved compared to the usual practices applied in Argentina, which limits the application of those results in a regional evaluation. The main differences were found in agricultural management, such as the use of external irrigation, the application of fertilizers, and crop rotation, which significantly affect crop yield and environmental impacts. Furthermore, the beans are cooked and canned for sale, which represents another important difference from Argentine marketing and export. To the best of the authors’ knowledge, no previous contribution has performed an evaluation of dry bean flour production within the system boundaries.
The aim of this analysis was to calculate the LCA of flour produced from dry beans (Phaseolus vulgaris sp.) cultivated in Argentina. The study considered the “cradle to gate” attributional life cycle scope following ISO 14040 [11] and 14044 standards [12].

2. Materials and Methods

2.1. Functional Unit and System Boundaries

A functional unit of 1 kg of dry bean flour was considered, and three flour types resulting from different grain pretreatments were evaluated [4]: raw (R-BF), soaked (S-BF), and soaked and cooked (SC-BF).
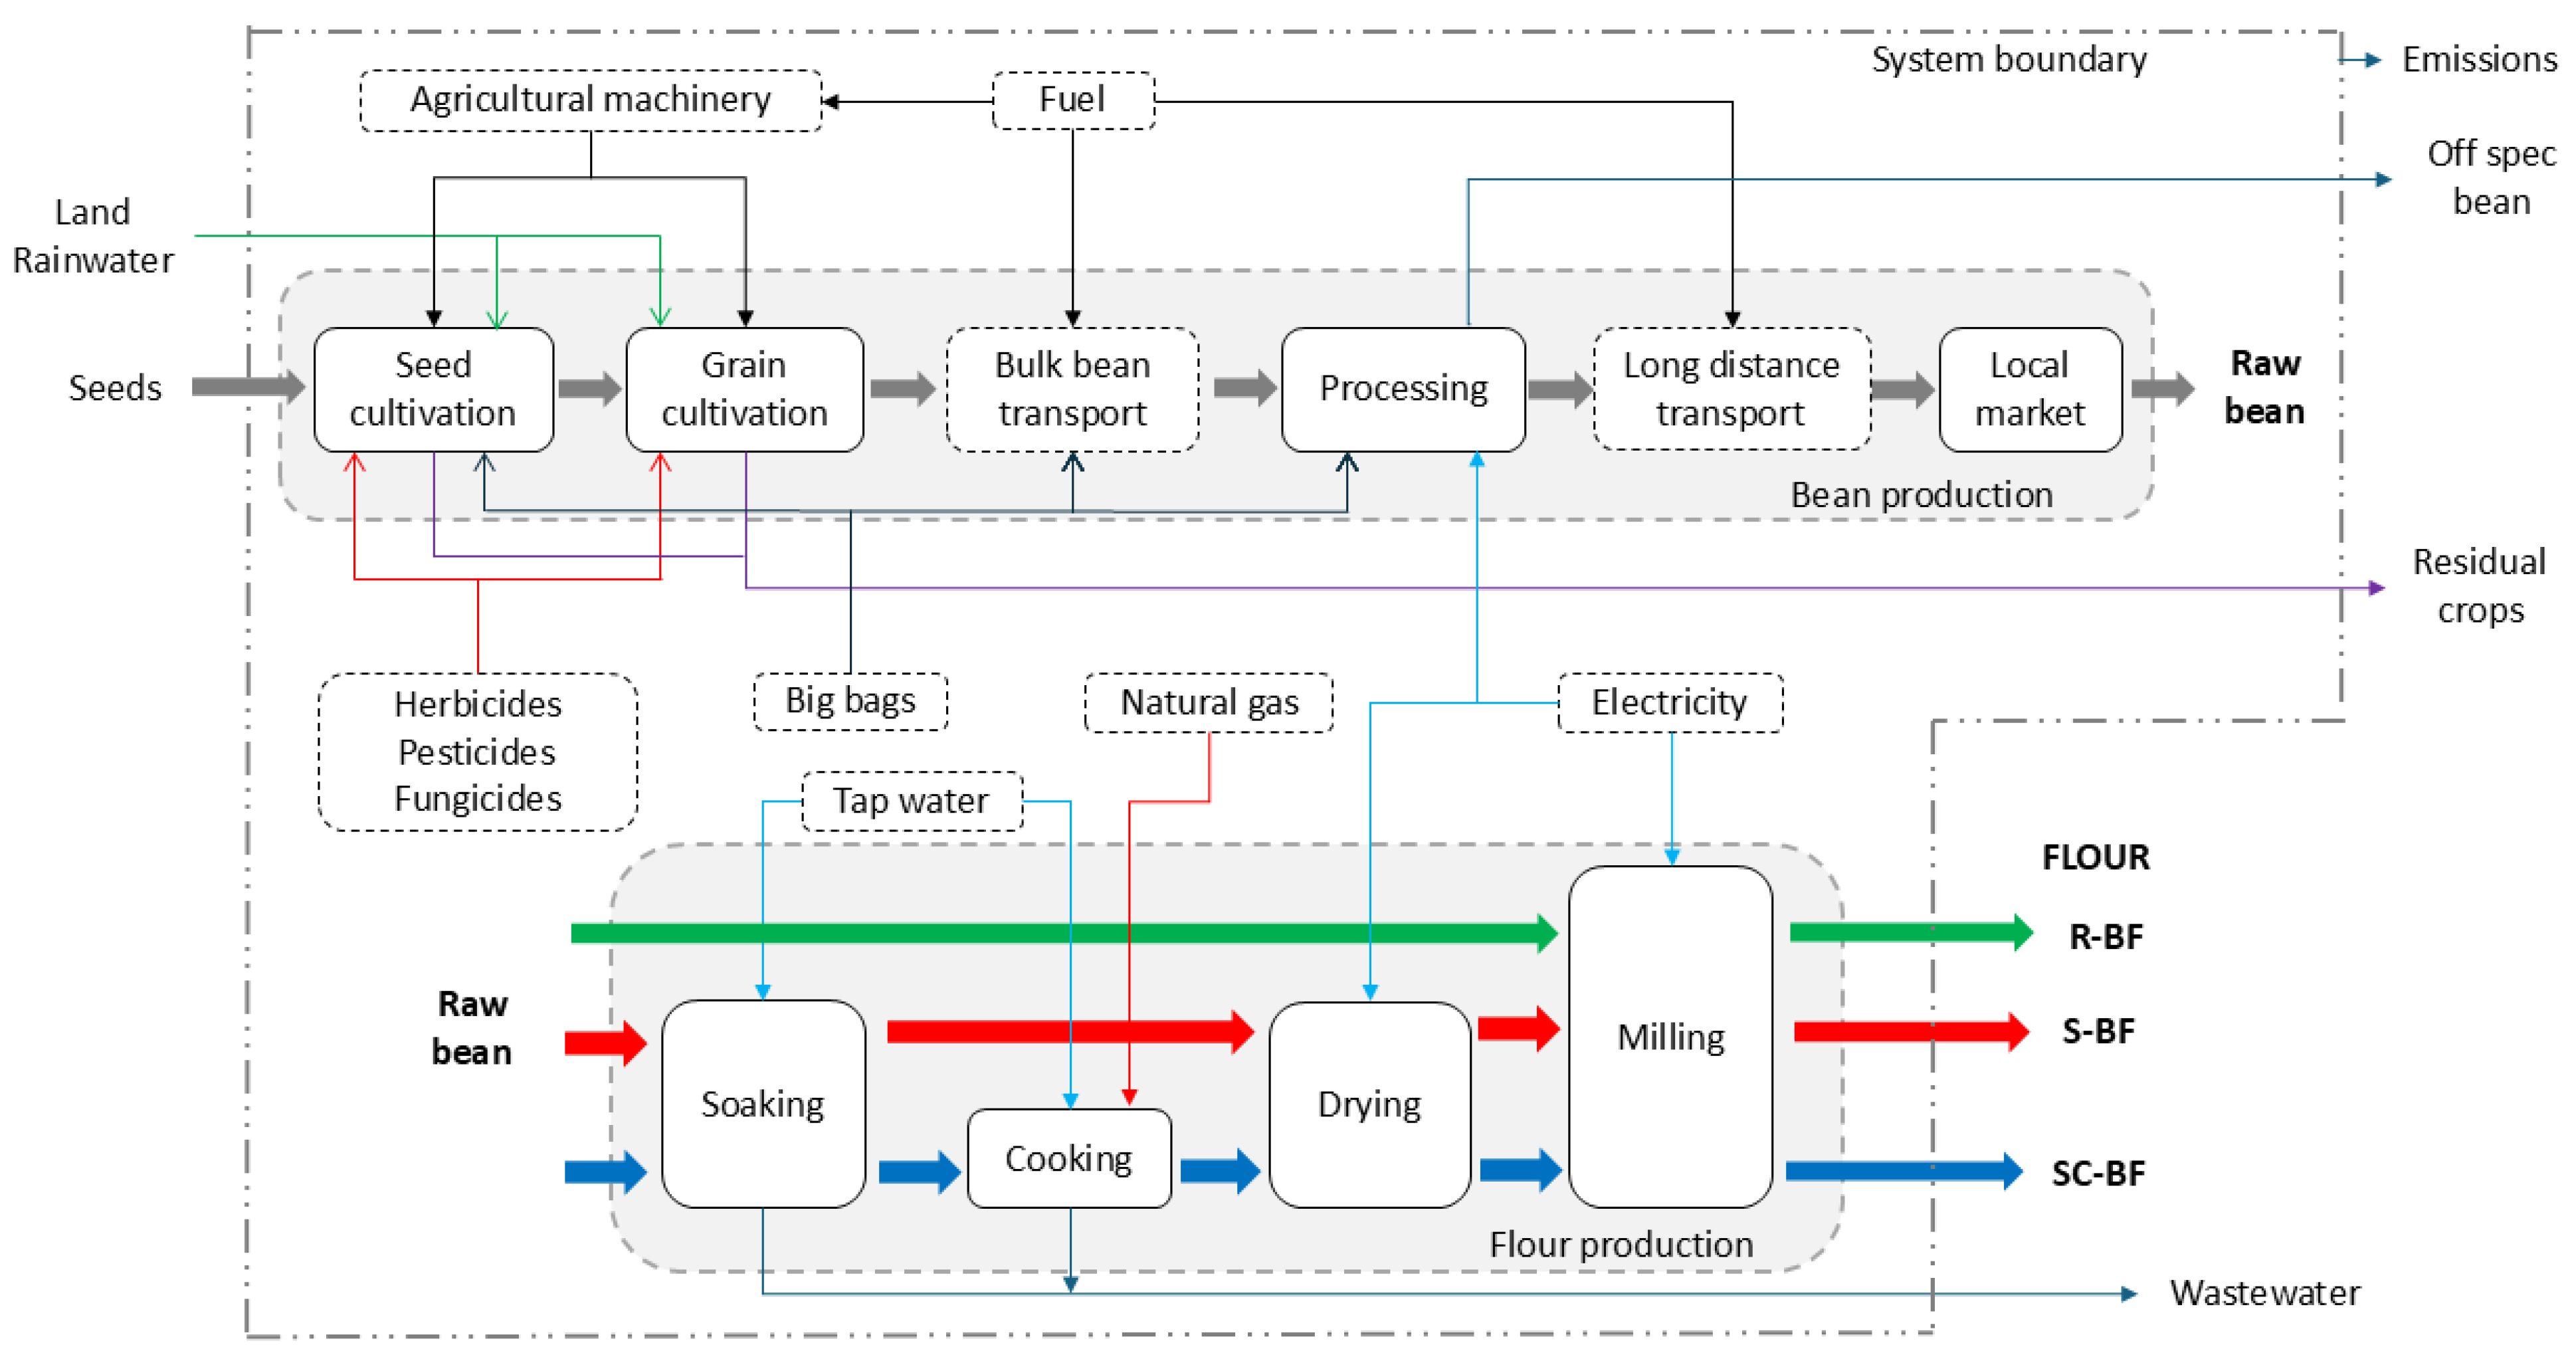
The LCA system boundary is shown in Figure 1. The primary phases were seed cultivation, grain production, grain processing, and the local market. In the case of flour processing, the stages were milling for R-BF; soaking, drying, and milling for S-BF; and soaking, cooking, drying, and milling for SC-BF. Secondary processes were grain transport from the field to plant processing, grain transport from plant processing to the local market, bag/big bag production, glyphosate production, energy generation (electricity and natural gas), sowing, harvesting, fuel consumption by agricultural machinery, and tap water production, among others.
LCA was performed using openLCA v2.0.3 software. LCIA method was Recipe 2016 Midpoint impact categories (Hierarchist) [13], focusing on global warming potential, acidification, ecotoxicity, eutrophication, non-renewable resources scarcity, land use, and water consumption.

2.2. Life Cycle Inventory (LCI)

Primary data was obtained from different sources. For seed cultivation and grain processing, Porosem S.R.L. and Alimar S.A. were contacted, respectively. They provided inventory data for the 2023 campaign. The Instituto Nacional de Tecnología Agropecuaria (INTA) provided the grain cultivation data for the 2023 harvest campaign of Salta province.
For secondary processes, available inventories in Agribalyse v301 and ELCD v3.2 databases were used. The inventory of glyphosate production was the only one considered because it was the only agrochemical process with available data.

2.2.1. Seed Production

The bean seeds are produced in different locations with rigorous classification and controlled quality. Seed cultivation is distributed in the north of Córdoba, Tucumán, Salta (outside the grain production area), and Jujuy. The cultivated land can vary typically between 20 and 100 ha. An average planting density of 100 kg of seeds per ha was sown. The harvested seeds are subjected to quality control and classification, obtaining a yield of 800 kg/ha. Bags with a capacity of 40 kg are used as main sales presentation. An average distance of 100 km was considered from seed cultivation to grain cultivation land. The agrochemical program was assumed to be the same as that used for the grain cultivation phase (see Section 2.2.2).

2.2.2. Grain Cultivation

Before sowing, three chemical fallows are applied in November, January, and February by ground spraying. Additionally, seeds are treated with fungicide. Sowing starts at the end of February, and it can be repeated at the beginning of March. During March and April, three phytosanitary treatments are applied by ground spraying. The agrochemical type, dosing, and time of application are listed in Table S1 of the Supplementary Material. Harvesting is performed in June. In 2023, 105 kg of seeds were sown to produce a mean of 1100 kg of grain per ha. Big bags of 1000 kg are used to collect the production and transport it to the processing stage. For agricultural machinery, a yield of 3 and 4 ha per hour was assumed for the seeder and harvester, respectively. Fuel consumption of 26.6, 10.6, and 0.8 L/ha was considered for sowing, harvesting, and supplies transport, respectively [14].

2.2.3. Emissions Estimation for Seed and Grain Cultivation

Changes in biomass due to legume cultivation were assumed to be zero since it is an annual crop. Changes in soil organic carbon (SOC) were estimated according to IPCC tier 1 [15] using current values for SOC0 and SOCref for the Yungas region [16]. Pesticide emissions distribution was: 90% to agricultural soil, 9% to air, and 1% to water according to PEFCR guidelines [17]. An analysis of heavy metal emissions was performed according to Agri-footprint [18,19]. Since no fertilizers were applied and there was no information on the heavy metal content of pesticides, the resulting emission value was zero.

2.2.4. Grain Processing

An average transport distance of 250 km was estimated from the core production area in Salta to Güemes Industrial Park (Salta), where the evaluated fabric is located. The industrial facilities are in a 10,000 m2 area. The processing stage consists of a first step of cleaning (dust and spoiled beans), followed by a classification by size and color. Production is packaged in bags of 25, 50, and 1000 kg capacity. During the 2023 campaign, 25,000 tons of beans were processed at a rate of 8000 kg/h. A processing discard of 9% of the feed grain and total electricity consumption of 363,000 kWh was recorded during the same year.

2.2.5. Local Market

A mean distance of 1425 km was estimated to transport the packaged grain from industrial facilities in the northwest of the country to Buenos Aires, where exports and local markets are concentrated. In Argentina, grain retail sales are primarily carried out through bulk sales in natural stores. For this reason, it was assumed there was no processing or fractionation at this stage.

2.2.6. Flour Production

Processing stages data were obtained from previous work conducted at laboratory scale at the Centro de Investigación y Desarrollo en Ciencia y Tecnología de los Alimentos (CIDCA) [4]. For R-BF, grains were ground with a domestic mill and passed through a 40-mesh sieve (300 um particle size). For S-BF and SC-BF, the soaking stage consisted of soaking the grains in water with a mass ratio of 3:1 for 8 h at 20 °C. After soaking, SC-BF grains were cooked in excess boiling water (water/grain mass ratio 5:1) at atmospheric pressure for 40 min. Subsequently, S-BF and SC-BF were drained, cooled and frozen for 24 h at −80 °C under vacuum conditions in a freeze dryer. After that, the milling process was carried out as previously described.
Electricity consumption for the grinder and the freeze dryer was estimated from data provided by the equipment vendor and considering the Argentine mix generation in 2022 (see Table S2 of Supplementary Material) [20]. For cooking, natural gas from the residential distribution network of Argentina was considered [21].
Although this study was not intended to conduct an economic or techno-economic assessment, a preliminary estimate of the relative energy-related costs of flour production was prepared to provide context on the economic implications of the different processing routes.
As a result of the treatment processes, 1.03, 1.26, and 1.35 kg of packaged dry beans were required to produce 1 kg of R-BF, S-BF, and SC-BF, respectively.

2.2.7. Sensitivity Analysis

Crop yield varies over the years depending on ambient conditions, such as maximum and minimum temperatures, rainfall, and the application of pesticides, among other factors. Based on the trend of crop yield in the province of Salta over the last 10 years [1], a sensitivity analysis was performed considering a variation of +/−25% with respect to the inventory value of 1100 kg/ha, which is consistent with the maximum and minimum yield values during the mentioned period.

3. Results

The Life Cycle Impact Assessment (LCIA) was evaluated with the Recipe 2016 methodology, and Midpoint impact categories (Hierarchist perspective) were considered [13]. The following categories were evaluated: global warming potential (GWP), stratospheric ozone depletion (SOD), freshwater ecotoxicity (FWEc), freshwater eutrophication (FWEu), terrestrial ecotoxicity (TEc), terrestrial acidification (TA), fossil resource scarcity (FRS), mineral resource scarcity (MRS), water consumption (WC), and land use (LU). Results for the three bean flours and for the average, maximum, and minimum yield are presented in Table 1.
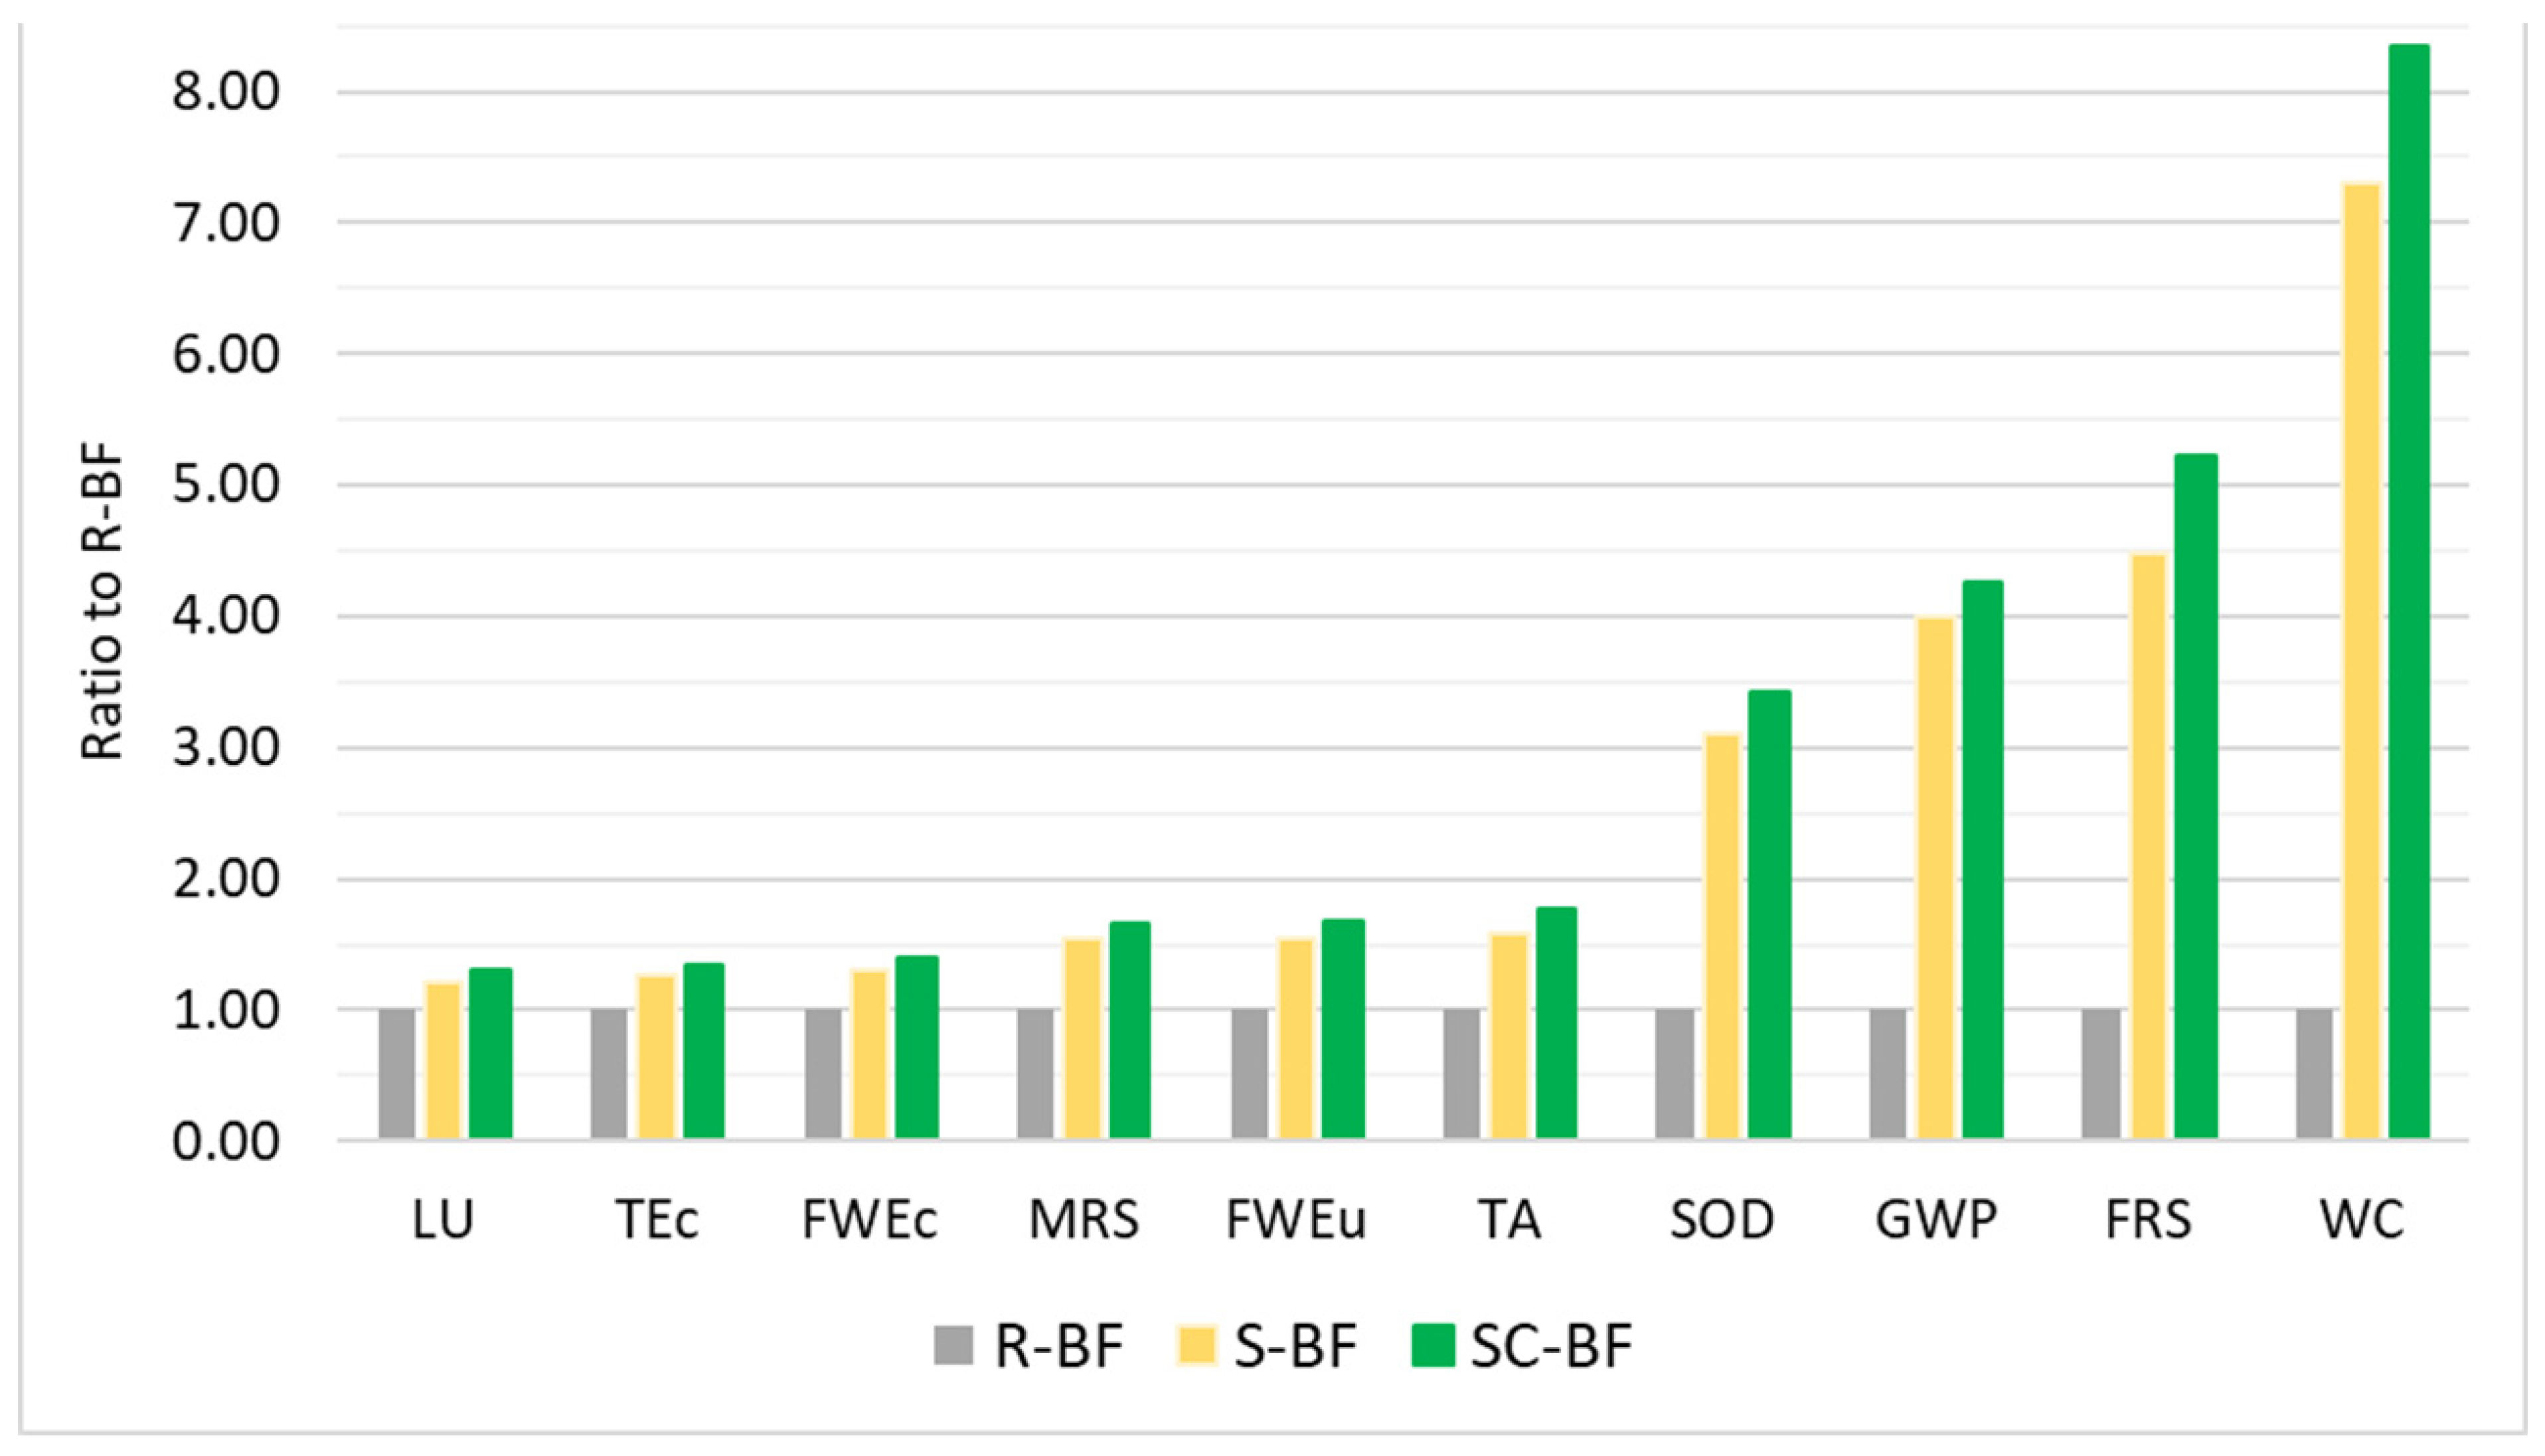
Figure 2 shows the value of each impact category for S-BF and SC-BF expressed as a ratio to R-BF. For LU, TEc, and FWEc, the impact value increased by 0.2 to 0.4 times for S-BF and SC-BF with respect to R-BF. This increase was primarily driven by the grain yield in the flour inventory and its impact on the agricultural phases, which increased all impact categories by 22% and 30% for S-BF and SC-BF relative to R-BF. LU increased linearly with grain yield due to the cultivated land. In the case of TEc and FWEc, although the greatest contribution to the increase in the impact value was due to the larger cultivated area, the influence of electricity consumption in the flour production stage was noticeable. MRS, FWEu, and TA values increased by 0.5 and 0.8 times with respect to R.BF. In the case of GWP, SOD, and FRS, ratios increased significantly, reaching values between 2 and 3.5 times for S-BF and between 2.4 and 4.2 times for SC-BF with respect to R-BF. The specific case of WC showed a marked increase between 6.3 and 7.2 times due to the influence of hydroelectric power in the electricity mix (Table S2 in Supplementary Material) and, to a lesser extent, the increase in water consumption in the flour production phase.
Results showed that for the impact categories LU, TEc, FWEc, MRS, FWEu, and TA, the total impact value was governed by the agricultural and transport stages. The contributions of the main processes to the impact category values associated with the R-BF life cycle are detailed as follows. LU value was mainly due to grain cultivation (88.2%) and seed cultivation (11.5%). The total value of TEc was associated with the use of agrochemicals in the grain phase (59.3%) and in the seed phase (7.8%), while transport generated 26.8% of the emissions. FWEc was notably influenced by the use of agrochemicals during the grain phase (74.7%) and during the seed phase (9.8%). In the case of MRS, 69.1% was due to the use of agricultural machinery, 14.6% to transport, and 12.9% to glyphosate production. For FWEu, the main contributors were the use of agricultural machinery (45.3%), glyphosate production (32.4%), and transport (17.0%). In the case of TA, transport (43.5%), fuel for agricultural machinery (26.9%), and use of agricultural machinery (21.4%) were the main contributors. Since the burden of electricity generation and natural gas production was negligible in the categories previously mentioned, the total impact values showed a slight increase for S-BF and SC-BF with respect to R-BF.
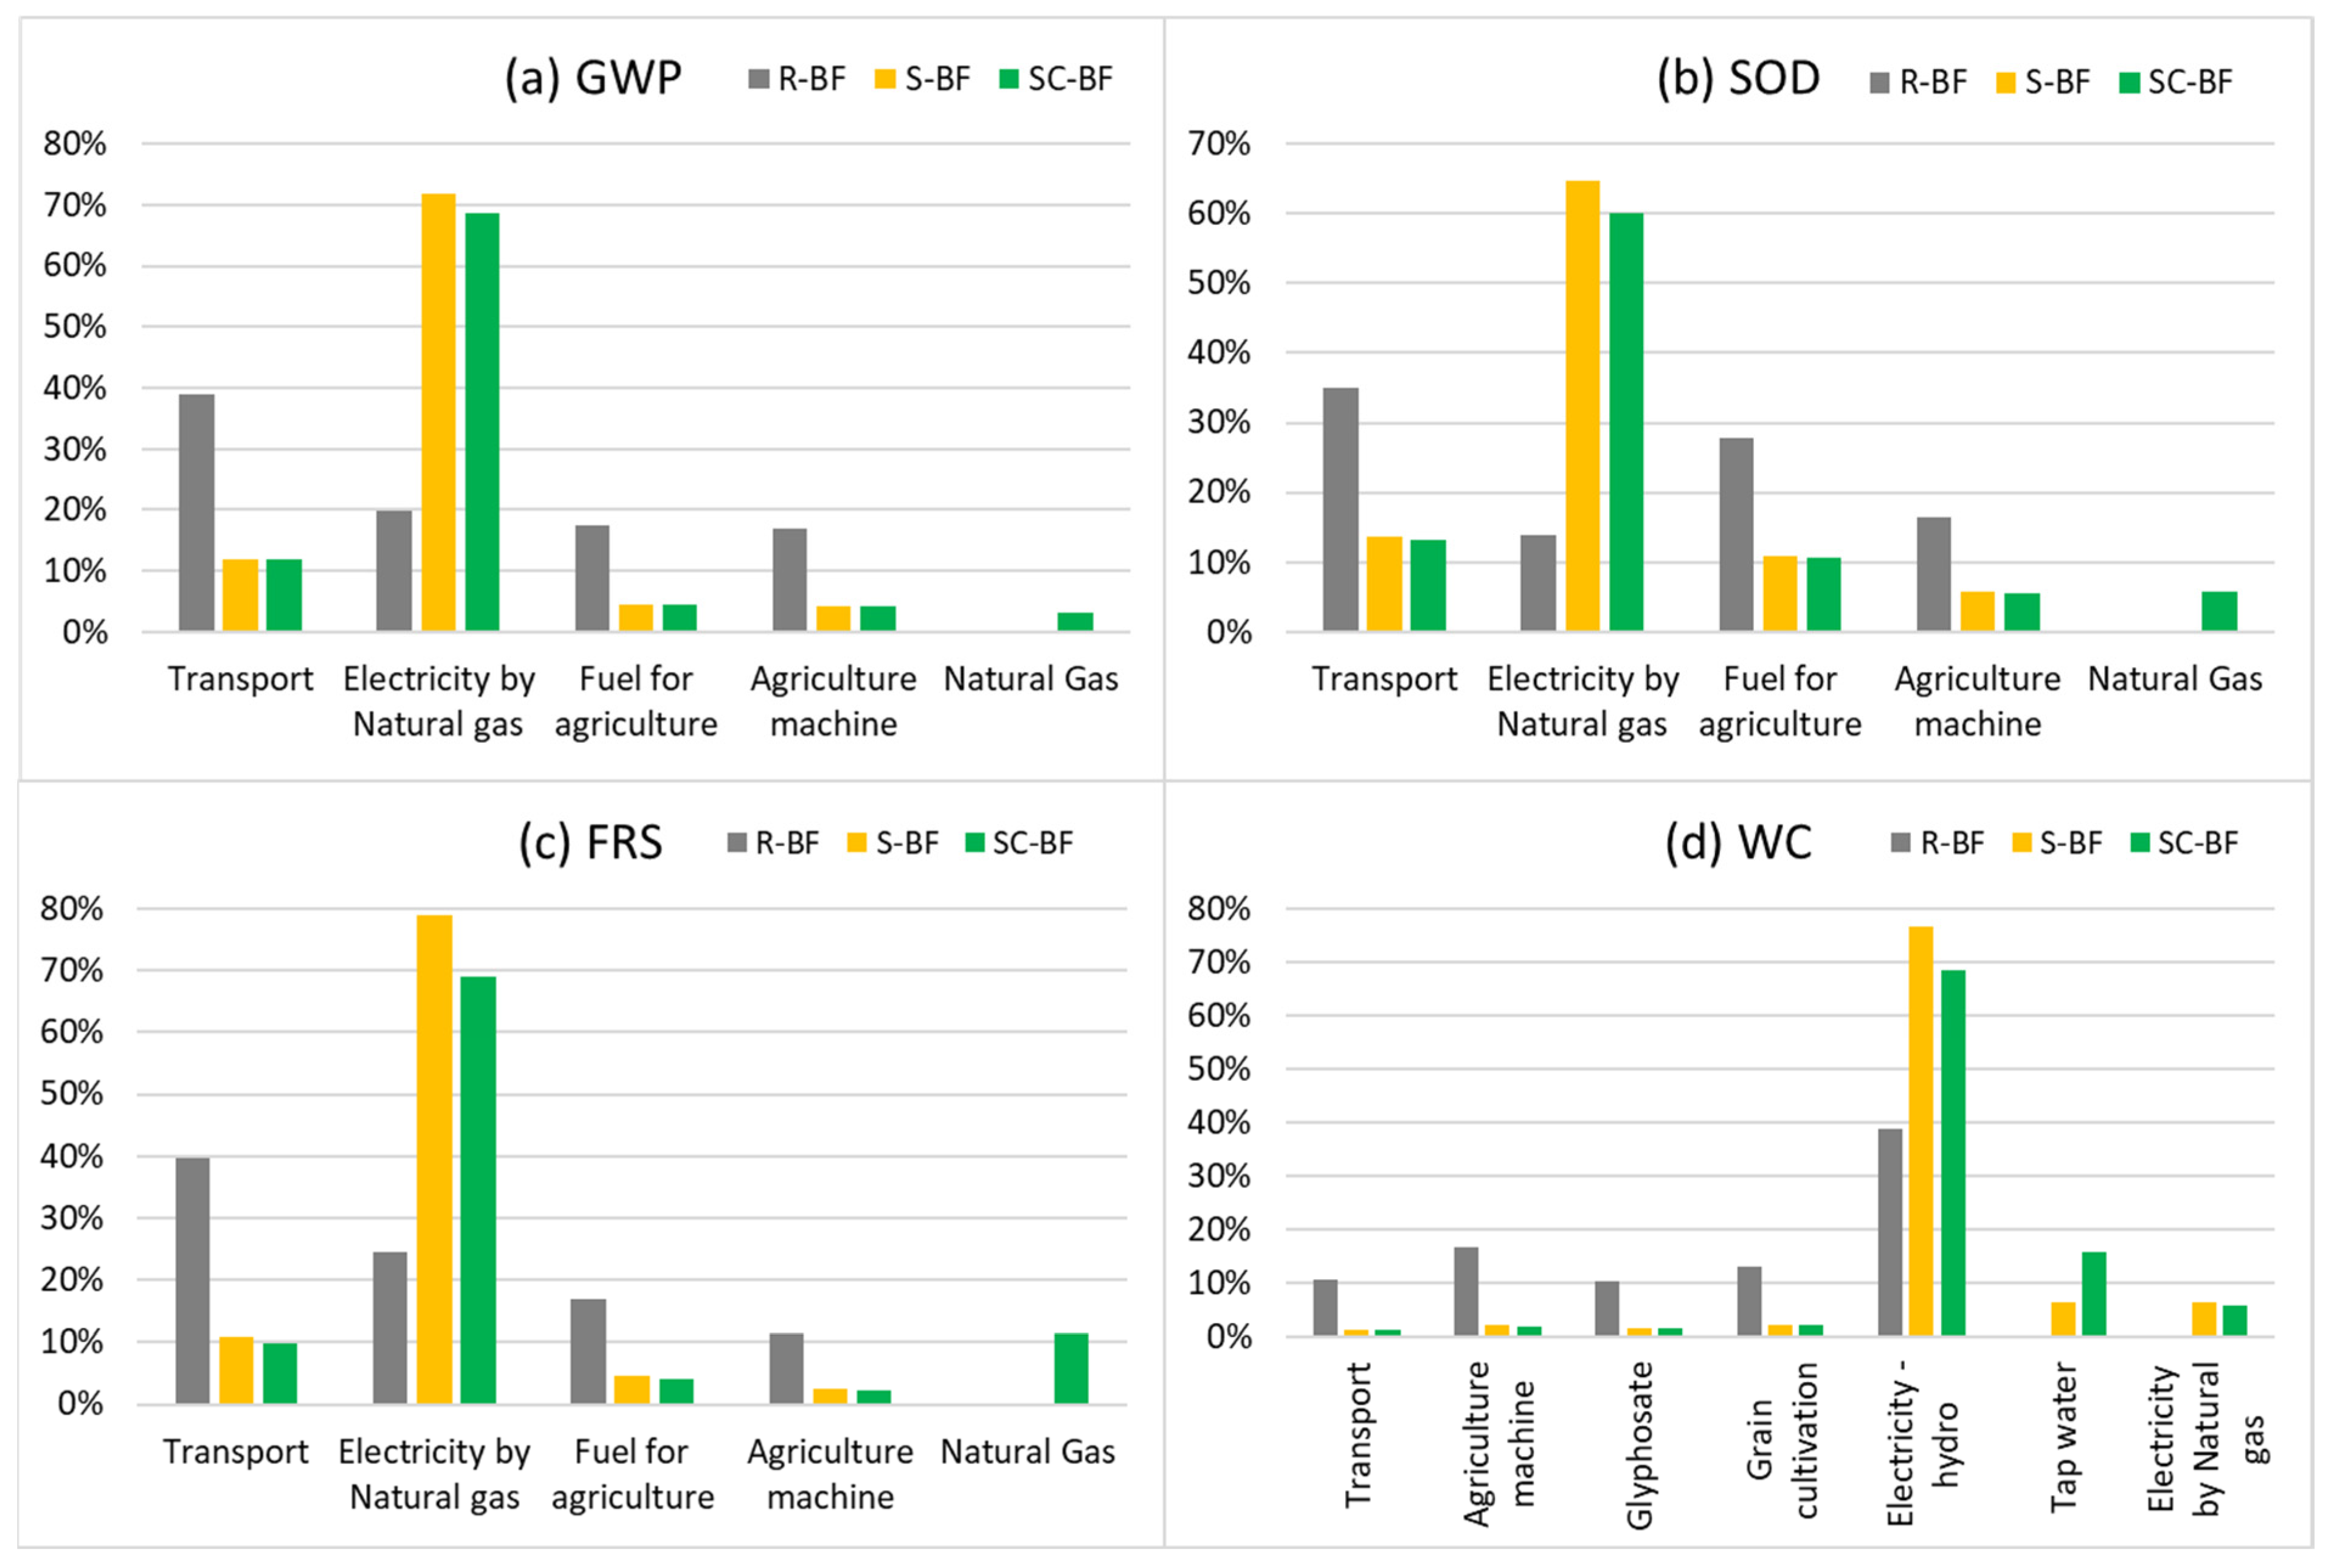
In the case of GWP, SOD, and FRS for R-BF, the main contributor was transport with almost 35–40% of total values, followed by electricity consumption (15–22%). The higher energy consumption related to the flour production stages increased the total impact values for S-BF and SC-BF with respect to R-BF. Natural gas power generation rose from 20% (R-BF) to 65% (S-BF and SC-BF) on average for the above-mentioned impact categories (Figure 3). This increment was associated with the freeze drying (92%) and grinding (8%). Furthermore, there was an additional contribution from natural gas for SC-BF that appeared due to the cooking, where its load was more important for FRS (11.5%) than GWP (3.5%) and SOD (5.8%).
Regarding electricity and natural gas costs, the production of S-BF and SC-BF increased energy-related costs by approximately 14–15 times compared to R-BF. This increase was mainly driven by the freeze-drying stage and, to a lesser extent, by the cooking operation required for SC-BF.
Water consumption had a significant contribution from hydroelectric generation for R-BF (38%) and for S-BF and SC-BF (average of 72%), as can be seen in Figure 3. The total impact value was further increased by a contribution of 6.6% (S-BF) and 15.9% (SC-BF) of tap water production involved in the soaking and cooking processes.
In terms of flows, emissions of the fungicide fluazinam (43.6% to soil and 10.4% to water) and the insecticide bifenthrin (16.9% to water), both applied in field phases, were the main contributors to the FWEc impact value followed by zinc II (7.0%) and copper ion (6.2%) emitted in transport and agricultural trailer production processes. Fluazinam emissions were also significant for TEc with a contribution of 56.2%. Other minor contributors were copper ion (18.4%) and antimony ion (6.6%) emitted during product transport. In the case of FWEu, phosphate emitted from diverse processes such as agricultural machinery production and transport was the main contributor with 78.5%. Elemental phosphorus used in glyphosate production was also important (21.4%).
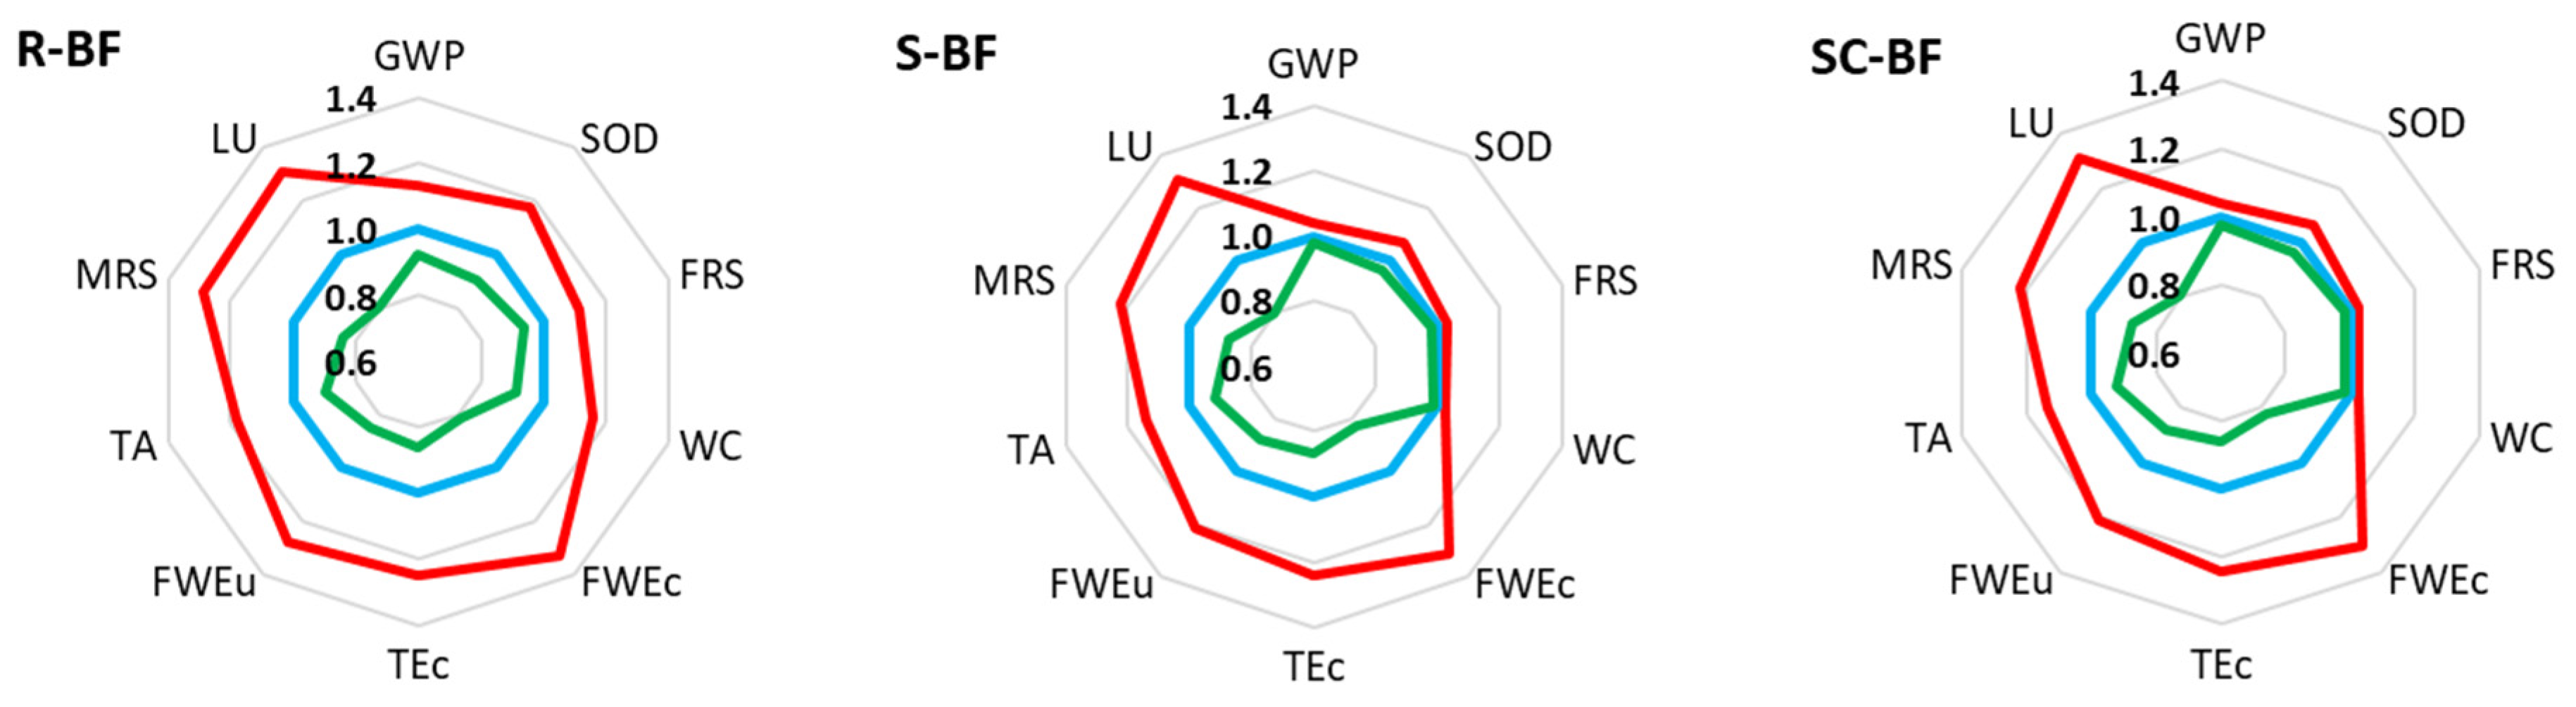
As expected, the sensitivity analysis showed a non-linear evolution of the impact categories’ results. The greatest variations were found for LU and FWEc. S-BF and SC-BF showed a significant difference for those categories, which are highly influenced by field phases, as it was discussed previously. The categories that showed a greater influence of energy consumption on flour production showed less variation with respect to the average yield result. Relative variation in impact categories values to the average yield is shown in Figure 4.
For comparison with other dry bean LCA results, the scope was modified to match the limits from cradle to farm gate. The results can only be compared to the LCA developed in the USA [7] because the same LCIA methodology as the present work was applied. When compared to USA work, relative differences in LCIA impact values were observed for GWP (−51%), FRS (−43%), LU (+100%), WC (−28%), and FWEu (−85%). The LCAs for Greece [8], Sweden [9], and Canada [9] used a different LCIA methodology. However, Table S3 in the Supplementary Material summarizes results for some categories from the four works. These differences confirm the influence of the aspects mentioned in Section 1 and stress the need to update the inventory based on regional or local data.

4. Conclusions

As expected, pretreating the grain before milling increased the potential impact values. Major differences were found on GWP, SOD, FRS, and WC due to the nature of the stage processes. The major influence for this difference was the energy consumption in the freezing-drying. It should be noted that these results are based on laboratory-scale equipment and non-optimized processing conditions, and therefore represent a conservative scenario, not directly extrapolable to industrial-scale production. In an industrial context, the use of alternative drying technologies, process integration, and energy efficiency strategies could substantially reduce both energy consumption and associated burdens.
As the resulting flour’s nutritional value improves considerably after pretreatment, it is concluded that the focus should be on optimizing energy consumption processes (drying, cooking, and milling) to produce high-quality flour with an improved environmental footprint.
Major variations, with respect to other works, were found on impact categories such as global warming, ecotoxicity, water consumption, and land use. These results underline the importance of developing an inventory in accordance with the agricultural practices, climate region, and final consumers to correctly characterize the impacts of the activity in Argentina.

Supplementary Materials

The following supporting information can be downloaded at: https://www.mdpi.com/article/10.3390/blsf2026056027/s1, Table S1: Agrochemicals dosing for dry bean cultivation; Table S2: Argentine electricity generation mix 2022; Table S3: Literature review comparison. Impact category value for LCIA for 1 kg of dry bean from cradle to farm gate.

Author Contributions

Conceptualization, G.L. and G.G.C.; methodology, M.G.T., G.L. and G.G.C.; software, M.G.T.; investigation, M.G.T.; writing—original draft preparation, M.G.T.; writing—review and editing, G.L., S.C.A., N.F.N. and G.G.C.; visualization, G.L. and N.F.N.; supervision, G.L. and G.G.C.; project administration, S.C.A.; funding acquisition, S.C.A. and G.G.C. All authors have read and agreed to the published version of the manuscript.

Funding

This work was supported by the Consejo Nacional de Investigaciones Científicas y Técnicas (CONICET, Argentina), [grand number: PIP 0161], the Agencia Nacional de Promoción de la Investigación, el Desarrollo Tecnológico y la Innovación (ANPCYT), Secretaría de Innovación, Ciencia y Tecnología, [grant number: PICT 2021-0685], and the Universidad Nacional La Plata (UNLP), [grant numbers X-1024 and I-270].

Institutional Review Board Statement

Not applicable.

Informed Consent Statement

Not applicable.

Data Availability Statement

The original contributions presented in this study are included in the article and the Supplementary Material. Further inquiries can be directed to the corresponding author.

Acknowledgments

The authors would like to thank: Lic. Maria Alejandra Piccolo and Sara Soledad Aguirre of “Instituto Nacional de Tecnología Agropecuaria (INTA) Estación Experimental Salta” for the data provided on the 2023–2024 dry bean harvest in Salta, Argentina; Eng. Ivan Martín, Commercial Manager of Alimar S.A. Salta, for all the data related to the industrial processing stage; and Anibal Liácono Diez of Porosem S.R.L for seed production data provided.

Conflicts of Interest

The authors declare no conflicts of interest.

References

  1. Estimaciones Agrícolas, Tablero de Cultivos. Secretaría de Agricultura, Ganadería y Pesca; Ministerio de Economía, República Argentina: Buenos Aires, Argentina, 2025; Available online: https://www.magyp.gob.ar/sitio/areas/estimaciones/tableros/tablero-cultivos.php?accion=imp (accessed on 30 January 2026).
  2. Beans, Raw, Mature Seeds, White. Nutrition Value org. Available online: https://www.nutritionvalue.org/Beans%2C_raw%2C_mature_seeds%2C_white_nutritional_value.html?size=100+g (accessed on 3 December 2025).
  3. Secretaría de Agricultura, Ganadería y Pesca, Ministerio de Economía, República Argentina. Legumbres. Evolución de la Producción Hasta el Ciclo 2021/22; Secretaría de Agricultura, Ganadería y Pesca, Ministerio de Economía, República Argentina: Buenos Aires, Argentina, 2023; Available online: https://www.argentina.gob.ar/sites/default/files/informe-legumbres-enero-2023.pdf (accessed on 10 December 2025).
  4. Nagai, N.F.; Marchetti, L.; Lorenzo, G.; Andrés, S.C. Comprehensive Study of Changes in Nutritional Quality, Techno-functional Properties, and Microstructure of Bean Flours Obtained from Pretreated Seeds. ACS Food Sci. Technol. 2024, 4, 1747–1755. [Google Scholar] [CrossRef]
  5. Semba, R.D.; Ramsing, R.; Rahman, N.; Kraemer, K.; Bloem, M.W. Legumes as a sustainable source of protein in human diets. Global Food Secur. 2021, 28, 100520. [Google Scholar] [CrossRef]
  6. Torres, M.G.; Andrés, S.C.; Nagai, N.F.; Lorenzo, G.; García Colli, G. Life Cycle Assessment of raw beef meat production in Argentina: From farm to butcher shop. Eureka Life Sci. 2025, 2, 20–35. [Google Scholar] [CrossRef]
  7. Bandekar, P.A.; Putman, B.; Thoma, G.; Matlock, M. Cradle-to-grave life cycle assessment of production and consumption of pulses in the United States. J. Environ. Manag. 2022, 302, 114062. [Google Scholar] [CrossRef] [PubMed]
  8. Abeliotis, K.; Detsis, V.; Pappia, C. Life cycle assessment of bean production in the Prespa National Park, Greece. J. Clean. Prod. 2013, 41, 89–96. [Google Scholar] [CrossRef]
  9. Tidåker, P.; Karlsson Potter, H.; Carlsson, G.; Röös, E. Towards sustainable consumption of legumes: How origin, processing and transport affect the environmental impact of pulses. Sustain. Prod. Consum. 2021, 27, 496–508. [Google Scholar] [CrossRef]
  10. Bamber, N.; Arulnathan, V.; Puddu, L.; Smart, A.; Ferdous, J.; Pelletier, N. Life cycle inventory and assessment of Canadian faba bean and dry bean production. Sustain. Prod. Consum. 2024, 46, 442–459. [Google Scholar] [CrossRef]
  11. ISO 14040: 2006; Environmental Management—Life Cycle Assessment—Principles and Framework. ISO: Geneva, Switzerland, 2006.
  12. ISO 14044: 2006; Environmental Management—Life Cycle Assessment—Requirements and Guidelines. ISO: Geneva, Switzerland, 2006.
  13. ReCiPe. RIVM Committed to Health and Sustainability; National Institute for Public Health and the Environment: Bilthoven, The Netherlands, 2016; Available online: https://www.rivm.nl/en/life-cycle-assessment-lca/recipe (accessed on 22 March 2026).
  14. Iñiguez, K.; Nadal, G.; Dubrovsky, H.; Bouille, D. Eficiencia Energética en Argentina. Diagnóstico Sector Primario; GFA Consulting Group: Hamburg, Germany, 2019; Available online: https://eficienciaenergetica.net.ar/publicaciones.php?id_icono=1&c=6 (accessed on 3 December 2025).
  15. IPCC. 2019 Refinement to the 2006 IPCC Guidelines for National Greenhouse Gas Inventories; IPCC: Geneva, Switzerland, 2019; Volume 4, AFOLU, Chapter 2. [Google Scholar]
  16. Gyenge, J.; Gatica, G.; Sandoval, M.; Lupi, A.M.; Gaute, M. Estimación de las Reservas de Carbono Orgánico del Suelo con Plantaciones Forestales y Otros Usos de la Tierra, en Distintas Regiones de Argentina. Reporte Nacional; Secretaría de Agricultura, Ganadería y Pesca, Ministerio de Economía, República Argentina: Aires, Argentina, 2022; Available online: https://www.magyp.gob.ar/sitio/areas/desarrollo-foresto-industrial/silvicultura/_archivos2/Informe-CARBONO-SAGyP.pdf (accessed on 3 December 2025).
  17. PEF, European Commission. PEFCR Guidance Document,—Guidance for the 13 Development of Product Environmental Footprint Category Rules (PEFCRs); Version 6.3; European Commission: Brussels, Belgium, 2017. [Google Scholar]
  18. Blonk, H.; Tyszler, M.; van Paassen, M.; Braconi, N.; Draijer, N.; van Rijn, J. Agri-Footprint 6. Methodology Report. Part 2: Description of Data; Blonk Sustainability: Rotterdam, The Netherlands, 2012; Available online: https://simapro.com/wp-content/uploads/2023/03/FINAL-Agri-footprint-6-Methodology-Report-Part-2-Description-of-Data-Version-5.pdf (accessed on 3 December 2025).
  19. Nemecek, T.; Schnetzer, J. Methods of Assessment of Direct Field Emissions for LCIs of Agricultural Production Systems; Agroscope Reckenholz-Tänikon Research Station ART & Ecoinvent Centre: Zürich, Switzerland, 2011; Available online: https://www.researchgate.net/profile/Thomas-Nemecek/publication/263239333_Life_Cycle_Inventories_of_Agricultural_Production_Systems/links/5ed5eeaf299bf1c67d32894d/Life-Cycle-Inventories-of-Agricultural-Production-Systems.pdf (accessed on 22 March 2026).
  20. Compañía Administradora del Mercado Mayorista Eléctrico S.A (CAMMESA). Informe Anual 2022. Available online: https://cammesaweb.cammesa.com/informe-anual (accessed on 3 December 2025).
  21. El Consumo de Gas de Los Artefactos. Ente Nacional Regulador del Gas (ENARGAS). Available online: https://www.enargas.gob.ar/secciones/eficiencia-energetica/consumo-artefactos.php (accessed on 3 December 2025).
Figure 1. Process block diagram for LCA of bean flour. Solid lines were used for primary processes, dashed lines for secondary processes.
Blsf 56 00027 g001
Figure 2. Impact values ratios to R-BF.
Blsf 56 00027 g002
Figure 3. Process contribution to impact value for: (a) GWP, (b) SOD, (c) FRS, and (d) WC.
Blsf 56 00027 g003
Figure 4. Sensitivity analysis. Impact categories’ values relative to the average yield. Red line: minimum yield, light-blue line: average yield, and green line: maximum yield.
Blsf 56 00027 g004
Table 1. Impact category values for 1 kg of dry bean flour (ReCiPe 2016 midpoint (H)) [13].
Flour Type R-BFS-BFSC-BF
Impact
Category
UnitMin YieldAvg YieldMax YieldMin YieldAvg YieldMax YieldMin YieldAvg YieldMax Yield
GWPkg CO2 eq0.890.780.733.273.143.073.483.343.27
SODkg CFC11 eq3.5 × 10−73.0 × 10−72.7 × 10−79.8 × 10−79.2 × 10−78.9 × 10−71.1 × 10−61.0 × 10−69.8 × 10−7
FWEckg 1,4-DCB0.170.130.100.210.160.130.230.170.14
TEckg 1,4-DCB23.919.116.430.124.220.932.125.822.3
FWEukg P eq1.9 × 10−41.5 × 10−41.3 × 10−42.8 × 10−42.3 × 10−42.0 × 10−43.0 × 10−42.5 × 10−42.2 × 10−4
TAkg SO2 eq3.2 × 10−32.7 × 10−32.4 × 10−34.9 × 10−34.3 × 10−33.9 × 10−35.4 × 10−34.8 × 10−34.4 × 10−3
FRSkg oil eq0.300.270.251.251.211.191.451.411.39
MRSkg Cu eq5.4 × 10−34.2 × 10−33.5 × 10−37.9 × 10−36.5 × 10−35.6 × 10−38.5 × 10−36.9 × 10−36.1 × 10−3
LUm2a crop eq15.311.79.418.714.311.520.015.312.3
WCm39.4 × 10−38.1 × 10−37.4 × 10−36.1 × 10−25.9 × 10−25.9 × 10−26.9 × 10−26.8 × 10−26.7 × 10−2
Abbreviations: GWP: global warming potential; SOD: stratospheric ozone depletion; FWEc: freshwater ecotoxicity; FWEu: freshwater eutrophication; TEc: terrestrial ecotoxicity; TA: terrestrial acidification; FRS: fossil resource scarcity; MRS: mineral resource scarcity; LU: land use; WC: water consumption.
Disclaimer/Publisher’s Note: The statements, opinions and data contained in all publications are solely those of the individual author(s) and contributor(s) and not of MDPI and/or the editor(s). MDPI and/or the editor(s) disclaim responsibility for any injury to people or property resulting from any ideas, methods, instructions or products referred to in the content.