Proceeding Paper

Influence of Cow Parity on the Precision of Near-Infrared Spectroscopic Sensing System for Assessing Milk Quality During Milking †

1
Graduate School of Agricultural Science, Hokkaido University, Sapporo 060-8589, Japan
2
Field Science Center for Northern Biosphere, Hokkaido University, Sapporo 060-0811, Japan
3
Orion Machinery Co., Ltd., Nagano 382-8502, Japan
*
Author to whom correspondence should be addressed.
Presented at the 3rd International Online Conference on Agriculture (IOCAG 2025), 22–24 October 2025; Available online: https://sciforum.net/event/IOCAG2025.
Biol. Life Sci. Forum 2025, 54(1), 37; https://doi.org/10.3390/blsf2025054037
Published: 19 May 2026
(This article belongs to the Proceedings of The 3rd International Online Conference on Agriculture)

Abstract

This study examined how cow parity (number of calvings) affects the accuracy of near-infrared (NIR) spectroscopy for real-time milk assessment. Using two cows in their second calving at Hokkaido University, milk spectra (700–1050 nm) were analyzed alongside reference measurements of fat, lactose, and somatic cell count (SCC). Calibration models were built with data from first, second, and combined parities using partial least squares regression. Results showed similar prediction accuracy for fat and SCC across parities but notable differences for lactose. Validation across parities revealed that parity significantly influences NIR system precision, particularly in lactose measurement accuracy.

1. Introduction

The determination of milk constituents plays a crucial role in both dairy industry operations and dairy farm management. The composition of bovine milk is particularly significant because it directly influences its processing potential. Understanding milk composition not only allows consumers to access milk quality but also helps dairy processors detect possible adulterations. Additionally, variations in milk composition affect both consumer preferences and milk pricing, thereby impacting farm profitability. Consequently, assessing the milk composition of each bovine is essential for efficient herd management [1,2,3,4].
Previous research has highlighted the potential of near-infrared (NIR) spectroscopy for analyzing milk composition [5,6,7,8,9]. However, real-time, online determination of milk quality parameters during milking has not yet been fully achieved. This is largely due to several influencing factors such as individual bovine differences, milking season, lactation stage, milking system, feeding regime, and parity [10,11]. From a practical standpoint, understanding how these factors affect measurement accuracy is vital for developing robust calibration models capable of compensating for such variations and improving model precision.
Therefore, this study focused on examining how bovine parity influences the measurement accuracy of a near-infrared spectroscopic sensing system used to determine milk quality parameters during milking.

2. Materials and Methods

2.1. NIR Spectroscopic Sensing System

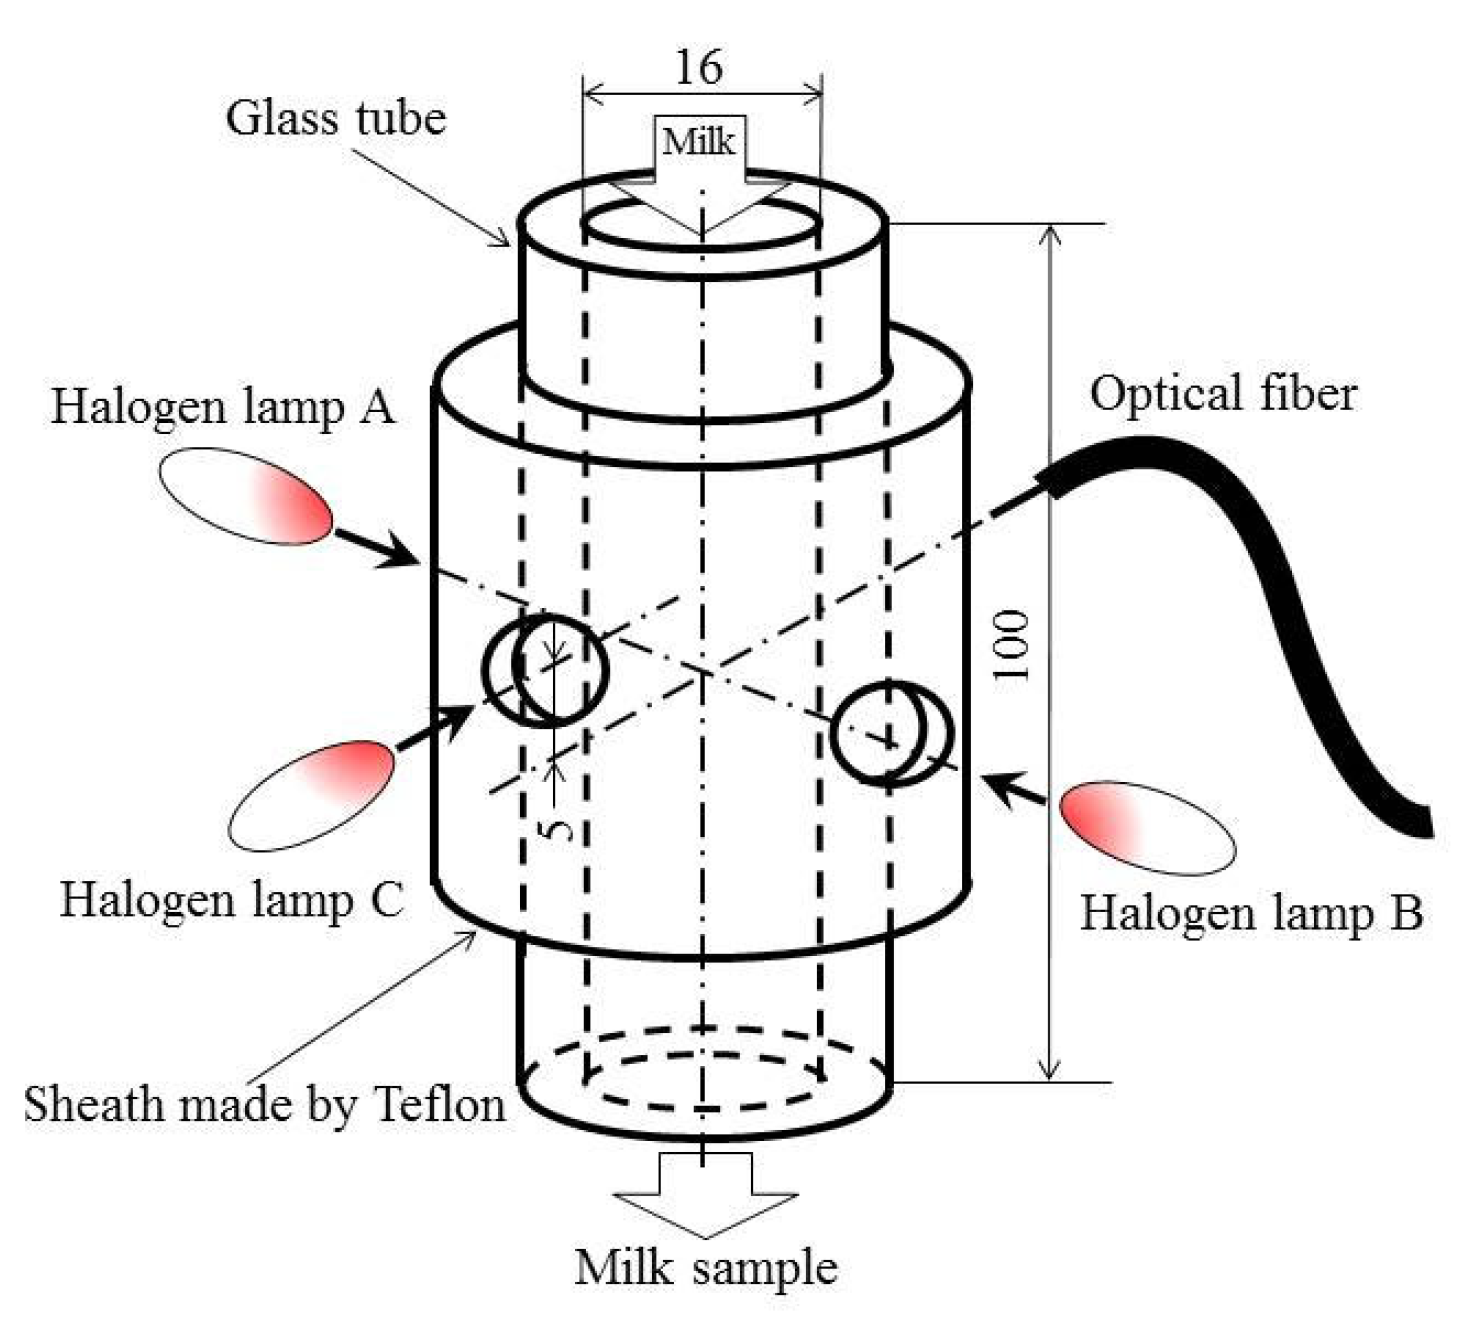
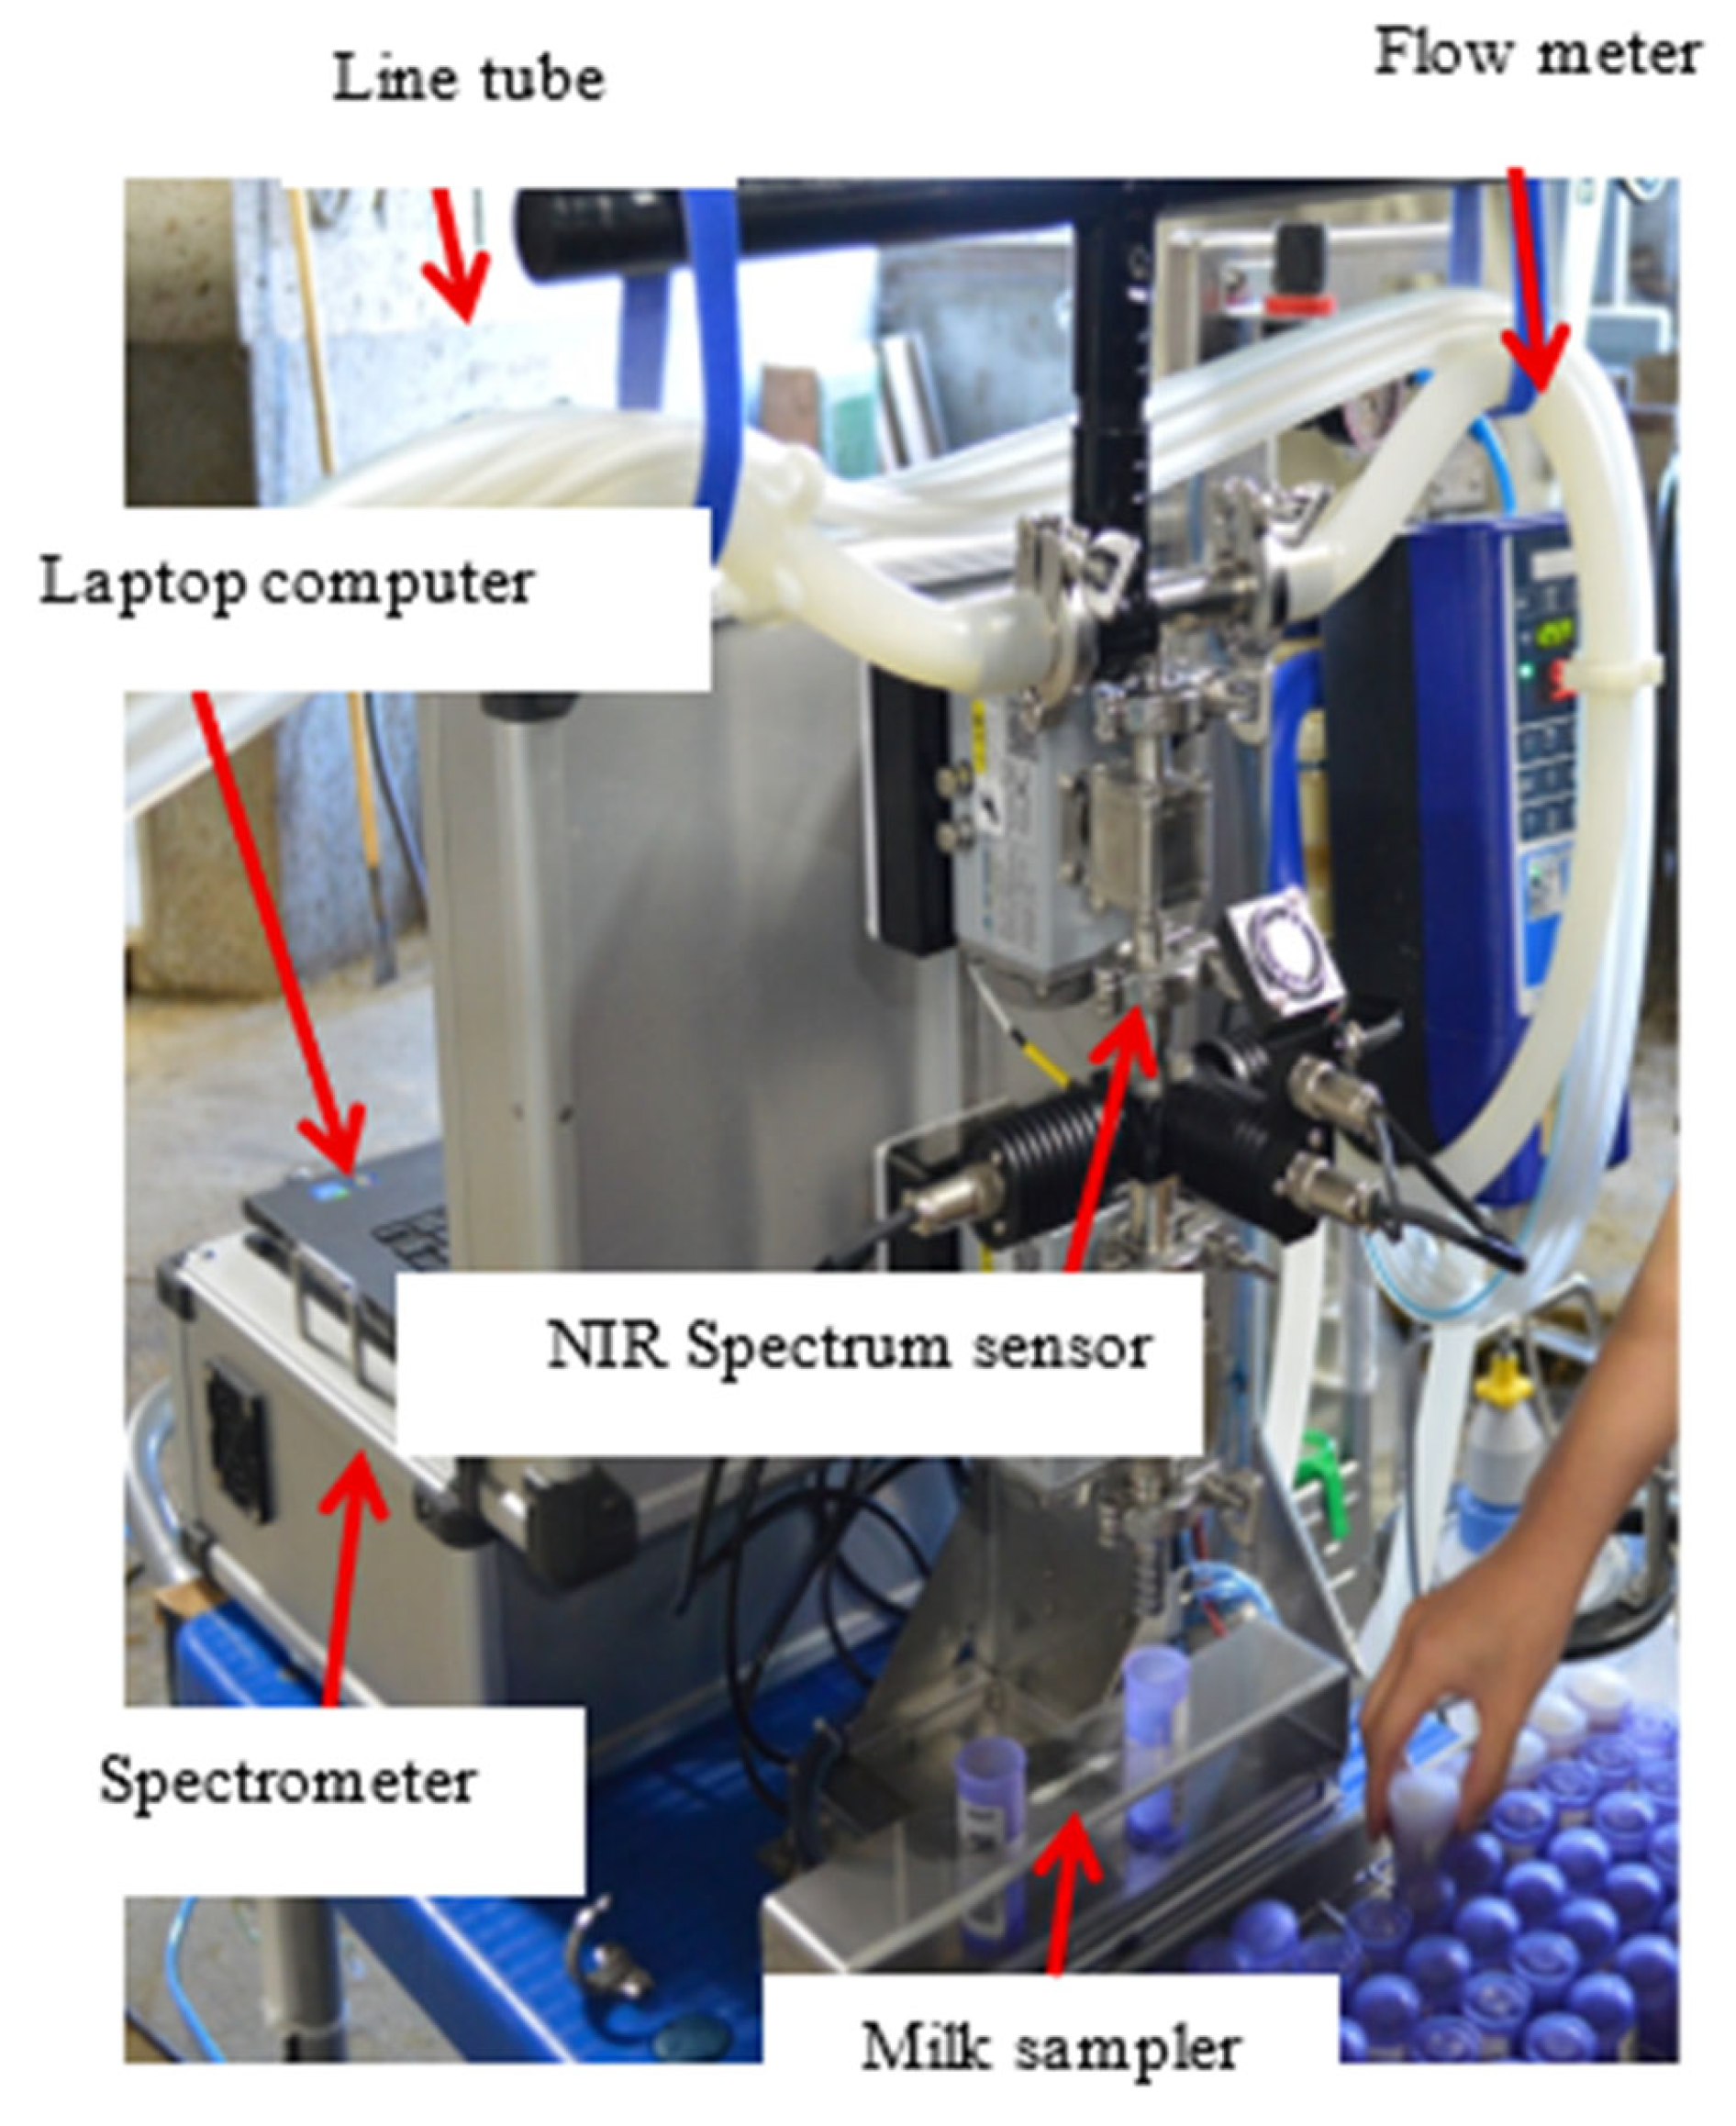
An online NIR sensing setup was developed to evaluate the quality of milk from individual cows during the milking process. The system consisted of an NIR spectrometer, a milk flow meter, a milk sampler, and a portable computer (Figure 1). It was connected to the milking cluster (comprising a claw and four teat cups) and a bucket for bulk milk collection. During milking, raw milk flowed continuously from the milk flow meter. Approximately 30 mL of milk was contained in the sensor chamber at a time. The optical components were aligned so that the halogens lamps (A and B) and the optical fiber shared the same axis, while halogen lamp C was positioned about 5 mm away from the fiber (Figure 2) [12]. Absorbance spectra of the raw milk were collected by the NIR spectrometer. Spectral data were recorded at 1 nm intervals every 20 s across the wavelength range of 700–1050 nm during milking.

2.2. Bovine and Milk Samples

The study utilized dairy cows from Hokkaido University, tested during the early stages of lactation. The experiment was conducted using Holstein dairy cows. All animals were approximately 48 months of age at first parity, with body weights ranging from 550 to 600 kg at the start of the study. The cows were housed in a tie-stall barn equipped with individual stalls, allowing restricted movement. The housing facility provided adequate ventilation, continuous access to fresh drinking water, and routine management practices consistent with standard dairy farm conditions. All animals were managed under identical environment and husbandry conditions throughout the experimental period. Measurements were conducted over three days, during two consecutive milking sessions; one in the evening and the following one in the morning. Milking was carried out using a pipeline milking system at the university’s dairy farm. Milk samples were automatically collected every 20 s during milking through the sampling unit.

2.3. Reference (Standard) Analyses

Three primary milk quality parameters were analyzed: fat content, lactose content, and somatic cell count (SCC). Fat and lactose were measured using MilkoScan analyzer (Foss Electric, Hillerod, Denmark), while SCC was determined using Fossomatic equipment (Foss Electric, Hillerod, Denmark).

2.4. Calibration and Validation

Three sets of sample data were collected from two experiments conducted on first and second parity. The first data set represented the first parity (A), the second represented parity (B), and the third consisted of a combination of both (A + B). To create calibration models for every quality parameter and to confirm the models’ correctness and precision, chemometric investigations were carried out. These analyses were carried out using The Unscrambler software (version 10.3, Como AS, Trondheim, Norway). Both calibration and validation were performed using all reference samples. The absorbance spectra and reference values were employed to construct calibration models using partial least squares (PLS) statistical method. Several spectra preprocessing methods, including baseline and scatter correction, were evaluated. However, these procedures did not improve the performance of the calibration models compared with models developed using raw spectra. The NIR spectra exhibited a high signal-to-noise ratio and showed no evident baseline drift or scattering effects. Consequently, preprocessing was deemed unnecessary and was not applied in this study. A separate PLS model was created for each milk quality parameter, and the accuracy of these models was assessed by comparing the NIR-predicted results with the corresponding reference data. Calibration model development and validation were conducted under five conditions:
  • Calibration and validation using the same data set A (A to A).
  • Calibration and validation using the same data set B (B to B).
  • Validation of data set B using calibration model built from data set A (A to B).
  • Validation of data set A using calibration model built from data set B (B to A).
  • Validation of data set A + B using a calibration model developed from the combined data set A + B.
The performance of the calibration models was evaluated using chemometric statistics, including the standard error of prediction (SEP), coefficient of determination (r2), bias (difference between measured and NIRS-predicted values), and the ratio of SEP to the standard deviation of the reference data (RPD).

3. Results and Discussion

Calibration Model’s Precision and Accuracy

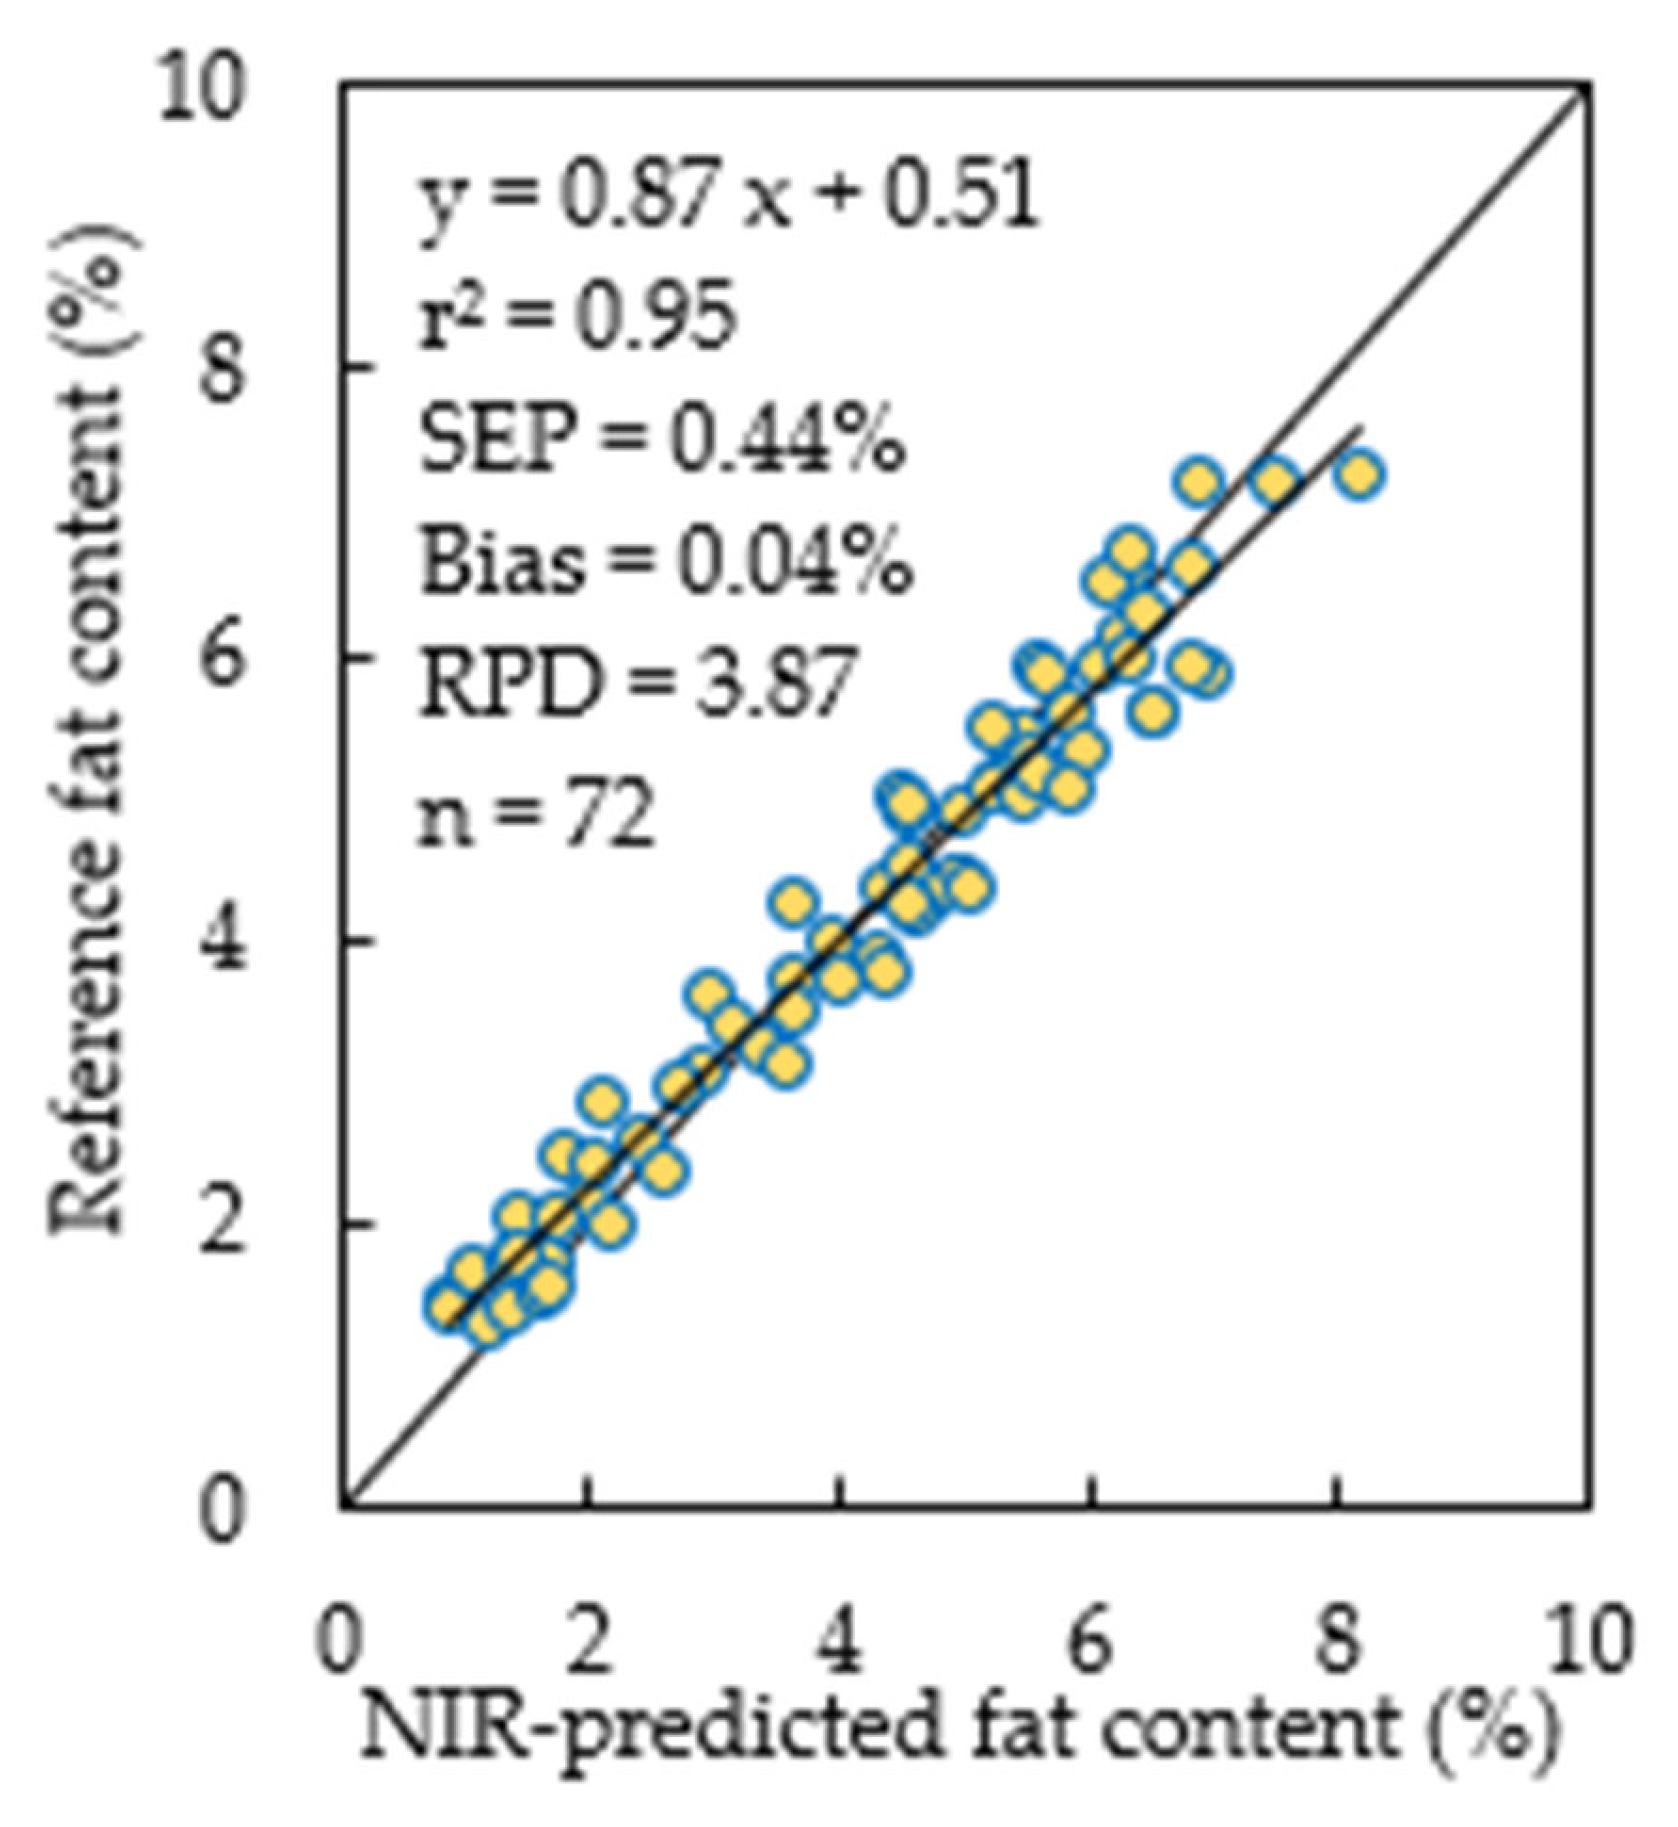
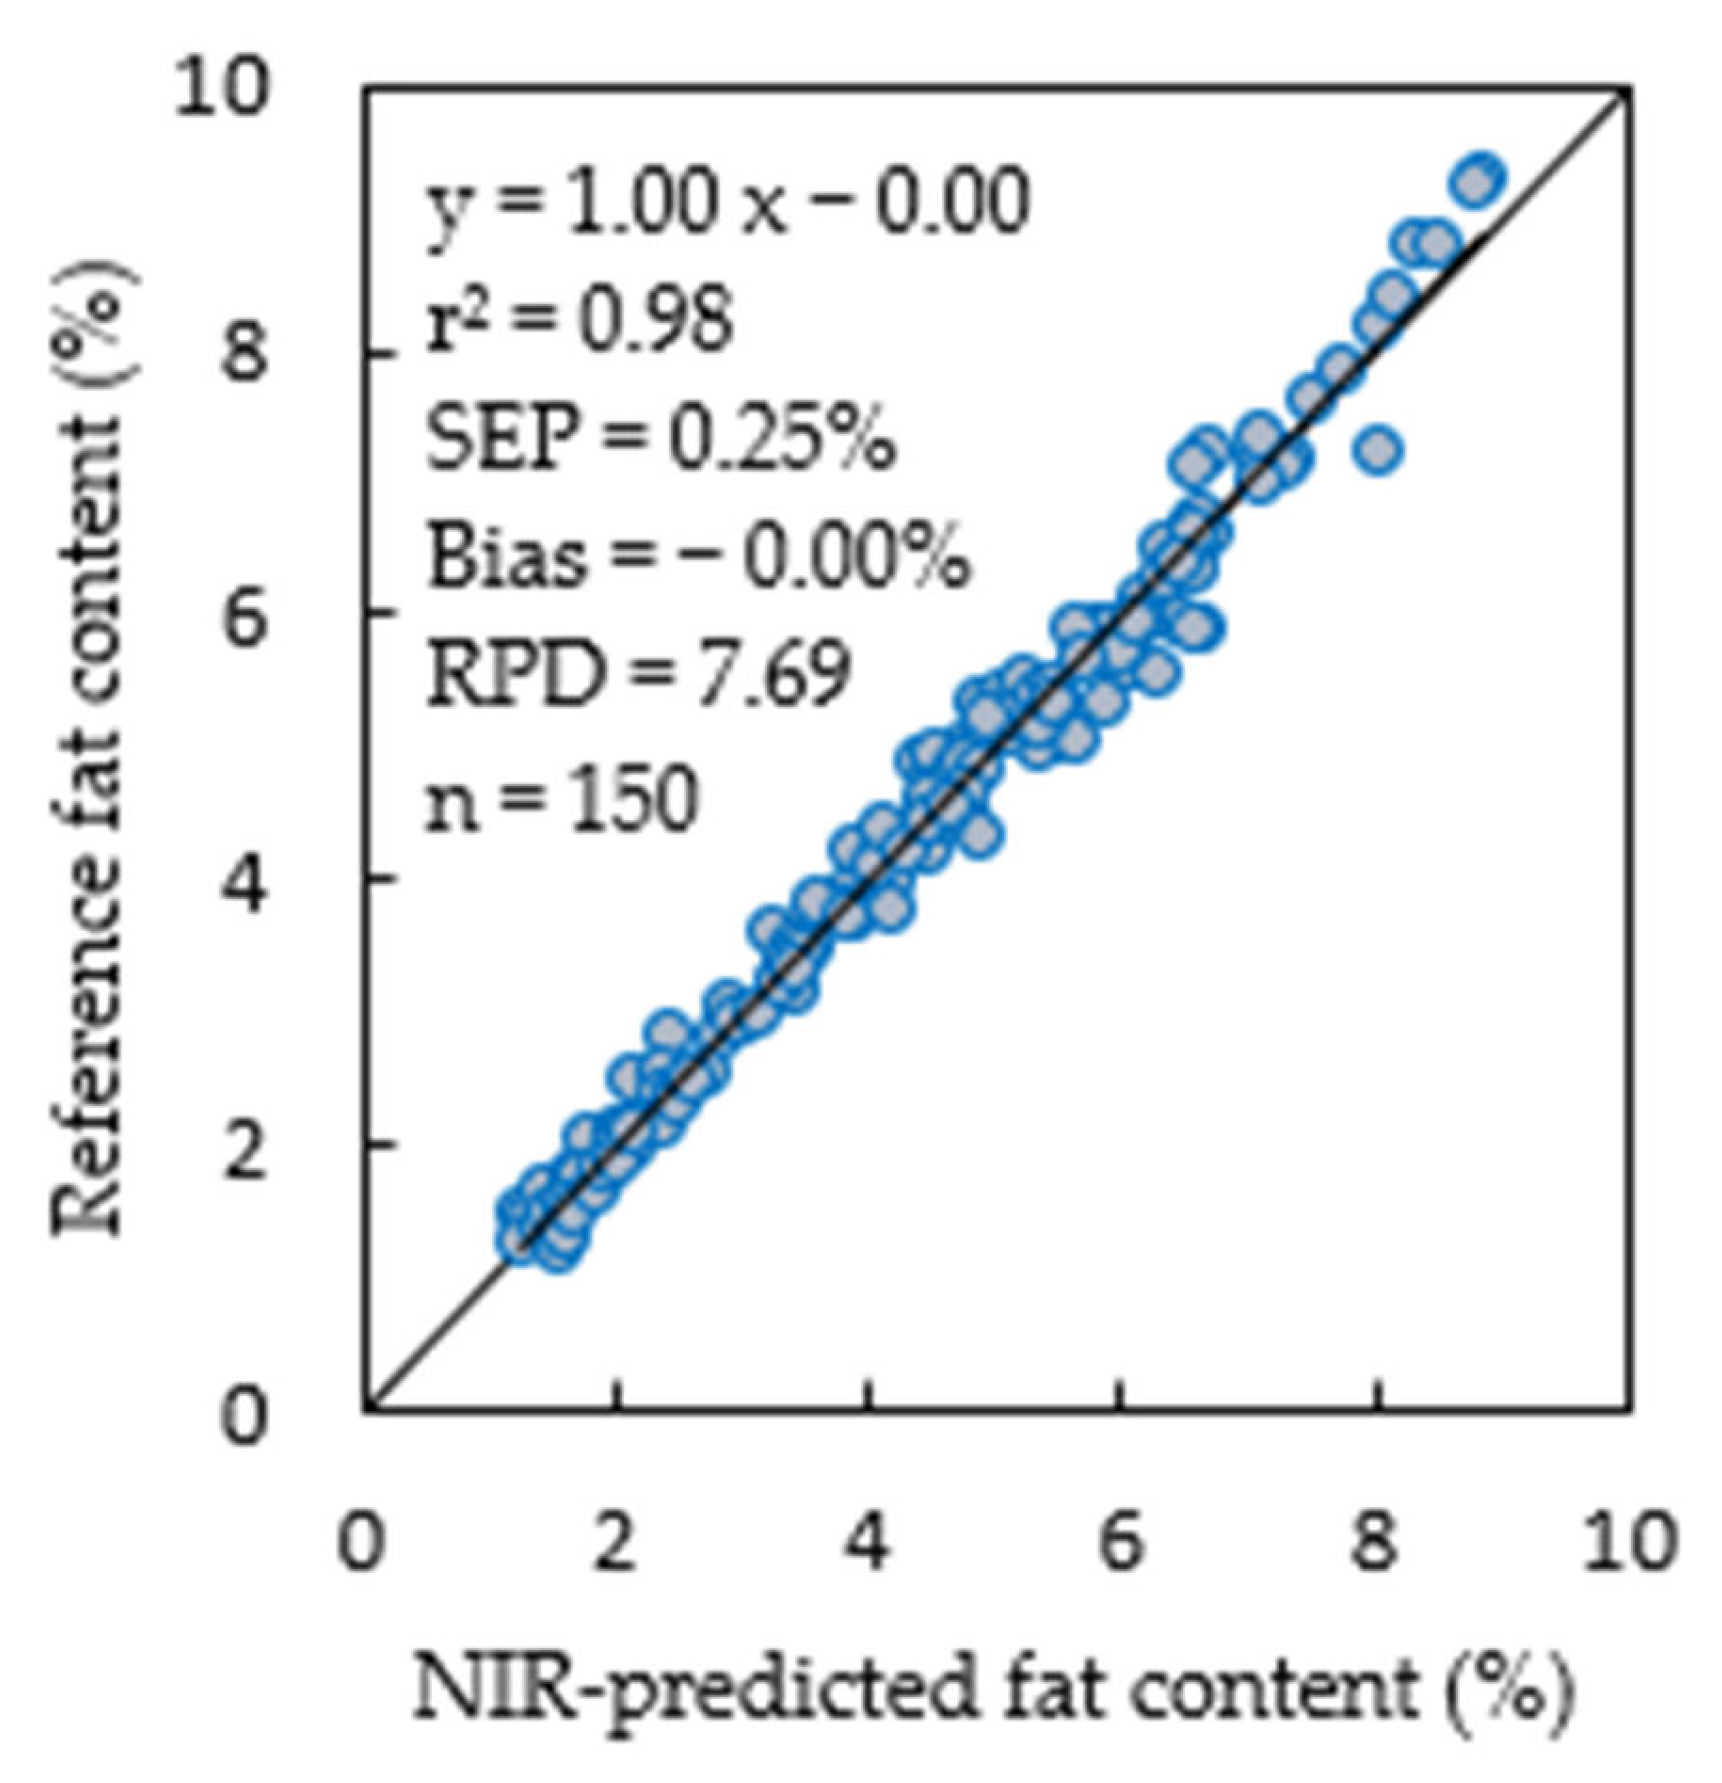
The validation results obtained from various test sets of milk samples for each milk quality parameter are presented in Table 1, Table 2, Table 3, Table 4 and Table 5 and Figure 3, Figure 4, Figure 5, Figure 6 and Figure 7 below.
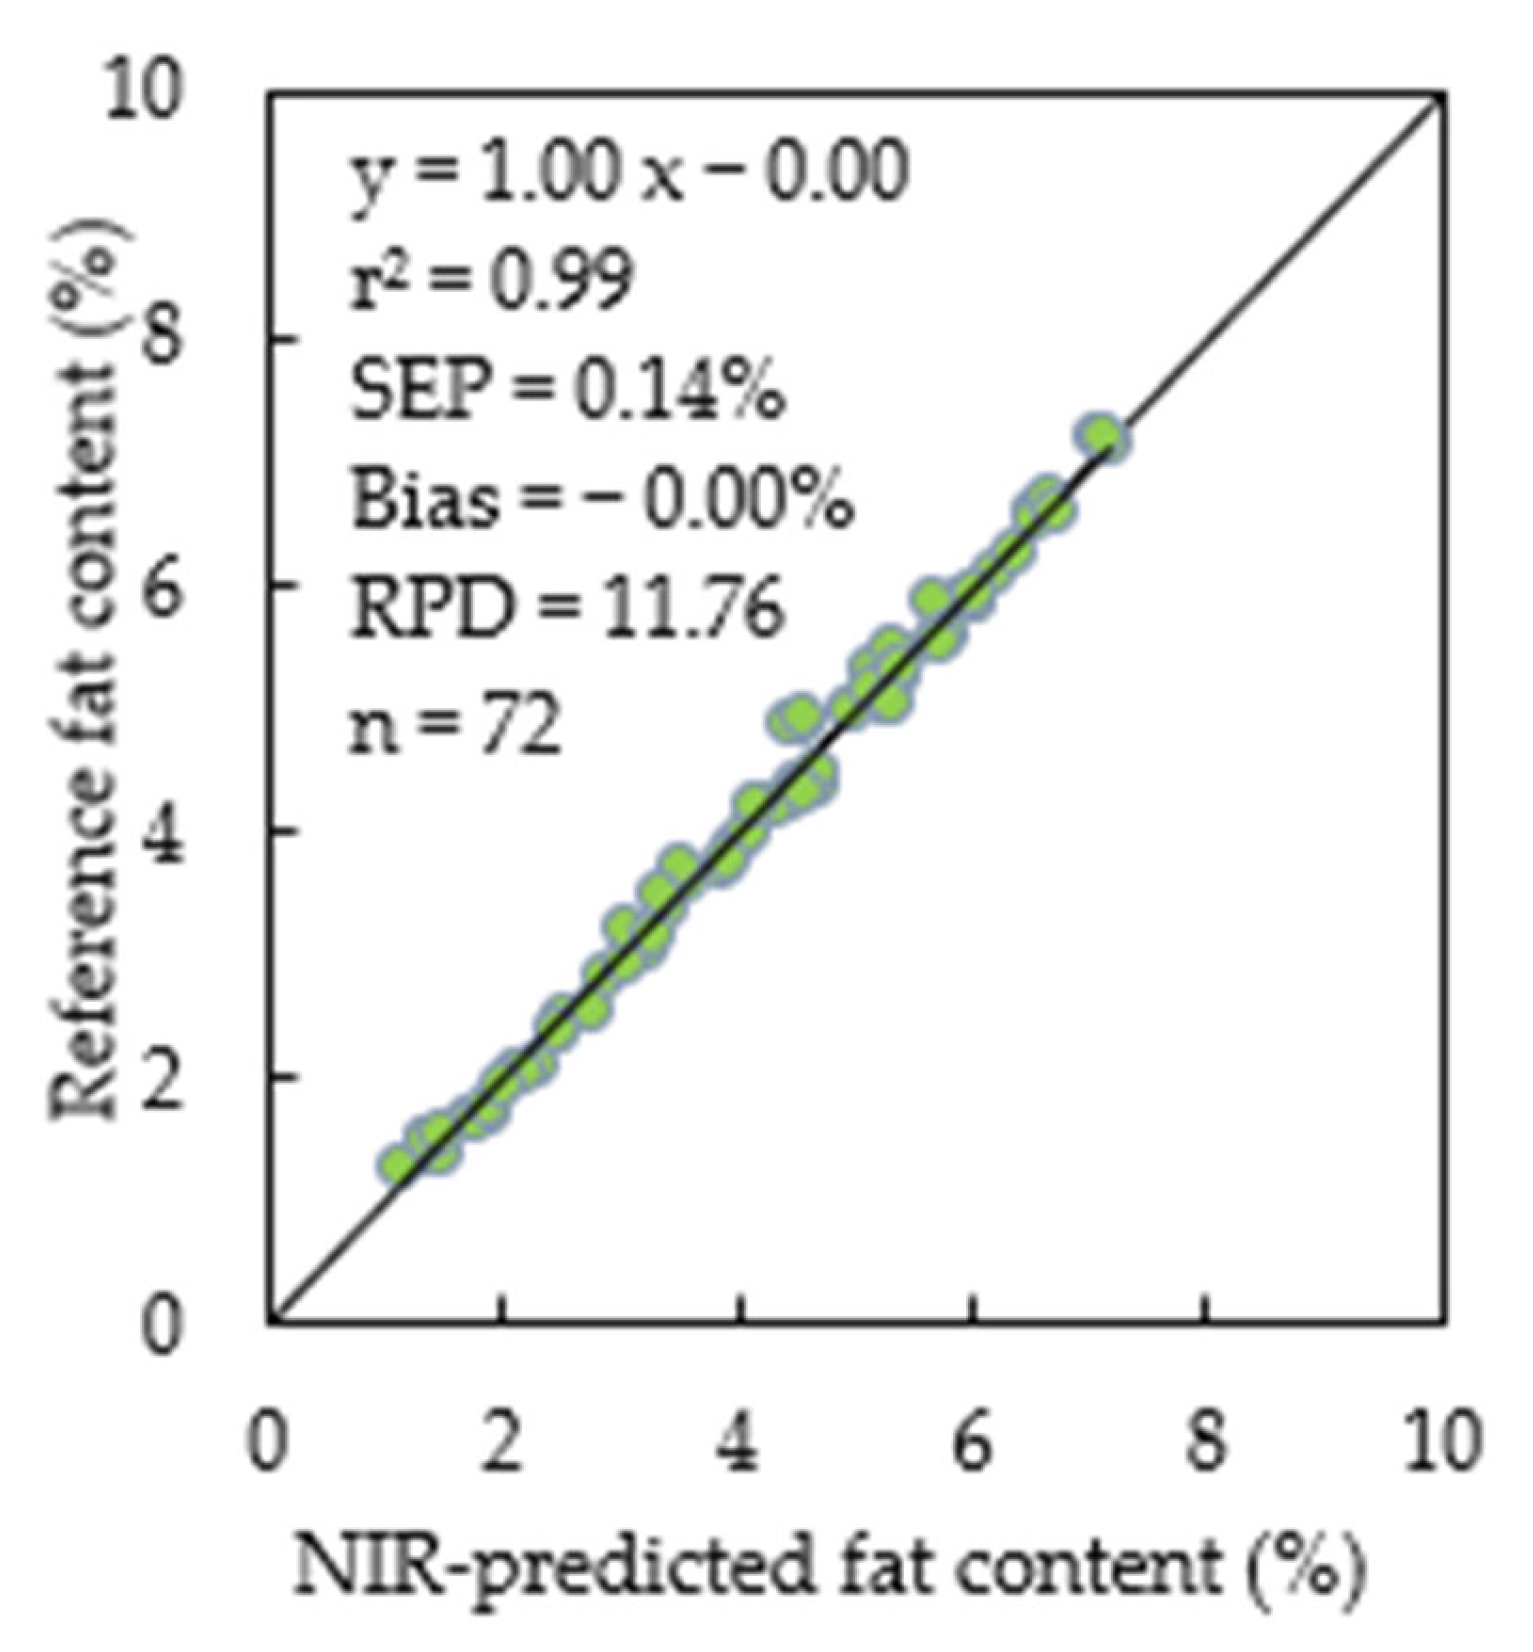
NIRS calibration models for milk fat, lactose, and somatic cell count (SCC) based on samples from first-parity cows (A to A) demonstrated high accuracy. The standard error of prediction (SEP) values was below 1% for fat and lactose, and less than 1 log SCC/mL for SCC, while bias values were close to zero, indicating minimal systematic error.
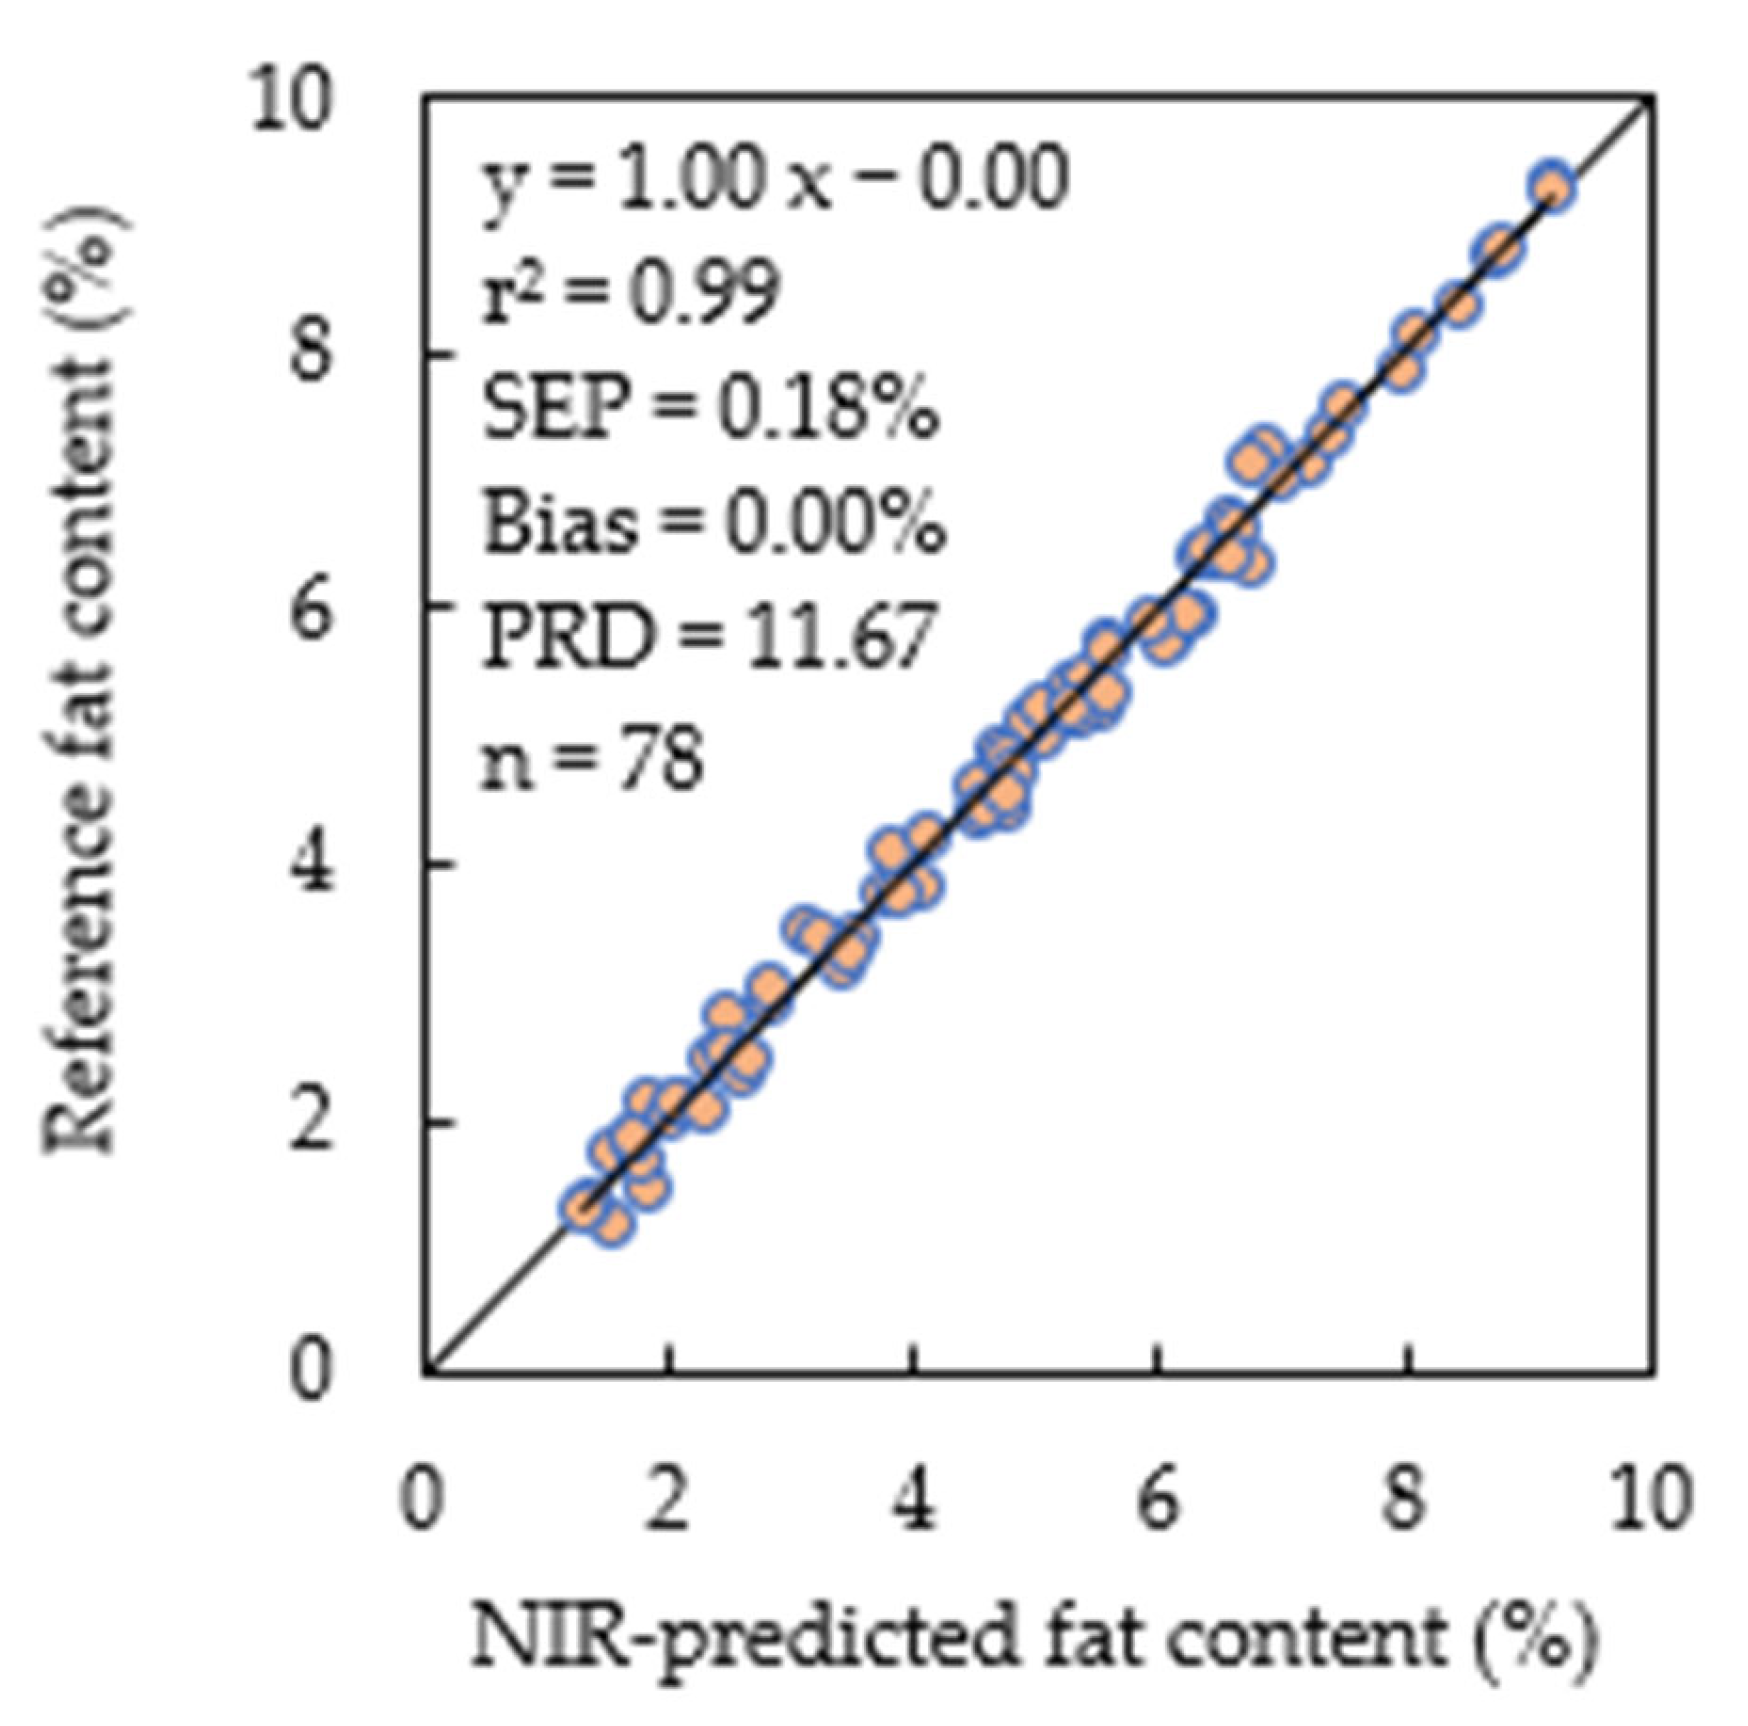
For the second-parity samples (B to B), the calibration models also showed good predictive performance for milk fat, lactose, and SCC, with strong coefficients of determination (r2) and low SEP values, reflecting high precision and accuracy.
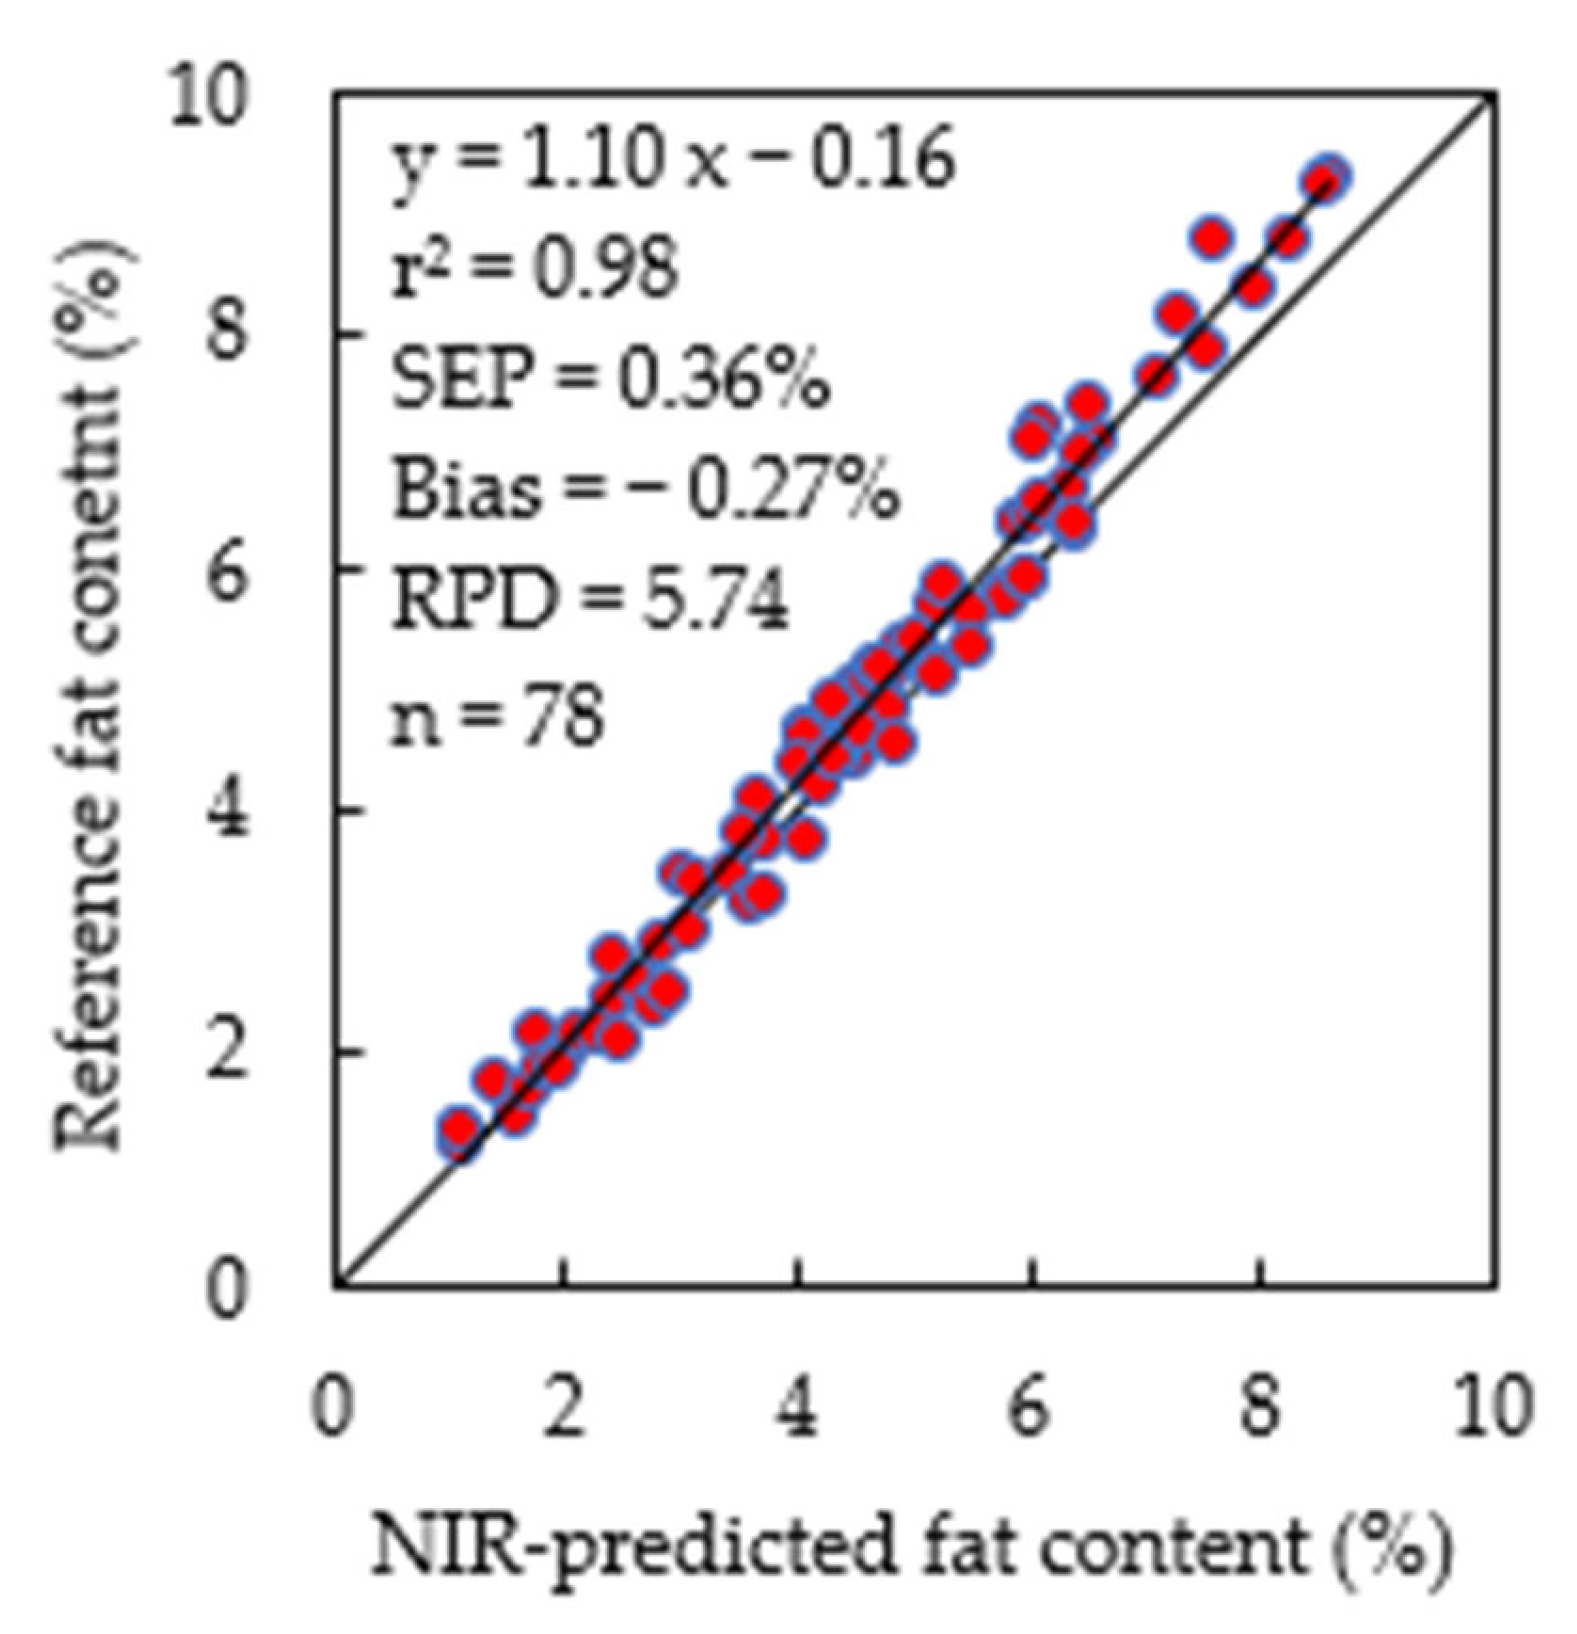
When comparing the two parities, SEP values increased slightly while bias remained nearly unchanged. However, r2 values—especially for lactose—dropped noticeably when calibration models developed from first-parity data were used to predict second-parity data (A to B). This suggests that models based on first-parity milk samples performed poorly in predicting lactose in second-parity samples. A similar pattern was observed in the reverse case (B to A), where both SEP and bias increased, and r2 values declined.
When calibration models developed using a combined dataset (A + B) were validated against the same combined dataset, SEP values increased and r2 values decreased compared to single-parity models (A to A and B to B). However, compared to cross-validation between parities (A to B and B to A), the combined dataset improved predictive accuracy and precision.
Overall, these results indicate that using milk samples from cows of different parities reduces the accuracy and precision of NIRS models, particularly for lactose prediction. For example, the A to B SEP and r2 values for fat, lactose, and SCC were 0.36% and 0.98; 0.18% and 0.43; and 0.29 log SCC/mL and 0.71, respectively. The SEP for fat in A to B (0.36%) was nearly three times higher than in A to A (0.14%) and two times higher than in B to B (0.18%), showing weak agreement between reference and NIRS-predicted data from different parities. This suggests that parity-related differences, rather than random or systematic model errors, contributed to the reduced prediction accuracy.
The decline in accuracy likely stems from chemical variations in milk composition associated with parity. For instance, medium- and long-chain fatty acids—linked to milk fat content—tend to increase with parity due to higher triglyceride levels in the blood, which enhance long-chain fatty acid synthesis. While milk fatty acid production is influenced by diet, feed quality, and mammary gland activity, first-parity cows generally produce less milk fat since more amino acids and fats are directed toward growth. Additionally, parity has been shown to affect milk corticosteroid concentrations, and multiple studies have reported that milk fat, protein, and casein levels increase with parity. These compositional changes alter milk’s chemical properties and, consequently, its NIR spectra, which impacts the accuracy of NIRS-based calibration models across parities.

4. Conclusions

The accuracy of the predicted milk quality parameters, especially lactose, was notably influenced by the sample data derived from cows in their first and second parities used for developing and validating the calibration models. Therefore, it is essential to consider bovine parity when constructing calibration models for assessing milk quality traits. Incorporating data from cows across multiple parities—including the first, second, and higher parities (third, fourth, fifth, etc.)—when building these models could help account for variations among different parity groups and enhance the overall accuracy of milk quality parameter predictions.

Author Contributions

Conceptualization, S.K. and P.I.; methodology, S.K., P.I., T.M. and T.K.; software, S.K. and P.I.; validation, P.I. and S.K.; formal analysis, P.I., S.K. and T.M.; investigation, P.I., S.K., T.M. and T.K.; data curation, P.I. and S.K.; writing—original draft preparation, P.I.; writing—review and editing, S.K., T.M. and P.I. All authors have read and agreed to the published version of the manuscript.

Funding

This research was supported by a grant from Japan’s National Agriculture and Food Research Organization (NARO) under the project for the development of new practical technologies. Grant number 1989860.

Institutional Review Board Statement

Not applicable.

Informed Consent Statement

Not applicable.

Data Availability Statement

This paper presents a summary of all the new data acquired during the study.

Conflicts of Interest

Author Takashi Kawaguchi is an employee of Orion Machinery Co., Ltd. in Nagano, Japan. The remaining authors declare that the research was conducted in the absence of any commercial or financial relationships that could be construed as a potential conflict of interest.

References

  1. Diaz-Olivares, J.A.; Gote, M.J.; Saeys, W.; Adriaens, I.; Aernouts, B. Near-infrared spatially-resolved spectroscopy for milk quality analysis. Comput. Electron. Agric. 2024, 219, 108783. [Google Scholar] [CrossRef]
  2. Zhu, Z.; Lin, B.; Zhu, X.; Guo, W. A Rapid Method of Identifying Mastitis Degree of Bovines Based on Dielectric Spectra of Raw milk. Food Qual. Saf. 2023, 7, fyad014. [Google Scholar] [CrossRef]
  3. Iweka, P.; Kawamura, S.; Mitani, T.; Kawaguchi, T.; Koseki, S. Cow Milk Progesterone Concentration Assessment during Milking Using Near-infrared Spectroscopy. Eng. Agric. Environ. Food 2021, 14, 30–36. [Google Scholar] [CrossRef] [PubMed]
  4. Iweka, P.; Kawamura, S.; Mitani, T.; Koseki, S. Effect of Cow Individuality and Calving times on accuracy of near-infrared spectroscopic sensing system for milk Quality Determination during Milking. In Proceedings of the 33rd NIR Forum JCNIR, Tsukuba, Japan, 15–17 November 2017; Japan Council of NIR Spectroscopy: Tsukuba, Japan, 2017; p. 83. [Google Scholar]
  5. Pasquini, C. Near-infrared Spectroscopy: A Mature Analytical Technique with New Perspectives—A Review. Anal. Chim. Acta 2018, 1026, 8–36. [Google Scholar] [CrossRef] [PubMed]
  6. Tsenkova, R.; Atanassova, S.; Morita, H.; Ikuta, K.; Toyoda, K.; Iordanova, K.I.; Hakogi, E. Near Infrared Spectra of Cows’ Milk for Milk Quality Evaluation: Disease Diagnosis and Pathogen Identification. J. Near Infrared Spectrosc. 2006, 14, 363–370. [Google Scholar] [CrossRef]
  7. Sato, T.; Yoshino, M.; Furukawa, S.; Someya, Y.; Yano, N.; Uozumi, J.; Iwamoto, M. Analysis of Near Infrared Milk Constituents by the Spectrophotometric Method. Jpn. J. Zootech. Sci. 1987, 58, 698–706. [Google Scholar] [CrossRef]
  8. Tse, C.; Barkema, H.W.; DeVries, T.J.; Rushen, J.; Pajor, E.A. Impact of automatic milking systems on dairy cattle producers’ reports of milking labor management, Milk Production and Milk Quality. Animal 2018, 12, 2649–2656. [Google Scholar] [CrossRef] [PubMed]
  9. Shortall, J.; Foley, C.; Sleator, R.D.; O’Brien, B. The Effect of Dairy Cow Breed on Milk Production, Cow traffic and Milking Characteristics in a Pasture-based Automatic Milking System. Livest. Sci. 2018, 209, 1–7. [Google Scholar] [CrossRef]
  10. Muniz, R.; Cuevas-Valdes, M.; de la Roza-Delgado, B. Milk Quality Control Requirement Evaluation Using a Handheld Near-infrared Reflectance Spectrophotometer and a Bespoke Mobile Application. J. Food Compos. Anal. 2020, 86, 103388. [Google Scholar] [CrossRef]
  11. Iweka, P.; Kawamura, S.; Mitani, T.; Kawaguchi, T.; Koseki, S. Online Milk Quality Assessment During Milking Using Near-infrared Spectroscopic Sensing System. Environ. Control. Biol. 2020, 58, 1–6. [Google Scholar] [CrossRef]
  12. Iweka, P.; Kawamura, S.; Mitani, T.; Kawaguchi, T. Cow Milk Quality Determination Using a Near-Infrared Spectroscopic Sensing System for Smart Dairy Farming. Eng. Proc. 2023, 58, 118. [Google Scholar] [CrossRef]
Figure 1. Online real-time NIR sensing system [12].
Blsf 54 00037 g001
Figure 2. Diagram of the NIR spectrum sensor’s milk chamber optical system [12].
Blsf 54 00037 g002
Figure 3. Relationship between measured fat content and NIR-estimated fat content (1st parity, A to A).
Blsf 54 00037 g003
Figure 4. Relationship between measured fat content and NIR-estimated fat content (2nd parity, B to B).
Blsf 54 00037 g004
Figure 5. Relationship between measured fat content and NIR-estimated fat content (1st vs. 2nd parity, A to B).
Blsf 54 00037 g005
Figure 6. Relationship between measured fat content and NIR-estimated fat content (2nd vs. 1st parity, B to A).
Blsf 54 00037 g006
Figure 7. Relationship between measured fat content and NIR-estimated fat content (1st and 2nd parity, A + B).
Blsf 54 00037 g007
Table 1. Validation statistics for A-to-A milk quality assessment using NIR spectroscopy.
Milk Quality ParametersnRanger2SEPBiasRPDRegression Line
Fat (%)721.30–7.250.990.14−0.0011.76y = 1.00 x − 0.00
Lactose (%)723.25–4.840.870.13−0.002.72y = 1.00 x + 0.00
SCC (log SCC/mL)724.30–5.980.900.13−0.003.15y = 1.00 x − 0.00
n, total number of validation samples; r2 coefficient of determination; SEP, standard error of prediction; Bias, mean difference between measured and NIRS-predicted values; RPD, ratio of SEP to the standard deviation of reference data in the validation; regression line, regression line from predicted value (x) to reference value (y).
Table 2. Validation statistics for B-to-B milk quality assessment using NIR spectroscopy.
Milk Quality ParametersnRanger2SEPBiasRPDRegression Line
Fat (%)781.21–9.330.990.18−0.0011.67y = 1.00 x − 0.00
Lactose (%)783.52–4.810.780.10−0.002.12y = 1.00 x + 0.00
SCC (log SCC/mL)784.00–5.960.870.18−0.002.77y = 1.00 x + 0.00
n, total number of validation samples; r2 coefficient of determination; SEP, standard error of prediction; Bias, mean difference between measured and NIRS-predicted values; RPD, ratio of SEP to the standard deviation of reference data in the validation; regression line, regression line from predicted value (x) to reference value (y).
Table 3. Validation statistics for A-to-B milk quality assessment using NIR spectroscopy.
Milk Quality ParametersnRanger2SEPBiasRPDRegression Line
Fat (%)781.21–9.330.980.36−0.285.74y = 1.10 x − 0.16
Lactose (%)783.52–4.810.430.18−0.061.20y = 0.65 x + 1.62
SCC (log SCC/mL)784.00–5.960.710.290.001.73y = 1.32 x − 1.59
n, total number of validation samples; r2 coefficient of determination; SEP, standard error of prediction; Bias, mean difference between measured and NIRS-predicted values; RPD, ratio of SEP to the standard deviation of reference data in the validation; regression line, regression line from predicted value (x) to reference value (y).
Table 4. Validation statistics for B-to-A milk quality assessment using NIR spectroscopy.
Milk Quality ParametersnRanger2SEPBiasRPDRegression Line
Fat (%)721.30–7.250.950.430.043.87y = 0.87 x + 0.51
Lactose (%)723.25–4.840.410.280.051.26y = 1.46 x − 2.09
SCC (log SCC/mL)724.30–5.980.520.310.001.37y = 0.76 x + 1.21
n, total number of validation samples; r2 coefficient of determination; SEP, standard error of prediction; Bias, mean difference between measured and NIRS-predicted values; RPD, ratio of SEP to the standard deviation of reference data in the validation; regression line, regression line from predicted value (x) to reference value (y).
Table 5. Validation statistics for A + B milk quality assessment using NIR spectroscopy.
Milk Quality ParametersnRanger2SEPBiasRPDRegression Line
Fat (%)1501.21–9.330.980.25−0.007.69y = 1.00 x − 0.00
Lactose (%)1503.25–4.840.590.19−0.001.55y = 1.00 x + 0.00
SCC (log SCC/mL)1504.00–50.980.790.21−0.002.16y = 1.00 x + 0.00
n, total number of validation samples; r2 coefficient of determination; SEP, standard error of prediction; Bias, mean difference between measured and NIRS-predicted values; RPD, ratio of SEP to the standard deviation of reference data in the validation; regression line, regression line from predicted value (x) to reference value (y).
Disclaimer/Publisher’s Note: The statements, opinions and data contained in all publications are solely those of the individual author(s) and contributor(s) and not of MDPI and/or the editor(s). MDPI and/or the editor(s) disclaim responsibility for any injury to people or property resulting from any ideas, methods, instructions or products referred to in the content.