Abstract
This study analyses the dynamics of snow cover in the Neelum Watershed of Pakistan and the expected changes in temperature and precipitation. Google Earth Engine was used to analyze the variability of winter snow cover with the help of MODIS 8-day data from 2000 to 2020. Two model combinations totaling five CMIP6 General Circulation Models were used to interpret future climate projections based on three Shared Socioeconomic Pathways (SSP2-4.5, SSP3-7.0, and SSP5-8.5) for 2021–2050. The modified Mann–Kendall test was used to identify trends, and the Theil–Sen estimator was used to analyze the impact. The results demonstrate that the extent of snow-covered area increased significantly between 2000 and 2020, and approximately 6448.83 km2 (approximately 87% of the watershed) was covered by snow in winter. All SSP scenarios indicated positive trends in winter precipitation with average rates of 1.87, 0.44, and 0.80 mm/yr under SSP2-4.5, SSP3-7.0, and SSP5-8.5. In all the scenarios, the minimum temperature (0.0405 °C yr−1) and maximum temperature (0.0305 °C yr−1) are consistently growing, as per temperature predictions. These projected changes indicate the danger of more frequent extreme weather events that will put a strain on the region’s ecosystems, agriculture, and hydropower operations. The findings offer the necessary information to inform strategies regarding climate adaptation and mitigation in the Neelum River basin.
1. Introduction
The most significant ecological problem of the twenty-first century is global climate change. Sustainable food production can be affected by several factors, including rising air temperatures, shifting rainfall patterns, and an increase in the intensity of extreme weather events [1]. As a consequence of global warming, air temperatures, monsoon precipitation, and winter precipitation have all changed during the past 30 years [2]. As a direct result of global warming, the rate of severe weather patterns has increased substantially in the past few decades [3]. Multiple devastating floods, enormous economic losses, and casualties have been recorded in Pakistan as a result of these calamities [4]. Because of continued global warming, extreme weather occurrences are expected to increase during the next ten years [5]. General Circulation Models, or GCMs, are the primary source of data used to examine the potential implications of climate change [6]. Most previous research on climate change projections in Pakistan has used General Circulation Models from the Coupled Model Intercomparison Project Phase 5 (CMIP5) [5,7]. The CMIP6 GCMs outperform their predecessors in the CMIP series in accurately depicting cloud microphysical processes and improving the spatial resolution of their predictions. However, compared to observations from ground-based stations, GCMs exhibit systematic biases [8]. Therefore, it is essential to remove any biases in the GCM outputs before analyzing the consequences of climate change on various sectors at regional and local scales. In GCM projections, statistical and dynamical methods are primarily used to downscale and account for bias. Statistical downscaling techniques create statistical connections between GCM outputs and reference datasets obtained from in situ weather stations.
Snow is a crucial environmental element that affects vegetation at high elevations, among other things [9]. Snowfall usually occurs in these mountainous areas during the winter months. As a natural reservoir, the resulting snowpack holds water during the winter and releases it gradually during warmer months [10,11]. Therefore, snowfall is essential to maintaining the steady flow of many of the world’s largest rivers. With the right hydrological model, the complicated dynamics of snowmelt processes in a particular basin can be studied.
For instance, Li et al. [9] used datasets from multiple GCMs to predict the expected changes in precipitation over Pakistan. Their analysis revealed an increasing trend of precipitation in Pakistan under SSP3-7.0 and 5-8.5. Data from three CMIP6 GCMs were used to evaluate the variations in key climatic variables such as precipitation and temperature under three SSPs (SSP1-2.6, 2-4.5, and 5-8.5) in Pakistan’s Astore River Watershed. Under the SSP 1-2.6, 2-4.5, and 5-8.5 scenarios, they anticipated an increasing trend in the watershed’s temperature, with rates of change ranging from −0.68 °C to −1.18 °C, respectively. Under the SSP1-2.6 scenario, the estimated annual average precipitation is likely to increase by up to 27.60%; under the SSP2-4.5 scenario, it is expected to increase by 6.91%; and under the SSP5-8.5 scenario, it is expected to drop by up to 22.51%. Azmat et al. (2017) [12] described the trend over the past 50 years, noting substantial changes in temperature and precipitation patterns over the Jhelum River basin in India. This change has significant implications for the region’s snow-covered area (SCA), increased risk of flooding, food insecurity, and drinking water shortages [12]. Furthermore, Gurung et al. (2017) [13] showed that the MODIS snow product is a reliable tool for calculating the amount of snow in the Hindu Kush Himalayas (HKH). None of the previous studies have assessed possible variations in projected temperature and precipitation over the Himalayan Mountains using data from the latest CMIP6 models and scenarios [13,14]. This gap is anticipated to be addressed in the current study, which projects probable changes in temperature and precipitation over the Neelum Watershed in the Himalayan Range.
This study was conducted to provide insight into future trends of precipitation, maximum temperature (TMax), minimum temperature (TMin), and snow cover dynamics in the Neelum River Watershed of Pakistan using bias-corrected data from the latest CMIP6 GCMs. Variations in projected precipitation and temperatures on seasonal scales in the near future (2021–2050) were assessed. For snow cover dynamics, data from MODIS 8 were analyzed using Google Earth Engine. The results of this research can be used to prepare mitigation and adaptation measures to address the climate-related threats in the Neelum Watershed. The results of this study may also be useful in managing and operating the Neelum–Jhelum Hydropower Plant in a sustainable way [15]. Furthermore, this study has the potential to offer valuable information on probable precipitation and temperature trends across diverse climatic and geographic regions of Pakistan. It can also serve as a basis for future research on projecting climate conditions in the mountainous regions of Pakistan.
2. Materials and Methods
2.1. Study Area and Datasets
In this study, the Neelum River, the chief fluvial system in the Neelum Valley, was analyzed. The Neelum Valley has a length of about 250 km and an area of about 7438 km2. It is oriented from northeast to southwest and lies in the northeast of Pakistani territory (western Himalayas), and it falls within the longitudes of 73.40–75.38 °E and latitudes of 34.23–35.13 °N, as shown in Figure 1. Krishnasar Lake in eastern Kashmir is the source of the river. It is the largest tributary of the Jhelum River and meets the Indus River at the lower end, thus playing a critical role in adding water to the Mangla Reservoir, which is the second-largest reservoir in Pakistan. The occurrence of precipitation in the Neelum Valley is heavily concentrated during the monsoon period (July to September). Peak precipitation intensity occurs in July, with the lowest values recorded in November. Winter snowfall contributes a large part of total winter precipitation, serving as a major source of river water during the summer. The average maximum flow of the Neelum River is 755 m3/s−1 (measured in June), and the average minimum flow is 64 m3/s (measured in January). Similarly, the Neelum Valley is also considered an important area for almond production, supported by good climatic and edaphic environments that significantly contribute to the local economy and livelihoods of resident farming communities.
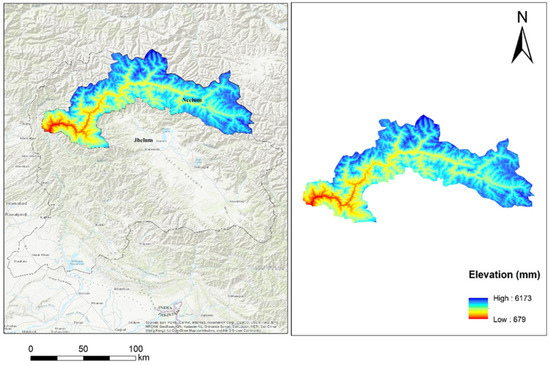
Figure 1.
Location map of the Neelum River basin.
2.2. In Situ Data
The Pakistan Meteorological Department (PMD) and the Water and Power Development Authority (WAPDA) of Pakistan gave the daily rainfall, minimum, and maximum temperature data from five local meteorological stations, which are shown in Table 1. The data covered the years from 1985 to 2014. The PMD and WAPDA followed the World Meteorological Organization (WMO) directions for gathering and analyzing hydro climatic data.

Table 1.
Description of meteorological stations.
2.3. GCMs Data
The COPERNICOUS Website was used to obtain the simulated outputs of precipitation (Pr), maximum temperature (Tmax), and minimum temperature (Tmin) from five General Circulation Models (GCMs) under three distinct Shared Socioeconomic Pathways (SSPs): SSP2-4.5, 3-7.0, and 5-8.5. These five GCMs were selected based on aspects like simulated representativeness and geographical resolution. The five GCMs utilized in this work are called ACCESS-CM2, CNRM-CM6-1, MIROC6, MPI-ESM1-2-LR, and MRI-ESM2-0.
2.4. Google Earth Engine (GEE) System
Google Earth Engine (GEE), launched in 2010, was made especially for processing and storing massive geographical datasets. The key significance that GEE plays in furthering Earth science research has been highlighted by recent studies [16]. Analysis of water resources, precipitation, surface and groundwater, snow cover changes, snow depth, snow water equivalent, and monitoring shifts in land use and land cover are just a few of the many applications made possible by the platform.
2.5. MODIS 8 Data
In this study, data from MODIS 8 over the period of 2000–2020 were used to analyze snow cover dynamics in the Neelum Watershed.
2.6. BIAS Correction of GCMs Data
GCM outputs may be used to forecast climate change at relatively high temporal resolutions, usually with grids larger than 100 × 100 km2. Nevertheless, GCM simulations with this level of resolution are not appropriate for direct use in studies at the watershed scale. Consequently, a number of downscaling techniques have been developed to modify the resolution of GCM outputs. These techniques may be generally divided into two categories: dynamical and statistical downscaling techniques. Both strategies have their advantages and disadvantages. Statistical downscaling procedures vary from dynamical downscaling in its simplicity, accuracy, and lower processing demands.
where LSF add, i and LSFmul indicate the downscaled precipitation data under additive and multiplicative approaches. Obsi shows the quantity of precipitation at each time step i throughout the analysis period. Pb and Pe stand for the mean precipitation values for the baseline period (1985–2014) and the evaluation period, respectively.
LSFadd, I = Obsi + CFadd
LSFmul, I = Obsi × CFmul
CFadd = Pe − Pb
CFmul = Pe/Pb
2.7. Trends Analysis of Extreme Temperature and Precipitation
Projected rainfall, Tmax and Tmin, were examined for linear trends using the nonparametric modified Mann–Kendall (MMK) test. This method has less impact from series outliers and works better with non-normal data. Rainfall, Tmax, and Tmin changes were looked at in this study on both an annual and seasonal basis. The Mann–Kendall (MK) test has been amended to become the MMK test. The MMK test, modified by Hamid and Rao in 1998, take into consideration the corrected variance of the MK statistic S. The following formulas can be used to calculate the variance V(S), the corrected variance V*(S), the S values, and the standard test statistic Z as follows:
where
where and are the jth and kth values (kj) in the time series, is the number of observations, is the period length, and is the significant autocorrelation function of the ranks of the observations in these equations. Positive or negative Z-values indicate upward or downward trends, respectively. The significance of the trend was set at 5%. To estimate the slope of the trend, the Thiel–Sen’s slope estimation (TS) test was used. According to TS, the slope was calculated as follows:
where and indicate the data values at times j and k, respectively, and Q is Sen’s slope statistics
V∗(S) = V(S)·Cor
3. Results
Changes in the precipitation, maximum temperature, minimum temperature, and snow cover dynamics in the Neelum Watershed area during the winter season have been recorded.
3.1. Linear Trend of Precipitation Under SSP 2-4.5, 3-7.0, and 5-8.5 (2021–2050)
The linear trend of precipitation under the most recent IPCC Sixth Assessment Report climate change scenarios is shown in Figure 2. Under SSP 2-4.5, precipitation shows an increasing trend with a rate of 1.87 mm/year. The changes in precipitation under SSP 3-7.0 are shown in Figure 2, where the rate of change in precipitation is 0.44 mm/year. The result of precipitation changes under SSP 5-8.5 is shown in Figure 2 with a rate of change of 0.80 mm/year. Thus, these results indicate an increasing trend in precipitation across all SSP scenarios used in this study in the Neelum Watershed. Therefore, improved water conservation planning is needed, such as constructing check dams, as this river is the main source of the Neelum–Jhelum Hydropower Project. It supports the Mangla Dam, Pakistan’s second-largest reservoir, which contributes to about 65% of the agriculture in this area.
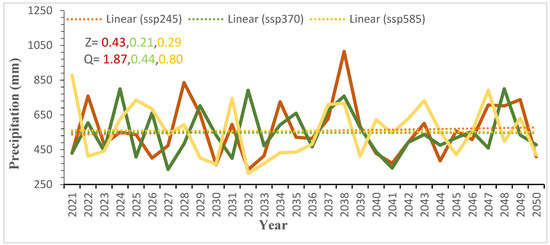
Figure 2.
Linear trend of precipitation in the winter season under SSP 2-4.5, 3-7.0, and 5-8.5.
3.2. Linear Trend of Tmax Under SSP 2-4.5, 3-7.0, and 5-8.5 (2021–2050)
Linear trends of maximum temperature under SSP 2-4.5, 3-7.0, and 5-8.5 are shown in Figure 3. Results of the MMK test for SSP 2-4.5 indicated that there is an increasing trend in maximum temperature in this region, with a rate of 0.03 °C/year. In Figure 3, Z-value shows the significance level: if Z < 1.96, the trend is non-significant; and if Z > 1.96, the trend is significant at the 95% confidence level. Figure 3 also shows an increasing trend under SSP 3-7.0 and SSP 5-8.5 in the near future, with a rate of change of 0.04 °C/year and 0.05 °C/year, respectively. Thus, in the future period (2021–2050), maximum temperature is slightly increased in the Neelum Watershed. All SSP scenarios show an increasing trend of temperature.
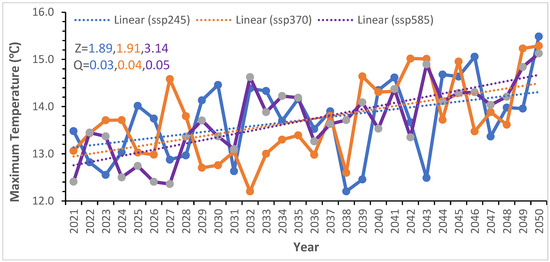
Figure 3.
Linear trend of Tmax in the winter season under SSP 2-4.5, 3-7.0 and 5-8.5.
3.3. Linear Trend of Tmin Under SSP 2-4.5, 3-7.0 and 5-8.5 (2021-2050)
Figure 4 shows the linear trend of the minimum temperature under SSP 2-4.5, 3-7.0, and 5-8.5 scenarios, respectively. The region’s minimum temperature is rising, with an average annual increase of 0.04 °C/year, according to the results of the Mann–Kendall (MMK) test for SSP 2-4.5. The statistical significance is indicated by the Z-value in these figures, where Z > 1.96 denotes statistical significance at the 95% confidence level, and Z < 1.96 shows a non-significant trend. The trend for SSP 3-7.0 is depicted in Figure 4, which indicates an increasing tendency in the near future at a rate of 0.04 °C/year. The minimum temperature is increasing at a rate of 0.05 °C annually under SSP 5-8.5. It is anticipated that the Neelum Watershed’s minimum temperature would slightly rise between 2021 and 2050. The lowest temperature shows an increasing trend in all SSP situations.
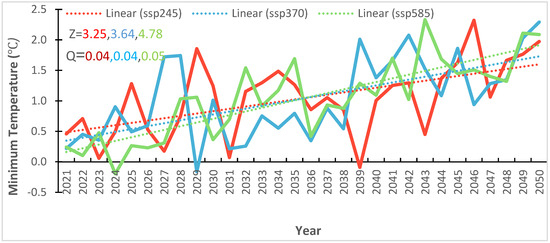
Figure 4.
Linear trend of Tmin in the winter season under SSP 2-4.5, 3-7.0, and 5-8.5.
3.4. Trend of Snow Cover in the Winter Season (2000–2020)
Figure 5 shows how the snow cover in the Neelum Watershed changed over time between 2000 and 2020. Using data from the MODIS (Moderate Resolution Imaging Spectroradiometer), namely MODIS 8, which was accessed via Google Earth Engine, snow cover analysis was performed. According to the data, there was a noticeable increase in snow cover in the Neelum Watershed throughout the winter months during the given time frame. This tendency may be explained by changes in the climate, such as changes in temperature, patterns of precipitation, and other meteorological elements that affect snow dynamics in this area. These results enhance our knowledge of the region’s fluctuations in snow cover and may have implications for ecological research, hydrological modeling, and water resource management in the Neelum Watershed.
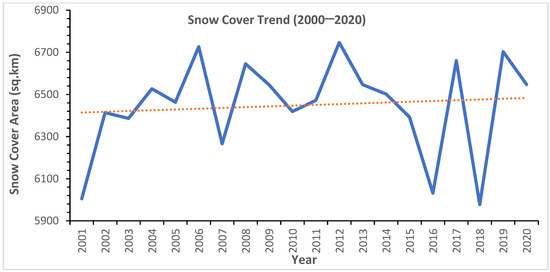
Figure 5.
Trend of SCA in the winter season at the Neelum Watershed.
4. Discussion
The results indicate important consequences for the area’s climate and hydrology under various SSP scenarios. With successful mitigation strategies, the moderate pathway (SSP2-4.5) shows the potential for maintaining climatic consequences by forecasting comparatively controllable changes. On the other hand, SSP3-7.0 and SSP5-8.5 show higher levels of warming and increased precipitation, which may worsen threats like flooding, extreme weather, and snowmelt variability. Although rising temperatures may cause snow to melt quickly, upsetting seasonal flow regimes and downstream water availability, the anticipated increase in snow cover area under all scenarios may initially ease concerns about water scarcity. These findings highlight the extensive interaction between temperature and precipitation in shaping snow cover dynamics. More research is required to determine the long-term effects on biodiversity, hydropower production, and agriculture. In order to overcome uncertainties and lessen vulnerabilities under future climate scenarios, this study emphasizes the need for regional climate modeling, policy interventions, and integrated water resource management.
5. Conclusions
- All three of the Shared Socioeconomic Pathway (SSP) scenarios—SSP2-4.5, SSP3-7.0, and SSP5-8.5—are likely to see an increase in precipitation, with the higher-emission scenarios (SSP3-7.0 and SSP5-8.5) seeing the largest increases.
- Across all scenarios, both extreme temperature indices (Tmax and Tmin) show statistically significant increasing trend, with SSP5-8.5 having the most distinct warming effect. All of these temperature variations indicate a rise in heat stress and the need to make subsequent changes in ecological and hydrological systems.
- Historical snow cover dynamics, which occurred between 2000 and 2020, showed variability and were mostly dependent on precipitation patterns. However, future projections showed that the average area covered by snow would rise, particularly in scenarios with higher precipitation.
- Higher temperatures may cause melted snow to rise more quickly at lower elevations, but even with shifts in altitude, greater snow cover than the present average is expected in the region.
- All of the associated changes in temperature, precipitation, and snow cover are identifiers that are expected to make climate more variable, and their effects may include minor problems with agricultural productivity, seasonal water, and the sustainability of ecosystems.
- Effective adaptation and mitigation techniques must be used to address these problems, especially in order to ensure the region’s long-term socioeconomic resilience and dependable management of its water resources.
Author Contributions
Conceptualization, W.I., M.N.A., M.S. (Muhammad Saqlain) and O.F.; methodology, W.I., S.Q. and Z.A.; software, S.B. and M.S. (Muhammad Suleman); validation, W.I., M.N.A. and S.U.; formal analysis, W.I. and G.R.; investigation, W.I. and O.F.; resources, W.I.; data curation, S.Q. and M.S. (Muhammad Saqlain); writing—original draft preparation, W.I., O.F., S.Q., Z.A., S.U. and M.S. (Muhammad Suleman); writing—review and editing, W.I., M.N.A. and O.F.; visualization, S.Q., W.I. and Z.A.; supervision, M.S. (Muhammad Saqlain) and M.S. (Muhammad Suleman); project administration, W.I., M.N.A. and G.R.; funding acquisition, W.I. All authors have read and agreed to the published version of the manuscript.
Funding
This research received no external funding.
Institutional Review Board Statement
Not applicable.
Informed Consent Statement
Not applicable.
Data Availability Statement
The data presented in this study are available upon request from the corresponding author.
Acknowledgments
We are all thankful to the Pakistan Meteorological Department (PMD) for providing data used in this study.
Conflicts of Interest
The authors declare no conflicts of interest.
References
- Ghanim, A.A.J.; Anjum, M.N.; Rasool, G.; Saifullah; Irfan, M.; Rahman, S.; Mursal, S.N.F.; Niazi, U.M. Assessing Spatiotemporal Trends of Total and Extreme Precipitation in a Subtropical Highland Region: A Climate Perspective. PLoS ONE 2023, 18, e0289570. [Google Scholar] [CrossRef] [PubMed]
- Naveed, M.; Ding, Y.; Shangguan, D. Simulation of the Projected Climate Change Impacts on the River Fl Ow Regimes under CMIP5 RCP Scenarios in the Westerlies Dominated Belt, Northern Pakistan. Atmos. Res. 2019, 227, 233–248. [Google Scholar] [CrossRef]
- Bhatti, A.S.; Wang, G.; Ullah, W.; Ullah, S.; Fiifi Tawia Hagan, D.; Kwesi Nooni, I.; Lou, D.; Ullah, I. Trend in Extreme Precipitation Indices Based on Long Term In Situ Precipitation Records over Pakistan. Water 2020, 12, 797. [Google Scholar] [CrossRef]
- Hussain, M.; Mumtaz, S. Climate Change and Managing Water Crisis: Pakistan’s Perspective. Rev. Environ. Health 2014, 29, 71–77. [Google Scholar] [CrossRef]
- Waseem, M.; Ajmal, M.; Ahmad, I.; Khan, N.M.; Azam, M.; Sarwar, M.K. Projected drought pattern under climate change scenario using multivariate analysis. Arab. J. Geosci. 2021, 14, 544. [Google Scholar] [CrossRef]
- Salehie, O.; Ismail, T.B.; Hamed, M.M.; Shahid, S.; Idlan Muhammad, M.K. Projection of hot and cold extremes in the Amu River basin of Central Asia using GCMs CMIP6. Stoch. Environ. Res. Risk Assess. 2022, 36, 3395–3416. [Google Scholar] [CrossRef]
- Moazzam, M.F.U.; Rahman, G.; Munawar, S.; Tariq, A.; Safdar, Q.; Lee, B.-G. Trends of Rainfall Variability and Drought Monitoring Using Standardized Precipitation Index in a Scarcely Gauged Basin of Northern Pakistan. Water 2022, 14, 1132. [Google Scholar] [CrossRef]
- Li, Y.; Bai, J.; You, Z.; Hou, J.; Li, W. Future changes in the intensity and frequency of precipitation extremes over China in a warmer world: Insight from a large ensemble. PLoS ONE 2021, 16, e0252133. [Google Scholar] [CrossRef] [PubMed]
- Cornelius, C.; Estrella, N.; Franz, H.; Menzel, A. Linking altitudinal gradients and temperature responses of plant phenology in the Bavarian Alps. Plant Biol. 2013, 15, 57–69. [Google Scholar] [CrossRef] [PubMed]
- Iqbal, W.; Cheema, M.J.M.; Anjum, M.N.; Amin, M.; Hussain, S. Projections of Precipitation and Temperature Changes in the Neelam River Basin, Western Himalaya: A CMIP6-Based Assessment Under Shared Socioeconomic Pathways. Earth Syst. Environ. 2025. [Google Scholar] [CrossRef]
- Şengül, S.; İspirli, M.N. Predicting Snowmelt Runoff at the Source of the Mountainous Euphrates River Basin in Turkey for Water Supply and Flood Control Issues Using HEC-HMS Modeling. Water 2022, 14, 284. [Google Scholar] [CrossRef]
- Azmat, M.; Liaqat, U.W.; Qamar, M.U.; Awan, U.K. Impacts of Changing Climate and Snow Cover on the Flow Regime of Jhelum River, Western Himalayas. Reg. Environ. Chang. 2017, 17, 813–825. [Google Scholar] [CrossRef]
- Gurung, D.R.; Maharjan, B.; Shrestha, B.; Shrestha, S. Climate and Topographic Controls on Snow Cover Dynamics in the Hindu Kush Himalaya. Int. J. Climatol. 2017, 37, 3873–3882. [Google Scholar] [CrossRef]
- Hussain, S.; Malik, S.; Masud Cheema, M.J.; Ashraf, M.U.; Waqas, M.S.; Iqbal, M.M.; Ali, S.; Anjum, L.; Aslam, M.; Afzal, H. An Overview on Emerging Water Scarcity Challange in Pakistan, Its Consumption, Causes, Impacts and Remedial Measures. Big Data Water Resour. Eng. 2020, 1, 22–31. [Google Scholar] [CrossRef]
- Hussain, S.; Arshad, M.; Cheema, M.J.M.; Qamar, M.U.; Wajid, S.A.; Daccache, A. Advancing Soil Moisture Prediction Using Satellite and UAV-Based Imagery Using Moisture Indices with Machine Learning Models. Earth Syst. Environ. 2025. [Google Scholar] [CrossRef]
- Zhao, Q.; Yu, L.; Li, X.; Peng, D.; Zhang, Y.; Gong, P. Progress and Trends in the Application of Google Earth and Google Earth Engine. Remote Sens. 2021, 13, 3778. [Google Scholar] [CrossRef]
Disclaimer/Publisher’s Note: The statements, opinions and data contained in all publications are solely those of the individual author(s) and contributor(s) and not of MDPI and/or the editor(s). MDPI and/or the editor(s) disclaim responsibility for any injury to people or property resulting from any ideas, methods, instructions or products referred to in the content. |
© 2025 by the authors. Licensee MDPI, Basel, Switzerland. This article is an open access article distributed under the terms and conditions of the Creative Commons Attribution (CC BY) license (https://creativecommons.org/licenses/by/4.0/).