Proceeding Paper

The Acclimation Mechanisms of Chlamydomonas reinhardtii against Nitrosative Stress: A Role of NADPH Oxidase (RBOL2) in the Regulation of Nitric Oxide-Mediated ER Stress and Glutathione Redox State †

1
Department of Marine Biotechnology and Resources, National Sun Yat-sen University, Kaohsiung 804, Taiwan
2
Doctoral Degree Program in Marine Biotechnology, National Sun Yat-sen University, Kaohsiung 804, Taiwan
*
Author to whom correspondence should be addressed.
Presented at the 1st International Electronic Conference on Plant Science, 1–15 December 2020; Available online: https://iecps2020.sciforum.net/.
Biol. Life Sci. Forum 2021, 4(1), 33; https://doi.org/10.3390/IECPS2020-08609
Published: 30 November 2020
(This article belongs to the Proceedings of The 1st International Electronic Conference on Plant Science)

Abstract

:
Nitric oxide (NO) is a signal in the modulation of acclamatory responses to stress in plants. Here, the metabolic shift of Chlamydomonas reinhardtii to sub-lethal NO stress was approached by exposure to 0.1 mM S-nitroso-N-acetylpenicillamine (SNAP), a NO donor, in the presence or the absence of the NO scavenger, 2-(4-carboxyphenyl)-4,4,5,5-tetramethylimidazoline-l-oxyl-3-oxide (cPTIO). NO did not cause growth impairment but induced a decrease in glutathione (GSH) levels and redox state. NO upregulated the expression of glutathione-associated genes, glutathione synthetase (GSH1), and glutathione reductase (GSHR1) genes while it decreased that of the proteins associated with ER stress-induced unfolded protein response (UPR). Furthermore, the expression of NADPH oxidase isoform, respiratory burst oxygenase-like 2 (RBOL2), instead of RBOL1 increased under NO stress. NO-induced upregulation of GSH1 and GSHR1 upregulation and the downregulation of most UPR genes were not found in rbol2 mutant. The presence of cPTIO suppressed the NO-induced changes in GSH availability, UPR, and RBOL expression. Overall, NADPH oxidase (RBOL2)-dependent and -independent signaling pathways involve in the inhibition of UPR and the enhancement of GSH availability by NO.

1. Introduction

Nitric oxide (NO) is an important signaling molecule in the regulation of many metabolic processes in plants [1]. Evidence shows that NO plays a dual role as a positive regulator or cytotoxic messenger, depending on its concentration and/or the environments. For example, the administration of NO in low concentrations increases the activity of antioxidant enzymes in rice exposed to salt stress [2]. The transcription of stress resistance genes can be also increased by NO or the regulation of several physiological processes in the defense of adverse conditions [3]. NO also modulates the antioxidant defense system in plants in response to stressful conditions. The application of a NO donor, S-nitroso-N-acetylpenicillamine (SNAP), triggers a further increase in the protein levels and activities of several antioxidant enzymes, superoxide dismutase (SOD), ascorbate peroxidase (APX), and glutathione reductase (GR) in rice seedlings exposed to Al3+ stress and, in turn, alleviates the Al3+ toxicity [4]. In contrast, the treatment of SNAP or another NO donor, S-nitrosoglutathione (GSNO), inhibits the activities of antioxidant enzymes, APX and catalase (CAT), in tobacco, pea, and Arabidopsis [5,6,7,8]. The contradictory results are possibly due to the NO concentration and/or plant species.
The model species Chlamydomonas reinhardtii, a unicellular green alga, is widely used for studying a broad range of biological processes [9]. It is known that NO is a factor in the regulation of several physiological processes and stress responses in Chlamydomonas, including the remodeling of chloroplast proteins by degrading cytochrome b6f complex and Rubisco via FtsH and Clp proteases and the regulation of nitrogen assimilation by repressing the expression of nitrate reductase and nitrate and ammonium transporters [10] and their enzyme activities [11,12] under nitrogen limitation, mastoparan-induced cell death [13], high light-induced oxidative stress [14] and autophagy [15,16], proline accumulation under copper stress [16], and upregulation of alternative oxidase 1 for regulation of mitochondrial respiration [17].
Endoplasmic Reticulum (ER) is a dynamic organelle responsible for protein synthesis, folding, assembling, asparagine-linked glycosylation, and transport [18]. It is known that misfolded or unfolded proteins will cause ER stress in which, to protect the cells, the unfolded protein response (UPR) is induced for the restoration of cellular protein homeostasis [19]. The sensors to ER stress for the induction of UPR and its role in the regulation of lipid metabolism have been identified in Chlamydomonas [20,21]. The involvement of NO in the modulation of ER stress has been heavily studied in mammals [22,23,24]. However, the study on the role of NO in the regulation of UPR under ER stress is still less in plants [25]. Furthermore, using an inhibitor of NADPH oxidase, diphenyleneiodonium chloride (DPI), and NADPH oxidase mutants (Atrbohc, d, and f), it is identified that NADPH oxidase is required for the survival of Arabidopsis under ER stress [26]. As we know, the information for modulation of ER stress-induced UPR in C. reinhardtii through NADPH oxidase in response to NO has not been clearly elucidated.
In this study, SNAP was applied to C. reinhardtii in a low concentration of 0.1 mM in the presence or absence of the NO scavenger, 2-(4-carboxyphenyl)-4,4,5,5-tetramethylimidazoline-l-oxyl-3-oxide (cPTIO). The present findings found that the SNAP-treated cells showed normal growth as compared to the SNAP-free treatment, accompanied with the upregulation of glutathione biosynthesis and a redox state as well as the inhibition of ER stress. Furthermore, the NADPH oxidase involve in the inhibition of UPR and the enhancement of glutathione availability by NO, whilst other NO-induced metabolic changes are under control by other sensing and signaling routes.

2. Experiments

2.1. Algal Culture and Treatments

The green alga Chlamydomonas reinhardtii, strain CC-125 (mt-), was obtained from the Chlamydomonas Resource Center (USA) and photoheterotrophically cultured in Tris-acetate phosphate medium (TAP) [27] with a trace element solution in 125 mL flasks (PYREX, Germany) and agitated on an orbital shaking incubator (model OS701, TKS company, Taipei, Taiwan) (150 rpm) under continuous illumination with white light (50 μmol·m−2·s−1) at 25 °C. For chemical treatments, 50 mL cultures were grown to a cell density of 3–5 × 10⁶ cells/mL, and after centrifugation at 1600× g for 3 min, the supernatant was discarded.
The pellet was suspended in fresh TAP medium to wash the cells and centrifuged again. Then, the pellet was re-suspended in fresh TAP medium to a cell density of 3 × 10⁶ cells/mL. Ten mL of culture was transferred to a 100-mL beaker (internal diameter: 3.5 cm) for pre-incubation at 25 °C in 50 μmol·m−2·s−1 conditions for 1.5 h in an orbital shaker (model OS701, TKS company, Taipei, Taiwan) at a speed of 150 rpm. Then, the algal cells were treated with chemical at 25 °C. Each treatment included three replicates (n = 3). Samples taken before (0 min) and after chemical treatment were centrifuged at 5000× g for 5 min, and the pellet was fixed in liquid nitrogen and stored in a −70 °C freezer until analysis.
In attempts to explore the physiological responses of C. reinhardtii to NO challenge in different levels, SNAP, a NO donor, was applied in TAP medium at the concentrations of 0.1 mM and 0.3 mM, respectively. Furthermore, to identify the NO effects, a NO scavenger, cPTIO [28], was applied together with SNAP to scavenge the released NO. The cell number in a 1-mL sample was counted using a hemocytometer.

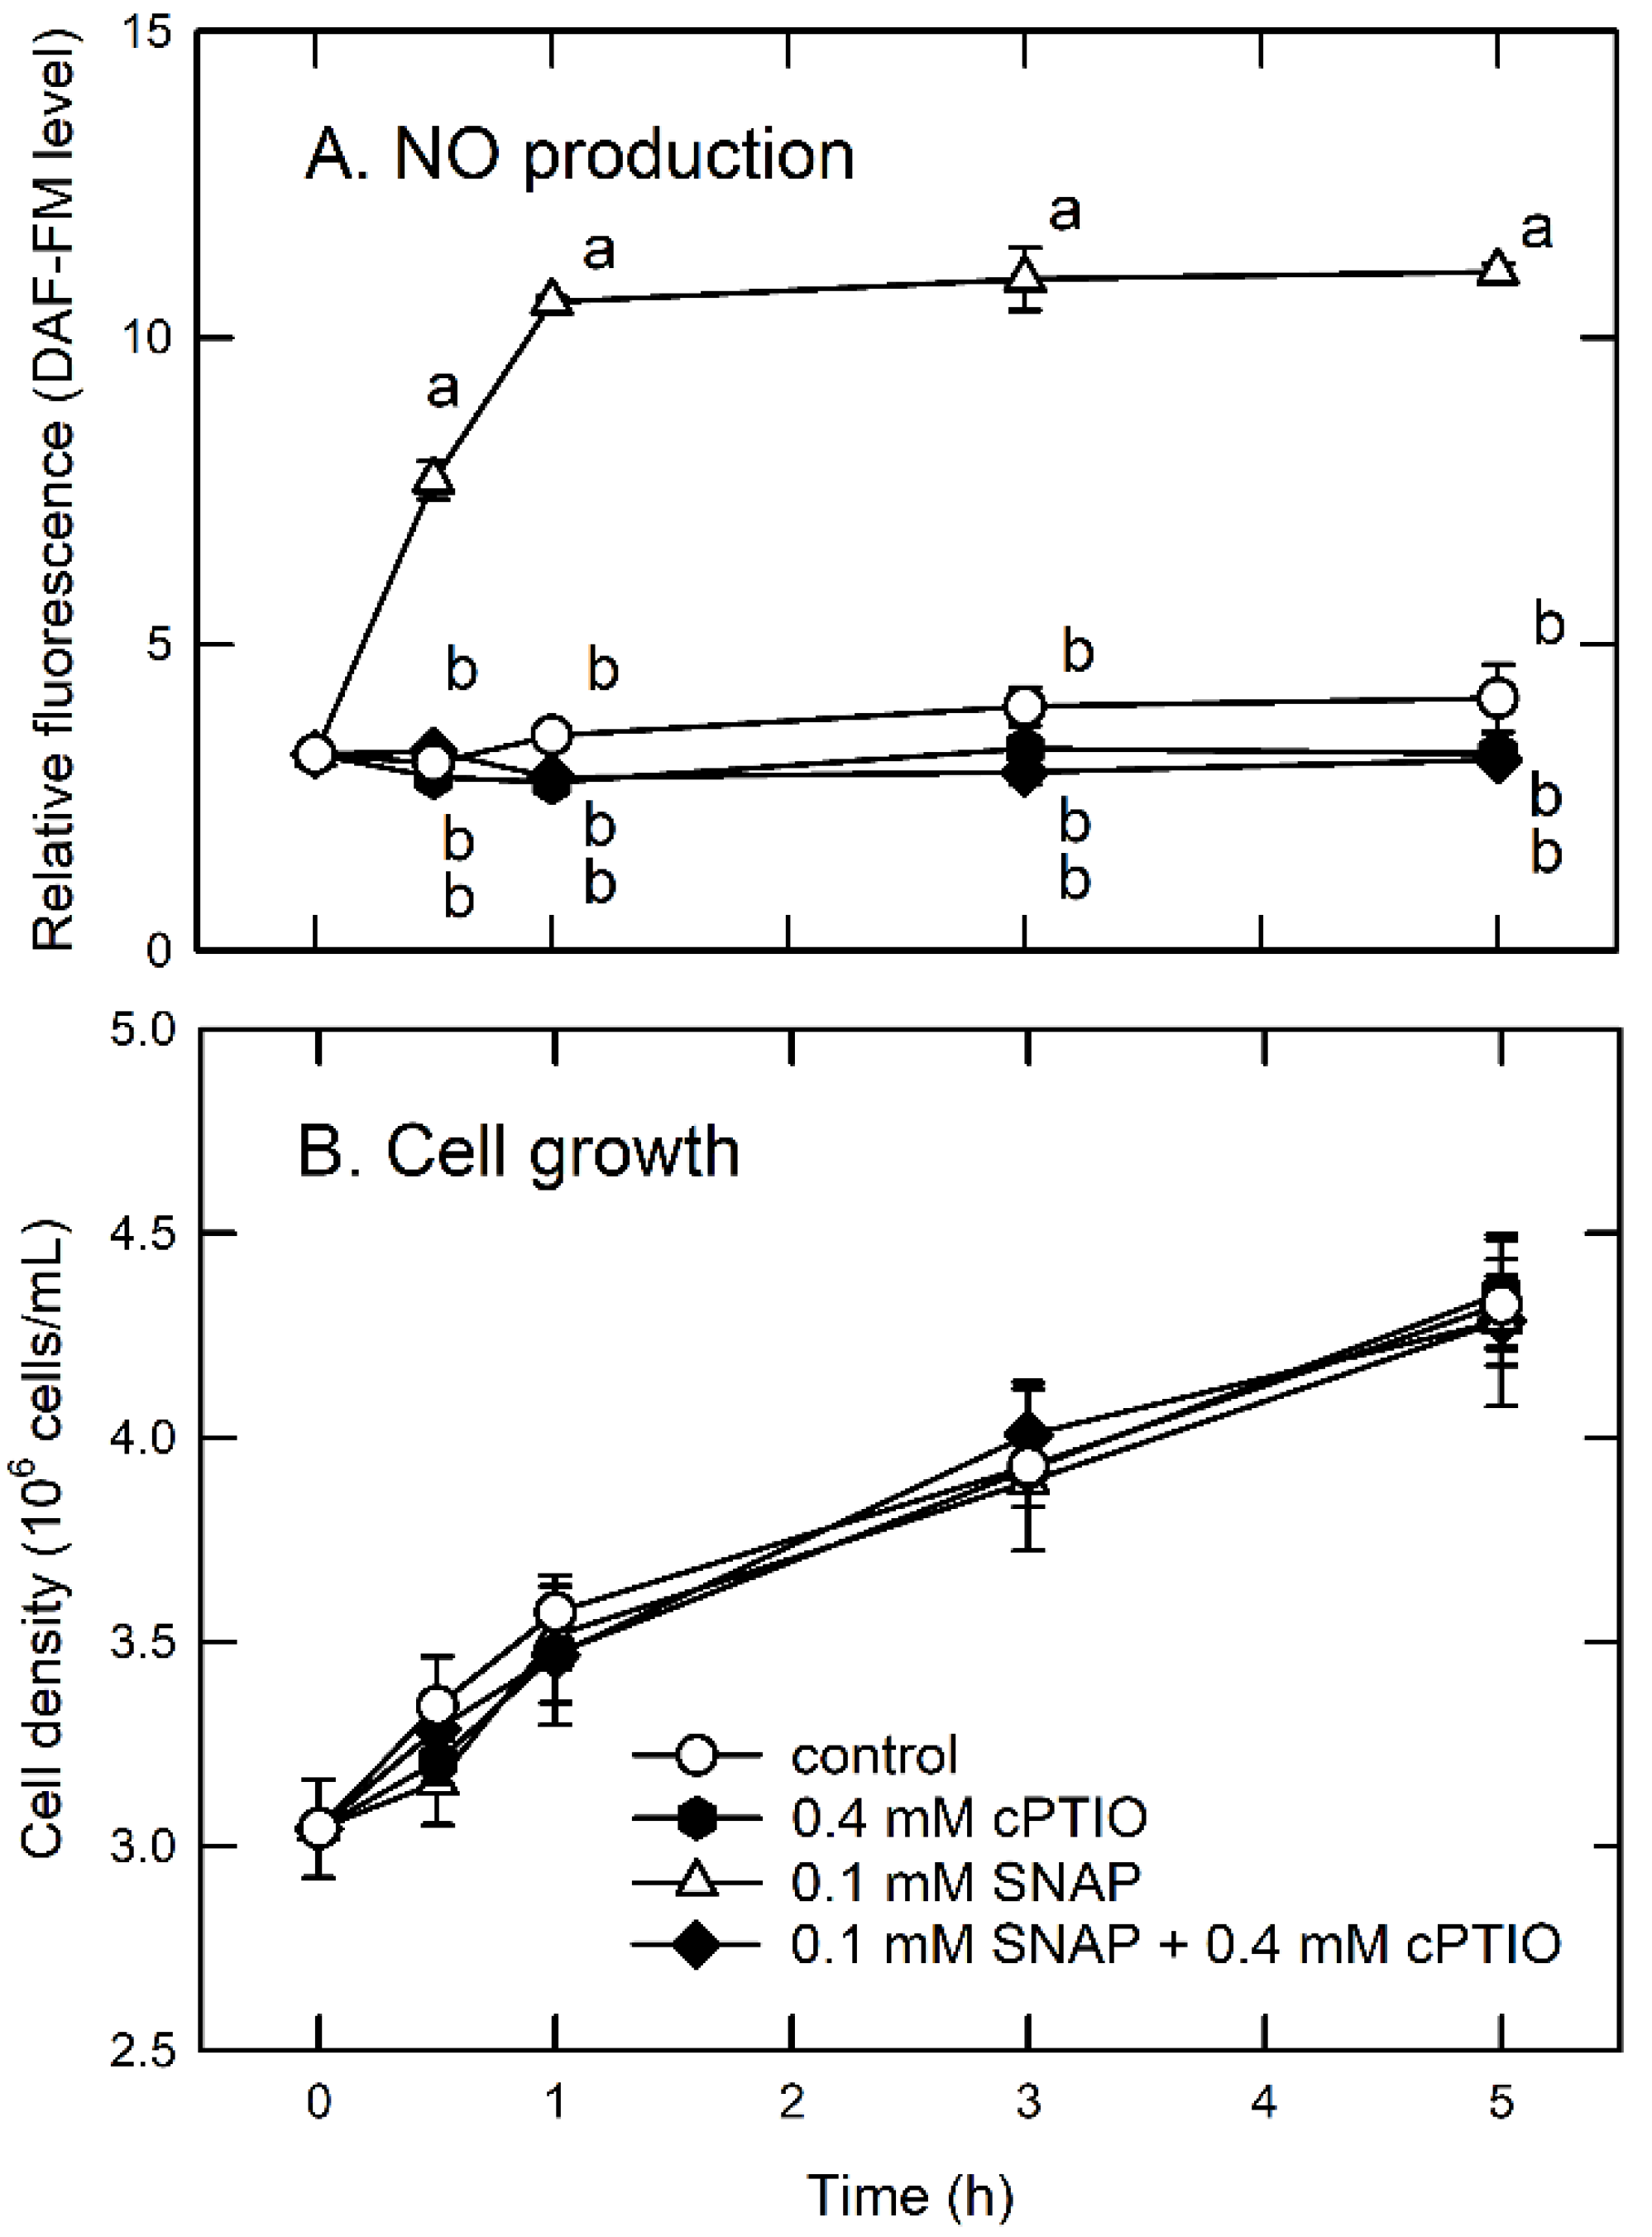
2.2. Detection of NO Production

An NO-sensitive fluorescent dye, DAF-FM diacetate (Invitrogen Life Technologies, Carlsbad, CA, USA), which is a pH-insensitive fluorescent dye that emits fluorescence after reaction with an active intermediate of NO, was used to measure NO production following our previous studies [14,29]. For the detection of NO, cells were pre-incubated in TAP medium containing 5 μM DAF-FM diacetate for 60 min at 25 °C under 50 μmol·m−2·s−1 conditions, then washed twice with fresh TAP medium and subjected to chemical treatment. The fluorescence in the cells was observed under a fluorescence microscope (Eclipase Ni, Nikon, Tokyo, Japan) with excitation at 488 nm with an FITC filter (Nikon, Tokyo, Japan). The fluorescence images were acquired using a CCD camera (Nikon’s Digital Sight DS-U3, Tokyo, Japan). Fluorescence was also determined with a fluorescence spectrophotometer at an excitation wavelength of 492 nm and emission wavelength of 525 nm (F-2500, Hitachi, Tokyo, Japan).

2.3. Enzyme Assay

GR activity was determined according to the method of Lin et al. (2016) [28] with modifications. Five ml of algal culture was centrifuged at 4000× g to collect the algal cells. The enzyme extract was obtained after extraction of algal cells in 50 mM NaH2PO4-Na2HPO4 (pH 7.5) buffer containing a protease inhibitor cocktail (P9599; Sigma-Aldrich, St. Louis, MO, USA), 0.5 mM Na2EDTA, 5 mM 2-mercaptoethanol, 1 mM phenylmethanesulfonylfuoride, and 10 mg polyvinylpyrrolidone by sonication. The extract was centrifuged at 20,000× g at 4 °C for 10 min, and the supernatant was collected as an enzyme extract. GR activity was assayed by mixing 0.01 mL enzyme extract with 0.35 mL of 0.15 M Na2HPO4/NaH2PO4 buffer (pH 7.5), 0.25 mL of 2 mM Na2EDTA, 0.05 mL of 30 mM MgCl2, 0.1 mL of 2.5 mM oxidized glutathione (GSSG), 0.025 mL of 2 mM β-NADPH, and H2O in a total volume of 1 mL at 25 °C and detected at 340 nm. The reaction blank for the oxidation of NADPH was performed in the absence of GSSG. After subtracting the reaction blank, a decrease in absorbance at 340 nm was used to estimate activity using an extinction coefficient of 6.22 mM−1·cm−1.

2.4. Determination of GSH and GSSG

The total glutathione, glutathione (GSH), and GSSG contents were determined according to the method of Lin et al. (2016) [28], with minor modifications. After centrifugation of 5 mL algal culture at 4000× g, the algal cells were collected and subjected to 0.25 mL of extraction solution (2.5% trichloroacetic acid (TCA) and 2.5% meta-phosphoric acid (MPA)). After fixation in liquid nitrogen and three freeze (−80 °C)–thaw (25 °C) cycles, the sample was subjected to sonication for further extraction. The extract was centrifuged at 12,000× g for 10 min at 4 °C, and the supernatant was used to determine glutathione, GSH, and GSSG within 4 h. A volume of 38.7 μL of 1.25 M K2CO3 was added to 0.3 mL of TCA/MPA extract to adjust the pH to 7.0 and centrifuged at 12,000× g for 1 min at 4 °C to collect the supernatant. For the determination of total glutathione, 0.1 mL of supernatant was added to the reaction mixture (0.5 mL of 200 mM K2HPO4/KH2PO4 buffer (pH 7.5), 0.1 mL of 50 mM Na2EDTA, 0.1 mL of 2 mM β-NADPH, 0.1 mL of 6 mM dithionitrobenzoic acid, and 0.1 mL of 0.5 unit/mL glutathione reductase (Sigma-Aldrich, St. Louis, MO, USA)), and the reaction was measured at 412 nm for 3 min at 25 °C. After the removal of reduced GSH by adding 2 μL of 1 M 2-vinylpyridine and 0.01 mL of 2 M freshly prepared triethanolamine in 0.1 mL of supernatant and incubation at 25 °C for 1 h, the GSSG contents were determined as described above. A standard curve was prepared with different concentrations of GSSG (0–5 nmol). The reduced GSH contents were calculated by subtracting the GSSG content from the total glutathione content.

2.5. RNA Isolation, cDNA Synthesis and mRNA Quantification via Real-Time Quantitative PCR

Algal cells were harvested from 10 mL aliquots of the algal cultures via centrifugation, as described in the above for RNA isolation. Total RNA was extracted using the TriPure Isolation Reagent (Roche Applied Science, Mannheim, Germany) according to the manufacturer’s instructions. The integrity of the RNA was checked via visual inspection of the 18S and 28S ribosomal RNAs following 1% agarose (MDBio Inc., Taipei, Taiwan) gel electrophoresis and ethidium bromide staining. The concentration of the RNA sample was adjusted to 2.95 μg total RNA/μL. After treatment with DNase (TURBO DNA-freeTM Kit, Thermo Fisher Scientific Inc., Waltham, MA, USA) to remove residual DNA, 1.5 μg of total RNA was used for the preparation of cDNA. cDNA was amplified from the poly-(A+) end using Oligo (dT)12–18 with the VersoTM cDNA Kit (Thermo Fisher Scientific Inc., Waltham, MA, USA), and the volume was adjusted to a concentration of 30 ng/mL based on the original RNA quantity in each sample. The primers for the targeted genes are listed in Table A1. The primers were designed using LightCycler Probe Design2 (Roche Applied Science, Mannheim, Germany). The real-time quantitative PCR was performed using the LightCycler 480 system (Roche Applied Science, Mannheim, Germany). A PCR master mix was prepared with the LightCycler 480 SYBR Green I Master Kit (Roche Applied Science, Mannheim, Germany). To optimize the primer concentration, real-time PCR analyses using different primer concentrations and a constant template cDNA concentration of 30 ng or 50 ng were performed separately. To optimize the cDNA template concentration, each pair of primers was tested across several log dilution series of a positive control DNA sample. After optimization of real-time PCR conditions, a primer concentration of 3 μM and a cDNA template concentration of 30 ng/μL were used for the detection of transcript levels. Each reaction was performed in a total volume of 10 μL, containing 1 μL LightCycler 480 SYBR Green I Master Mix, the selected concentration of each primer, and cDNA corresponding to 30 or 50 ng/μL RNA in the reverse transcriptase reaction. The amplification program consisted of an initial denaturation at 95 °C for 5 min, followed by 50 amplification cycles including annealing at 60 °C for 10 s, elongation at 72 °C for 5 s, real-time fluorescence measurements, and finally, denaturation at 95 °C for 15 s. Dissociation curves were obtained after PCR, and the fluorescence was analyzed using the LightCycler 480 system. Software including an auto CT (cycle threshold) was used to determine the threshold for each gene, and the 2−∆∆CT method was used to calculate CT values, in which the relative change in mRNA level was normalized to a reference gene (UBC (NCBI: AY062935) and the fold increase was calculated relative to the control RNA sample without chemical treatment at 0 min. All results are presented as the averages of three replicates.

2.6. Statistics

Three independent biological replicates were performed with a beaker as a replicate. All experiments were repeated at least three times and because they showed a similar trend; only the results for one of them are shown in this paper. Statistical analyses were performed using SPSS (SPSS 15.0 for Windows Evaluation Version). Significant differences between sample means were analyzed using Student’s t-test or Scheffe’s post hoc test following significant analysis of variance results for the controls and treatments at p < 0.05.

3. Results

3.1. Survival under Sub-Lethal NO Treatment

The level of NO generated from 0.1 mM SNAP was detected by a spectrophotometer using a cell permeable NO-sensitive fluorescent dye DAF-FM diacetate [29]. The DAF-FM diacetate was loaded into the medium prior to SNAP treatment to detect the cumulative NO production. As shown in Figure 1A, the NO level increased rapidly 0.5 h after SNAP treatment and reached a plateau after 1 h. It shows that NO is emitted within 1 h. Next, the impact of NO on viability was examined. The application of 0.1 mM SNAP did not affect cell growth (Figure 1B). Apparently, the administration of 0.1 mM SNAP in the medium triggers NO burst within 1 h without having an impact on the growth ability of Chlamydomonas cells.

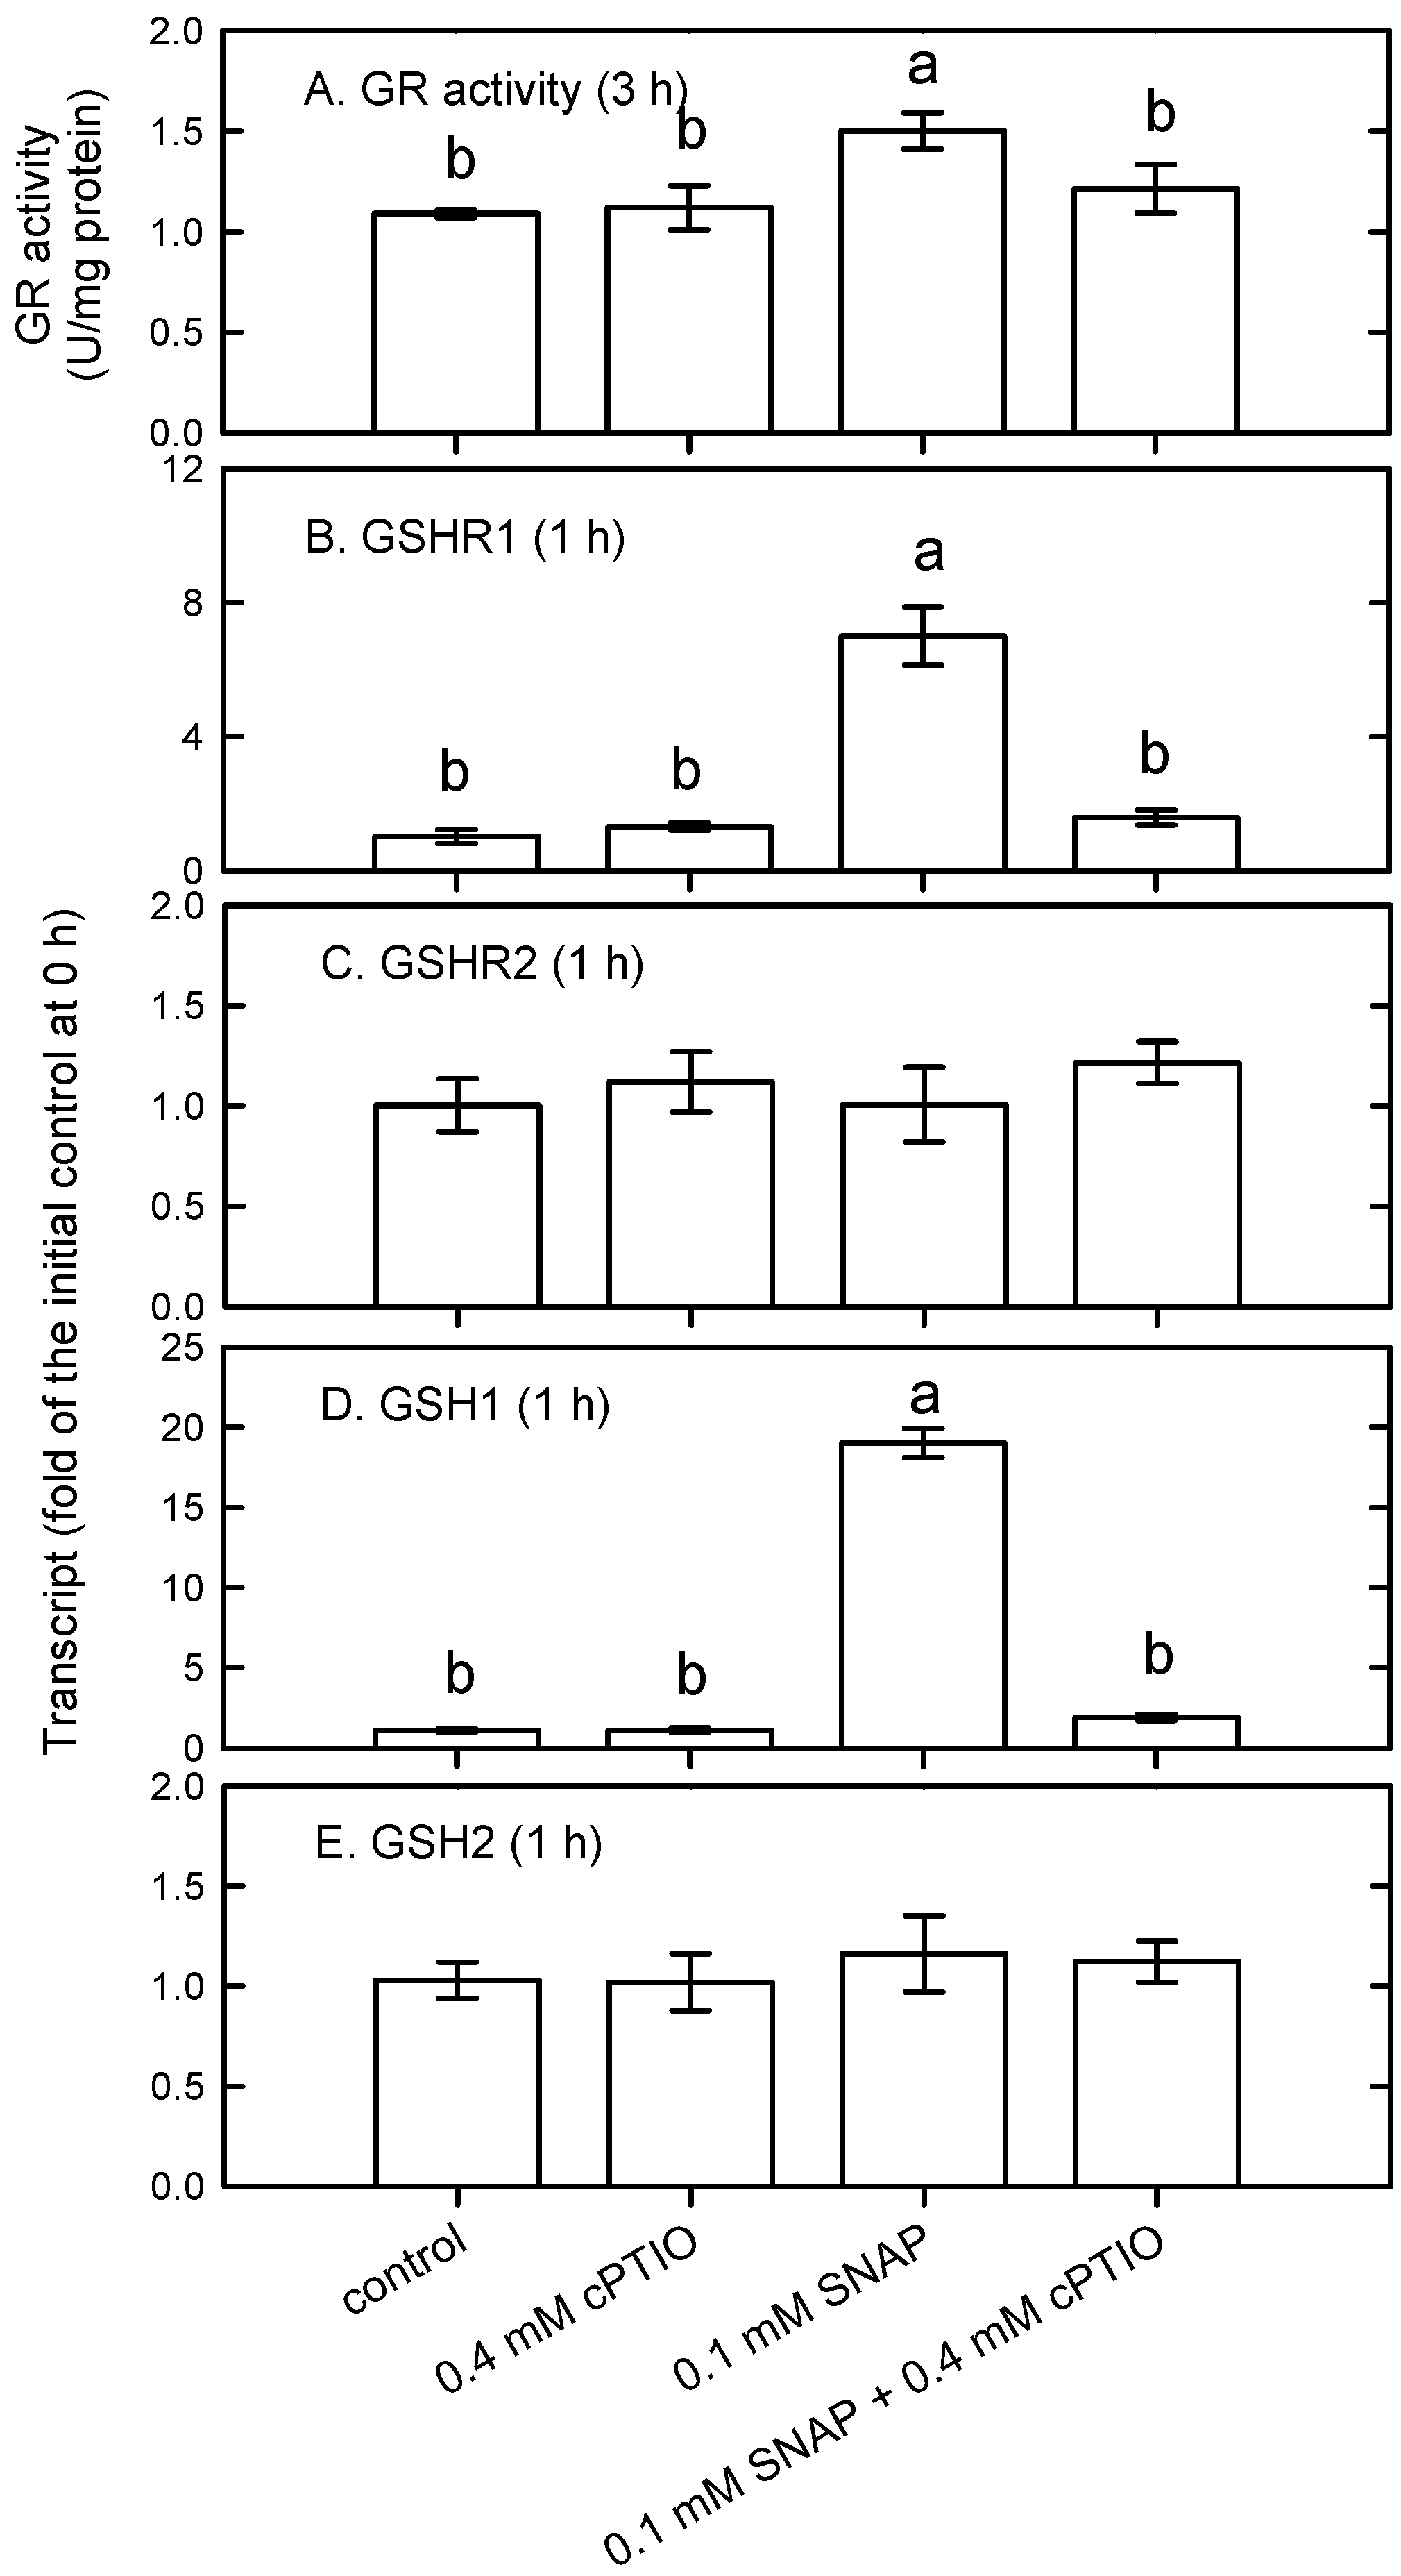
3.2. Modulation of Glutathione Availability and Redox State by NO

The treatment of 0.1 mM SNAP for 3 h induced an increase in total glutathione (total GSH, Figure 2A), GSH (Figure 2B), and GSSG (Figure 2C) concentrations while the GSH/GSSG ratio remained unchanged (Figure 2D). The changes in total GSH, GSH, and GSSG concentrations by SNAP treatment were suppressed in the presence of cPTIO (Figure 2). The activity of GR (Figure 3A) and the transcript abundances of GSHR1 (Figure 3B) and GSH1 (Figure 3D) were increased by SNAP treatment, while GSHR2 (Figure 3C) and GSH2 (Figure 3E) transcript abundances were not affected. The induction of GR activity and GSHR1 and GSH1 transcript abundances by SNAP was inhibited in the presence of cPTIO. Current data imply that GSH homeostasis and redox signaling are modulated for the regulation of acclimation machinery in C. reinhardtiit aganist NO stress.

3.3. Negative Regulation of UPR by NO

SNAP treatment differentially modulated the expression of the genes encoding proteins involved in the UPR. There was an increase in the transcript abundances of the genes encoding inositol-requiring enzyme 1 (IRE1, Cre08.g371052.t1.1) (Figure 4A) and disulfide-forming protein, endoplasmic reticulum oxidoreductin 1 (ERO1, Cre17.g723150.t1.1) (Figure 4F) but a decrease in the transcript abundances of ER-resident molecular chaperone BiP1 (binding protein) (Cre17.g729900.t1.2) (Figure 4B), chaperone Calreticulin 2 (CAL2, Cre02.g112250.t1.2) (Figure 4C), membrane-trafficking protein Sar-type small GTPase 1 (SAR1, Cre11.g468300.t1.2) (Figure 4D), protein transport protein Sec61 gamma (SEC61G, Cre16.g680230.t1.1) (Figure 4E) subunit, and protein disulfide isomerase (PDI6, Cre12.g518200.t1.1) (Figure 4G) in response to SNAP treatment, while that of protein disulfide isomerase, RB60 (Cre02.g088200.t1.2), was not affected (Figure 4H).

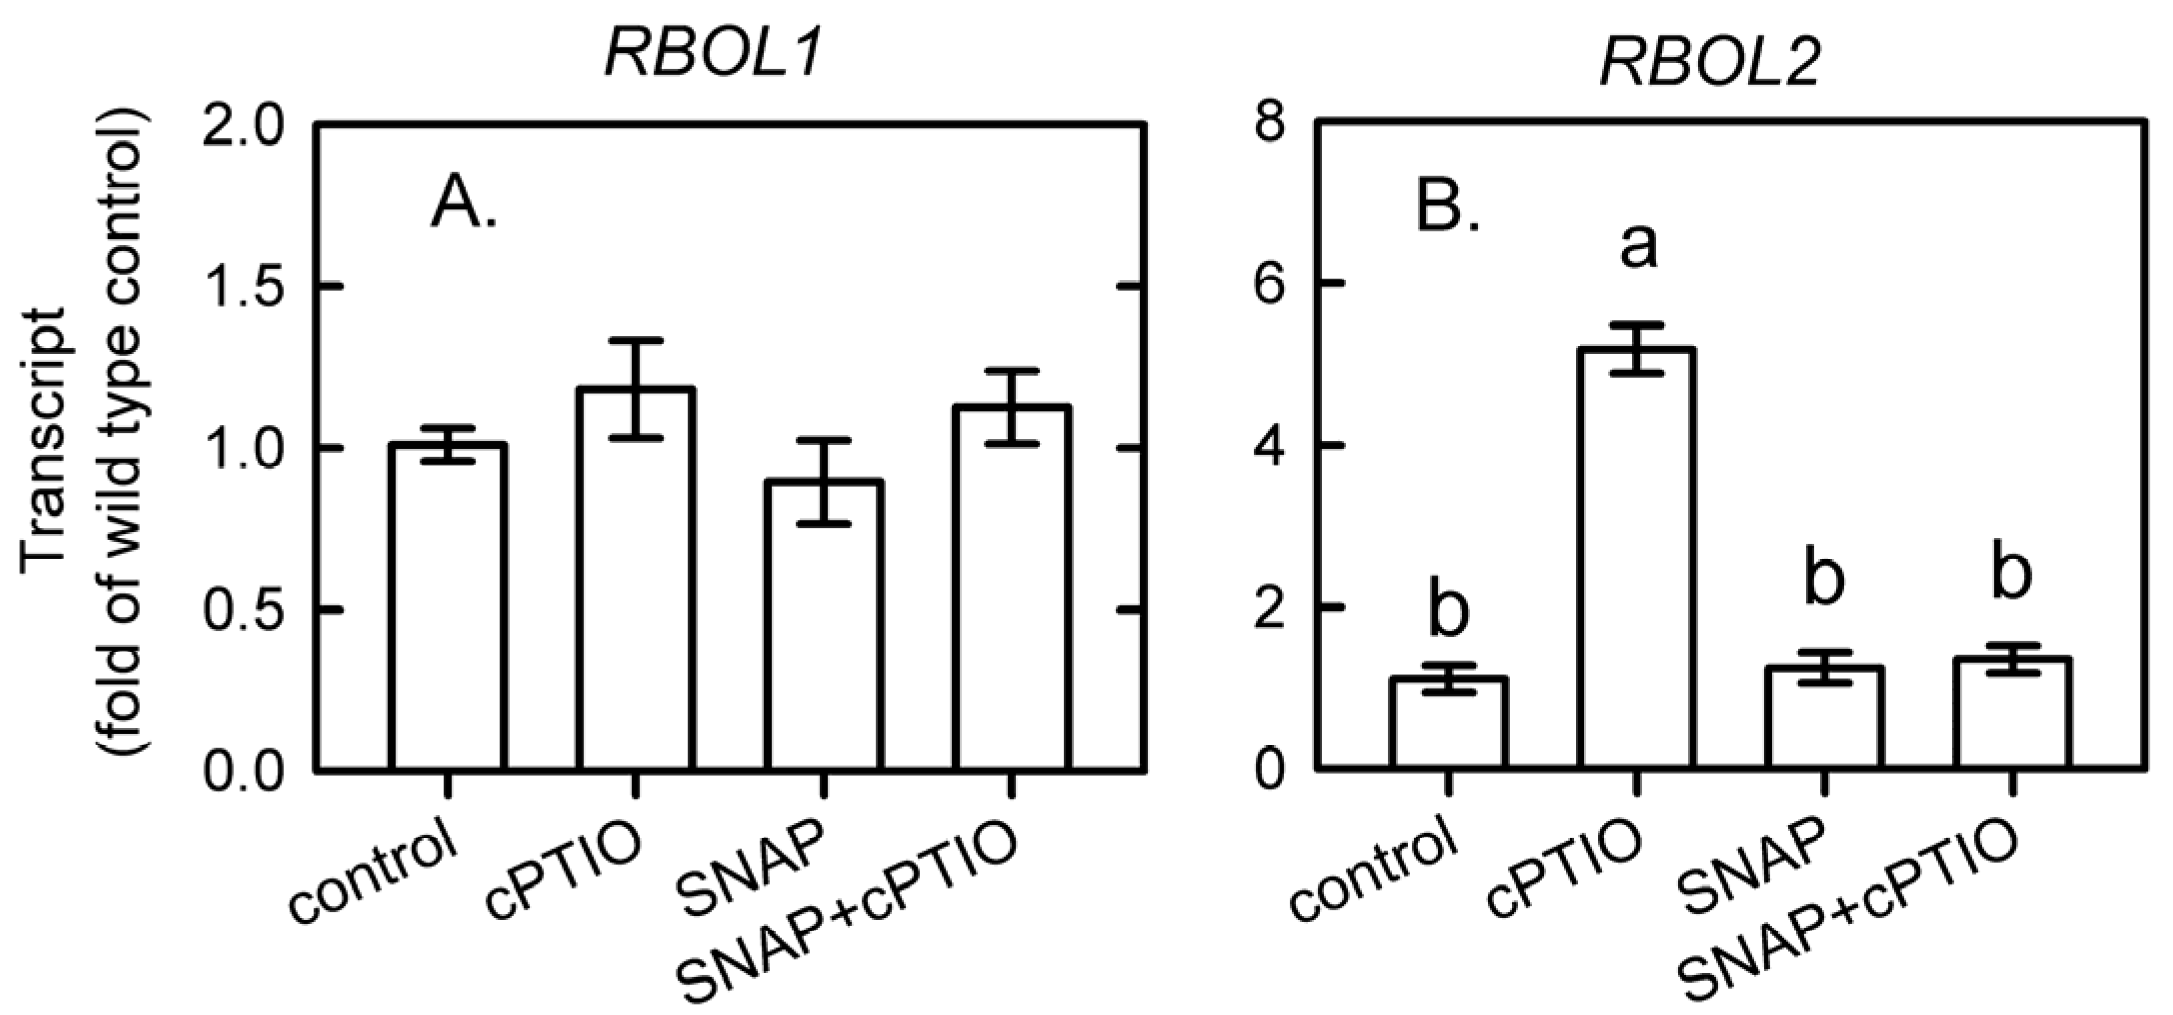
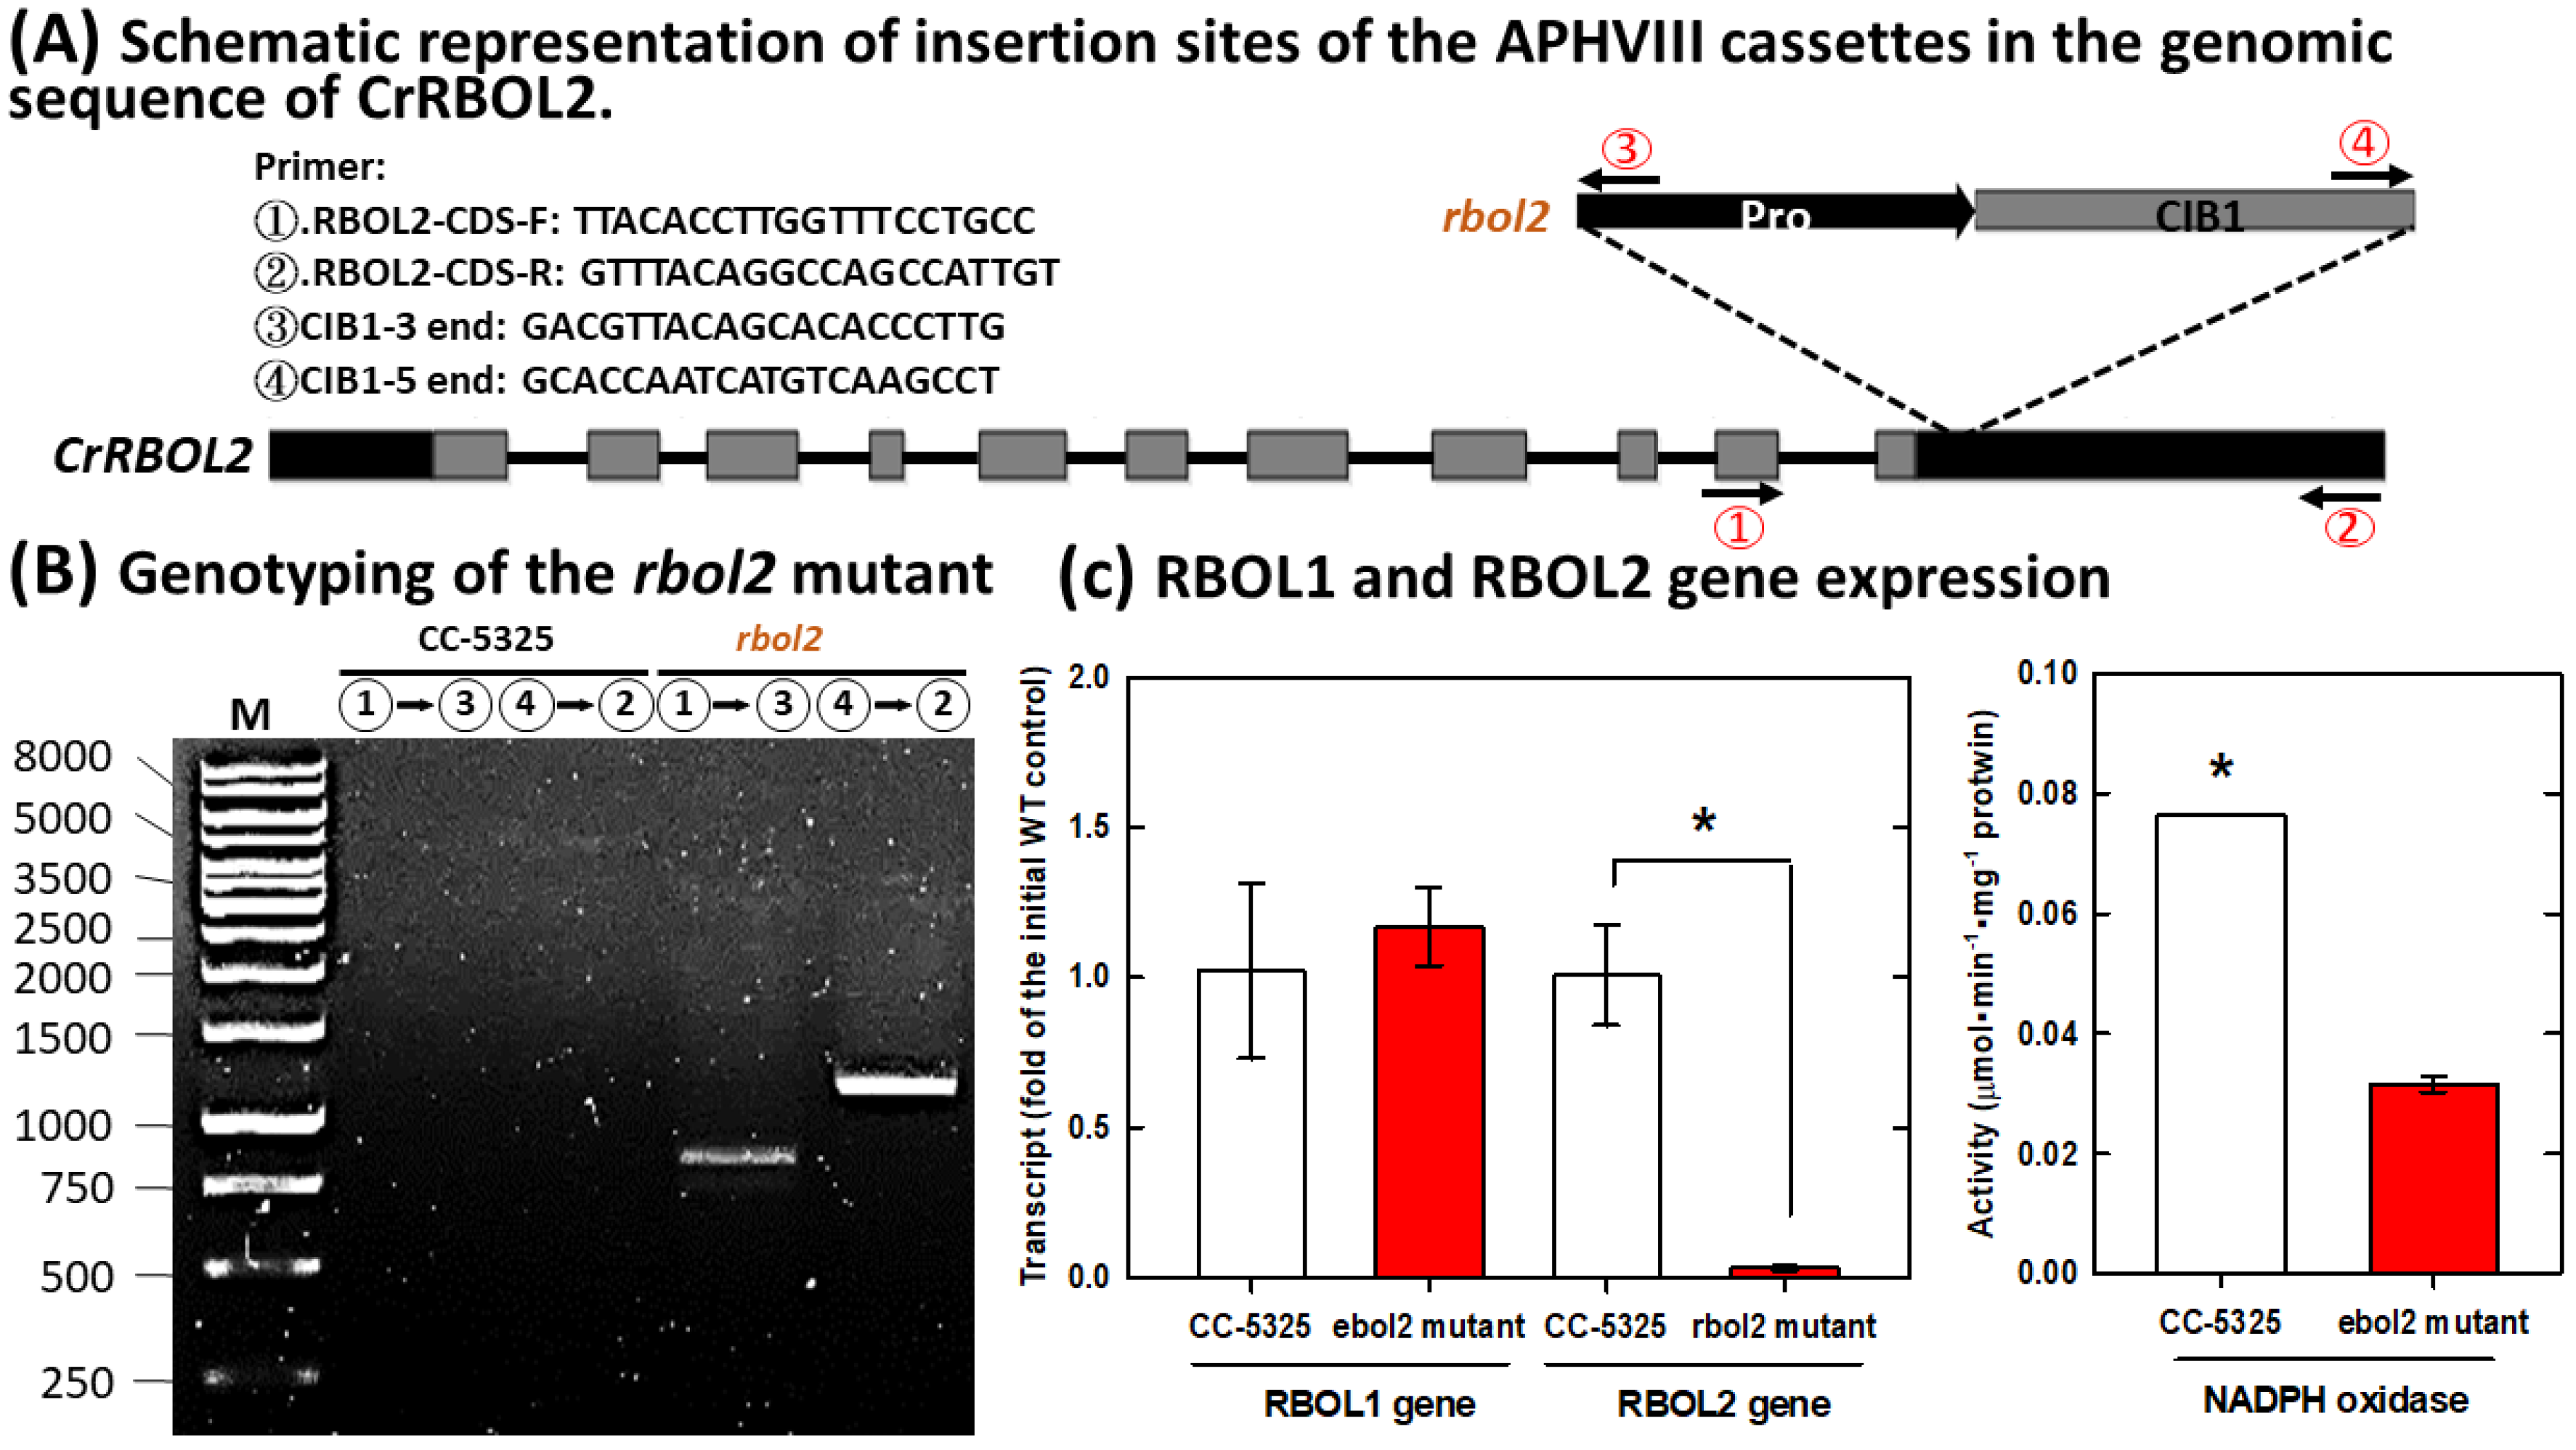
3.4. Involvement of NADPH Oxidase in the NO Modulation of Glutathione and UPR

To explore the possible involvement of NADPH oxidase in the regulation of UPR as well as the glutathione state, the transcript abundances of the gene encoding NADPH oxidase, respiratory burst oxidase-like 1 (RBOL1, Cre03.g188300.t1.1) and RBOL2 (Cre03.g188400.t1.1) were assayed. As shown in Figure 5, RBOL1 expression was not affected (Figure 5A) while RBOL2 expression increased significantly (Figure 5B). It raises the possibility that RBOL2 rather than RBOL1 plays a role in NO-mediated inhibition of UPR and enhancement of glutathione availability. Therefore, the rbol2 mutant with a decrease in RBOL2 expression and NADPH oxidase activity (Figure 6) was used.
As compared to wild type (WT), an exposure to SNAP did not induce an increase in the transcript abundance of GSHR1 (Figure 7A) and GSH1 (Figure 7B). The transcript abundance of IRE1 (Figure 7C), BiP1 (Figure 7D), CAL2 (Figure 7E), SAR1 (Figure 7F), SEC61G (Figure 7G), ERO1 (Figure 7H), PDI6 (Figure 7I), and RB60 (Figure 7J) increased in rbol2 mutant, in which the increase in IRE1, SAR1, SEC61G and ERO1 transcript abundances can be enhanced upon exposure to SNAP while increased transcript abundances of BiP1, CAL2, PDI6, and RB60 did not show a further increment.

4. Discussion

NO is a cellular messenger that mediates diverse signaling pathways and plays a role in many physiological processes in plants [30,31,32]. In Chlamydomonas, NO is also considered as an essential factor in the regulation of several physiological responses [11,12,13,15,16,33,34,35]. To examine the impact of NO on physiological responses and metabolic alterations without the interference of other factors, a NO donor, SNAP, is exogenously applied to cell culture medium in the concentration of 0.1 mM in the present study. Using DAF-FM fluorescence, NO released fast from SNAP and reached a plateau after 1 h. Thus, the glutathione concentration and regeneration as well as the transcript abundances of the genes associated with glutathione and UPR were assayed in 1-h NO-treated Chlamydomonas cells.
The present data showed that NO can increase GSH availability through enhanced synthesis, reflected by an increase in GSH1 transcript abundance. Furthermore, glutathione regeneration can be also enhanced, as suggested by increased GR activity and GSHR1 transcript abundance. A drop in GSH redox state 1 h after NO treatment due to a decline in GSH concentration, followed by a fast recovery to the control level after 3 h. Evidence showed that although GSH synthesis was enhanced, reflected by the upregulation of GSH1 expression, GSH concentration still showed a decrease 1 h after NO treatment due to the use of GSH to scavenging ROS. It has been reported that the redox state of GSH, a major determinant of cellular redox homeostasis in plants [36], is associated with the regulation of high light stress tolerance [37] in C. reinhardtii. Further, the coordination of cellular processes with photosynthetic activity is under GSH redox regulation [38]. It demonstrates that the GSH redox state is modulated for the shift of metabolism in Chlamydomonas cells to acclimate NO burst.
The upregulation of CAL2, ERO1, Rb60, and PDI6 genes has been considered as the indicator for ER stress in Chlamydomonas [39]. A decrease in the expression of most proteins involved in UPR, including BiP1, CAL2, SAR1, SEC61A, SEC61B, SEC61G, and PDI6, which functions in the restoration of normal protein metabolism in response to ER stress [40], implies that Chlamydomonas cells acclimate to NO burst without induction of ER stress. The UPS machinery, an important mechanism for the degradation of misfolded, damaged, or unneeded proteins for the maintenance of normal growth, is involved in the regulation of diverse biological processes, such as cell differentiation, stress responses, cell cycle control, regulation of transcription, and programmed cell death [40,41,42]. However, the expression of IRE1 and ERO1 was increased by 1-h NO treatment. As IRE1 has been identified as a factor for the survival of Chlamydomonas to ER stress caused as tunicamycin [20], it reflects that the upregulation of IRE1 is required for Chlamydomonas in the acclimation to NO burst without impact on cell growth. Moreover, ERO1 responsible for the generation of H2O2 can be induced by ER stress in Chlamydomonas [43]. Our present finding suggests that the upregulation of ERO1 represents increased H2O2 production under NO burst.
An upregulation of NADPH oxidase gene, RBOL2 instead of RBOL1, suggests a role of RBOL2 in Chlamydomonas cells against NO burst. Evidence shows that NO modulates the transcription and enzyme activity of NADPH oxidase in higher plants [44]. Using rbol2 mutant, we find that the RBOL2-dependent and -independent pathways are operating in Chlamydomonas cells under NO burst. The NO-induced GSHR1 and GSH1 expression is mediated through RBOL2 for the modulation of GSH redox state. The upregulation of RBOL2 expression for inhibiting ER stress is reflected by an increase in IRE1, SAR1, SEC61G, ERO1, BiP1, CAL2, and PDI6 in rbol2 mutant. A further enhancement of IRE1, SAR1, SEC61G, and ERO1 expression in rbol2 mutant when exposed to NO suggest that other pathways besides RBOL2 may play a role in the sense of NO in the regulation of several UPR genes. However, the expression of BiP1, CAL2, and PDI6 is under RBOL2 control.

5. Conclusions

NO as a signal in the modulation of acclamatory responses to stress triggers a change in glutathione availability and regeneration for the modulation of cellular redox state in the activation of acclimation process in Chlamydomonas. The ER stress can be prevented in Chlamydomonas cells in response to sub-lethal NO challenge reflected by a suppression of most UPR genes. The upregulation of GSHR1 and GSH1 as well as the UPR gene is mediated through RBOL2, and other pathways are involved in the regulation of several UPR genes. In conclusion, NADPH oxidase (RBOL2)-dependent and -independent signaling pathways involve in the inhibition of UPR and the enhancement of GSH availability by NO.

Supplementary Materials

The poster presentation is available online at https://www.mdpi.com/article/10.3390/IECPS2020-08609/s1.

Author Contributions

E.Y.K., W.-C.D. and Y.-L.C. performed the physiological analysis, RNA extraction, cDNA preparation, and qPCR. M.J.-H.H. contributed the preparation of reagents and the determination of biochemical and physiological parameters. T.-M.L. conceived and designed the experiments, interpreted the data, and wrote the paper. All authors have read and agreed to the published version of the manuscript.

Acknowledgments

This work was supported by the Ministry of Science Technology, Executive Yuan, Taiwan (Grant Number: MOST 103-2311-B-110-001MY3, MOST 107-2311-B-110-003-MY3, MOST 119-2311-B-110-003) to Tse-Min Lee.

Conflicts of Interest

The authors declare that they have no conflict of interest.

Abbreviations

BiP1ER-resident molecular chaperone
CAL2chaperone Calreticulin 2
cPTIO2-(4-carboxyphenyl)-4,4,5,5-tetramethylimidazoline-l-oxyl-3-oxide
ERO1disulfide-forming protein, endoplasmic reticulum oxidoreductin 1
GSNOS-nitrosoglutathione
IRE1inositol-requiring enzyme 1
NOnitric oxide
SNAPS-nitroso-N-acetylpenicillamine
SAR1membrane-trafficking protein Sar-type small GTPase 1
SEC61Gprotein transport protein Sec61 gamma

Appendix A

Table A1. Primers for the genes and internal control genes (CrUBC, CrEF-1α) used for real-time PCR analysis.
GeneForward Primer Sequence (5′ → 3′)Reverse Primer Sequence (5′ → 3′)
UBCCATTAGAGGCGGGCAAATATCGTCATCGTGGTTGTGTAT
GSH1ACCACCTACCACCATCTTCGTATATGAGCCCCACCCACA
GSH2CATATATTGCAGTACATACGTGGGCACCTACTCACCTACTGTCA
GSHR1>GCCATCAAGGTGGATGAGTTATAGTCGGGCTTGGTCAGC
GSHR2TCCTTTCGAGGGAGAGCGTCATTCTATACACGCCTTCCTA
IRE1CTTGGCAGTTTGCCAGTACAAGTCCAGGTAGGACCCGAGT
BiP1AGTGAGCCCGTCTTTTAGAACTTTCTCCTCTGTACCACCGTTTTTA
CAL2ACCCTGACTACGTCCACGACGTCCTCAGCGAACTTCTTGG
SAR1CGAGGAGATTCAATTGGGCGCGGTGGGAATGTCGATCTTG
SEC61GGTCAAGCCTGTGAAGGATTTTGGGAATGAAGAGGAGCTTCACAAAG
PDI6GGTGTGGCTGGTTGAGTTCTCTCTTTGGCGTCCTCACAGT
ERO1TGTCAACCTGCTCATCAACCCTGCTGCTGCTACTGCTGTC
RB60CCAAGCGCTTTAAGAAGGTGGTAGGGAAGCCCTTGACCTC
RBOL1CGATCAAGGGAGCCGAAGCTATTTGCAGGTGCACTCA
RBOL2GCTTTCACATTGCCACGATACCTCCAGATGTACCTCCCTA

References

  1. Durner, J.; Gow, A.J.; Stamler, J.S.; Glazebrook, J. Ancient origins of nitric oxide signaling in biological systems. Proc. Natl. Acad. Sci. USA 1999, 96, 14206–14207. [Google Scholar] [CrossRef] [Green Version]
  2. Uchida, A.; Jagendorf, A.T.; Hibino, T.; Takabe, T.; Takabe, T. Effects of hydrogen peroxide and nitric oxide on both salt and heat stress tolerance in rice. Plant Sci. 2002, 163, 515–523. [Google Scholar] [CrossRef]
  3. Qiao, W.; Fan, L.-M. Nitric oxide signaling in plant responses to abiotic stresses. J. Integr. Plant Biol. 2008, 50, 1238–1246. [Google Scholar] [CrossRef]
  4. Yang, L.; Tian, D.; Todd, C.D.; Luo, Y.; Hu, X. Comparative proteome analyses reveal that nitric oxide is an important signal molecule in the response of rice to aluminum toxicity. J. Proteome Res. 2013, 12, 1316–1330. [Google Scholar] [CrossRef]
  5. Clark, D.; Durner, J.; Navarre, D.A.; Klessig, D.F. Nitric oxide inhibition of tobacco catalase and ascorbate peroxidase. Mol. Plant Microbe Interact. 2002, 13, 1380–1384. [Google Scholar] [CrossRef] [Green Version]
  6. Murgia, I.; De Pinto, M.C.; Delledonne, M.; Soave, C.; De Gara, L. Comparative effects of various nitric oxide donors on ferritin regulation, programmed cell death, and cell redox state in plant cells. J. Plant Physiol. 2004, 161, 777–783. [Google Scholar] [CrossRef]
  7. Arasimowicz-Jelonek, M.; FloryszakWieczorek, J.; Kosmala, A. Are nitric oxide donors a valuable tool to study the functional role of nitric oxide in plant metabolism. Plant Biol. 2011, 13, 747–756. [Google Scholar] [CrossRef] [PubMed]
  8. Martí, M.C.; Florez-Sarasa, I.; Camejo, D.; Pallol, B.; Ortiz, A.; Ribas-Carbó, M.; Jiménez, A.; Sevilla, F. Response of mitochondrial antioxidant system and respiratory pathways to reactive nitrogen species in pea leaves. Physiol. Plant. 2013, 147, 194–206. [Google Scholar] [CrossRef] [PubMed]
  9. Rochaix, J. Chlamydomonas Reinhardtii as the photosynthetic yeast. Annu. Rev. Genet. 1995, 29, 209–230. [Google Scholar] [CrossRef] [PubMed]
  10. de Montaigu, A.; Sanz-Luque, E.; Galván, A.; Fernández, E. A soluble guanylate cyclase mediates negative signaling by ammonium on expression of nitrate reductase in Chlamydomonas. Plant Cell 2010, 22, 1532–1548. [Google Scholar] [CrossRef] [PubMed] [Green Version]
  11. Sanz-Luque, E.; Ocaña-Calahorro, F.; Llamas, A.; Galvan, A.; Fernandez, E. Nitric oxide controls nitrate and ammonium assimilation in Chlamydomonas reinhardtii. J. Exp. Bot. 2013, 64, 3373–3383. [Google Scholar] [CrossRef] [PubMed] [Green Version]
  12. Calatrava, V.; Chamizo-Ampudia, A.; Sanz-Luque, E.; Ocaña-Calahorro, F.; Llamas, A.; Fernandez, E.; Galvan, A. How Chlamydomonas handles nitrate and the nitric oxide cycle. J. Exp. Bot. 2017, 68, 2593–2602. [Google Scholar] [CrossRef] [Green Version]
  13. Yordanova, Z.P.; Iakimova, E.T.; Cristescu, S.M.; Harren, F.J.; Kapchina-Toteva, V.M.; Woltering, E.J. Involvement of ethylene and nitric oxide in cell death in mastoparan-treated unicellular alga Chlamydomonas reinhardtii. Cell Biol. Int. 2010, 34, 301–308. [Google Scholar] [CrossRef] [PubMed] [Green Version]
  14. Chang, H.L.; Hsu, Y.T.; Kang, C.Y.; Lee, T.M. Nitric oxide down-regulation of carotenoid synthesis and PSII activity in relation to very high light-induced singlet oxygen production and oxidative stress in Chlamydomonas reinhardtii. Plant Cell Physiol. 2013, 54, 1296–1315. [Google Scholar] [CrossRef] [PubMed] [Green Version]
  15. Kuo, E.Y.H.; Chang, H.L.; Lin, S.T.; Lee, T.M. High light-induced nitric oxide production induces autophagy and cell death in Chlamydomonas reinhardtii. Front. Plant Sci. 2020, 11, 772. [Google Scholar] [CrossRef] [PubMed]
  16. Zhang, L.P.; Mehta, S.K.; Liu, Z.P.; Yang, Z.M. Copper-induced proline synthesis is associated with nitric oxide generation in Chlamydomonas reinhardtii. Plant Cell Physiol. 2008, 49, 411–419. [Google Scholar] [CrossRef]
  17. Zalutskaya, Z.; Ostroukhova, M.; Filina, V.; Ermilova, E. Nitric oxide upregulates expression of alternative oxidase 1 in Chlamydomonas reinhardtii. J. Plant Physiol. 2017, 219, 123–127. [Google Scholar] [CrossRef]
  18. Vitale, A.; Ceriotti, A.; Denecke, J. The role of the endoplasmic reticulum in protein synthesis, modification and intracellular transport. J. Exp. Bot. 1993, 44, 1417–1444. [Google Scholar] [CrossRef]
  19. Hetz, C.; Papa, F.R. The unfolded protein response and cell fate control. Mol. Cell 2018, 69, 169–181. [Google Scholar] [CrossRef] [Green Version]
  20. Yamaoka, Y.; Choi, B.Y.; Kim, H.; Shin, S.; Kim, Y.; Jang, S.; Song, W.Y.; Cho, C.H.; Yoon, H.S.; Kohno, K.; et al. Identification and functional study of the endoplasmic reticulum stress sensor IRE1 in Chlamydomonas reinhardtii. Plant J. 2018, 94, 91–104. [Google Scholar] [CrossRef] [Green Version]
  21. Yamaoka, Y.; Shin, S.; Choi, B.Y.; Kim, H.; Jang, S.; Kajikawa, M.; Yamano, T.; Kong, F.; Légeret, B.; Fukuzawa, H.; et al. The bZIP1 transcription factor regulates lipid remodeling and contributes to ER stress management in Chlamydomonas reinhardtii. Plant Cell 2019, 31, 1127–1140. [Google Scholar] [CrossRef] [PubMed] [Green Version]
  22. Oyadomari, S.; Takeda, K.; Takiguchi, M.; Gotoh, T.; Matsumoto, M.; Wada, I.; Mori, M. Nitric oxide-induced apoptosis in pancreatic β cells is mediated by the endoplasmic reticulum stress pathway. Proc. Natl. Acad. Sci. USA 2001, 98, 10845–10850. [Google Scholar] [CrossRef] [Green Version]
  23. Uehara, T. Accumulation of misfolded protein through nitrosative stress linked to neurodegenerative disorders. Antioxid. Redox Signal. 2007, 9, 597–601. [Google Scholar] [CrossRef] [PubMed]
  24. Guo, W.; Jiang, T.; Lian, C.; Wang, H.; Zheng, Q.; Ma, H. QKI deficiency promotes FoxO1 mediated nitrosative stress and endoplasmic reticulum stress contributing to increased vulnerability to ischemic injury in diabetic heart. J. Mol. Cell. Cardiol. 2014, 75, 131–140. [Google Scholar] [CrossRef] [Green Version]
  25. Ozgur, R.; Uzilday, B.; Iwata, Y.; Koizumi, N.; Turkan, I. Interplay between the unfolded protein response and reactive oxygen species: A dynamic duo. J. Exp. Bot. 2018, 69, 3333–3345. [Google Scholar] [CrossRef] [PubMed] [Green Version]
  26. Angelos, E.; Brandizzi, F. NADPH Oxidase activity is required for ER stress survival in plants. Plant J. 2018, 96, 1106–1120. [Google Scholar] [CrossRef] [PubMed] [Green Version]
  27. Harris, E.H. The Chlamydomonas Sourcebook: A Comprehensive Guide to Biology and Laboratory Use; Academic Press: San Diego, CA, USA, 1989. [Google Scholar]
  28. Kojima, H.; Nakatsubo, N.; Kikuchi, K.; Kawahara, S.; Kirino, Y.; Nagoshi, H.; Hirata, Y.; Nagano, T. Detection and imaging of nitric oxide with novel fluorescent indicators: Diaminofluoresceins. Anal. Chem. 1998, 70, 2446–2453. [Google Scholar] [CrossRef] [PubMed]
  29. Mur, L.A.J.; Mandon, J.; Persijn, S.; Cristescu, S.M.; Moshkov, I.E.; Novikova, G.V.; Hall, M.A.; Harren, F.J.; Hebelstrup, K.H.; Gupta, K.J. Nitric oxide in plants: An assessment of the current state of knowledge. AoB Plants 2013, 5, pls052. [Google Scholar] [CrossRef]
  30. Hsu, Y.T.; Lee, T.M. Nitric oxide up-regulates the expression of methionine sulfoxide reductase genes in the intertidal macroalga Ulva fasciata for high light acclimation. Plant Cell Physiol. 2012, 53, 445–456. [Google Scholar] [CrossRef] [PubMed] [Green Version]
  31. Lamattina, L.; Polacco, J.C. Nitric Oxide in Plant Growth, Development and Stress Physiology; Springer: Berlin/Heidelberg, Germany, 2007. [Google Scholar]
  32. Besson-Bard, A.; Pugin, A.; Wendehenne, D. New insights into nitric oxide signaling in plants. Annu. Rev. Plant Biol. 2008, 59, 21–39. [Google Scholar] [CrossRef]
  33. Chen, X.; Tian, D.; Kong, X.; Chen, Q.; Allah, E.F.A.; Hu, X.; Jia, A. The role of nitric oxide signalling in response to salt stress in Chlamydomonas reinhardtii. Planta 2016, 244, 651–669. [Google Scholar] [CrossRef]
  34. de Mia, M.; Lemaire, S.D.; Choquet, Y.; Wollmana, F. Nitric oxide remodels the photosynthetic apparatus upon S- starvation in Chlamydomonas reinhardtii. Plant Physiol. 2019, 179, 718–731. [Google Scholar] [CrossRef] [Green Version]
  35. Wei, L.; Derrien, B.; Gautier, A.; Houille-Vernes, L.; Boulouis, A.; Saint-Marcoux, D.; Malnoë, A.; Rappaport, F.; de Vitry, C.; Vallon, O.; et al. Nitric oxide-triggered remodeling of chloroplast bioenergetics and thylakoid proteins upon nitrogen starvation in Chlamydomonas reinhardtii. Plant Cell 2014, 26, 353–372. [Google Scholar] [CrossRef] [PubMed] [Green Version]
  36. Foyer, C.H.; Noctor, G. Ascorbate and glutathione: The heart of the redox hub. Plant Physiol. 2011, 155, 2–18. [Google Scholar] [CrossRef] [Green Version]
  37. Lin, T.H.; Rao, M.Y.; Lu, H.W.; Chiou, C.W.; Lin, S.T.; Chao, H.W.; Zheng, Z.L.; Chen, H.C.; Lee, T.M. A role for glutathione reductase and glutathione in the tolerance of Chlamydomonas reinhardtii to photo-oxidative stress. Physiol. Plant 2018, 16, 35–48. [Google Scholar] [CrossRef] [PubMed]
  38. Pérez-Martín, M.; Pérez-Pérez, M.E.; Lemaire, S.D.; Crespo, J.L. Oxidative stress contributes to autophagy induction in response to endoplasmic reticulum stress in Chlamydomonas reinhardtii. Plant Physiol. 2014, 166, 997–1008. [Google Scholar] [CrossRef] [PubMed] [Green Version]
  39. Foyer, C.H.; Noctor, G. Redox regulation in photosynthetic organisms: Signaling, acclimation, and practical implications. Antioxid. Redox Signal. 2009, 11, 861–905. [Google Scholar] [CrossRef]
  40. Ron, D.; Walter, P. Signal integration in the endoplasmic reticulum unfolded protein response. Nat. Rev. Mol. Cell Biol. 2007, 8, 519–529. [Google Scholar] [CrossRef]
  41. Hershko, A.; Ciechanover, A. The ubiquitin system. Annu. Rev. Biochem. 1998, 67, 425–479. [Google Scholar] [CrossRef]
  42. Meyer, H.H.; Wang, Y.; Warren, G. Direct binding of ubiquitin conjugates by the mammalian p97 adaptor complexes, p47 and UFD1-Np14. EMBO J. 2002, 21, 5645. [Google Scholar] [CrossRef]
  43. Taxis, C.; Hitt, R.; Park, S.H.; Deak, P.M.; Kostova, Z.; Wolf, D.H. Use of modular substrates demonstrates mechanistic diversity and reveals differences in chaperone requirement of ERAD. J. Biol. Chem. 2003, 278, 35903–35913. [Google Scholar] [CrossRef] [PubMed] [Green Version]
  44. Hu, C.H.; Wang, P.Q.; Zhang, P.P.; Nie, X.M.; Li, B.B.; Tai, L.; Liu, W.T.; Li, W.Q.; Chen, K.M. NADPH oxidases: The vital performers and center hubs during plant growth and signaling. Cells 2002, 9, 437. [Google Scholar] [CrossRef] [PubMed] [Green Version]
Figure 1. Cumulative NO production (A) and cell growth (B) in Chlmydomonas reinhardtii in response to 0.1 mM SNAP in the presence or absence of 0.4 mM cPTIO. The data are expressed as the mean ± SD (n = 3) from three independent biological replicates, and different letters indicate significant differences among the treatments (p < 0.05).
Blsf 04 00033 g001
Figure 2. Total glutathione (total GSH) (A), glutathione (GSH) (B), and oxidized glutathione (GSSG) (C) concentration and GSH/GSSG ratio (D) in Chlamydomonas reinhardtii in response to 0.1 mM SNAP in the presence or absence of 0.4 mM cPTIO. The data are expressed as the mean ± SD (n = 3) from three independent biological replicates, and different letters indicate significant differences among the treatments (p < 0.05).
Blsf 04 00033 g002
Figure 3. The activity of glutathione reductase (GR) (A) and the relative transcript abundance of GSHR1 (B), GSHR2 (C), GSH1 (D), and GSH2 (E) in Chalmydomonas reinhardtii in response to 0.1 mM SNAP in the presence or absence of 0.4 mM cPTIO. The data are expressed as the mean ± SD (n = 3) from three independent biological replicates, and different letters indicate significant differences among the treatments (p < 0.05).
Blsf 04 00033 g003
Figure 4. The relative transcript abundance of IRE1 (A), BIP1 (B), CAL2 (C), SAR1 (D), SEC61G (E), ERO1 (F), PDI6 (G), and RB60 (H) in Chlamydomonas reinhardtii in response to 0.1 mM SNAP in the presence or absence of 0.4 mM cPTIO. The data are expressed as the mean ± SD (n = 3) from three independent biological replicates, and different letters indicate significant differences among the treatments (p < 0.05).
Blsf 04 00033 g004
Figure 5. The relative transcript abundance of RBOL1 (A) and RBOL2 (B) in Chlamydomonas reinhardtii in response to 0.1 mM SNAP in the presence or absence of 0.4 mM cPTIO. The data are expressed as the mean ± SD (n = 3) from three independent biological replicates, and different letters indicate significant differences among the treatments (p < 0.05).
Blsf 04 00033 g005
Figure 6. Isolation of Chlamydomonas rbol2 mutants. (A) Schematic representation of insertion sites of the APHVIII cassettes in the genomic sequence of RBOL2. Tall boxes denote exons, gray boxes indicate protein coding regions and filled boxes show 5′ and 3′ untranslated regions (UTRs) and the promoter region. Arrows indicate primer locations used to detect APHVIII cassette insertions. (B) Genotyping of the rbol2 mutant. Genomic DNA fragments were amplified by PCR using the primer sets indicated in (A). (C) The rbol2 mutant showed low RBOL2 transcript abundance and NADPH oxidase activity but a normal RBOL1 expression as compared to CC-5325 wild type. The data are expressed as the mean ± SD (n = 3) from three independent biological replicates, and * indicates significant difference between CC-5325 and rbol2 mutant using a t-test (p < 0.05).
Blsf 04 00033 g006
Figure 7. The relative transcript abundance of GSHR1 (A), GSH1 (B), IRE1 (C), BIP1 (D), CAL2 (E), SAR1 (F), SEC61G (G), ERO1 (H), PDI6 (I), and RB60 (J) in Chlamydomonas reinhardtii CC-5325 wild type (WT) and rbol2 mutant in response to 0.1 mM SNAP. The data are expressed as the mean ± SD (n = 3) from three independent biological replicates, and different letters indicate significant differences among the treatments (p < 0.05).
Blsf 04 00033 g007
Publisher’s Note: MDPI stays neutral with regard to jurisdictional claims in published maps and institutional affiliations.

