Proceeding Paper

Synergizing Crop Growth Models and Digital Phenotyping: The Design of a Cost-Effective Internet of Things-Based Sensing Network †

by
Leandro Rodrigues
1,2,*,
Pedro Moura
2,
Francisco Terra
2,
Alexandre Magno Carvalho
2,3,
José Sarmento
2,4,
Filipe Neves dos Santos
2 and
Mário Cunha
1,2
1
Faculty of Sciences, University of Porto, Rua do Campo Alegre s/n, 4169-007 Porto, Portugal
2
INESC TEC-Institute for Systems and Computer Engineering, Technology and Science, Rua Dr. Roberto Frias s/n, 4200-465 Porto, Portugal
3
ISEP/IPP—School of Engineering, Polytechnic of Porto, 4249-015 Porto, Portugal
4
School of Science and Technology, University of Trás-os-Montes e Alto Douro (UTAD), 5000-801 Vila Real, Portugal
*
Author to whom correspondence should be addressed.
Presented at the 3rd International Electronic Conference on Agronomy, 15–30 October 2023; Available online: https://iecag2023.sciforum.net/.
Biol. Life Sci. Forum 2023, 27(1), 41; https://doi.org/10.3390/IECAG2023-16276
Published: 15 November 2023
(This article belongs to the Proceedings of The 3rd International Electronic Conference on Agronomy)

Abstract

:
Plant-soil sensing devices coupled with Artificial Intelligence autonomously collect and process in situ plant phenotypic data. A challenge of this approach is the limited incorporation of phenotype data into decision support systems designed to harness agricultural practices and forecast plant behavior within the intricate context of genotype, environment, and management interactions (G × E × M). To enhance the role of digital phenotyping in supporting Precision Agriculture, this paper proposes a sensing network based on the Internet of Things. The developed system comprises three modules: data collection, communication, and a cloud server. Several processes co-occur in the server, namely data visualization to confirm the correct sensors and data stream functioning. In addition, a crop growth model (CGM) runs on the server, which is powered by the collected data. The simulations generated by the model will support agricultural decisions, obtaining, in advance, insights about plant behavior considering several G × E × M scenarios. To assess the performance of the proposed network to provide reliable data to the model, a greenhouse was equipped with several sensors that collect plant, environment, and soil data (e.g., leaf numbers, air temperature, soil moisture). The proposed network can provide real-time causal support for advanced agricultural practices, evolving from a data-driven approach to an integrative framework where context (G × E × M) drives decision making.

1. Introduction

Precision Agriculture (PA) based on the continuous monitoring of plant growth is of paramount importance. It involves taking into consideration the profound impact that environmental conditions and agricultural management practices can exert on the performance of a specific genotype (G × E × M). This understanding forms the foundation for crafting robust decision support systems (DSSs) aimed at optimizing input applications and bolstering crop yields, profitability, and the environment [1]. Digital phenotyping (DP) is a cutting-edge application that combines advanced sensing devices (e.g., RGB/hyperspectral cameras) and data analysis techniques (e.g., Artificial Intelligence (AI)) to diagnose plant phenotypic traits (i.e., observable plant traits resulting from the performance of a genotype in a specific environment), namely morphological [2], physiological [3], and phenological [4] traits related to growth, health, and development [5]. Most of the literature describes high-throughput phenotyping facilities that analyze model plants in expansive laboratory conditions (e.g., [6]), while low-cost field applications are limited [7]. Nevertheless, DP data can be analyzed to identify trends and relations between phenotypes and G × E × M conditions, enabling more knowledgeable agronomic decisions.
Autonomous sensing systems such as robots and drones represent a great advancement in the realm of data collection for field phenotyping, offering remarkable improvements in terms of speed, repeatability, and accuracy [8]. However, beyond the technical challenges like localization and path planning, there exist critical constraints related to data management and analysis. Given the diverse array of phenotypic data sources and the complexity of the spatiotemporal scales involved, it becomes imperative to develop robust data management techniques that not only preserve data relevance but also facilitate easy access and analysis [6].
Therefore, the establishment of resilient sensing networks is paramount to comprehensively characterize prevailing environmental conditions and seamlessly link them to the collected phenotypic data. In this context, it is essential to accompany phenotypic data with metadata, thereby promoting their reuse and ensuring interoperability in contexts distinct from their original acquisition [9,10].
Regarding data analysis, although DP uses advanced AI techniques that establish genotype–phenotype relationships within G × E × M interactions [11,12], it has constraints depicting the dynamics of these relationships. Some progress has been made in combining DP and process-based models, optimizing data analysis through multi-scale frameworks. Process-based models (a group of crop growth models (CGMs)) simulate plant growth and predict crop yield through differential equations that consider the mechanistic understanding of how a plant grows [13]. In this way, fundamental processes and their interactions over time are represented (e.g., nutrient cycling, water fluxes). Thus, it is possible to assess the crop’s behavior in future climate and management scenarios, improving decision making [14,15].
A process-based model can extract relevant traits using knowledge in advance, simplifying the actual analysis systems (AI-based) [16,17,18]. Furthermore, DP can be integrated into a process-based model to estimate unknown parameters, replacing its subroutines and describing complex processes (e.g., nitrogen dynamics [19]).
Yet, few studies present joint approaches, barely integrating phenotype data in advanced DSSs [10]. To overcome this shortcoming, we propose a sensing network based on the Internet of Things (IoT). The network comprises three modules: data collection, communication, and data management/analysis. The aim is to test the feasibility of cost-effective sensors to collect high-throughput phenotypic and environmental data, establish methods that guarantee data relevance and interoperability, and integrate data into a CGM. Thus, a continuous swap of data will be created between the physical entities and the simulated ones. This digital twin [20] approach can provide real-time, spatiotemporal causal support for advanced PA practices, evolving from a data-driven approach to an integrative framework, where G × E × M conditions are the driver of advanced decision making.

2. Methods

Figure 1 describes the overall architecture of the proposed sensing network.
To allow the network to be versatile, given the diversity of data sources, it is proposed that a microprocessor be used to ensure uniform data transfer, regardless of the sensor’s intrinsic communication protocol. In order to ensure robust spatiotemporal communication that can be transferred to an agricultural environment, the connection between sensors and the microcontroller and from this to the microprocessor must be physical (e.g., USB). The role of the microprocessor is to ensure the transfer of data to the server. In this case, the transfer must be wireless (e.g., Wi-Fi).
On the server, the information is routed to its proper destination via the communication broker. This is connected to the visual interface, allowing data visualization in real time. It is also connected to the programming interface, which allows the conditional execution of scripts; this results in actions such as sending data to the database or activating the CGM.
The programming interface must ensure that the data received are matched by the relevant metadata. It must also deploy the appropriate processing operations. In this case, numerical data can be distinguished from non-numerical data. While the former can be sent directly to the intended destination, the latter must be processed in order to extract information from the raw data. For example, to extract phenotypic traits from images, classic techniques (e.g., color thresholding) or more complex ones (e.g., Deep Learning models) must be applied.

3. Results and Discussion

To test the proposed network a sensing network was installed in a greenhouse at INESC TEC headquarters in Porto, Portugal. Figure 2 depicts the installation.
Stationary sensors were in charge of collecting environmental parameters (e.g., air temperature), phenotypic traits (e.g., actual evapotranspiration), and soil parameters (e.g., moisture). The choice of devices was based on cost-effective commercial solutions compatible with the remaining network’s components. Furthermore, some devices were developed from scratch, namely a weighing lysimeter (Figure 3).
All the sensors share a common feature: they are connected to custom hardware based on the RP2040 microcontroller, which allows the signals to be processed from the sensors’ intrinsic protocol to the CAN protocol. This protocol was chosen because it applies differential communication, which minimizes noise in the signal and allows for a longer range between connections, which is a must in agricultural environments. The sensors’ microcontrollers, “slaves”, are connected to another microcontroller, the “master”. This, in turn, is connected via USB to a Raspberry Pi Zero W, which sends data requests to the “master” microcontroller that distributes them to the respective “slaves”. The Raspberry is also connected to a camera (Raspberry Pi Camera) for imaging operations. The data received by the Raspberry are sent to the server via Wi-Fi, according to the MQTT (Message Queuing Telemetry Tracking) publish–subscribe protocol.
The greenhouse was also equipped with robotics-assisted sensors. PixelCropRobot, a mobile cartesian robot designed for phenotyping operations [21,22], was implemented for autonomous phenotypic data collection. In addition to 2D RGB imaging operations, the robot is equipped with a custom multispectral sensor and a LiDAR that allows the measurement of leaf pigments—related to the physiological response to abiotic stresses—and the canopy characterization, respectively. The robot is equipped with a Raspberry Pi 4 and, as mentioned above, the data are sent to the server via Wi-Fi, according to the MQTT protocol.
This means that in both cases, the Raspberry Pi acts as a client and sends the messages to the MQTT broker, which filters the messages by topic and distributes them to the corresponding subscribers, which are defined in the scripts of the programming interface or in the functions of the visual interface. By default, all the data received by the broker are subscribed to a Python script that combines the relevant metadata, according to the metadata guidelines of the DEMETER-AIM ontology, and then forwards them to the database.
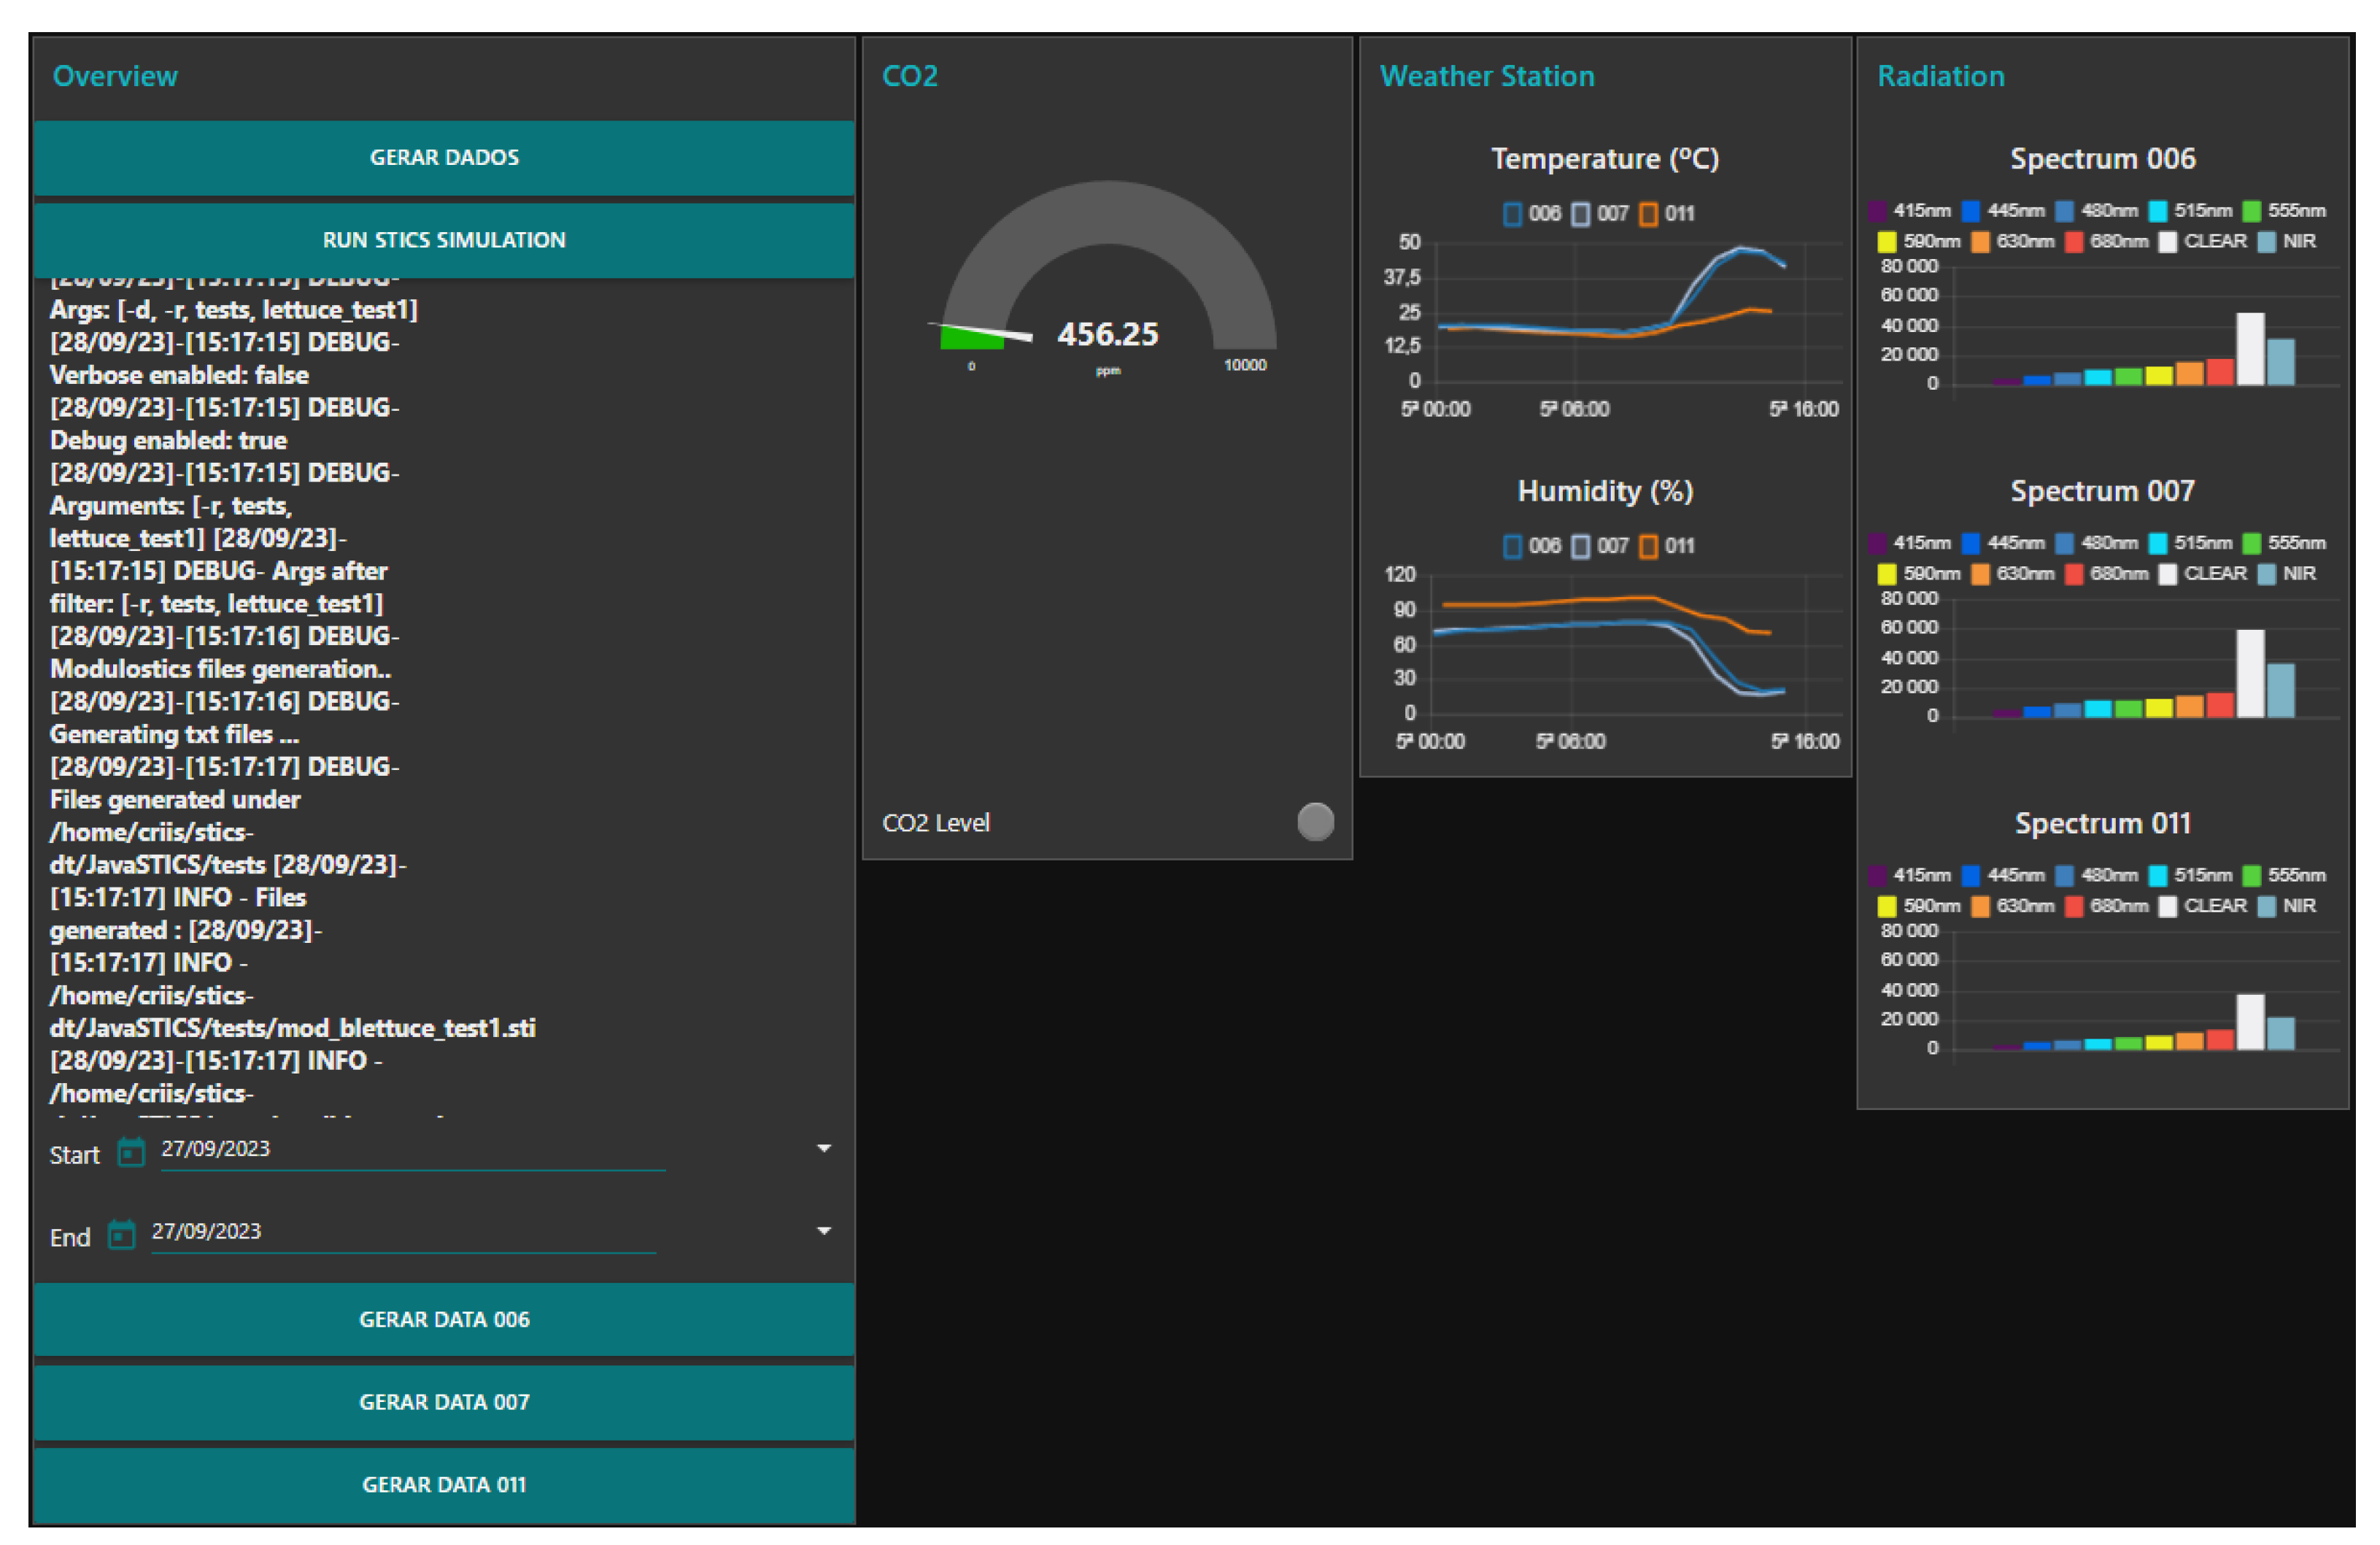
The visual interface was developed using Node-RED (Figure 4). To ease real-time data visualization (e.g., air temperature), some functions of the visual interface act as subscribers, directly receiving the corresponding messages from the broker. Furthermore, through this interface, it is possible to retrieve historical data (stored in the database) and trigger the CGM.
The dynamic process-based model STICS (Simulateur mulTIdiscplinaire pour les Cultures Standard) [23] was the chosen CGM. STICS is a daily time-step model with input variables relating to soil, climate, and the cropping system. The model simulates the growth of a defined genotype for which a physical medium and a crop management schedule are defined. This model presents some features that fit with the sensing network designed, namely its generality, robustness, and modularity, enabling its application to a wide range of crops, climate conditions (even several ones), and the design of new modules or functions, complementing the model.
To ensure that the proposed network provides reliable data to run STICS, continuous data collection was monitored during a lettuce growing season (42 days), according to the frequencies shown in Table 1.
Given the daily time-step of STICS, it is likely that the dataflow shown in Table 1 is enough to run the simulations. However, losses were detected during data transfer to the server. These did not exceed 5% and were mainly due to interruptions in the Wi-Fi connection. Although these are significant losses, since the aim is to keep the model online continuously, they can be easily addressed. For example, one can reinforce the Wi-Fi connection or create a local database that stores the data in the event of Wi-Fi interruptions. In line with Droutsas et al. [24], who proposed the integration of machine learning models into a process-based model, the described network aims to enhance actual data analysis systems and reduce modeling fine-tuning processes. Although further tests are needed, the proposed sensing network has the potential to overcome the phenotyping pitfalls identified by Saint-Cast et al. [10], namely the lack of common semantics and thorough data exchange platforms.

4. Conclusions

This article presents an IoT-based sensing network for digital phenotyping. Associated with this network, a DSS was developed, based on a CGM with the purpose of optimizing agricultural practices. However, further testing is needed to validate the network when fully working under real field conditions. In the future, we intend to enhance the capabilities of this approach. The model simulations will support decision rules, processed by an actuator that will carry out a specific operation. Thus, a continuous swap of data will be created between the physical entities and the simulated ones. This digital twin approach will provide real-time, spatiotemporal causal support for advanced Precision Agriculture practices, evolving from a data-driven approach to an integrative framework, where G × E × M conditions are the driver of advanced decision making.

Author Contributions

Conceptualization, L.R., F.N.d.S. and M.C.; methodology, L.R. and P.M.; software, L.R., P.M., F.T., A.M.C. and J.S.; validation, F.N.d.S. and M.C.; data curation, L.R., P.M. and F.T.; writing—original draft preparation, L.R.; writing—review and editing, P.M., F.T., A.M.C., J.S., F.N.d.S. and M.C.; visualization, L.R.; supervision, F.N.d.S. and M.C.; project administration, F.N.d.S.; funding acquisition, F.N.d.S. All authors have read and agreed to the published version of the manuscript.

Funding

This project received funding from the European Union’s Horizon 2020 research and innovation programme under grant agreement No. 857202. Disclaimer: The sole responsibility for the content in this publication lies with the authors. It does not necessarily reflect the opinion of the European Commission (EC). The EC is not responsible for any use that may be made of the information contained therein.

Institutional Review Board Statement

Not applicable.

Informed Consent Statement

Not applicable.

Data Availability Statement

Data sharing is not applicable to this article.

Acknowledgments

The authors would like to acknowledge the scholarships 9684/BI-M-ED_B2/2022 (L.R.) funded by National Funds through the Portuguese funding agency, FCT—Fundação para a Ciência e Tecnologia.

Conflicts of Interest

The authors declare no conflicts of interest.

References

  1. Pieruschka, R.; Schurr, U. Plant Phenotyping: Past, Present, and Future. Plant Phenomics 2019, 2019, 7507131. [Google Scholar] [CrossRef] [PubMed]
  2. Liu, S.; Martre, P.; Buis, S.; Abichou, M.; Andrieu, B.; Baret, F. Estimation of Plant and Canopy Architectural Traits Using the Digital Plant Phenotyping Platform. Plant Physiol. 2019, 181, 881–890. [Google Scholar] [CrossRef] [PubMed]
  3. Xiong, X.; Zhang, J.; Guo, D.; Chang, L.; Huang, D. Non-Invasive Sensing of Nitrogen in Plant Using Digital Images and Machine Learning for Brassica Campestris Ssp. Chinensis L. Sensors 2019, 19, 2448. [Google Scholar] [CrossRef] [PubMed]
  4. Rodrigues, L.; Magalhães, S.A.; da Silva, D.Q.; dos Santos, F.N.; Cunha, M. Computer Vision and Deep Learning as Tools for Leveraging Dynamic Phenological Classification in Vegetable Crops. Agronomy 2023, 13, 463. [Google Scholar] [CrossRef]
  5. Dhondt, S.; Wuyts, N.; Inzé, D. Cell to whole-plant phenotyping: The best is yet to come. Trends Plant Sci. 2013, 8, 428–439. [Google Scholar] [CrossRef] [PubMed]
  6. Campbell, Z.; Acosta-Gamboa, L.; Nepal, N.; Lorence, A. Engineering plants for tomorrow: How high-throughput phenotyping is contributing to the development of better crops. Phytochem. Rev. 2018, 17, 1329–1343. [Google Scholar] [CrossRef]
  7. Chawade, A.; van Ham, J.; Blomquist, H.; Bagge, O.; Alexandersson, E.; Ortiz, R. High-Throughput Field-Phenotyping Tools for Plant Breeding and Precision Agriculture. Agronomy 2019, 9, 258. [Google Scholar] [CrossRef]
  8. Atefi, A.; Ge, Y.; Pitla, S.; Schnable, J. Robotic Technologies for High-Throughput Plant Phenotyping: Contemporary Reviews and Future Perspectives. Front. Plant Sci. 2021, 12, 611940. [Google Scholar] [CrossRef]
  9. Coppens, F.; Wuyts, N.; Inzé, D.; Dhondt, S. Unlocking the potential of plant phenotyping data through integration and data-driven approaches. Curr. Opin. Syst. Biol. 2017, 4, 58–63. [Google Scholar] [CrossRef]
  10. Saint Cast, C.; Lobet, G.; Cabrera-Bosquet, L.; Couvreur, V.; Pradal, C.; Tardieu, F.; Draye, X. Connecting plant phenotyping and modelling communities: Lessons from science mapping and operational perspectives. Silico Plants 2022, 4, diac005. [Google Scholar] [CrossRef]
  11. Nabwire, S.; Suh, H.-K.; Kim, M.S.; Baek, I.; Cho, B.-K. Review: Application of Artificial Intelligence in Phenomics. Sensors 2021, 21, 4363. [Google Scholar] [CrossRef] [PubMed]
  12. Tripodi, P.; Nicastro, N.; Pane, C. Digital applications and artificial intelligence in agriculture toward next-generation plant phenotyping. Crop Pasture Sci. 2022, 74, 597–614. [Google Scholar] [CrossRef]
  13. Wallach, D.; Makowski, D.; Jones, J.W.; Brun, F. Working with Dynamic Crop Models: Methods, Tools and Examples for Agriculture and Environment, 3rd ed.; Elsevier: Amsterdam, The Netherlands, 2019. [Google Scholar] [CrossRef]
  14. Parent, B.; Tardieu, F. Can current crop models be used in the phenotyping era for predicting the genetic variability of yield of plants subjected to drought or high temperature? J. Exp. Bot. 2014, 65, 6179–6189. [Google Scholar] [CrossRef] [PubMed]
  15. Kasampalis, D.A.; Alexandridis, T.K.; Deva, C.; Challinor, A.; Moshou, D.; Zalidis, G. Contribution of Remote Sensing on Crop Models: A Review. J. Imaging 2018, 4, 52. [Google Scholar] [CrossRef]
  16. Leng, G.; Hall, J.W. Predicting spatial and temporal variability in crop yields: An inter-comparison of machine learning, regression and process-based models. Environ. Res. Lett. 2020, 15, 044027. [Google Scholar] [CrossRef] [PubMed]
  17. Corrales, D.C.; Schoving, C.; Raynal, H.; Debaeke, P.; Journet, E.-P.; Constantin, J. A surrogate model based on feature selection techniques and regression learners to improve soybean yield prediction in southern France. Comput. Electron. Agric. 2022, 192, 106578. [Google Scholar] [CrossRef]
  18. Kallenberg, M.G.; Maestrini, B.; van Bree, R.; Ravensbergen, P.; Pylianidis, C.; van Evert, F.K.; Athanasiadis, I.N. Integrating processed-based models and machine learning for crop yield prediction. arXiv 2023, arXiv:2307.13466. [Google Scholar] [CrossRef]
  19. Pylianidis, C.; Snow, V.; Overweg, H.; Osinga, S.; Kean, J.; Athanasiadis, I.N. Simulation-assisted machine learning for operational digital twins. Environ. Model. Softw. 2021, 148, 105274. [Google Scholar] [CrossRef]
  20. Nasirahmadi, A.; Hensel, O. Toward the Next Generation of Digitalization in Agriculture Based on Digital Twin Paradigm. Sensors 2022, 22, 498. [Google Scholar] [CrossRef]
  21. Terra, F.; Rodrigues, L.; Magalhães, S.; Santos, F.; Moura, P.; Cunha, M. PixelCropRobot, a cartesian multitask platform for microfarms automation. In Proceedings of the International Symposium of Asian Control Association on Intelligent Robotics and Industrial Automation, Goa, India, 20–22 September 2021. [Google Scholar] [CrossRef]
  22. Moreira, T.; Santos, F.; Santos, L.; Sarmento, J.; Terra, F.; Sousa, A. Mission supervisor for food factories robots. Lect. Notes Netw. Syst. 2023; accepted. [Google Scholar]
  23. Brisson, N.; Gary, C.; Justes, E.; Roche, R.; Mary, B.; Ripoche, D.; Zimmer, D.; Sierra, J.; Bertuzzi, P.; Burger, P. An overview of the crop model stics. Eur. J. Agron. 2003, 18, 309–332. [Google Scholar] [CrossRef]
  24. Droutsas, I.; Challinor, A.J.; Deva, C.R.; Wang, E. Integration of machine learning into process-based modelling to improve simulation of complex crop responses. Silico Plants 2022, 4, diac017. [Google Scholar] [CrossRef]
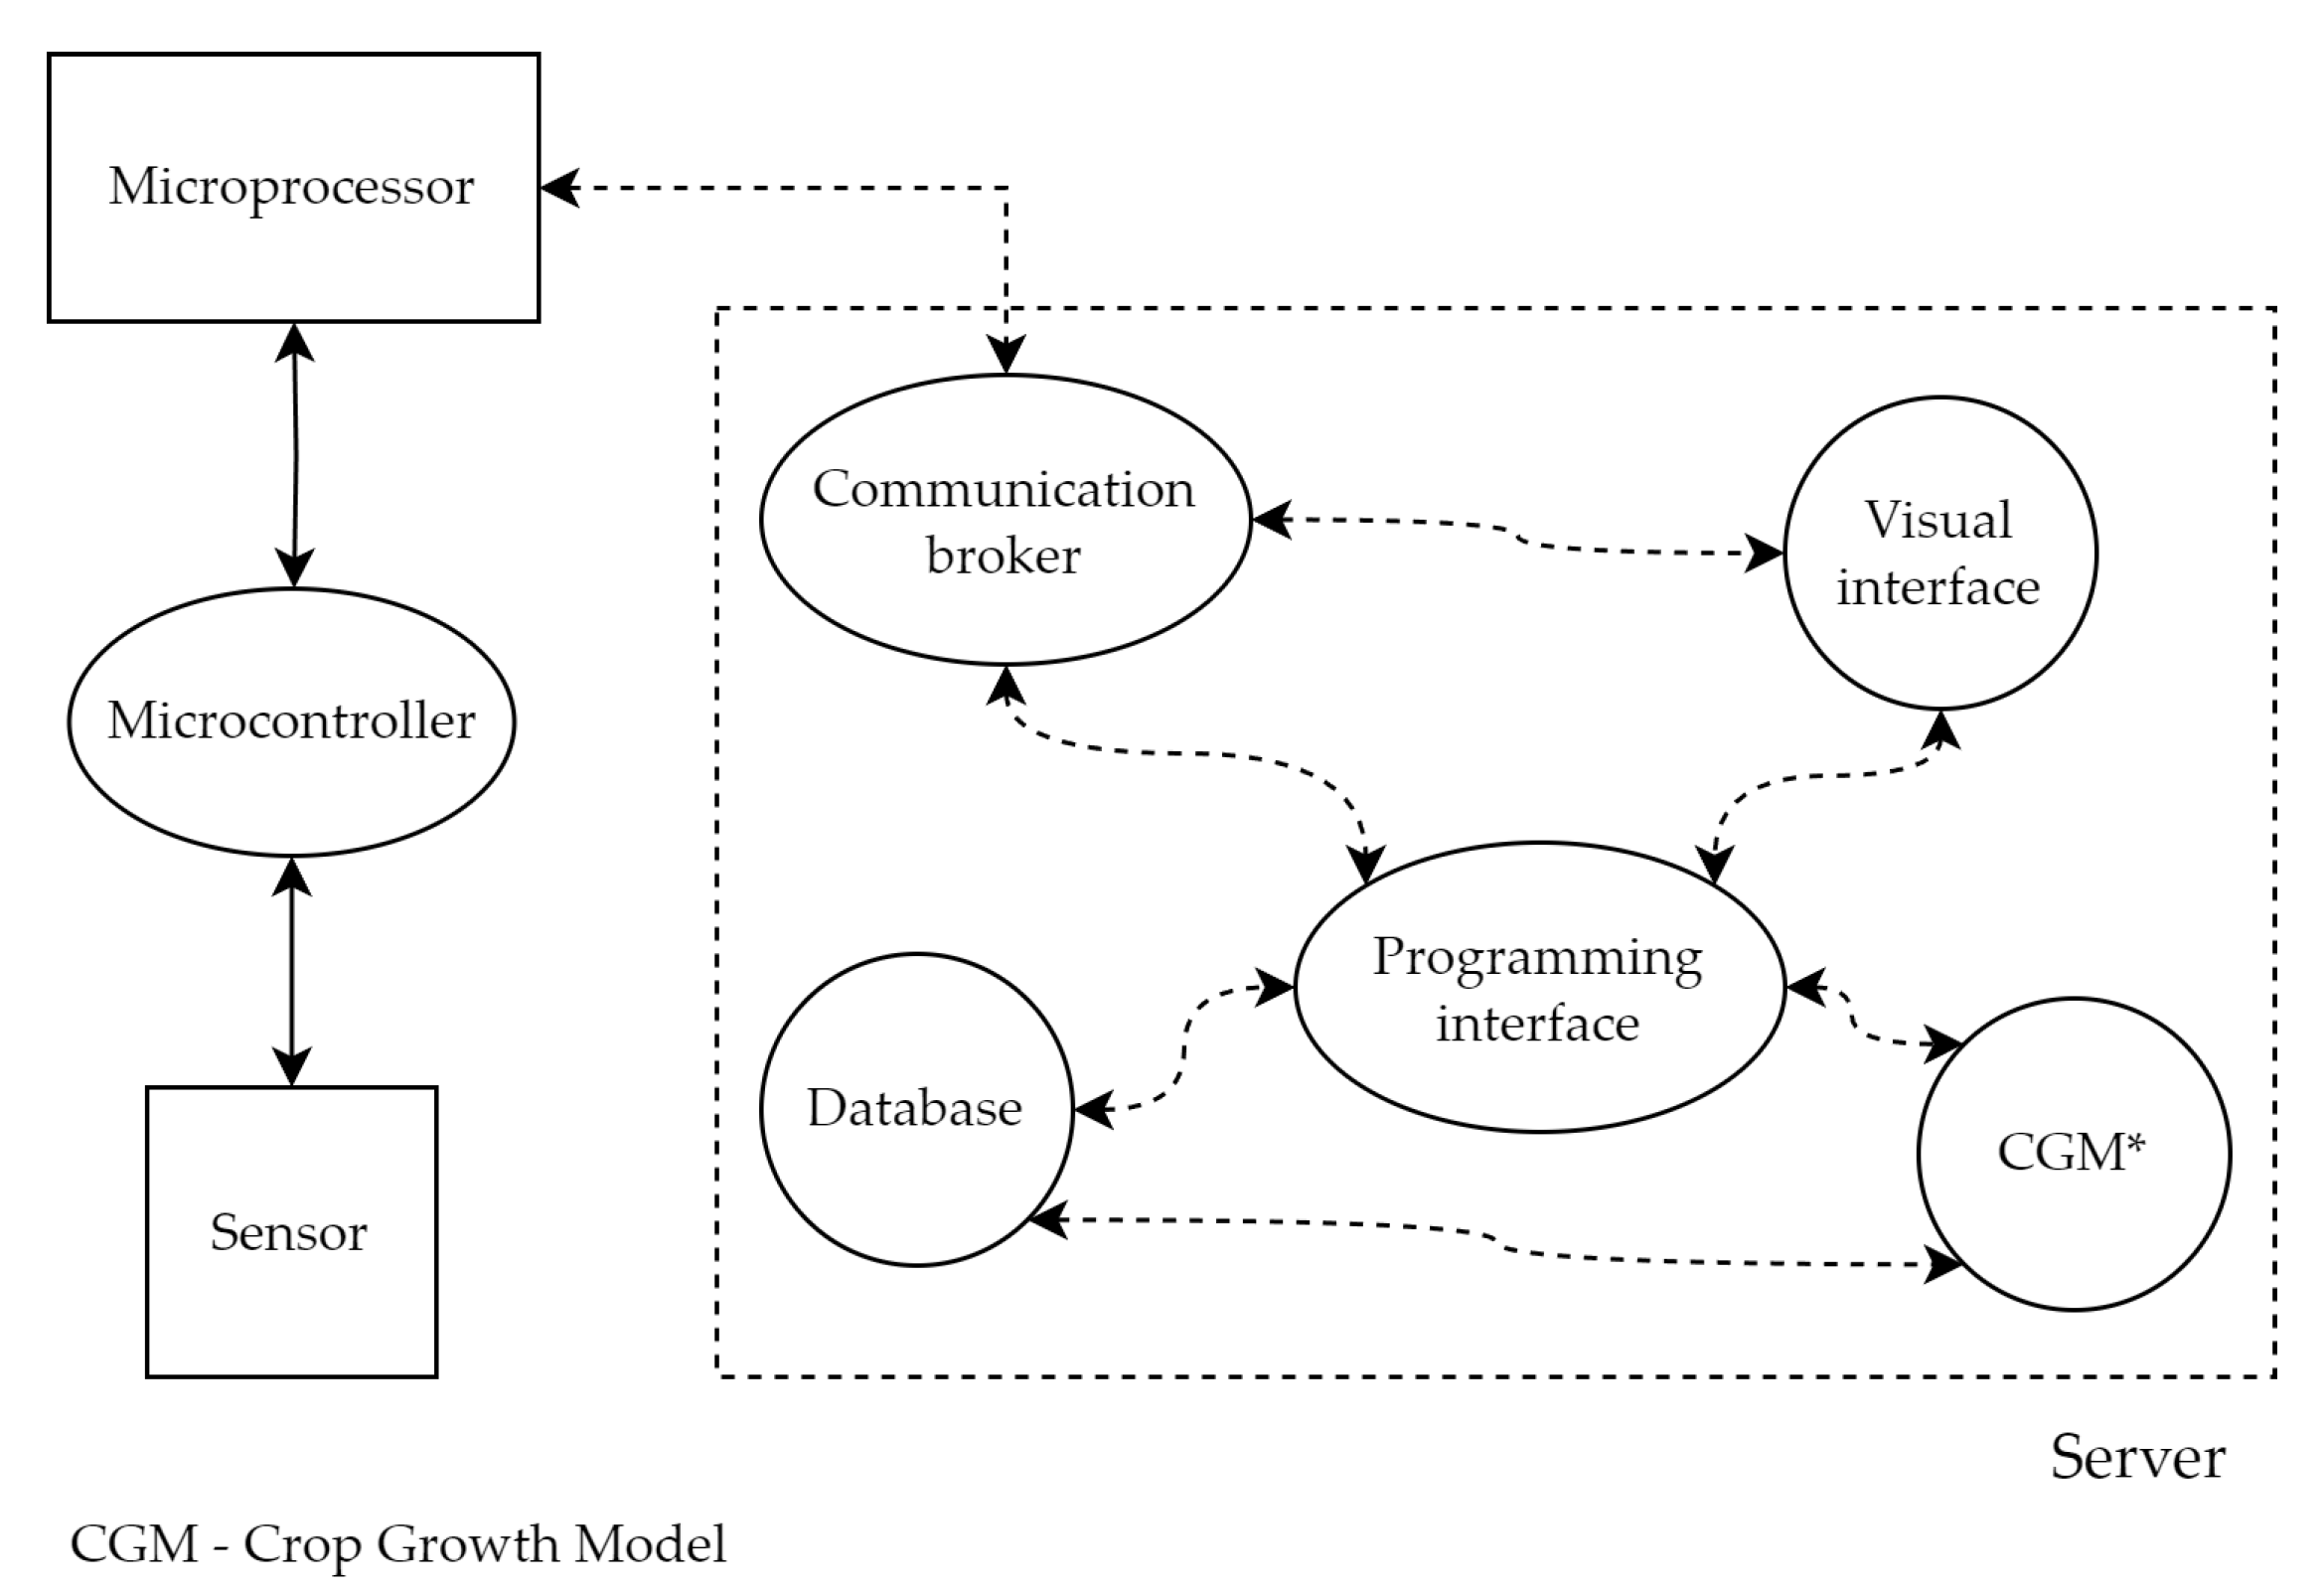
Figure 1. Overall architecture of the proposed sensing network. Bold arrows represent physical connections, dashed arrows represent wireless connections. CGM—crop growth model.
Blsf 27 00041 g001
Figure 2. Sensing network framework installed in a phenotyping greenhouse. Bold arrows represent physical connections, dashed arrows represent wireless connections. PAR—Photosynthetically Active Radiation, ETa—actual evapotranspiration.
Blsf 27 00041 g002
Figure 3. Custom weighing lysimeter. (A)—components view: (1) 10 kg load cell, (2) HX711 amplifier, (3) custom hardware. (B)—fully assembled prototype.
Blsf 27 00041 g003
Figure 4. Node-RED user interface. From left to right: overview—tracking of the STICS simulations, CO2—CO2 concentration, Weather Station—air temperature and humidity, Radiation—PAR levels.
Blsf 27 00041 g004
Table 1. Characterization of the data collected by the sensing network during the lettuce growing season.
SensorQuantity (n)Daily Requests (n)Average Size
Stationary
RPi Camera12410 MB
AS7341224400 B
HTU21D224170 B
SEN0159124120 B
Lysimeter1224160 B
SEN03081224170 B
PixelCropRobot
RPi Camera1510 MB
Multispectral sensor15400 B
LiDAR15370 B
Disclaimer/Publisher’s Note: The statements, opinions and data contained in all publications are solely those of the individual author(s) and contributor(s) and not of MDPI and/or the editor(s). MDPI and/or the editor(s) disclaim responsibility for any injury to people or property resulting from any ideas, methods, instructions or products referred to in the content.