Proceeding Paper

Use of By-Products of Selection Process of Bean (Phaseolus vulgaris L.): Extraction of Protein and Starch †

Centro Interdisciplinario de Investigaciones en Tecnologías y Desarrollo Social para el NOA (CIITED, UNJu-CONICET), Facultad de Ingeniería, Universidad Nacional de Jujuy, San Salvador de Jujuy 4600, Argentina
*
Author to whom correspondence should be addressed.
Presented at the V International Conference la ValSe-Food and VIII Symposium Chia-Link, Valencia, Spain, 4–6 October 2023.
Biol. Life Sci. Forum 2023, 25(1), 10; https://doi.org/10.3390/blsf2023025010
Published: 28 September 2023
(This article belongs to the Proceedings of V International Conference la ValSe-Food and VIII Symposium Chia-Link)

Abstract

:
The industrial selection process of bean (Phaseolus vulgaris L.) produced in Northwest Argentina (NOA) region produces 7000 tons/year of by-products integrated from broken, bruised, and reduced-sized seeds. This investigation aimed to study the possibilities of using these by-products as a source of protein and starch. Samples were crushed to obtain flour (BF) with particle size of 250 µm. Starch and protein were extracted in a 6:1 and 10:1 water/flour ratio at pH 9 and 10, respectively. After centrifugation, the protein was precipitated from the supernatant at pH 4.5, and a bean protein concentrate (BPC) was obtained. The chemical composition of BF, S, and BPC was determined. Starch swelling power (SP), water solubility index (WSI), water absorption index (WAI), and syneresis in cooling (SC) and freezing (SF) conditions were determined. The proportion of molecular structure of BPC was determined using deconvolution of infrared spectrum (Amide I zone), and their solubility using Bradford reactive. The yield of obtaining processes of BPC and bean starch (BS) of high purities was 13.0 and 50.3 g/100 g of BF, respectively. The BS showed SP, WSI, and WAI values of 3.5 ± 0.5 (sediment weight g/100 g BS), 1.7 ± 1.6 (weight of the soluble BS g/100 g of BS), and 3.6 ± 0.5 (sediment weight g/weight of BS (dry solid) g), respectively. The SC was higher than SF and was double with respect to starches of other origins. The BPC solubility was 15.5 g protein/100 g BPC (pH 4.5), higher than concentrates of conventional vegetable proteins. The infrared profile showed higher proportions of deployed structures, i.e., β-sheets (22%) and random coils (18.8%), suitable for emulsifying and gelling properties. Results showed bean by-products as an alternative source of ingredients for the food industry.

1. Introduction

Legumes make up a third of the world’s largest family of phanerogams, and even though there are 650 genres and numerous species, only around 20 are used for human consumption. These present important nutritional benefits, and they are a source of carbohydrates, fibers, proteins, and minerals, and also contain antinutrients. Currently, there is a great demand for raw materials rich in proteins and carbohydrates for human and animal nutrition, which, in addition, can be obtained at low costs. These demands create the need to develop technologies for the integral use of grains to produce foods and ingredients, including proteins and starch from legumes. The NOA region, including Jujuy province, is an important producer of beans. This activity generates by-products that are mostly not used today. The discarded material is made up mainly of beans with bruises, malformations, and that are broken. It is estimated that between 6 and 8% of the annually harvested beans are lost, which adds up to approximately 7000 tons in the NOA region. In this sense, this study aims to develop technological processes for the integral use of discarded beans through the extraction of protein and starch and their subsequent structural and techno-functional characterization.

2. Materials and Methods

2.1. Raw Materials

Beans (Phaseolus vulgaris L.) by-products (BBps) were provided by Cooperativa de Tabacaleros (San Salvador de Jujuy, Argentina). BBps were crushed until their particle size was ≤250 µm (Hammer mill KINEMATIC model PX-MFC 90 D, Switzerland), obtaining BBp flour (BF).

2.2. Chemical Composition

Moisture, fat, protein and ash of BF, starch, and protein were determined with Official Methods of Analysis of AOAC [1]. The content of carbohydrates was calculated by difference. The amilose/amilopectin ratio was determined using a method proposed for Jan et al. [2].

2.3. Macromolecules Extraction

2.3.1. Starch Extraction

A BF/water (1:6 p:p) mixture was brought to pH 9.0 with 1N NaOH, stirred for 1 h at 400 rpm at room temperature, then the liquid fraction was separated and left to settle for 16 h to precipitate the bean starch (BS); this was washed three times with distilled water and centrifuged at 2500 rpm. Finally, it was dried at 50 °C.

2.3.2. Protein Extraction

The BF protein, present in the obtained supernatant, was isolated according to the method described by Du et al. [3]. The extraction diagram is shown in Figure 1. The protein extracted from BF was denominated bean protein concentrate (BPC) and was expressed in g protein/100 g of BPC.

2.3.3. Extraction Yields

The starch and protein yields were determined using Equation (1).
% Y i e l d = W i W 1 × 100
where Wi is the weight of BS (W1) or BPC (W3), and W1 is BF weight in g.

2.4. Functional Properties

The functional properties were calculated according to Calliope et al. [4].
Water absorption index, WAI (g/g) = weight of sediment/sample weight
Water solubility index, WSI (g/g) = weight of the soluble starch/sample weight × 100
Swelling Power, SP (g/g) = weight of sediment/(Sample weight-Weight of dissolved solids in supernatant) × 100
The syneresis in freezing (−18 °C) and refrigeration (4 °C) was determined according to Przetaczek-Rożnowska and Fortuna [5]. The syneresis was measured as % amount of water released.

2.5. Protein Solubility

The solubility of the BPC protein was determined by the method of Du et al. [3] using bovine serum albumin (BSA) to obtain a standard calibration curve (y = 0.0513x + 0.0013; r2 = 0.9994). The results were expressed as g of soluble protein/100 g BPC.

2.6. Infrared Spectroscopy

The Fourier Transform Infrared (FTIR) spectrum was obtained in the range of 400–4000 cm−1 with a resolution of 4 cm−1 using an infrared spectrophotometer (Nicolet iS50-thermo Nicolet, Thermo Scientific, United States) with Attenuated Total Reflection (ATR). The infrared spectrum was used to determine the proportions of the secondary structures of BPC.

2.7. Statistical Analysis

The results were subjected to a one-way analysis of variance (ANOVA), and the average was compared using Tukey’s test with a confidence level of 95% (p < 0.05), using the Infostat statistical software (Version 2015, University of Cordoba, Argentina).

3. Results and Discussion

3.1. Chemical Composition of Bean Flour (BF)

Table 1 shows the BF composition. The moisture was within the average values reported for whole grain flours of different varieties. The amylose content was 28% and was within the range reported by other authors [6]. The crude protein was higher than 19%, which was reported by Sarmento [7] for beans of the same variety. The lipid concentration was less than 2%.
The starch extraction method allowed us to obtain a good quality product due to the low concentration of protein and ash. The BS had a purity value similar to the value reported by Przetaczek-Rożnowska et al. [5].
The extraction yield of the protein was 13%. The BPC had a protein concentration of 72.4%; it was higher than other vegetable sources such as peanuts (42.4%), peas (71.6%), defatted wheat germ, and beer barley by-products (45.7%), among others [8]. The Argentine Food Code established a minimum of 65 g of protein/100 g of sample, to be defined as a “Protein Concentrate”.

3.2. Functional Properties of Starch

The determination of functional properties is a method to study the effect of starch process and to characterize the behavior of the BS in food systems. The WAI, WSI, and SP measured in the bean are shown in Table 2. The properties of BS are similar to those of Zaragoza bean starch, except the WSI, whose properties exhibit lower values, probably due to its low amylose content (21.81%) [9]; with respect to potato starch, the BS also presents similar values for these properties, although the WSI was close to the lower limit of the range reported by Calliope et al. [4]. This is probably due to the higher amylose content of BS (27.9%). The amylose content and the length of the amylopectin chains of the starch granules are determining factors of the functional properties [9]. Figure 2 shows the syneresis of BS gels that are stored in frozen and refrigerated conditions. During the first seven days, syneresis was high in both, but significantly higher in the refrigerated gel. Syneresis is considered an undesirable attribute and is associated with an unstable structure. Instability may be due to the rearrangement of the gel matrix or the mechanical damage to the network in a weak gel due to its concentration. In this study, the gel was formed at the same concentration for both treatments, which might attribute the instability to the amylose content that might cause a faster rearrangement in refrigerated condition compared to freezing condition. However, in the freezing condition, the structure formed presented greater stability against freezing–thawing cycles, which might favor a lower and slower syneresis during the measured storage time.

3.3. Bean Protein Concentrate (BPC) Solubility

The BPC solubility curve is U-shaped, with a minimum value of approximately 15% at pH 4.5–5.0, corresponding to the isoelectric point (pI); the maximum values were 38.1 and 40.1% at pH 3.0 and 8.0, respectively.

3.4. Profile of FTIR Spectrum of BPC

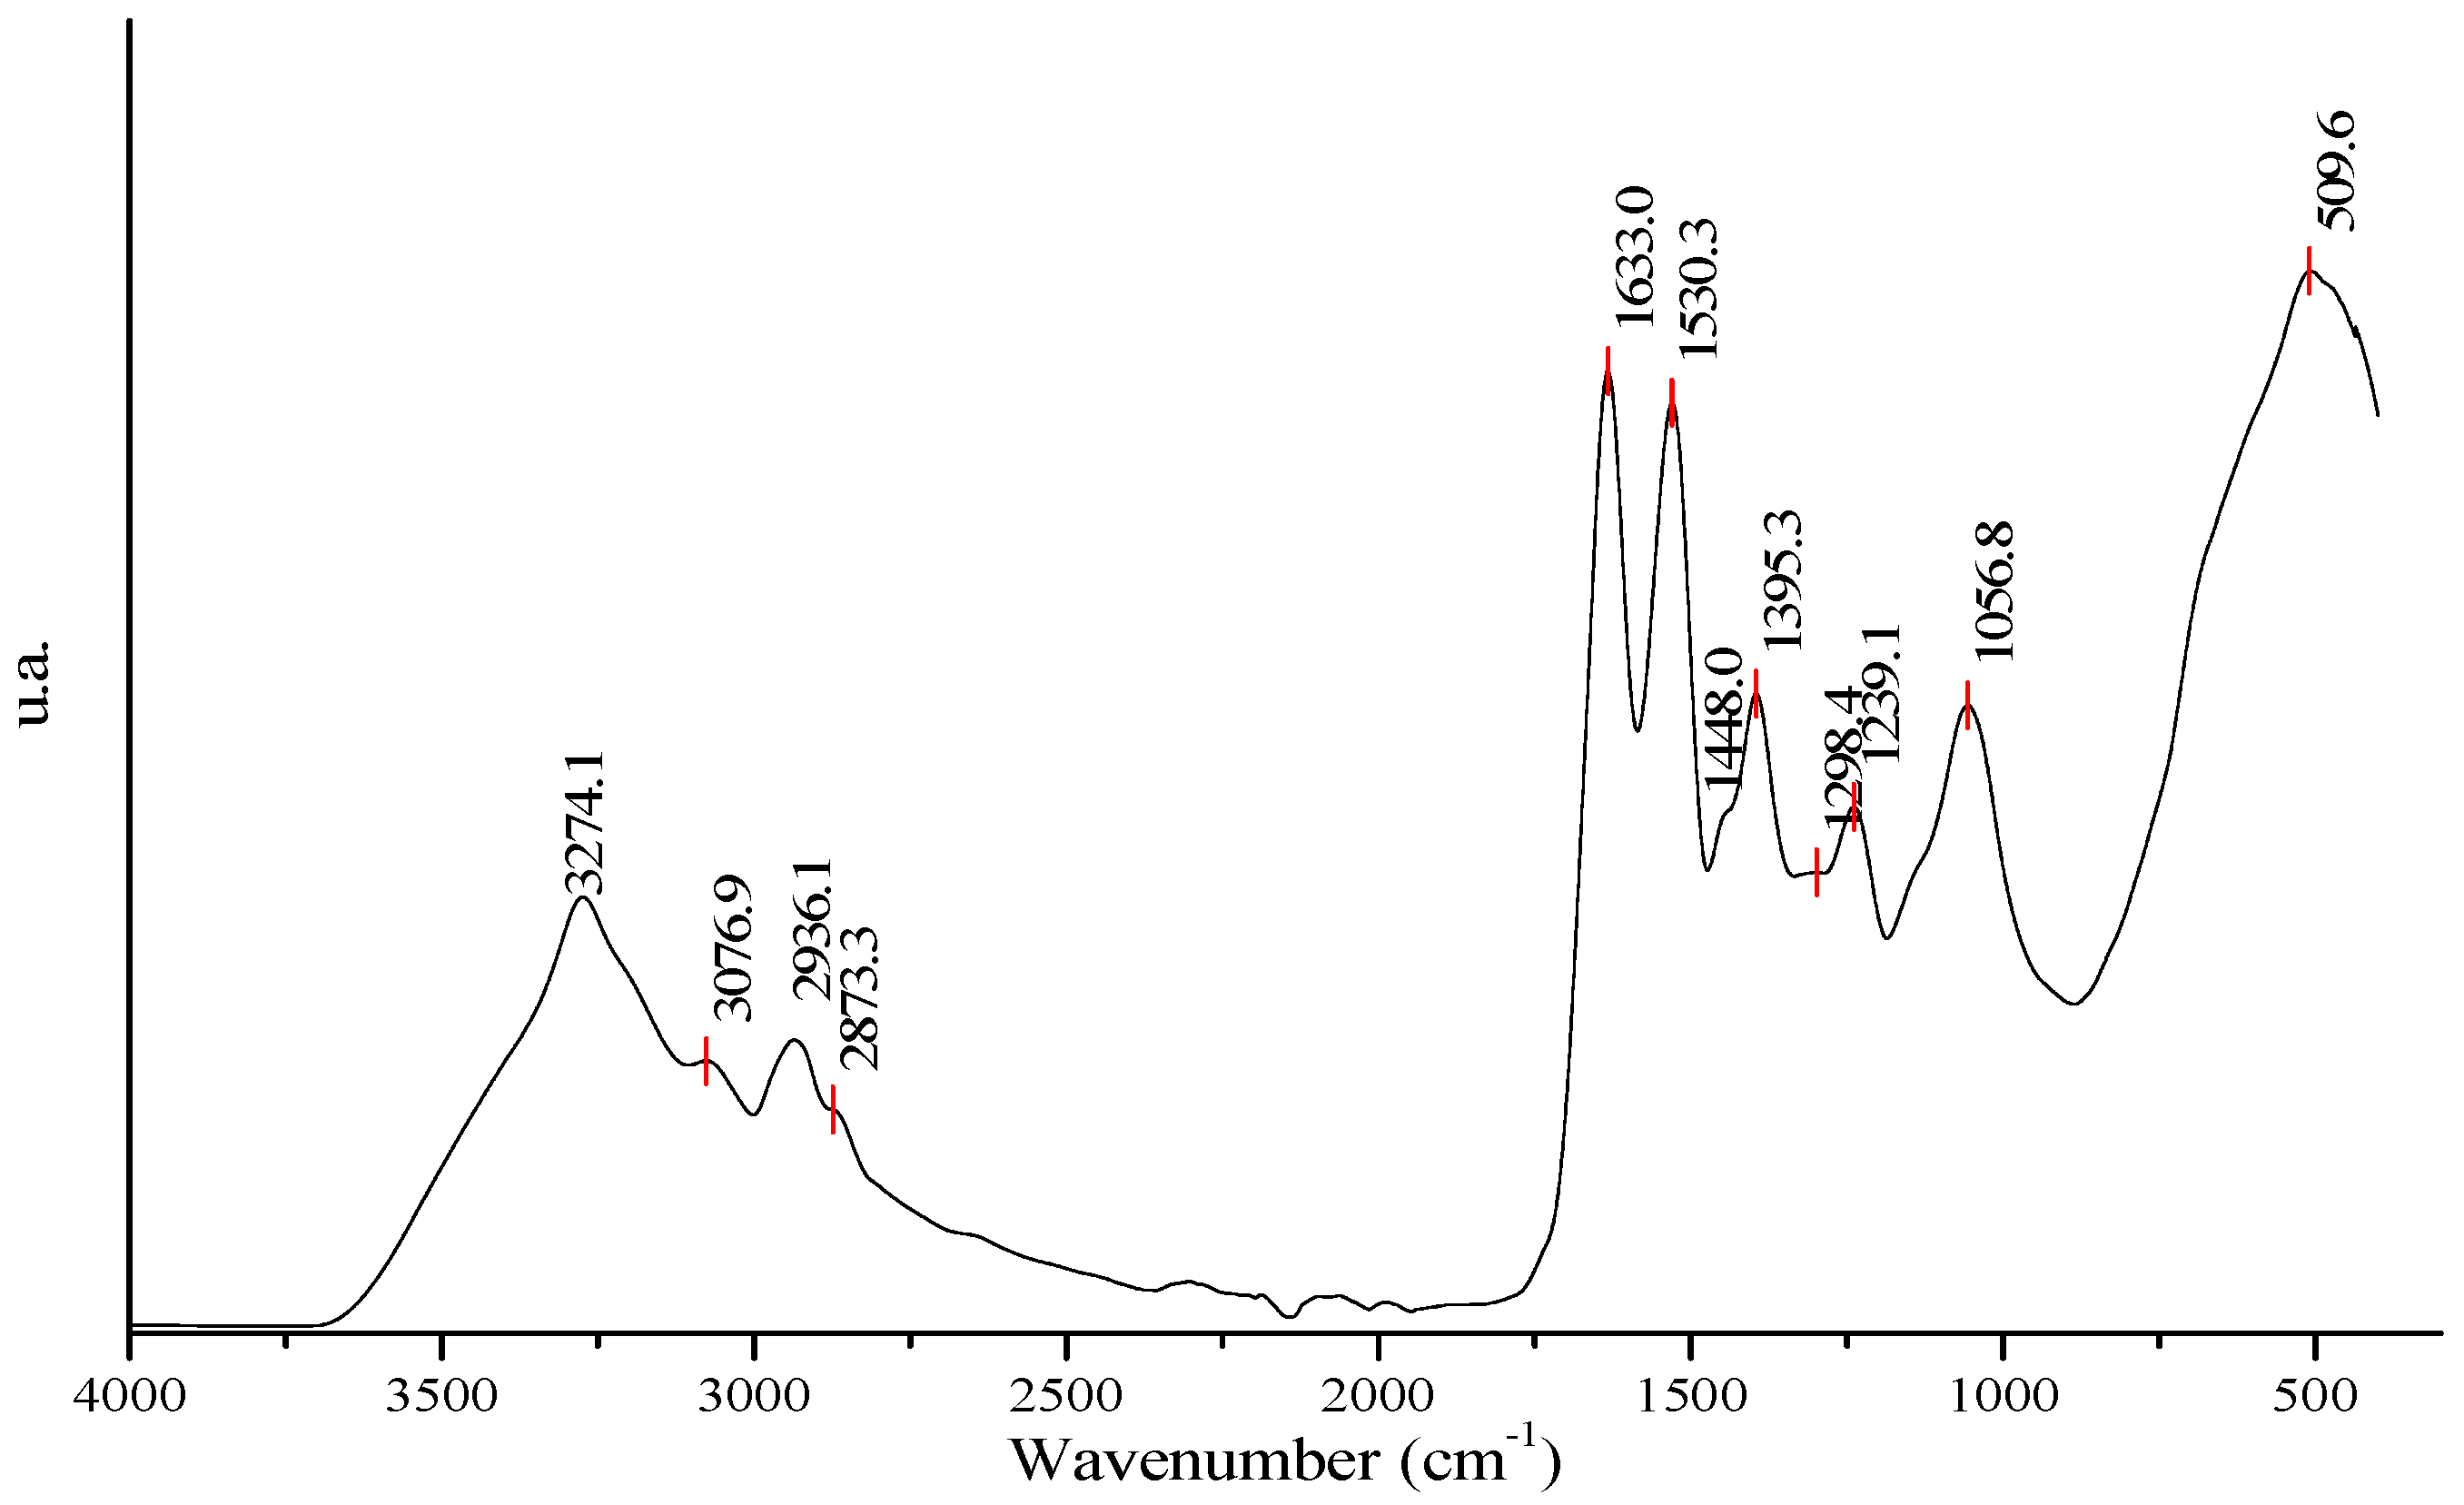
The infrared spectrum of BPC is shown in Figure 3. The peak present in a region of 3500–3200 cm−1 (Amida A) indicates an -NH stretch corresponding to the bending of the vibrational frequency of intra- and intermolecular hydrogen bonding. The peak at 3274.1 cm−1 in the BPC spectrum corresponds to a helical formation integrated by hydrogen bonds due to the interaction of functional groups of C=O and N=H. The peak determined at 3076.9 cm−1 responds to vibrational stretching of the =C-H bond or vibrations of aromatic C-H bonds from unsaturated hydrocarbons or lipids, respectively. This suggests that the presence of the peak at 3076.9 cm−1 could be due to the small trace of lipid present in the BPC. The peaks 2961.1 and 2873.3 cm−1, located between 2990–2850 cm−1, represent the antisymmetric and symmetric methyl (CH3) and methylene (CH2) stretching modes that are normally found in aliphatic protein side chains. The three main peaks at 1633, 1530, and 1395 cm−1 are assigned to be amide I, amide II, and amide III, respectively. These correspond to C=O stretching, N-H splitting or C-N stretching, and C-N stretching, respectively. The peaks around 1448 and 1239 cm−1 are attributed to CH2 vibrational splitting (scissor type) and C-N stretching, respectively. At 1298.3 cm−1, a peak corresponding to in-plane strain vibrations of -OH is observed. The peak around 1057 cm−1 could be assigned to C-O-C antisymmetric stretching variations. Finally, the peak at 509.6 cm−1 may correspond to out-of-plane stretching of O-H bonds.

3.5. Proportions of Secondary Structures

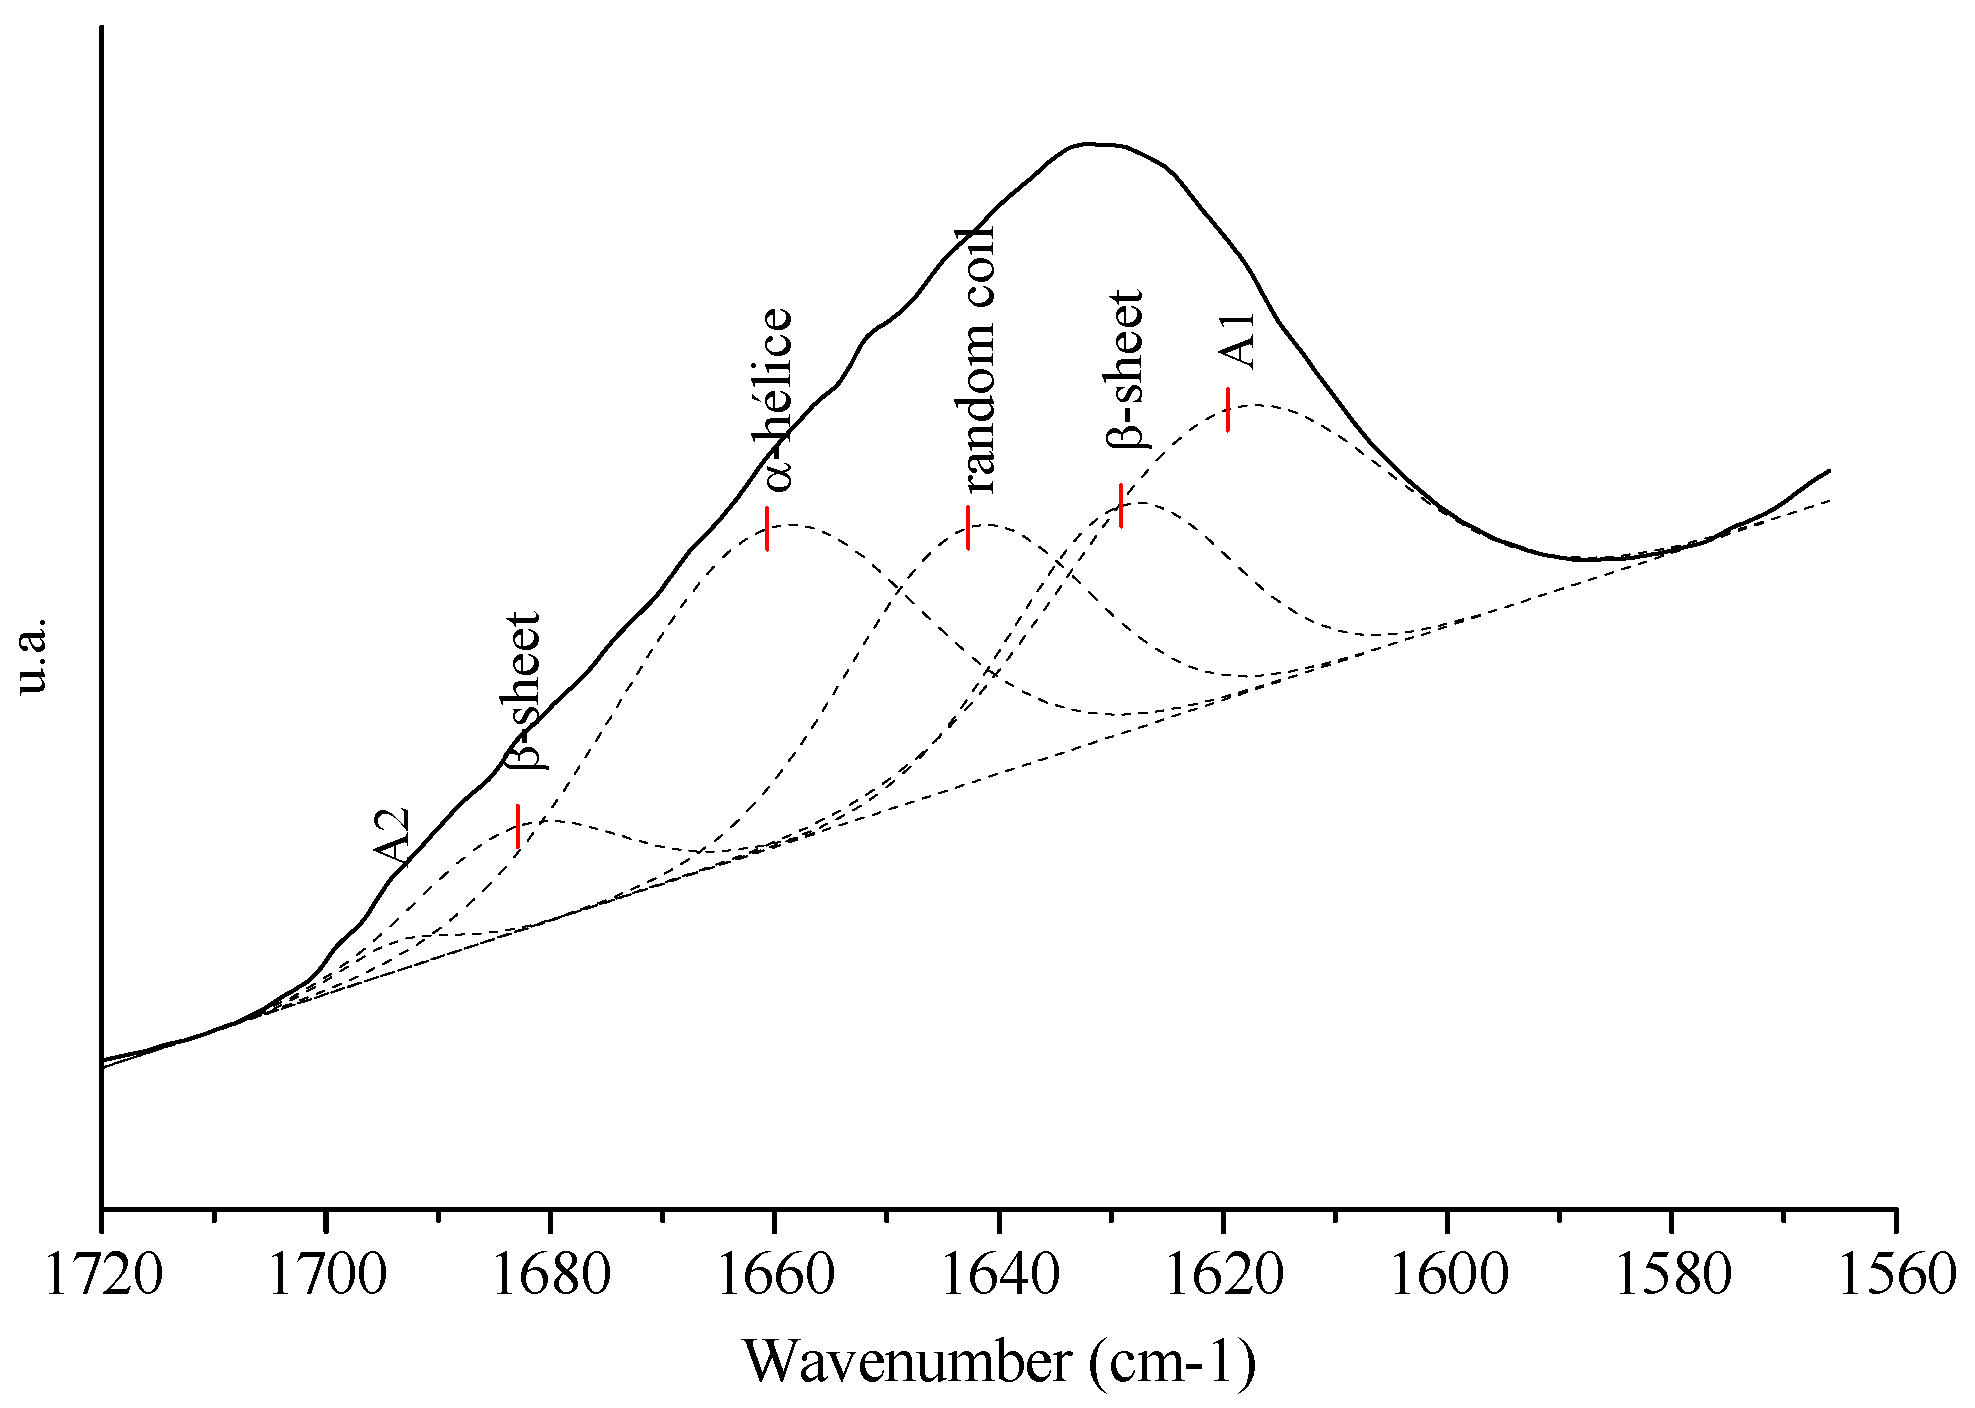
The deconvolution of the infrared spectrum in the amide I zone allows the determination of the percentage of area under the curve of its populations. Figure 4 shows the populations that comprise the infrared spectrum in the amide I zone, where the identified molecular structures are β-sheet, random coil, α-helix and β-turn, protein aggregates (A1), and amino acid side chain (A2) [10]. Table 3 presents the percentage content of the secondary structures and minor fractions present in the BPC. The secondary structures present in the highest percentage are present in the following order: α-helix, β-sheet, and random coil. The minority structures with lesser extent are for A1, with an exception for A2. The presence of the α-helix (a greater proportion) and A1 structures are associated with an ordered, more compact molecular conformation and with a greater exposure to hydrophilic zones [11]. The β-sheet and random coil structures in BPC impart to it less compact and disordered structure zones together with greater exposure to hydrophobic zones [11]. According to Alancay et al. [11], BPC may have the structural characteristics (most relevant being the presence of β-sheet structure) for its use as an emulsifying and gelling agent in food matrices. The prevalence of the α-helix structure, over the rest of the structures, shows that BPC has greater digestibility compared to the soybean protein isolate [11].

4. Conclusions

The extraction yields of the by-products of bean (Phaseolus vulgaris) are presented here, and these by-products may serve as an alternative source of protein and starch. The chemical and physicochemical properties of BS and BPC are within the purity ranges proposed by other authors. The amylose content of the native starch may explain their high syneresis during the first days of storage. Retrogradation is one of the main factors influencing the quality of starch-containing products, usually occurring during storage; SB has a tendency to decline in quality; therefore, its use in food systems that involve refrigeration processes may not be appropriate. On the other hand, the structural properties of the BPC make this material suitable for use as an emulsifying and gelling agent in traditional food systems.

Author Contributions

Conceptualization, M.M.A., S.R.C., R.M.M. and N.C.S.; methodology, M.M.A., S.R.C., R.M.M. and N.C.S.; software, M.M.A., S.R.C., R.M.M. and N.C.S.; validation, M.M.A., S.R.C., R.M.M. and N.C.S.; formal analysis, M.M.A., S.R.C., R.M.M. and N.C.S.; investigation, M.M.A., S.R.C., R.M.M. and N.C.S.; resources, M.M.A., S.R.C., R.M.M. and N.C.S.; data curation, M.M.A., S.R.C., R.M.M. and N.C.S.; writing—original draft preparation, M.M.A., S.R.C., R.M.M. and N.C.S.; writing—review and editing, M.M.A., S.R.C., R.M.M. and N.C.S.; visualization, M.M.A., S.R.C., R.M.M. and N.C.S.; supervision, M.M.A., S.R.C., R.M.M. and N.C.S.; project administration, M.M.A., S.R.C., R.M.M. and N.C.S.; funding acquisition, M.M.A., S.R.C., R.M.M. and N.C.S. All authors have read and agreed to the published version of the manuscript.

Funding

This work was funded by Consejo Nacional de Investigaciones Científicas y Técnicas (CONICET-Argentina).

Institutional Review Board Statement

Not applicable.

Informed Consent Statement

Not applicable.

Data Availability Statement

Not applicable.

Acknowledgments

This work was supported by SECTER-CONICET-UNJU (Argentina) and IaValSe-Food-CYTED (119RT0567). Our research group appreciates the collaboration with Mamaní, I M; Cruz, E G; and Gallardo, M.

Conflicts of Interest

The authors declare no conflict of interest.

References

  1. AOAC. Official Methods of Analysis of AOAC International, 20th ed.; AOAC International: Washington, DC, USA, 2016. [Google Scholar]
  2. Jan, K.N.; Panesar, P.S.; Rana, J.C.; Singh, S. Structural, Thermal and rheological Properties of Starches Isolated from Indian Quinoa Varieties. Int. J. Biol. Macromol. 2017, 102, 315–322. [Google Scholar] [CrossRef] [PubMed]
  3. Du, M.; Xie, J.; Gong, B.; Xu, X.; Tang, W.; Li, X.; Li, C.; Xie, M. Extraction, Physicochemical Characteristics and Functional Properties of Mung Bean Protein. Food Hydrocoll. 2018, 76, 131–140. [Google Scholar] [CrossRef]
  4. Calliope, S.; Wagner, J.; Samman, N. Physicochemical and Functional Characterization of Potato Starch (Solanum Tuberosum Ssp. Andigenum) from the Quebrada De Humahuaca, Argentina. Starch-Stärke 2020, 72, 1900069. [Google Scholar] [CrossRef]
  5. Przetaczek-Rożnowska, I.; Fortuna, T. Effect of Conditions of Modification on Thermal and Rheological Properties of Phosphorylated Pumpkin Starch. Int. J. Biol. Macromol. 2017, 104, 339–344. [Google Scholar] [CrossRef] [PubMed]
  6. Betancur-Ancona, D.; López-Luna, J.; Chel-Guerrero, L. Comparison of the Chemical Composition and Functional Properties of Phaseolus Lunatus Prime and Tailing Starches. Food Chem. 2003, 82, 217–225. [Google Scholar] [CrossRef]
  7. Sarmento, T.R. Impacto Del Procesamiento Sobre La Pared Celular y Las Propiedades Hipoglucémicas y Tecnofuncionales de Leguminosas, Universidad Autónoma de Madrid, Madrid. 2012. Available online: http://hdl.handle.net/10486/12817 (accessed on 31 July 2023).
  8. Franca-Oliveira, G.; Fornari, T.; Hernández-Ledesma, B. A Review on the Extraction and Processing of Natural Source-Derived Proteins through Eco-Innovative Approaches. Processes 2021, 9, 1626. [Google Scholar] [CrossRef]
  9. Miranda-Villa, P.P.; Marrugo-Ligardo, Y.A.; Montero-Castillo, P.M. Caracterización Funcional de Almidón de Frijol Zaragoza (Phaseolus Lunutus) y Cuantificación de su Almidón Resistente. In Tecnológicas; Instituto Tecnológico Metropolitano: Medellín, Colombia, 2013; pp. 17–32. Available online: https://www.redalyc.org/pdf/3442/344234332002.pdf (accessed on 15 August 2023).
  10. Beck, S.M.; Knoerzer, K.; Arcot, J. Effect of Low Moisture Extrusion on a Pea Protein Isolate’s Expansion, Solubility, Molecular Weight Distribution and Secondary Structure as Determined by Fourier Transform Infrared Spectroscopy (FTIR). J. Food Eng. 2017, 214, 166–174. [Google Scholar] [CrossRef]
  11. Alancay, M.M.; Lobo, M.O.; Samman, N.C. Physicochemical and Structural Characterization of Whey Protein Concentrate–Tomato Pectin Conjugates. J. Sci. Food Agric. 2023, 103, 5242–5252. [Google Scholar] [CrossRef] [PubMed]
Figure 1. Flow sheet of protein extraction from bean by-product flour (BF).
Blsf 25 00010 g001
Figure 2. Bean starch syneresis during storage.
Blsf 25 00010 g002
Figure 3. Infrared spectrum of bean protein concentrate (BPC).
Blsf 25 00010 g003
Figure 4. Deconvoluted infrared spectrum for Amide I zone (1750–1550 cm−1) in bean protein concentrate (BPC). The minority fractions A1 and A2 comprise protein aggregates and amino acid side chains, respectively.
Blsf 25 00010 g004
Table 1. Chemical composition of bean flour Alubia variety (BFA), starch (BS), and bean protein concentrate (BPC).
Component (g/100 g)BFABSBPC
Humidity11.4 ± 0.112.6 ± 0.17.7 ± 0.2
Protein20.4 ± 1.20.5 ± 0.0572.4 ± 0.4
Lipid1.1 ± 0.010.1 ± 0.010.6 ± 0.03
Ash4.7 ± 0.020.3 ± 0.018.4 ± 0.1
Carbohydrates *62.5nd10.9
Amilose (g/100 g)-27.9 ± 0.4-
Amilopectin (g/100 g)-72.1 ± 0.4-
Phosphorus (mg/100 g BS)-95.9 ± 2.6-
Yield (%)-50.313.0
* 100 − (humidity + protein + lipid + ash); nd: no determined.
Table 2. Functional properties of bean starch (BS).
Raw MaterialWAI **WSI *SP *
Bean3.50 ± 0.541.67 ± 1.633.56 ± 0.52
Potato [4]2.31–4.841.16–9.542.56–4.89
Zaragoza Bean [9]3.33–4.435.70–8.303.23–4.43
Values represent mean ± standard deviation. * Expressed in g/100 g BS; ** Values expressed in g/g BS. Source: Calliope et al. [4] and Miranda-Villa et al. [9]. NA: not available.
Table 3. Area (%) of secondary structures and minor fractions present in the Amide I zone of the bean protein concentrate (BPC).
Area (%)
Secondary StructuresMinority Fractions
β-sheet
(1625–1640 cm−1)
Random coil
(1680–1690 cm−1)
α-helix
(1637–1645 cm−1)
A2 *
(1690–1695 cm−1)
A1 *
(1610–1625 cm−1)
22.018.829.71.028.5
* The minority fractions A1 and A2 comprise protein aggregates and amino acid side chains, respectively.
Disclaimer/Publisher’s Note: The statements, opinions and data contained in all publications are solely those of the individual author(s) and contributor(s) and not of MDPI and/or the editor(s). MDPI and/or the editor(s) disclaim responsibility for any injury to people or property resulting from any ideas, methods, instructions or products referred to in the content.