Abstract
Traditional crop varieties are useful sources of desirable characteristics for developing new cultivars with improved nutritive and sensory attributes. The aim of this study was to evaluate the fruit-quality parameters in three traditional tomato genotypes: pink, yellow and dark colors. The results showed that yellow-colored tomatoes had the highest TSS/TTA ratio and antioxidative activity, but the lowest content of lycopene and β-carotene. The genotypic differences in the carotenoid components were also confirmed by Raman spectroscopy. The advantage of the yellow-tomato genotype related to fruit-quality compounds compared to the other genotypes indicated its potential in a breeding program.
1. Introduction
Tomato-fruit quality is determined by a combination of different organoleptic and nutritional characteristics. Soluble solids, organic acid, TSS/TTA ratio (TSS—total soluble solids; TTA—total titratable acidity) and pH are crucial for the tomato taste [1], while carotenoids and vitamin C, as non-enzymatic antioxidants, are of great importance for human health [2]. Due to the high demand for products with improved nutritive and sensory attributes, traditional tomato genotypes and wild relatives can be important sources of traits related to consumer perception that could be used in a breeding program [3,4]. Thus, it is important to evaluate traditional accessions in terms of their quality, nutritive and health-promoting characteristics. In addition to traditional morphological and biochemical analysis, novel techniques can be used for the phenotypic characterization of tomato genotypes. One of the most promising tools is Raman spectroscopy coupled with chemometrics, which has significant potential for the evaluation of the nutritional attributes of plants [5,6]. The aim of this study was to evaluate the fruit quality of three traditional tomato genotypes with different colors from the Balkans using Raman spectroscopy, as well as morphological and biochemical methods, in order to detect the most important quality traits and provide important information on their potential for use in breeding programs.
2. Materials and Methods
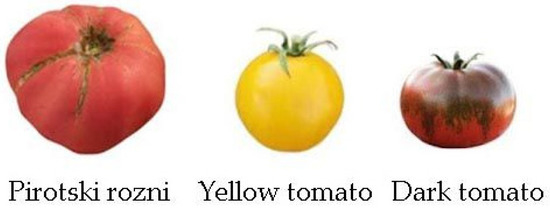
In this study three traditional genotypes from the Balkans with different colors were used: pink (“Pirotski rozni”), yellow and dark tomatoes (Figure 1). Tomatoes were grown in the open-field conditions. Morphological measurements (fruit weight, width and height and fruit shape index) and biochemical analyses were performed in red–ripe phase. The soluble solids were determined via refractometry and organic acids by the titratable acidity measurement as well as pH of tomato juice. Spectrophotometric methods were used for the determination of vitamin C [7], lycopene [8] and antioxidant activity [9]. The statistical analyses were performed with SigmaPlot software (version 14.0, Systat Software, Palo Alto, Santa Clara, CA, USA). The data were statistically analyzed using a one-way analysis of variance (ANOVA) and expressed as mean ± SE (n = 6). The significance of differences between the mean values was determined using Tukey’s test for significance level p ≤ 0.05. Correlations among the parameters were determined by correlation–regression analysis and Pearson’s correlation coefficients.

Figure 1.
Three traditional tomato genotypes (pink tomato “Pirotski rozni”, yellow and dark tomato).
Raman spectroscopy was used to examine tomato samples in different regions of the fruit pericarp. Spectra were recorded using an XploRA Horiba Jobin Yvon. Raman scattering was excited by a laser at a 532 nm with grating at 1200 lines/mm. Spectra were acquired by applying exposure time 5 s and scanning the sample 5 times. Principal component analysis (PCA) was carried out on data normalized by the highest-intensity band and using spectral region from 200 to 1800 cm−1. The spectra preprocessing was performed using the Spectragryph software, version 1.2.14 (Dr. Friedrich Menges Software-Entwicklung, Oberstdorf, Germany) [10], while PCA was performed using the PAST software [11].
3. Results
3.1. Morphological and Biochemical Parameters
The results of the analysis of the morphological parameters showed that the pink genotype had the largest fresh weight per fruit (365.89 g/fruit), as well as the highest fruit-shape index compared. Among the smaller fruit genotypes (yellow and dark tomatoes), there were no statistically significant differences in fresh weight or fruit width. However, the dark-tomato genotype had the lowest fruit weight (74.11 g/fruit) and fruit height (43.92 cm) (Table 1).

Table 1.
Morphological parameters of investigated tomato genotypes.
Biochemical analysis indicated statistically significant differences in the tomato-fruit-quality parameters between genotypes (Table 2). The yellow genotype had the highest content of total soluble solids (TTS), TSS/TTA ratio, pH of fruit juice and total antioxidative activity. The highest concentrations of vitamin C were found in the yellow and dark genotypes and statistically differed compared to the pink genotype (17.83 mg/100 g). The analysis of carotenoids content showed statistically significant genotypic differences in lycopene, with the highest value recorded in a pink tomato (247.13 mg/kg). The dark genotype had the highest β–carotene content (6.41 mg/100 g), which significantly differed from the pink and yellow genotypes. By contrast, the lowest content of lycopene and β–carotene was found in the yellow-tomato genotype.

Table 2.
Biochemical parameters of analyzed tomato genotypes.
3.2. Raman Signature of Tomato Pericarp and PCA
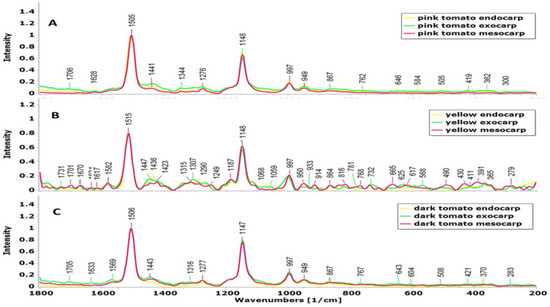
The analysis of the Raman spectroscopy showed that the tomato genotypes differed for characteristic peaks in spectral regions at 1505–1515, ~1148 and 997–1001 cm−1 in all the pericarp regions (exo-, meso- and endocarp) (Figure 2). The pink and dark tomatoes had bands around 284, 365, 419, 590, 640, 762, 1569, and 1628 cm−1, which were not present in the yellow tomato, while the yellow tomato had bands (391, 430, 490, 568, 665, 816, 914, 1059, 1187, 1423, 1582, 1670 cm−1) specific only for this genotype (Figure 2B). A similarity in the bands detected in the pink and dark tomatoes was also found within different pericarp regions (Figure 2A,C), while the characteristic difference was observed in the yellow tomato in all the pericarp regions with the band at 1516 cm−1 (Figure 2B).

Figure 2.
Raman spectra of three tomato genotypes at different pericarp regions: (A)—pink, (B)—yellow, (C)—dark tomato.
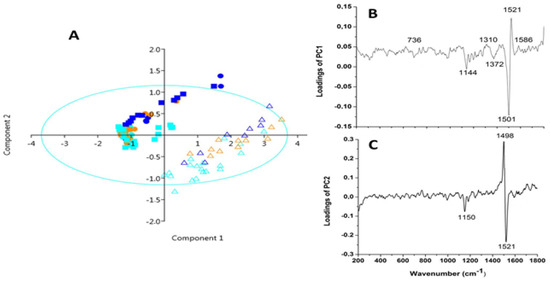
Multivariate analysis of Raman spectra (the score plot of PC1 versus PC2) showed a separation between the sample and described 76.65% of data variance. The score plot (Figure 3A) suggested the presence of two clusters along the PC1 axis related to differences between genotypes. The loading plot of the PC1 axis showed that the variables with the highest contribution corresponded to the signals at 1521 and 1501 cm−1 with the highest negative effects (Figure 3B). The signals at 1498 cm−1 with the highest positive impact and 1521 cm−1 along PC2 axis (Figure 3C) indicated the separation of the exocarp of the dark, pink and yellow tomatoes from endocarp and mesocarp of the yellow tomato.

Figure 3.
PCA of different pericarp regions in investigated tomato genotypes: (A) score plot, (B,C) loading plots. Circle—dark, square—pink, triangle—yellow tomato, endocarp—light blue, exocarp—royal blue, mesocarp—orange color.
4. Discussion
The morphological characteristics of fruits are very important factors in the consumer’s evaluation of the product. Regarding fruit height, pink tomato is classified as a large class (above 60 mm), while other tomatoes, yellow and dark, are medium-sized (50–60 mm) [4]. The literature data showed that the fruit shape most appreciated by consumers is slightly flattened, which was the case with tomato genotypes used in this study. Furthermore, the majority of consumers prefer large fruits (such as pink tomato), while only 7% of consumers prefer medium size [12].
Tomato fruit quality is determined by a combination of different attributes related to nutritional value and health characteristics that are highly genotypically dependent. Among selected genotypes, yellow tomato had the highest TSS content compared to others, followed by a high TTA percent, which indicated good fruit taste, associated with mild-flavored fruits, which is a desirable characteristic [13,14]. Furthermore, because of the highest TSS and pH of the fruit juice, this genotype showed the best characteristics regarding potential for industrial processing [15].
Antioxidative activity is an important health-promoting characteristic in tomato fruits. The yellow-tomato genotype was demonstrated the highest value of antioxidative activity, as well as high vitamin C content. According to Vela-Hinojosa et al. [16] genotypes with high vitamin C content could be candidates for improving tomato-breeding lines, which is the case with our yellow and dark tomatoes. The higher antioxidative activity in the yellow tomato compared to the dark could have been related to other components, such as lutein and phenolic compounds, since yellow-tomato genotypes have higher total phenolic content compared to other colored tomatoes [17,18]. Characteristic biochemical differences in the carotenoid content between genotypes were noticed; the highest value of lycopene was found in the pink tomato, whereas the highest level of β–carotene was found in the dark tomato. By contrast, the yellow-tomato genotype had the lowest content of both carotenoids, which was in correspondence with the literature, according to which yellow and orange tomatoes have less lycopene, phytoene and phytofluene compared to pink and red tomatoes [18,19,20].
All the tomato-fruit Raman profiles showed common three bands (~997, 1148 and ~1510 cm−1) associated with C-CH3 in-plane-rocking, C-C and C=C stretching, respectively [21,22,23,24]. However, the Raman spectra showed a shift at ~1510 cm−1, which could be related to the length of the conjugated polyene chain or other constituents bonded to carotenoids, which affect on the wavenumber of the vibrational band [23]. The bands with lower intensity in the pink and dark tomatoes were related to carotenoids, such as lycopene (at 646 cm−1) and β-carotene (at 1276 cm−1), as well as some phenolic compounds (at 1569 and 1628 cm−1) [6,25,26,27], but were not present in the yellow tomato, indicating a genotypic difference in antioxidant components. On the other hand, except for strong carotenoids, in the mesocarp and endocarp of yellow tomato, some bands related to sugars were noticed, such as glucose at 430 and 768–781 cm−1 and fructose at 625 cm−1 [27]. In exocarp on cuticular waxes, bands appeared 1307 cm−1, 1059 cm−1, 1336 cm−1, and 1731 cm−1, while the bands at 1447 and 1670 cm−1 were related to lipids and phenolic compounds, respectively [25,26].
The analyses of the loading spectrum of PC1 showed that the positive signals at 1521 cm−1 (high intensity, assigned as C=C vibration of carotenes), 1310 cm−1 (the lower intensity, directed to β-carotene), and 1586 cm−1 arise from the C-C vibration of phenolic compounds [26] were the most responsible for the difference between the yellow tomato and the others. The negative signal at 1501 cm−1 (mainly depending on phenolic compounds), together with the band at 1144 cm−1, indicated a difference among the genotypes [25]. According to PC2, the signals at 1499, 1521 and 1150 cm−1 were mostly responsible for the differentiation among the exocarp of all the genotypes from the endo- and mesocarp in the phenolic compounds and carotenoids, respectively [25,26].
5. Conclusions
The investigation of morphological and biochemical characteristics in different-colored tomatoes highlighted specific genotypic differences. A biochemical analysis indicated that the yellow-colored tomato had better-quality attributes related to the TSS/TTA ratio, pH and antioxidative activity compared to the others. Genotypic differences in biochemical components, such as carotenoids, were confirmed by Raman spectroscopy. The Raman spectral signatures in different pericarp regions showed that carotene and carbohydrates (hemicellulose and fructose) were present in all regions, while cuticular wax, lipids and phenolic compounds were detected only in the exocarp. The PCA results indicated that the yellow tomato mostly differed in the carotenoids in relation to the others, whereas the pink and dark differed from the yellow in terms of phenolic compounds, which highlighted the difference in antioxidative components, which were obtained by biochemical analysis. Furthermore, the exocarp of the pink, dark and yellow tomatoes differed in phenolic compounds, while the mesocarp and endocarp of the yellow tomatoes differed in the carotenoids. These results also indicate the advantage of using Raman spectroscopy for analysis and understanding of the distribution of biochemical and nutritional components in tomato fruits.
Author Contributions
Conceptualization, I.P. (Ivana Petrović), M.M. and I.P. (Ilinka Pećinar); methodology, I.P. (Ivana Petrović), M.M., I.P. (Ilinka Pećinar) and S.S.; Raman spectroscopy analysis and Raman data interpretation, I.P. (Ilinka Pećinar); writing—original draft preparation, I.P. (Ivana Petrović), M.M. and I.P. (Ilinka Pećinar); visualization, M.M.; writing—review and editing, Z.J. and R.S.; supervision, Z.J. All authors have read and agreed to the published version of the manuscript.
Funding
This study was supported by the Ministry of Education, Science and Technological Development of the Republic of Serbia (grant nos. 451-03-68/2022-14/200116 and 451-03-68/2022-14/200216).
Institutional Review Board Statement
Not applicable.
Informed Consent Statement
Not applicable.
Conflicts of Interest
The authors declare no conflict of interest.
References
- Grierson, D.; Kader, A.A. Fruit ripening and quality, physiology and biochemistry of ripening. In The Tomato Crop, a Scientific Basis for Improvement; Atherton, J.G., Rudich, J., Eds.; Chapman and Hall: London, UK, 1986; pp. 241–259. [Google Scholar]
- Adalid, A.M.; Roselló, S.; Nuez, F. Evaluation and selection of tomato accessions (Solanum section Lycopersicon) for content of lycopene, β-carotene and ascorbic acid. J. Food Compost. Anal. 2010, 23, 613–618. [Google Scholar] [CrossRef]
- Ibitoyea, D.O.; Kolawole, A.O.; Feyisolac, R.T. Assessment of wild tomato accessions for fruit yield, physicochemical and nutritional properties under a rain forest agroecology. Genet. Resour. 2020, 1, 1–11. [Google Scholar] [CrossRef]
- Peixoto, J.V.M.; Garcia, L.G.C.; Nascimento, A.D.R.; Moraes, E.R.D.; Ferreira, T.A.P.D.C.; Fernandes, M.R.; Pereira, V.D.A. Post-harvest evaluation of tomato genotypes with dual purpose. Food Sci. Technol. 2018, 38, 255–262. [Google Scholar] [CrossRef]
- Akpolat, H.; Barineau, M.; Jackson, K.A.; Akpolat, M.Z.; Francis, D.M.; Chen, Y.-J.; Rodriguez-Saona, L.E. High-Throughput Phenotyping Approach for Screening Major Carotenoids of Tomato by Handheld Raman Spectroscopy Using Chemometric Methods. Sensors 2020, 20, 3723. [Google Scholar] [CrossRef] [PubMed]
- Payne, W.Z.; Kurouski, D. Raman spectroscopy enables phenotyping and assessment of nutrition values of plants: A review. Plant Methods 2021, 17, 78. [Google Scholar] [CrossRef]
- Stevens, R.; Buret, M.; Garchery, C.; Carretero, Y.; Causse, M. Technique for Rapid, Small-Scale Analysis of Vitamin C Levels in Fruit and Application to a Tomato Mutant Collection. J. Agric. Food Chem. 2006, 54, 6159–6165. [Google Scholar] [CrossRef] [PubMed]
- Kuti, J.O.; Konuru, B.H. Effects of genotype and cultivation environment on lycopene content in red-ripe tomatoes. J. Sci. Food Agric. 2005, 85, 2021–2026. [Google Scholar] [CrossRef]
- Re, R.; Pellegrini, N.; Proteggente, A.; Pannala, A.; Yang, M.; Rice-Evans, C. Antioxidant activity applying an improved ABTS radical cation decolorization assay. Free Radic. Biol. Med. 1999, 26, 1231–1237. [Google Scholar] [CrossRef]
- Hammer, Ø.; Harper, D.A.; Ryan, P.D. PAST: Paleontological statistics software package for education and data analysis. Palaeontol. Electron. 2001, 4, 9. [Google Scholar]
- Menges, F. Spectragryph Optical Spectroscopy Software, Version 1.2.14. Available online: http://www.effemm2.de/spectragryph/ (accessed on 27 December 2021).
- Lázaro, A. Tomato landraces: An analysis of diversity and preferences. Plant Genetic Resources: Characterization and Utilization. Plant Genet Resour. 2018, 16, 315–324. [Google Scholar] [CrossRef]
- Helyes, L.; Pék, Z.; Lugasi, A. Function of the variety technological traits and growing conditions on fruit components of tomato (Lycopersicon Lycopersicum L. Karsten). Acta Aliment. 2008, 37, 427–436. [Google Scholar] [CrossRef]
- Pestorić, V.M.; Mastilović, S.J.; Kevrešan, Ž.S.; Pezo, L.L.; Belović, M.M.; Glogovac, S.K.; Škrobot, D.J.; Ilić, N.I.; Takač, A.T. Artificial neural network model in predicting the quality of fresh tomato genotype. Food Feed Res. 2021, 48, 9–21. [Google Scholar] [CrossRef]
- Aykas, D.P.; Rodrigues Borba, K.; Rodriguez-Saona, L.E. Non-Destructive Quality Assessment of Tomato Paste by Using Portable Mid-Infrared Spectroscopy and Multivariate Analysis. Foods 2020, 9, 1300. [Google Scholar] [CrossRef]
- Vela-Hinojosa, C.; Escalona-Buendía, H.B.; Mendoza-Espinoza, J.A.; Villa-Hernández, J.M.; Lobato-Ortiz, R.; Rodríguez-Pérez, J.E.; Pérez-Flores, L.J. Antioxidant Balance and Regulation in Tomato Genotypes of Different Color. J. Am. Soc. Hortic Sci. 2018, 144, 45–54. [Google Scholar] [CrossRef]
- Chang, C.-H.; Liu, Y.-C. Study on Lycopene and Antioxidant Contents Variations in Tomatoes under Air-Drying Process. J. Food Sci. 2007, 72, 532–540. [Google Scholar] [CrossRef] [PubMed]
- Georgé, S.; Tourniaire, F.; Gautier, H.; Goupy, P.; Rock, E.; Caris-Veyrat, C. Changes in the contents of carotenoids, phenolic compounds and vitamin C during technical processing and lyophilisation of red and yellow tomatoes. Food Chem. 2011, 124, 1603–1611. [Google Scholar] [CrossRef]
- Walia, S.; Singh, M.; Kaur, C.; Kumar, R.; Joshi, S. Antioxidant Composition of Red and Orange Cultivars of Tomatoes (Solanum lycopersicon L.): A Comparative Evaluation. J. Plant Biochem. Biotechnol. 2009, 19, 95–97. [Google Scholar] [CrossRef]
- Flores, P.; Sánchez, E.; Fenoll, J.; Hellín, P. Genotypic variability of carotenoids in traditional tomato cultivars. Food Res. Int. 2017, 100, 510–516. [Google Scholar] [CrossRef] [PubMed]
- Schulz, H.; Baranska, M.; Baranski, R. Potential of NIR-FT-Raman spectroscopy in natural carotenoid analysis. Biopolym. Orig. Res. Biomol. 2005, 77, 212–221. [Google Scholar] [CrossRef]
- Schulz, H.; Schütze, W.; Baranska, M. Fast determination of carotenoids in tomatoes and tomato products by Raman spec-troscopy. In Proceedings of the IV International Conference on Managing Quality in Chains-The Integrated View on Fruits and Vegetables Quality, Bangkok, Thailand, 7–10 August 2006; Volume 712, pp. 901–906. [Google Scholar]
- de Oliveira, V.E.; Castro, H.V.; Edwards, H.G.; de Oliveira, L.F.C. Carotenes and carotenoids in natural biological samples: A Raman spectroscopic analysis. J. Raman Spectrosc. 2010, 41, 642–650. [Google Scholar] [CrossRef]
- Pećinar, I. Raman Microscopy in Plant Science, Carotenoids Detection in Fruit Material. In Application of Molecular Methods and Raman Microscopy/Spectroscopy in Agricultural Sciences and Food Technology; Vucelić-Radović, B., Lazić, D., Nikšić, M., Eds.; Ubiquity Press: London, UK, 2019; pp. 177–186. [Google Scholar] [CrossRef]
- Prats Mateu, B.; Hauser, M.T.; Heredia, A.; Gierlinger, N. Waterproofing in Arabidopsis: Following phenolics and lipids in situ by confocal Raman microscopy. Front Chem. 2016, 4, 10. [Google Scholar] [CrossRef] [PubMed]
- Trebolazabala, J.; Maguregui, M.; Morillas, H.; de Diego, A.; Madariaga, J.M. Portable Raman spectroscopy for an in-situ monitoring the ripening of tomato (Solanum lycopersicum) fruits. Spectrochim. Acta A Mol. Biomol. Spectrosc. 2017, 180, 138–143. [Google Scholar] [CrossRef] [PubMed]
- Sharma, S.; Uttam, R.; Bharti, A.S.; Shukla, N.; Uttam, K.N. Label-free mapping of the biochemicals in tomato fruit by confocal Raman microspectroscopy. Natl. Acad. Sci. Lett. 2019, 42, 365–368. [Google Scholar] [CrossRef]
Publisher’s Note: MDPI stays neutral with regard to jurisdictional claims in published maps and institutional affiliations. |
© 2022 by the authors. Licensee MDPI, Basel, Switzerland. This article is an open access article distributed under the terms and conditions of the Creative Commons Attribution (CC BY) license (https://creativecommons.org/licenses/by/4.0/).