Proceeding Paper

Phytochemical and Antioxidant Properties of Athamanta turbith (L.) Brot Collected from Serbia †

by
Sofija N. Kilibarda
1,*,
Sandra Z. Vuković
1,
Danijel D. Milinčić
1,
Marina P. Mačukanović-Jocić
1,
Snežana Jarić
2 and
Aleksandar Ž. Kostić
1
1
Faculty of Agriculture, University of Belgrade, Nemanjina 6, 11080 Belgrade, Serbia
2
Institute for Biological Research “Siniša Stanković”-National Institute of Republic of Serbia, University of Belgrade, Bulevar Despota Stefana 142, 11060 Belgrade, Serbia
*
Author to whom correspondence should be addressed.
Presented at the 2nd International Electronic Conference on Plant Sciences—10th Anniversary of Journal Plants, 1–15 December 2021; Available online: https://iecps2021.sciforum.net/.
Biol. Life Sci. Forum 2022, 11(1), 30; https://doi.org/10.3390/IECPS2021-11947
Published: 30 November 2021

Abstract

:
Athamanta turbith (L.) Brot. is the endemic flowering plant from the Apiaceae family originated from Đetinja Canyon (Serbia). The aim of this study was to determine the content of selected plant bioactive compounds present in rhizome, vegetative shoot, and inflorescence. Extraction was performed in 80% methanol as a solvent with two different approaches: powdered plant material was extracted with solvent for 3 h in ratio 1:10 without (classical solvent extraction, SE,) and with application of ultrasound (ultrasound-assisted extraction, UAE). Analysis of total phenolic content (TPC), total flavonoid content (TFC) and total hydroxycinnamic acid derivative content (HCA) was performed via spectrophotometric methods. The inflorescence had the highest TPC in UAE obtained-extract (2.73 ± 0.13 mg GAE/g), as well as the highest TFC (1.56 ± 0.02 mg/g QE) and HCA (1.45 ± 0.11 mg/g CGAE) in SE-prepared extract where GAE, QE and CGAE are gallic acid equivalents, quercetin equivalents and chlorogenic acid equivalents respectively. The lowest amount of TPC, TFC and HCA was detected in the rhizome regardless of extraction methods. Additionally, antioxidant properties of extracts were determined with five assays: ABTS·+, DPPH·, ferric reducing power (FRP), in vitro phosphomolybdenum total antioxidant capacity (TAC), and cupric reducing antioxidant capacity (CUPRAC). The inflorescence had the highest antioxidant activity in both quencher assays (at γ = 0.1 g/mL) with 92.1% of inhibition for ABTS·+ (UAE extract,) and 77.7% inhibition of DPPH· (for both extracts). In addition, it exhibited the highest FRP (18.4 mg/g AAE, SE extract and CUPRAC (~40 mg/g AAE for both extracts) values where AAE stands for ascorbic acid equivalents, whereas the rhizome had the lowest values for all antioxidant assays concerning both SE and UEA. In conclusion, exhibited antioxidant properties are mostly in line with the determined content of selected bioactive compounds. Further statistical analysis is applied to confirm/oppose this.

1. Introduction

Plants are a remarkable source of different bioactive compounds with proved antioxidant properties. In order to obtain valuable natural compounds from plants it is important to apply adequate extraction procedures including appropriate solvents as well as extraction techniques. Among several procedures classical solvent extraction (SE) and ultrasound-assisted extraction (UAE) stand out as the most present. It is proven that UAE can improve extraction yield of different plant bioactive compounds such as carotenoids [1] and/or phenolics [2]. Recently there has been a trend of examining endemic plants as novel valuable sources of different bioactives. Among them is Athamanta turbith (L.) Brot., flowering plant from the Apiaceae family that grows in Đetinja Canyon. River Đetinja springs on the slopes of Tara Mountain, near village Kremna in Western Serbia (Figure 1). This distinguished area has great historical, cultural, geological, ecological and biological importance. A. turbith L. prefers chalky, dry soils and gravel, which are exposed to sun. The average height of the plant is 30 cm. Stems are branched, bright green leaves are triangular, two to four times pinnated. In summer months, this lithophyte forms inflorescences that belong to compound umbel type with tiny, white, star-shaped flowers as shown in Figure 1.
In the literature there is still a lack of data about phytochemical analysis for this plant. Accordingly, the main objective of this study was to determine the content of selected bioactive compounds present in three distinct plant parts—rhizome, vegetative shoot, and inflorescence by application of usual spectrophotometric methods. For this purpose, two extraction techniques were performed: solvent extraction (SE) and ultrasound-assisted extraction (UAE) in order to obtain maximal yield of bioactive compounds. After that, antioxidant properties of prepared extracts were analyzed and correlated with determined bioactive compounds of A. turbith L.

2. Material and Methods

Plant material (rhizome, vegetative shoot, and inflorescence) of A. turbith was collected from Djetinja Canyon (western Serbia) and further used to prepare extracts.

2.1. Preparation of Extracts

Extraction was performed in 80% methanol as the solvent (plant material: solvent ratio, 1:10) with two different approaches: without (classical solvent extraction, SE) and with application of ultrasound (ultrasound-assisted extraction, UAE). In the case of SE, samples were placed in plastic cuvettes, soaked with solvent, and intensively shaken with protection from light, at room temperature. For UAE, samples were prepared in the same way and then sonicated in an ultrasonic bath (VAB SB 3 LD, maximum power 440 W, operating frequency 40 Hz) at maximum frequency (40 Hz), at room temperature. The extracts were filtered through suitable filter paper. Obtained supernatants were left in a dark place, at 4 °C until further analysis.

2.2. Determination of Bioactive Compounds

Total phenolic content (TPC). Determination of TPC was performed using standard Folin-Ciocalteu (FC) method [3]. After that, the reaction mixtures were intensively vortexed and left in the dark, at room temperature, for 90 min. The absorbance was measured at 765 nm. Quantification was done on the basis of the calibration curve of gallic acid (GA). Results were expressed as mg of gallic acid equivalents (GAE) per g of dry weight (DW).
Total flavonoid content (TFC). TFC was estimated using common AlCl3 method [4]. After a 10 min mixture incubation at room temperature, absorbance was measured against the blank (blank = acidified methanol) at 430 nm. The flavonoid content was determined using quercetin as the standard and the obtained results were expressed as mg of quercetin equivalent (QE) per g of dry sample weight.
Total dihydroxycinnamic acid derivates (HCAs). Total HCA content was determined by application of standard Arnow’s reagent [5], with a slight modification. In a 2 mL plastic tube, there were added: 0.2 mL of plant extract, 0.4 mL of 0.5 M HCl, 0.4 mL of Arnow’s reagent, 0.4 mL of 2.215 M NaOH and 0.6 mL of distilled H2O. Blank was prepared by replacing 0.2 mL plant extract with distilled water. After that, the reaction mixtures were intensively vortexed and left in the dark, at room temperature, for 20 min. The absorbance was measured at 525 nm. Chlorogenic acid (CGA) was used as standard for the calibration curve. Total HCA content was expressed as mg of CGA equivalents (CGAE) per g of DW.

2.3. Determination of Antioxidant Activity

DPPH. and ABTS+ assays. The free radical scavenging activity of plant extracts was tested by DPPH. scavenging assay [6]. Briefly, 105 µL of extracts were mixed with 840 µL of 150 µM DPPH. solution. The reaction mixture was well vortexed and left in the dark at room temperature. After 30 min the absorbance was measured spectrophotometrically at 515 nm. Antioxidant activity of plant extracts is reflected through the decolorization of purple DPPH. solution compared to the blank. For ABTS·+ quenching ability determination 500 µL of plant extract was mixed with 1 mL of green ABTS·+ solution and well vortexed [7]. After a 7-min incubation of reaction mixture in dark place, the absorbance was measured, against the blank at 734 nm. For both assays the percentage inhibition of radicals caused by the action of plant phytochemicals was calculated by using the following equation:
% inhibition = [Ab − As]/Ab ∗ 100
Ab—the absorbance of blank; As—the absorbance of the sample extracts.
TAC assay. Total antioxidant capacity (TAC) was determined spectrophotometrically [8]. Namely, 0.3 mL of plant extract was mixed with 3 mL of phospho-molybdate reagent. The reaction mixtures were heated for 90 min at 95 °C to complete the reaction. After cooling reaction mixtures at room temperature, the absorbance was measured at 695 nm. Ascorbic acid (AA) was used as the standard and the obtained results were expressed as mg of ascorbic acid equivalents (AAE) per g of DW.
FRP assay. For ferric reducing power (FRP) assay [9] 0.5 mL of plant extract, 0.5 mL of 0.2 M sodium phosphate buffer (pH 6.6) and 0.5 mL of 1% potassium ferricyanide, were mixed in a glass tube. The reaction mixtures were incubated at 50 °C, for 20 min. Then 0.5 mL of 10% trichloroacetic acid was added and the total mixture was centrifuged (4000× g) for 5 min. Next, 1.5 mL of clear supernatant was withdrawn from glass tube and mixed with 1.5 mL of distilled water and 0.3 mL of 0.1% of ferric chloride. The absorbance of colored solutions was measured at 700 nm. The calibration curve was prepared with ascorbic acid as the standard and the results were expressed as mg of ascorbic acid equivalents (AAE) per g of DW.
CUPRAC assay. Cupric ion antioxidant capacity (CUPRAC) assay was conducted by the spectrophotometric method [10]. Briefly, 0.35 mL of plant extract, 0.35 mL of 0.01 M CuCl2, 0.35 mL of 0.0075 M neocuproine solution (previously dissolved in concentrated absolute ethanol), 0.350 mL 1 M ammonium acetate buffer solution were mixed in a plastic tube. The reaction mixtures were left in the dark for 30 min and then the absorbance of solutions was read at 450 nm. Ascorbic acid (AA) was used to set up the standard curve. The obtained results were expressed as mg of ascorbic acid equivalents (AAE) per g of dry sample weight.

2.4. Statistics

All assays were carried out in triplicate (n = 3). The results were shown as means ± standard deviation (SD). Statistical analyses of the data were performed using the STATISTICA 12.0. Statistical significance was evaluated employing Tukey’s test. Differences were considered significant at p < 0.05. Correlation analysis between analyzed phenolic classes and antioxidant properties, that is, between different types of extraction for specific part of investigated A. turbith plant was evaluated using Pearson’s correlation coefficient (r), at p < 0.01.

3. Results and Discussion

3.1. Phytochemical Composition

The content of total phenolics (TPC), total flavonoids (TFC) and total dihydroxycinnamic acid derivatives (HCAs) observed in rhizome, vegetative shoot, and inflorescence extracts of A. turbith is shown in Table 1. The inflorescence had the highest TPC in UAE obtained-extract, as well as the highest TFC and HCA in SE-prepared extract. The obtained results are in line with literature where it was reported that flower of Apiaceae plants had higher TPC compared to vegetative parts and rhizome [11]. In general, the extract of inflorescence obtained by UAE had significantly higher (p < 0.05) content of TPC and TFC than extract obtained by SE. However, there was no significant difference in the content of HCAs, achieved in the inflorescence, for both extracts. The lowest amount of TPC and HCAs was detected in the rhizome regardless of the extraction methods (p < 0.05), while the flavonoids were not detected.
Antioxidant properties of A. turbith extracts determined with five assays: ABTS·+, DPPH·, ferric reducing power (FRP), in vitro phosphomolybdenum total antioxidant capacity (TAC) and cupric reducing antioxidant capacity (CUPRAC) are shown in Table 2.
The inflorescence had the highest antioxidant activity in both quencher assays (at γ = 0.1 g/mL) with 92.1% of inhibition for ABTS·+ (UAE extract,) and 77.7% inhibition of DPPH· (for both extracts). In addition, it exhibited the highest FRP (18.4 mg/g AAE, SE extract), CUPRAC (~40 mg/g AAE for both extracts) and TAC (~35 mg/g AAE for both extracts). The inflorescence extracts obtained by SE and UAE show a statistically significant difference (p < 0.05) between antioxidant activity, only in the ABTS·+ and FRP assays. The rhizome had the lowest values for all antioxidant assays concerning both SE and UEA. Differences in antioxidant activity between SE and UAE-obtained rhizome extracts were statistically significant (p < 0.05) for ABTS·+ and DPPH. assays.

3.2. Correlation Analysis

Correlation analysis showed a significant (p < 0.01) positive correlation between TPC and CUPRAC (r = 0.95); while TFC showed a positive correlation between DPPH. (r = 0.96), FRP (r = 0.92) and CUPRAC (r = 0.98). Further, HCAs show positive correlation with DPPH. (r = 0.92) and CUPRAC (r = 0.98). Based on the correlation results, it can be concluded that extracted dyhidrocinnamic acid derivatives and flavonoids from different parts of the plant, together or individually show good cupric reducing capacity (CUPRAC), while, on the other hand, only flavonoids contribute to effective ferric reducing capacity (FRP). In addition, individual flavonoids and dyhidrocinnamic acid derivatives of plant rhizome, vegetative shoot, and inflorescence, have good hydrogen donor properties and effective DPPH. scavenging capacity. Furthermore, CUPRAC significantly correlated with other antioxidant assays such as FRP (r = 0.94), DPPH. (r = 0.94), and TAC (r = 0.95). This may mean that the same phenolic compounds or phenolic compounds which possess the same mechanism of antioxidant action (extracted with SE and UAE), contribute to the strong correlation of CUPRAC with the above methods. However, based on analyzed phenolic classes and antioxidant properties, both types of extraction (solvent and ultrasound-assisted extraction) strongly correlate for each part of the plant individually (rhizome, vegetative shoot, and inflorescence), which means that both methods can potentially be used to extract phenolics from different parts of the A. turbith plant, without significant differences in the content of different phenolic classes and antioxidant properties.

4. Conclusions

Phytochemical analysis of different parts of A. turbith revealed distinctions in phenolic composition with inflorescence as the best source of bioactive compounds. There was no clear influence of ultrasound assisted extraction on the content of total phenolics, flavonoids and dyhydroxicinnamic acid derivatives. All examined extracts exhibited singificant antioxidant activity examined through five different assays. Correlation analysis confirmed strong connection between phenolics (flavonoids and dyhydroxicinnamic acid derivatives, in particular) and several antioxidant assays such as CUPRAC and DPPH. assays.

Supplementary Materials

The following are available online at https://sciforum.net/manuscripts/11947/slides.pdf.

Author Contributions

Conceptualization, A.Ž.K. and S.N.K.; methodology, A.Ž.K.; formal analysis, D.D.M.; resources, S.J. and M.P.M.-J.; writing, S.Z.V.; writing—review and editing, S.N.K. All authors have read and agreed to the published version of the manuscript.

Funding

This research received no external funding.

Acknowledgments

This work was supported by the Ministry of Education, Science, and Technological Development of the Republic of Serbia (Grant No. 451-03-9/2021-14/200116).

Conflicts of Interest

The authors declare no conflict of interest.

References

  1. Alcántara, C.; Žugčić, T.; Abdelkebir, R.; García-Pérez, J.V.; Režek Jambrak, A.; Lorenzo, J.M.; Collado, M.C.; Granato, D.; Barba, F.J. Effects of ultrasound-assisted extraction and solvent on the phenolic profile, bacterial growth, and anti-inflammatory/antioxidant activities of Mediterranean olive and fig leaves extracts. Molecules 2020, 25, 1718. [Google Scholar] [CrossRef] [PubMed] [Green Version]
  2. Berkani, F.; Serralheiro, M.L.; Dahmoune, F.; Ressaissi, A.; Kadri, N.; Remini, H. Ultrasound assisted extraction of phenolic compounds from a jujube by-product with valuable bioactivities. Processes 2020, 8, 1441. [Google Scholar] [CrossRef]
  3. Ng, A.; Parker, M.L.; Parr, A.J.; Saunders, P.K.; Smith, A.C.; Waldron, K.W. Physicochemical characteristics of onion (Allium cepa L.) tissues. J. Agric. Food Chem. 2000, 48, 5612–5617. [Google Scholar] [CrossRef] [PubMed]
  4. Santas, J.; Carbo, R.; Gordon, M.; Almajano, M. Comparison of the antioxidant activity of two Spanish onion varieties. Food Chem. 2008, 107, 1210–1216. [Google Scholar] [CrossRef]
  5. Fraisse, D.; Felgines, C.; Texier, O.; Lamaison, J.-L. Caffeoyl derivatives: Major antioxidant compounds of some wild herbs of the Asteraceae family. Food Nutr. Sci. 2011, 2, 181–192. [Google Scholar] [CrossRef]
  6. Gawron-Gzella, A.; Królikowska, A.; Pietrzak, M. Antioxidant activity of teas obtained from leaves of Camellia sinensis (L.) Kuntze in course of various production processes available on Polish market. Herba Pol. 2018, 64, 60–67. [Google Scholar] [CrossRef] [Green Version]
  7. Rajurkar, S.N.; Hande, M.S. Estimation of phytochemical content and antioxidant activity of some selected traditional Indian medicinal plants. Indian J. Pharm. Sci. 2011, 73, 146–151. [Google Scholar] [CrossRef] [Green Version]
  8. Prieto, P.; Pineda, M.; Aguilar, M. Spectrophotometric quantitation of antioxidant capacity through the formation of a phosphomolybdenum complex: Specific application to the determination of vitamin E. Anal. Biochem. 1999, 269, 337–341. [Google Scholar] [CrossRef] [PubMed]
  9. Nibir, Y.M.; Sumit, A.F.; Akhand, A.A.; Ahsan, N.; Hossain, M.S. Comparative assessment of total polyphenols, antioxidant and antimicrobial activity of different tea varieties of Bangladesh. Asian Pac. J. Tropic. Biomed. 2017, 7, 352–357. [Google Scholar] [CrossRef]
  10. Apak, R.; Güçlü, K.; Özyürek, M.; Çelik, S.E. Mechanism of antioxidant capacity assays and the CUPRAC (cupric ion reducing antioxidant capacity) assay. Microchim. Acta 2008, 160, 413–419. [Google Scholar] [CrossRef]
  11. Sayed-Ahmad, B.; Talou, T.; Saad, Z.; Hijazi, A.; Merah, O. The Apiaceae: Ethnomedical family as source for industrial uses. Ind. Crop. Prod. 2017, 109, 661–671. [Google Scholar] [CrossRef] [Green Version]
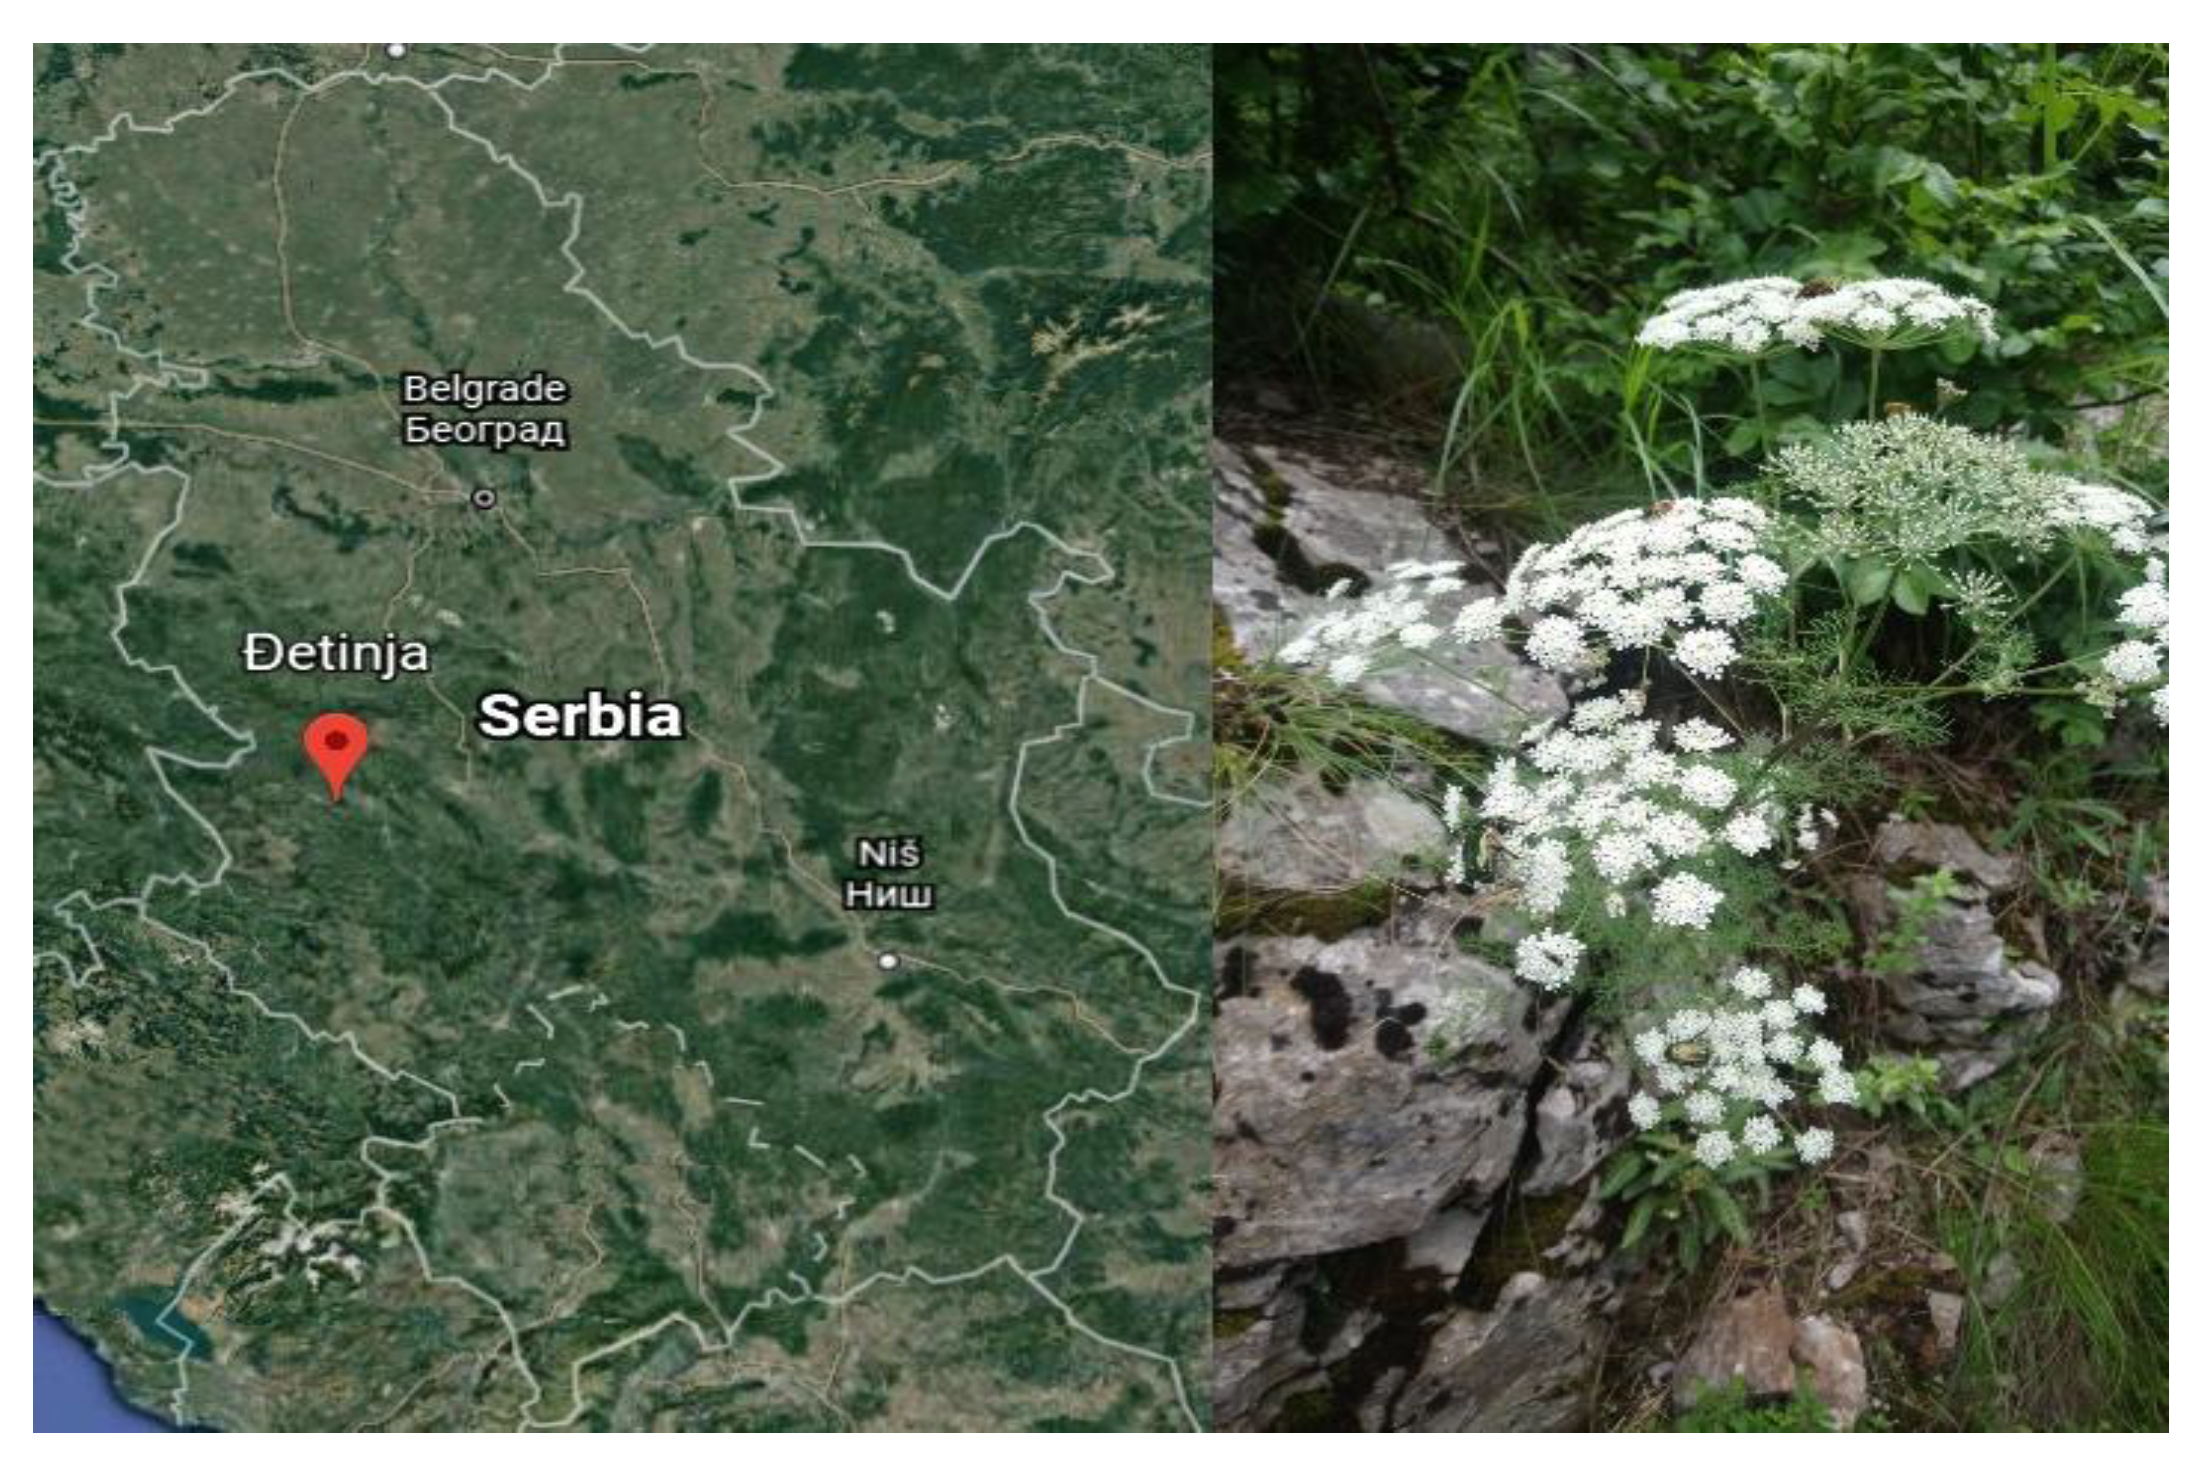
Figure 1. Location of Djetinja Canyon (left) and Athamanta turbith L. Brot (right).
Blsf 11 00030 g001
Table 1. Phytochemical composition of Athamanta turbith.
SampleExtraction TechniqueTPC *
(mg/g GAE)
TFC
(mg/g QE)
HCAs
(mg/g CGAE)
InflorescenceUAE2.73 ± 0.13 a,**1.36 ± 0.02 a1.41 ± 0.004 a
SE1.95 ± 0.15 b1.56 ± 0.02 b1.45 ± 0.11 a
Vegetative shootUAE1.06 ± 0.02 c0.70 ± 0.002 c1.07 ± 0.009 b
SE0.87 ± 0.01 c0.53 ± 0.05 d0.85 ± 0.008 c
RhizomeUAE0.37 ± 0.03 dn.d.0.71 ± 0.00 d
SE0.40 ± 0.01 dn.d.0.66 ± 0.00 d
* TPC—total phenolic content; TFC—total flavonoid content; HCA—total dyhydroxicinnamic acid derivative content; GAE—gallic acid equivalents; QE—quercetin equivalents; CGAE—chlorogenic acid equivalents; n.d.—not detected. ** Different superscript letters (a–d) in a same column indicate significant differences at p < 0.05.
Table 2. Antioxidant properties of A. turbith extracts.
SampleExtraction TechniqueABTS+ *
(% inh.)
DPPH
(% inh.)
TAC
(mg/g AAE)
CUPRAC
(mg/g AAE)
FRP
(mg/g AAE)
InflorescenceUAE51.43 ± 0.06 a,**77.68 ± 0.55 a3.60 ± 0.07 a39.15 ± 3.03 a11.06 ± 0.52 a
SE92.11 ± 0.48 b77.77 ± 0.57 a3.53 ± 0.29 a41.83 ± 1.29 a18.37 ± 1.70 b
Vegetative shootUAE23.67 ± 0.00 c33.86 ± 0.14 b1.75 ± 0.00 b12.52 ± 1.10 b1.59 ± 0.09 c,d
SE34.00 ± 0.06 d50.34 ± 0.41 c1.54 ± 0.01 b8.42 ± 1.03 b3.33 ± 0.30 c
RhizomeUAE13.91 ± 0.13 e10.00 ± 0.17 d1.72 ± 0.14 bn.d.0.46 ± 0.06 d
SE9.14 ± 0.66 f5.67 ± 0.31 e1.78 ± 0.007 bn.d0.46 ± 0.05 d
* ABTS+—2,2′-Azino-bis(3-ethylbenzothiazoline-6-sulfonic acid) radical cation; DPPH—2,2-diphenylpicrylhydrazyl cation; TAC—total antioxidant capacity determined via in vitro phosphomolybdenum assay; CUPRAC—Cupric Reducing Antioxidant Capacity; FRP—Ferric Reducing Power; AAE—ascorbic acid equivalents. ** Different superscript letters (a–f) in a same column indicate significant differences at p < 0.05.
Publisher’s Note: MDPI stays neutral with regard to jurisdictional claims in published maps and institutional affiliations.