Article

Operating a Positive Temperature Coefficient Water Heater Powered by Photovoltaic Panels

1
Alaska Center for Energy and Power, University of Alaska Fairbanks, Fairbanks, AK 99775, USA
2
Pordis LLC, Austin, TX 78729, USA
*
Author to whom correspondence should be addressed.
These authors contributed equally to this work.
Solar 2025, 5(3), 42; https://doi.org/10.3390/solar5030042
Submission received: 8 July 2025 / Revised: 2 August 2025 / Accepted: 27 August 2025 / Published: 3 September 2025
(This article belongs to the Topic Advances in Solar Heating and Cooling)

Abstract

Domestic water heaters traditionally use natural gas or electric resistance to heat stored water. A gas water heater relies on a non-renewable resource, while an electric water heater might rely on electricity generated by a non-renewable resource. This study analyzes the performance of an electric water heater featuring a novel heating element design based on a positive temperature coefficient (PTC) material powered directly by solar photovoltaic (PV) modules in a northern latitude installation. The project analyzes the operation of two different design temperatures of the PTC heating elements (50 °C, and 70 °C) when fed by three solar PV panels during the spring in the high-latitude location of Anchorage, Alaska (61.2° N). Our results show that both design temperatures of the PTC heating elements are able to achieve self-regulation at a sufficient and safe operating temperature for a domestic use case. Analysis of water heater performance directly connected to PV power showed that the PTC-equipped water heater had a limited period of heating when sufficient solar irradiance is available. Because of this, restrictive use of the water heater might be necessary during periods of non-daylight hours to preserve hot water in an insulated tank. However, this PV-to-PTC setup could be effectively used in industrial, commercial, and research settings.

1. Introduction

The storage water heater, the type most familiar to the populace, was patented by Rudd in the 1930s using a gas fuel source [1], with an operating principal that remains relevant: cyclic heating to maintain a specified water temperature. Today’s domestic water heaters traditionally use either natural gas or electric resistance to heat stored water employing the same principle. According to Roden, gas-powered water heater installations have reliably outpaced electric units since the 1960s [1], although the recent interest in instantaneous (on-demand) water heaters may shift this balance. While gas water heaters consume a nonrenewable resource, electric water heaters can use renewable and zero/low-emission resources depending on local power generation methods and may be less expensive to operate. However, the electricity used to operate an electric water heater itself might be generated by a nonrenewable resource, such as liquefied natural gas or coal. A truly renewable-powered storage water heater would couple electric heating directly to a renewable resource such as solar photovoltaic (PV) modules.
The advent of wide-scale electrical resistance heating in a domestic setting can be traced back to approximately 1888, when heating devices primarily relied on platinum resistance wires [2,3]. Early electric water heating efforts are traced to Ougrimoff who, prior to 1905, developed a water heater employing an electric arc [2]. However, electrical resistance heating first saw widespread use in the manufacturing industry of the early 1900s after the invention of ohmically stable and oxidation-resistant nickel–chromium alloys, often termed nichrome, by Marsh in 1906 [4]. Nichrome wire resistance remains nearly constant through high temperatures [3]. This stable resistance requires frequent cycling of electrical power to maintain temperature control, just as gas-fueled devices cycle a burner, creating complex and less reliable systems. Fortunately, an alternative heating technology exists that requires no power inversion or control devices, hence no cyclic operation, where thermal self-regulation is intrinsic in the material system employed.
In 1955, researchers at Philips discovered that polycrystalline N-type doped barium titanate (BaTiO3) exhibited a marked increase in resistivity as the temperature increased past the Curie temperature (TC) [5], described as a positive temperature effect, later to be generally known as having a positive temperature coefficient (PTC). PTC heaters made from ceramics like doped barium titanate act as thermally sensitive semiconducting resistors whose properties depend significantly on the ceramic’s morphology [6], dopant ratios [7,8], and cooling rate during manufacture [5]. These heaters maintain a relatively stable low resistance below the distinct transition temperature, TC, due to conductive grain boundaries; above TC, resistance increases exponentially. This unique property arises due to a structural phase transition from ferroelectric (tetragonal) to paraelectric (cubic) crystal structure as the temperatures rises through TC [9]. A detailed description of these effects is beyond the scope of this article but may be found in the listed references.
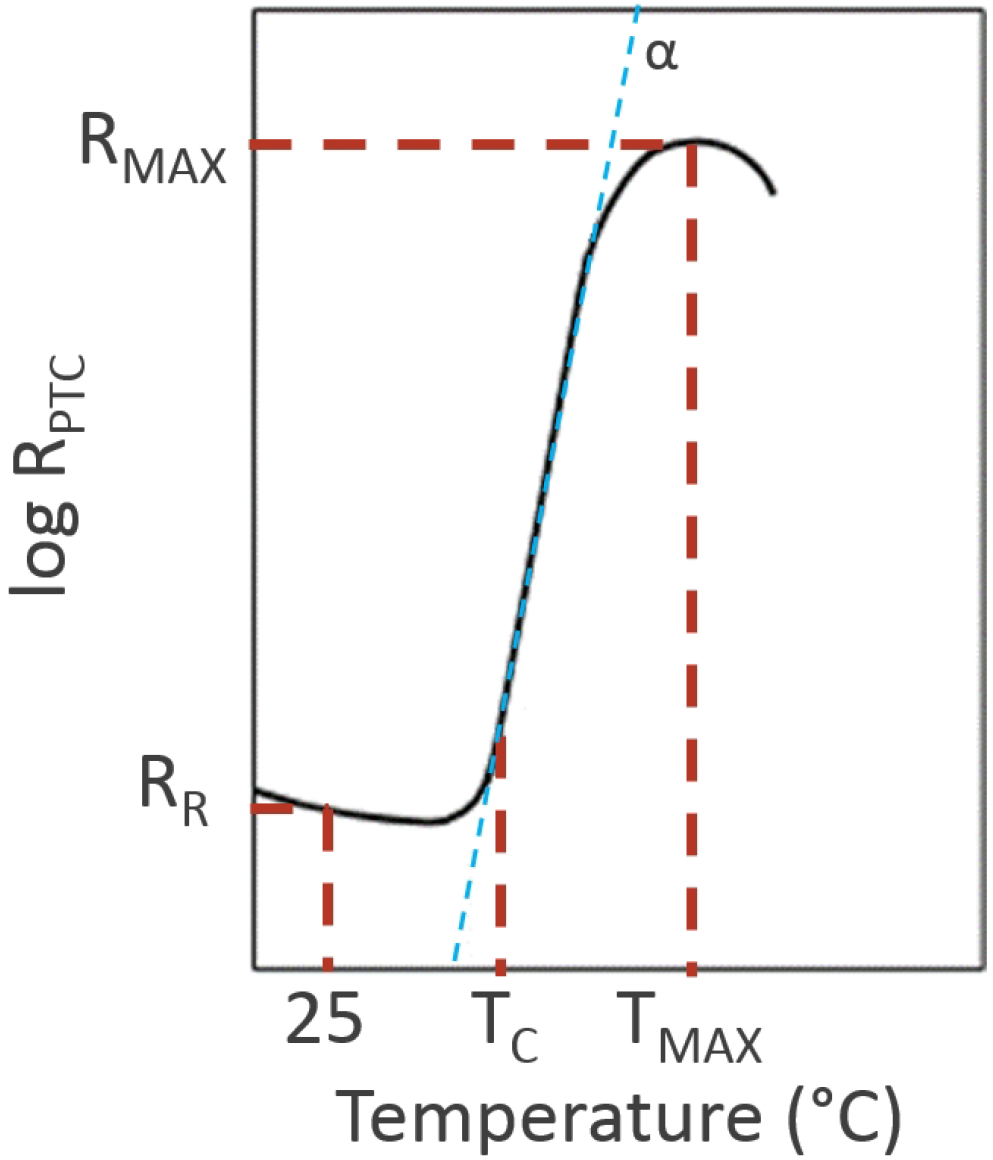
In a heating application, the increase in resistance limits current flow, thus preventing overheating. This self-regulation eliminates the need for additional control or switching electronics, ensuring safe operation. Modern uses of PTC elements include thermistors, over current protection devices, and point-of-use heaters, amongst others [10,11]. One manufacturer attributes freeze protection in standard-alone outdoor equipment such as ATMs and fuel pumps as a significant portion of their PTC heater sales [12]. The typical behavior of a PTC device is shown in Figure 1, adapted from [5].
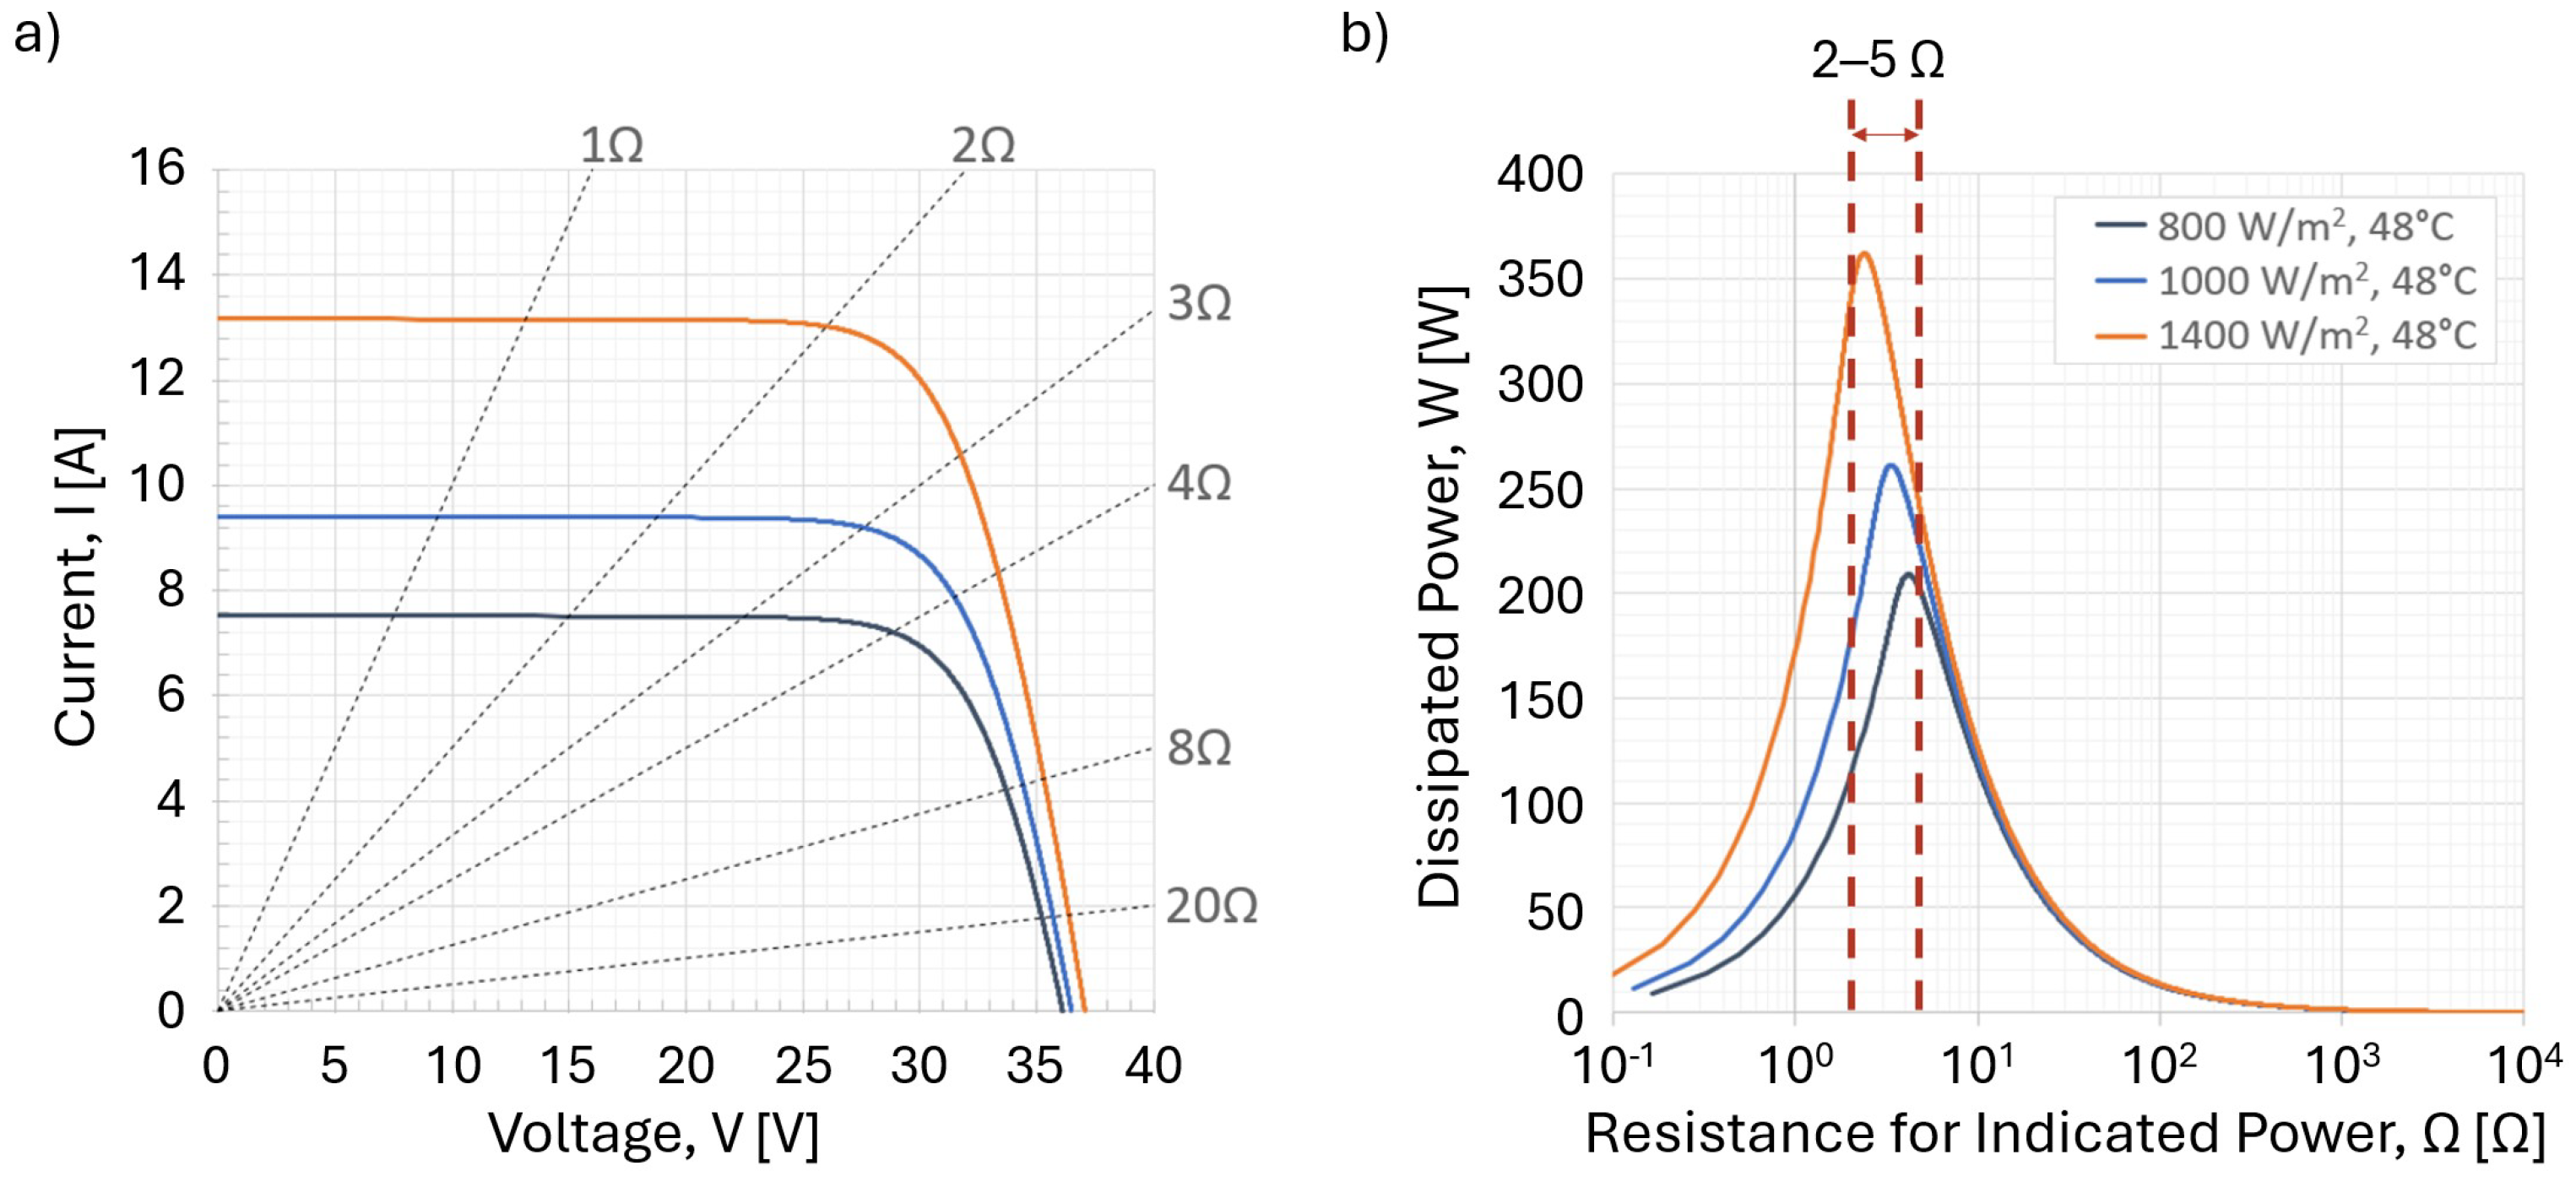
For a single PV module, maximum energy is produced at the maximum power point of its current–voltage (I-V) curve. By matching the nominal resistance of the PTC heater to the calculated maximum power resistance of the connected PV module, electrical-to-heat energy conversion should be optimized. Historical data from over 850 module specification sheets indicate that the optimal standard test condition (STC; 1000 W/m2, 25 °C) resistance of silicon modules has remained stable over 26 years, between 2 Ω and 5 Ω for the most common cell architectures (Al-BSF, PERC, TOPCon) [13], shown in Figure 2, providing support that a single PTC heater design could be applicable to a wide range of existing silicon module power levels and cell architectures because of the similarity in module electrical characteristics.
Increased load resistance shifts module operating point toward a higher voltage and lower current, thus decreasing power output. Figure 3 shows power dissipation as a function of effective resistance, demonstrating how the calculated PTC heater resistance lies in a narrow range for our application.
This study analyzes the performance of an electric water heater, fitted with a PTC heater, when powered by photovoltaic modules in a northern latitude installation, which is a novel application of the technology. Performance analysis suggests modifications to the design and characteristics which may improve performance in future studies.

2. Materials and Methods

Application of a PTC heating solution to a commercially available water heater required that the designed heater assembly fit into the pre-existing heating element port; this dictated the maximum design dimensions of the developed device. Further, a replicable experimental setup was necessary to limit the number of uncontrolled variables between the two collaboration partners in this study. Therefore, two identical experimental apparatuses were fabricated, one managed by Pordis (Austin, TX, USA) for bench test of the fabricated heater assemblies and baseline testing and the other by University of Alaska Fairbanks (UAF) researchers at the University of Alaska Anchorage (UAA) campus to duplicate the baseline performance tests on the same heater cores and to perform field testing in Anchorage, AK using a photovoltaic energy source. The following sections describe the experimental setup, heater design, bench testing, and on-sun field test measurements.

2.1. Experimental Setup

A closed-loop system was selected and designed around a commercially-available 12-gallon (45.4 L) water heater. When activated, cold water is pumped from a 5-gallon (18.9 L) uninsulated holding tank into the water heater whose hot water is in turn pushed into the holding tank during each pump cycle.
The original heating element and control thermostat were removed from the water heater and replacing with a fabricated PTC heater, details of which are described in the next section. Data recording and water pump controls were implemented using a Campbell Scientific (Logan, UT, USA) CR1000X datalogger. The datalogger recorded various temperature readings, including water heater tank temperatures at different depths (×5, Type-T special limits of error (SLE)), holding tank temperature (ProSense (AutomationDirect, Cumming, GA, USA) THMT-T18L06-01, Type-T), heating element core temperatures (×6, Type-T SLE), water temperatures at the input and output fittings of the water heat tank (1ea, ProSense (AutomationDirect, Cumming, GA, USA) THMT-T06L06-01, Type T), and the ambient temperature (Type-T, SLE). Water temperature was measured using a temperature stratification probe in which multiple Type-T SLE thermocouples in thin-wall thermowells were set to measure water temperature at various depths, ranging from 50 mm to 450 mm. Voltage, current, calculated resistance, and calculated power of the heating element were recorded. The datalogger controlled the water pump operation frequency and duration in an effort to simulate anticipated household hand-washing water use. Figure 4 describes the experimental setup.
The water pump was set to run for 30 s at a rate of approximately 2.1 L per minute (LPM) to simulate the hot-water load during a hand washing event, 5 times per day, at times between 7:30 a.m. (0730) and 10:00 p.m. (2200). Although the hot water pumped into the holding tank initially increases the overall tank temperature slightly, the temperature generally returns to near-ambient conditions before the start of the next pump cycle.

2.2. PTC Heater Design

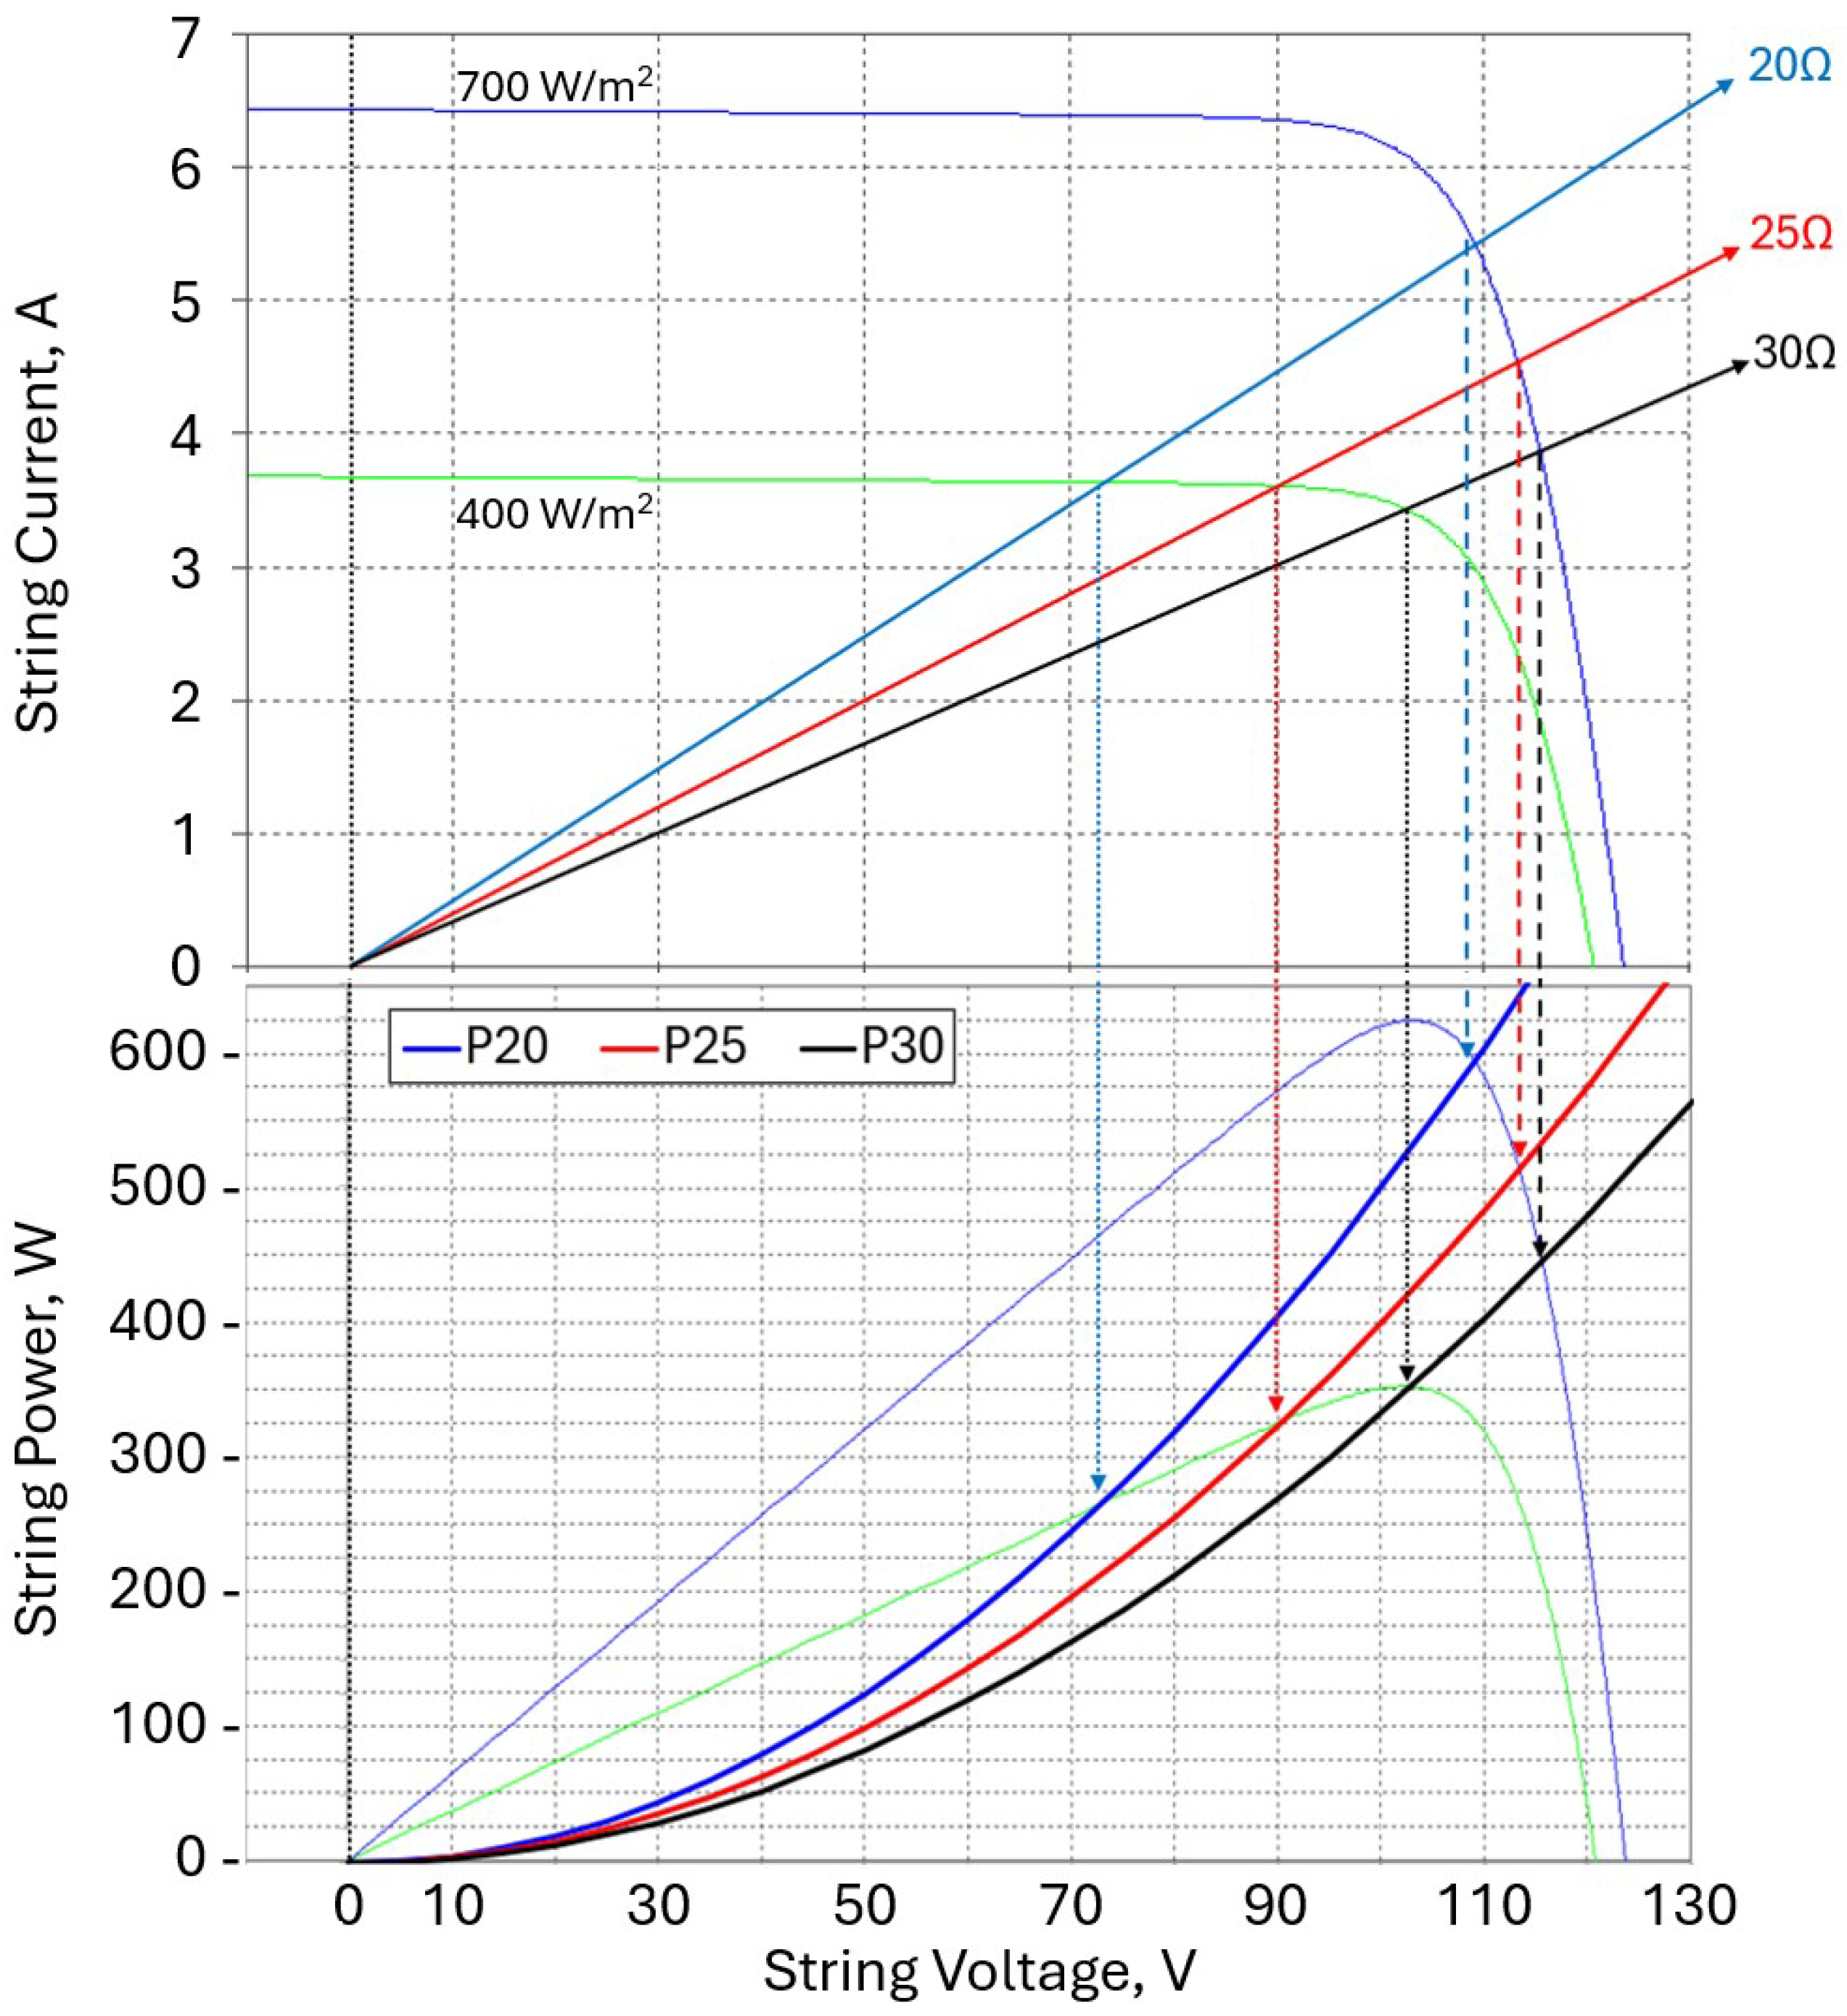
Design of the PTC heating assemblies required understanding how to best electrically configure the individual PTC ceramic elements into a circuit that forces the string of PV modules to operate near its maximum power point while achieving the desired maximum water temperature (discussed below). Figure 5 illustrates I-V curves for a string of three 270 W PV modules at 0 °C under various irradiances, with superimposed constant resistance curves. Modeling the 3-module string behavior over the anticipated maximum module temperature range for Anchorage, Alaska of −40 °C to +45 °C and an irradiance of 700 W/m2 yields the ideal resistance curves shown in Figure 6; the maximum power point is expected to occur at resistances between 15.1 Ω and 21.2 Ω under these conditions. This provided the target resistance range to which the heater assembly was designed.
Water heaters for use in residential installation are generally preset to a safe operating temperature of 49 °C (120 °F) according to several United States federal agencies [14,15]. Tap water scald prevention in young children is a primary driver for this temperature [16,17] although most water heaters allow the end user to adjust the temperature in excess of 60 °C (140 °F), a temperature at which clinically relevant scalds may be received in as little as 10 s [16]. Our aim was to achieve a maximum stablized water temperature between 50 °C and 60 °C to show relevance for a domestic water heating application.
Commercially available PTC heating elements, often called “stones”, are limited in availability and configuration. The selected manufacturer listed elements with Curie temperatures between 40 °C and 200 °C, although many listed products were unavailable for purchase at the time of fabrication; the literature suggests that devices have been historically available with Curie temperatures as low as 35 °C [10]. Single and dual-stone heaters of various voltage and Curie temperature configurations were purchased for evaluation in an attempt to select a product whose characteristics most closely matched the target condition described previously. In each evaluation, the stones were removed from their as-received aluminum housing and resistances were measured using a 4-wire probe connected to two parallel plates, between which each stone was compressed. This provided consistency in the measurement method. It was noted that this method sources only a few milliamperes through the stone and does not lead to self-heating; this method may be improved as discussed later.
It was determined that the target resistance should be achieved using 16 paralleled PTC stones in a two-sided sandwich configuration where aluminum electrodes provided the electrical connections; this is shown schematically in Figure 7; Figure 8 details components of the assembly. A thermowell was fabricated from aluminum and threaded to mate with a standard U.S. domestic water heater; a gasket provided a positive water seal to the water heater. The remainder of the components were assembled into a stack which was then inserted into the thermowell for testing. The center electrode was the positive conductor while the two outer electrodes were the paralleled negative conductors. When stacked, this resulted in a core with an essentially rectangular cross-section which had to be adapted to tightly slide into the circular cross-section of the thermowell. Two aluminum circular segment bars with reduced height lie on each side of the PTC core stack to form a nominally circular overall cross-section; these components are termed “heat spreaders” due to their functional transfer of heat from the core to the thermowell wall. Polyimide tape (0.051 mm polyimide with 0.038 mm silicone adhesive) was applied to the flat side of the heat spreaders to electrically isolate the core from the body of the thermowell. To evaluate heat uniformity while under test, each heat spreader was slotted along the outer edge and fitted with 30-AWG, PTFE-insulated Type-T thermocouples (Omega (DwyerOmega, Michigan City, IN, USA) TT-T-30), shown in Figure 9. Each probe tip was electrically isolated from the aluminum component and held in place with Omegabond thermally conductive epoxy (Omega (DwyerOmega, Michigan City, IN, USA) OB-101). In addition, 6 mm2 stranded copper wire (Type DLO) was crimped to each aluminum electrode and terminated into a polarity-specific genuine MC4 (Stäubli, Allschwil, Switzerland) PV connector. A visual comparison between the original and experimental heater assemblies is shown in Figure 10.
Although the target resistance range between 15.1 Ω and 21.2 Ω was based on an analysis of I-V curves, limited available PTC stones prevented fabrication of heaters with both expected ideal electrical and thermal parameters. In the end, two iterations of the PTC heater were tested at both sites: one built from 70 °C TC stones achieving a nominal ambient circuit resistance of 30.3 Ω (heater “A”) and one built from 50 °C TC stones and a nominal ambient circuit resistance of 19.8 Ω (heater “C”).

2.3. Bench Validation

Throughout this section, some methods are written as if applied to a single heater. Note that each of these steps was applied to heater “A” and repeated for heater “C.”
After assembly, the heater was checked for proper operation by testing at three voltages in free air—30 V, 60 V, and 90 V—under an essentially no-load condition since the heat transfer rate due to normal convection is far lower than the rate due to conduction under normal operation (loaded state) in a water heater. Infrared recordings (FLIR (Teledyne FLIR, Wilsonville, OR, USA) E40sc, 7.5–13 μ m [18]) captured the rise from ambient through the stabilized temperature at each voltage level to confirm that there were no thermally lagging regions along the assembly which would indicate a PTC stone was not electrically conducting; these observations were then compared to the six recorded heater core thermocouple measurements. Polyimide tape (0.025 mm polyimide with 0.041 mm silicone adhesive) was attached to the aluminum thermowell assembly to improve emissivity ( ε 0.75 ) [19,20]. An example for heater “A” is shown in Figure 11, which shows the stabilized temperature is consistent along the length of the assembly and that the temperature is a positive function of applied voltage. Both heaters showed expected no-load operation.
Once installed in the water heater, the tank was filled with water and the system purged of air; the pump was disabled. A potential was then applied to the heater from a bench power supply to establish a baseline maximum achievable temperature over the course of several days; heater “A” was tested at both 60 V and 90 V while heater “C” was tested at 90 V. This provided a comparison between the maximum free air temperature and that in a filled water heater with a much larger thermal mass. The free-air operation stabilized well above immersed operation.
Heater “A” achieved a stabilized tank temperature of 70.2 °C after 96 h of continuous operation at 90 V although it was noted that most of the temperature rise was achieved within the first 24 h. This is a significantly lower temperature than the free air 90 V temperature of 94.4 °C reached during infrared testing but consistent with the no-load versus loaded observations of Ting [10]. A stabilized water temperature of 70.2 °C presents a realistic and significant scald hazard. Heater “C” was built using lower TC stones and achieved a lower stabilized tank temperature of 62.5 °C which, although quite hot, presents a lower scald risk and is closer to the intended design temperature range of 50 °C to 60 °C.

2.4. On-Sun Measurements

At the UAA site, each heater was powered directly by three vertically mounted, series-connected, south-facing Canadian Solar (Kitchener, ON, Canada) CS6K-260 PV modules over a period of two months, allowing the system to experience various weather patterns. The system was located on the roof of one of the buildings at the University of Alaska Anchorage in Anchorage, Alaska (latitude 61.2° N). The authors note that the water pump stopped functioning during testing of the 50 °C heating element, so this element was consequently analyzed in a static setup with no cycling through the water heater instead of closed loop.

3. Results and Discussion

3.1. Heater Performance

Commercially sourced PTC stones were removed from their as-received aluminum housings as part of the preparation process in fabricating the heater assemblies. During this process, many of the PTC stones (nominally 27.8 mm × 10.65 mm × 1.38 mm) were found to be cracked through the thickness along the long axis: 69% of the stones in heater “A” and 31% of the stones in heater “C”. The larger percentage of cracked stones in heater “A” was attributed to the sourced device being of a single stone configuration while those for heater “C” came from a dual-stone package where the aluminum housing was compressed over a larger area. However, the overall resistance of the assembly was not impacted by the cracked stones as resistance is dictated by the total area through which current flows. This is consistent with the findings of Rowlands et al. [7] who state that the roughness of the edge of a PTC stone is less important than the flatness of the bottom and top surfaces in PTC heater applications.
Initial performance of each heater was evaluated by powering each device from a power supply while installed in the water heater filled with ambient-temperature water. This simulated a maximum load condition for the heater; heater “A” was tested at 60 V, 90 V, and 110 V while heater “C” was tested at 90 V. It is known that the resistance of N-type doped barium titanate PTC material is sensitive to the voltage applied across the device, with resistance decreasing as voltage increases, although this effect is more evident at temperatures above the Curie temperature [10]. However, Ting suggests that 800 V/cm is a safe gradient and our operating point during bench testing did not exceed this gradient limit (60 V: 435 V/cm; 90 V: 652 V/cm; 110 V: 797 V/cm). Since operation of the developed device is below or near TC and the voltage gradient is within published safe regime, we did not consider voltage sensitivity in this proof-of-concept experiment.
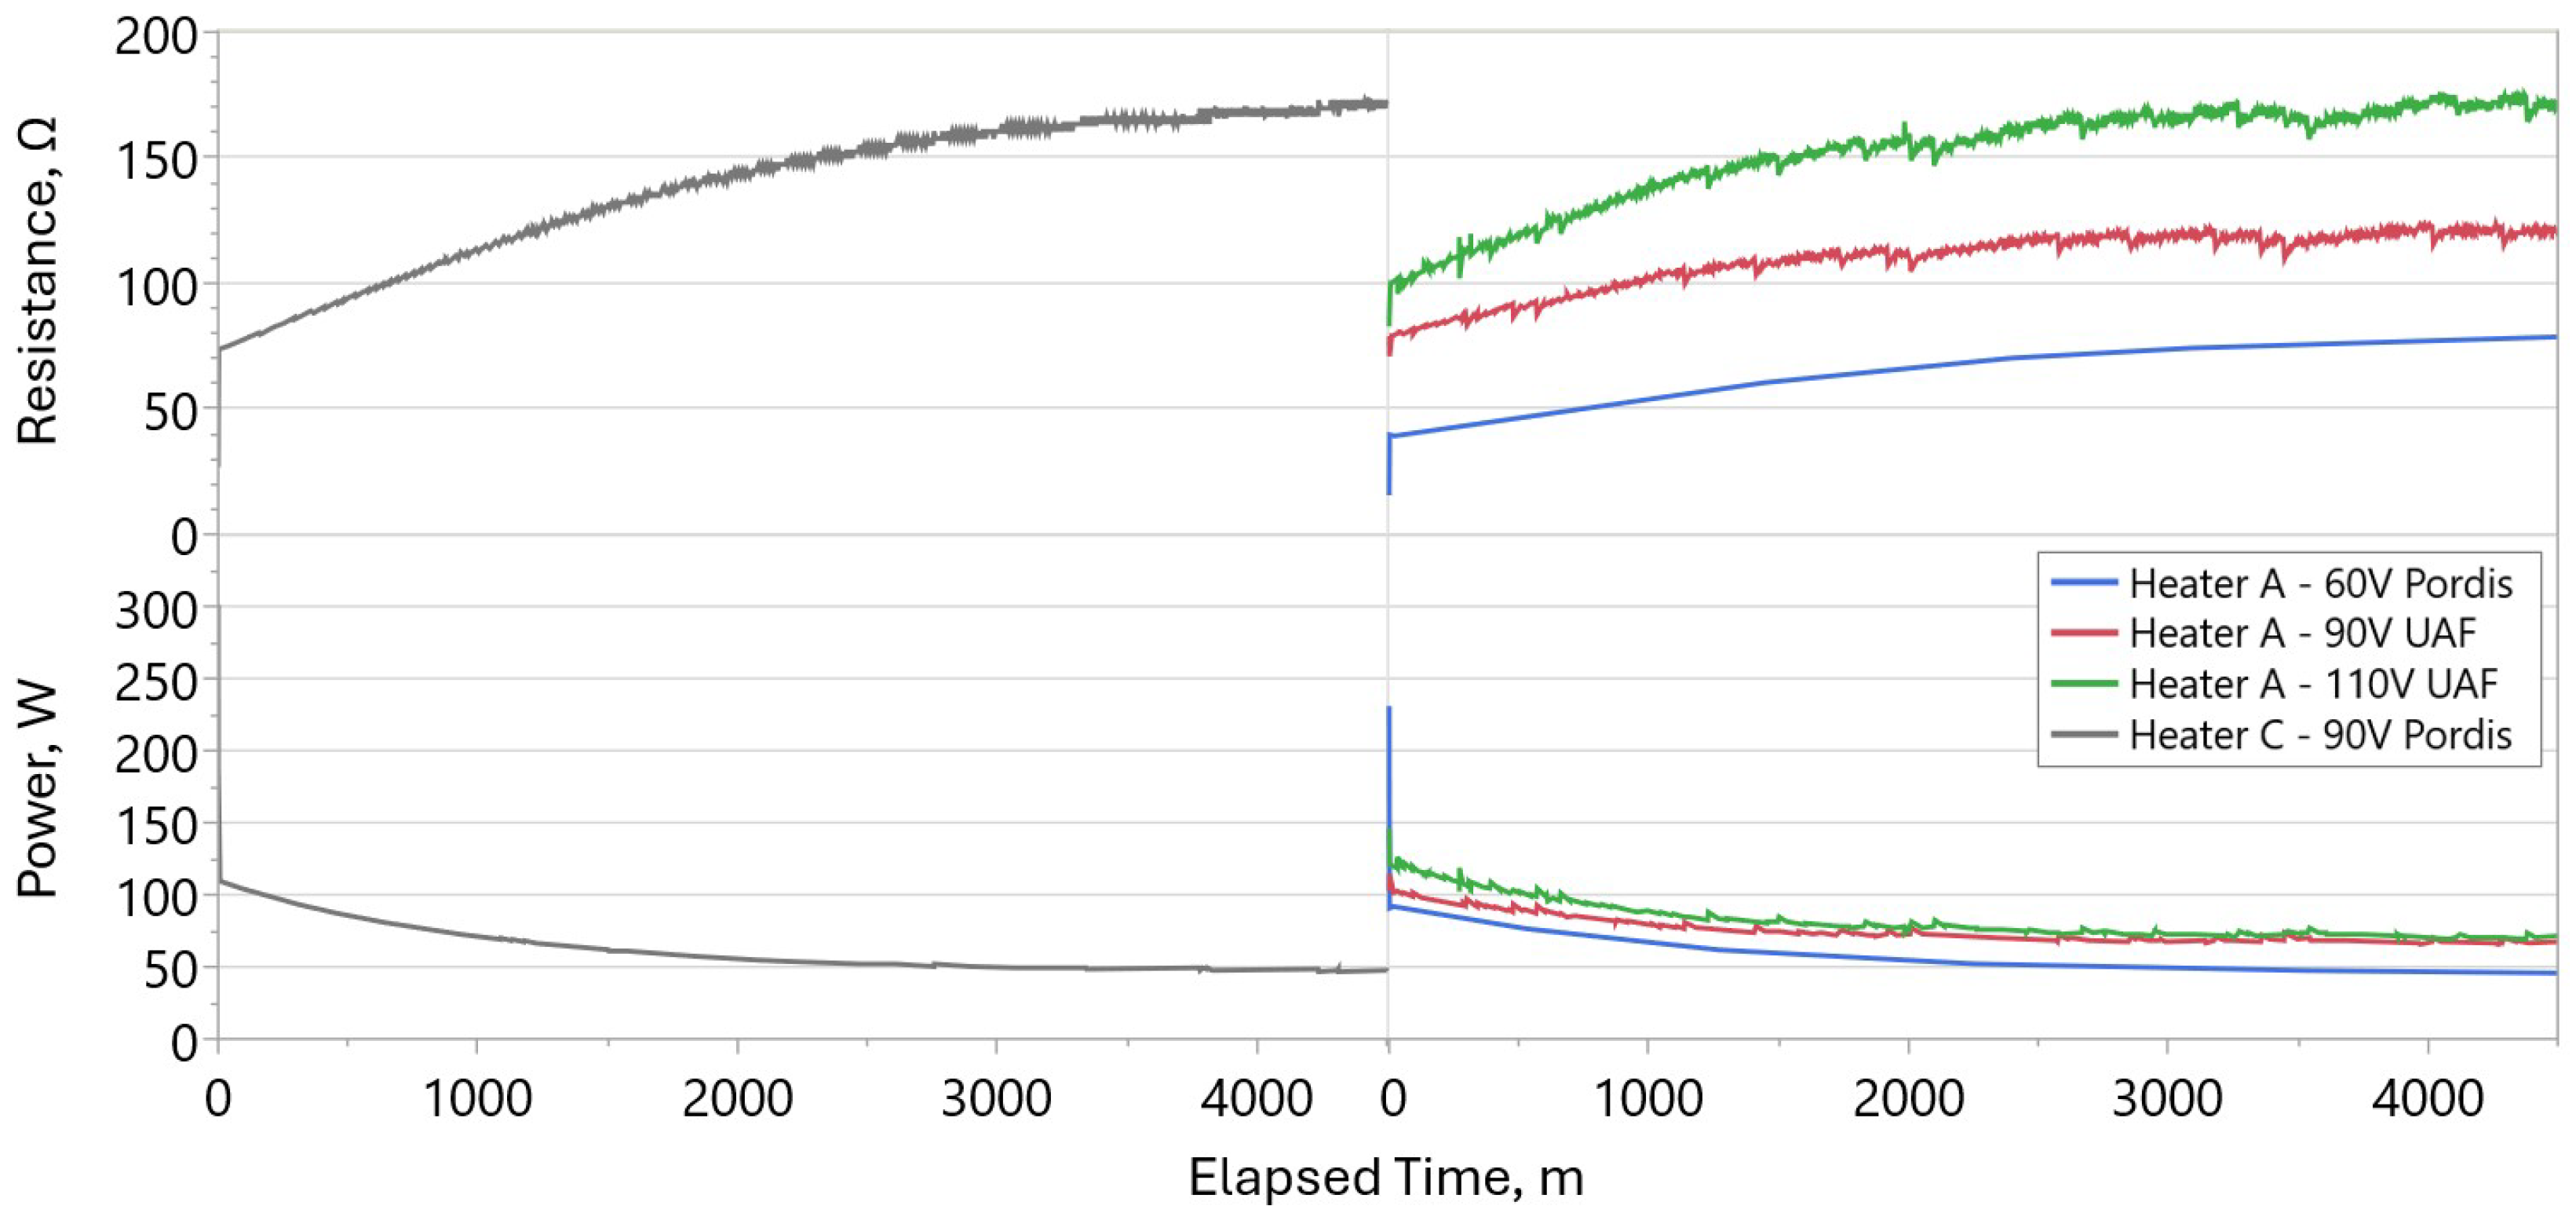
The constant potential tests show a marked decrease in power dissipation after a very short period of time (seconds to minutes), Figure 12, which is similar to the loaded operation observations of Ting (see [10] Figure 8) wherein the steady-state (t = 15 min) power dissipation was approximately 54% of the initial power dissipation. Under 90 V conditions, heater “A” initially dissipated 299 W (t = 0) which decayed to 109.1 W (36.5%) at 2 min and to 46.3 W (15.5%) at steady state. One possibility is that the actual resistance of the heater assembly was underestimated by the low current 4-wire DC measurement employed. In their study of additive manufacture of barium titanate PTC devices, Rowlands et al. utilized an impedance spectrometer swept between 100 mHz and 6 MHz followed by extrapolation to a DC condition [7]. Use of such an instrument may have resulted in a different measured ambient resistance. However, the more plausible explanation, and that supported in the literature [10], is that an unloaded resistance is simply not the correct method of PTC stone selection, and that the loaded resistance at the steady-state temperature at a target potential is a better metric for heater design for this application. Shown in Figure 13 and summarized in Table 1, loaded resistances are higher than the unloaded resistance and are a non-linear function of applied voltage; further testing is necessary to adequately model this relationship. In either case, a different effective DC resistance would have necessitated a different circuit design to achieve the target performance during steady-state operation.
Further, since the current flowing through the circuit is a function of the temperature of the PTC stones, performance is improved by maximizing the heat dissipation of the assembly into the water. A higher heat transfer rate allows for a higher electrical power dissipation [10]. The implemented design used a smooth cylindrical thermowell which provided 191.6 cm2 of effective surface area through which to dissipate the generated heat. The electrically insulating polyimide film negatively affects the heat transfer rate out of the heater core and into the heat spreaders and thermowell wall; Ting suggested a 5 to 10 °C loss may be experienced by an insulating film [10]. The relatively large heat spreaders with a total volume of 41.34 cm3 dampen the responsiveness of the system. A refined design would have likely improved the heat transfer rate to the water, resulting in a more rapid increase in water temperature than was observed. For reference, solving a simple heat transfer formula, Equation (1), during steady-state operation results in a effective overall heat transfer coefficient of 0.0379 W/cm2 °C for heater “A” and 0.0478 W/cm2 °C for heater “C”.
Q = AH ( T CORE T WATER )
where
  • Q            Electrical power dissipation, W;
  • A            Surface area, cm2;
  • H            Overall heat transfer coefficient, W/cm2 °C;
  • TCORE    Average temperature of the heater core, °C;
  • TWATER  Average water temperature, °C.

3.2. Analysis of Installed Heaters

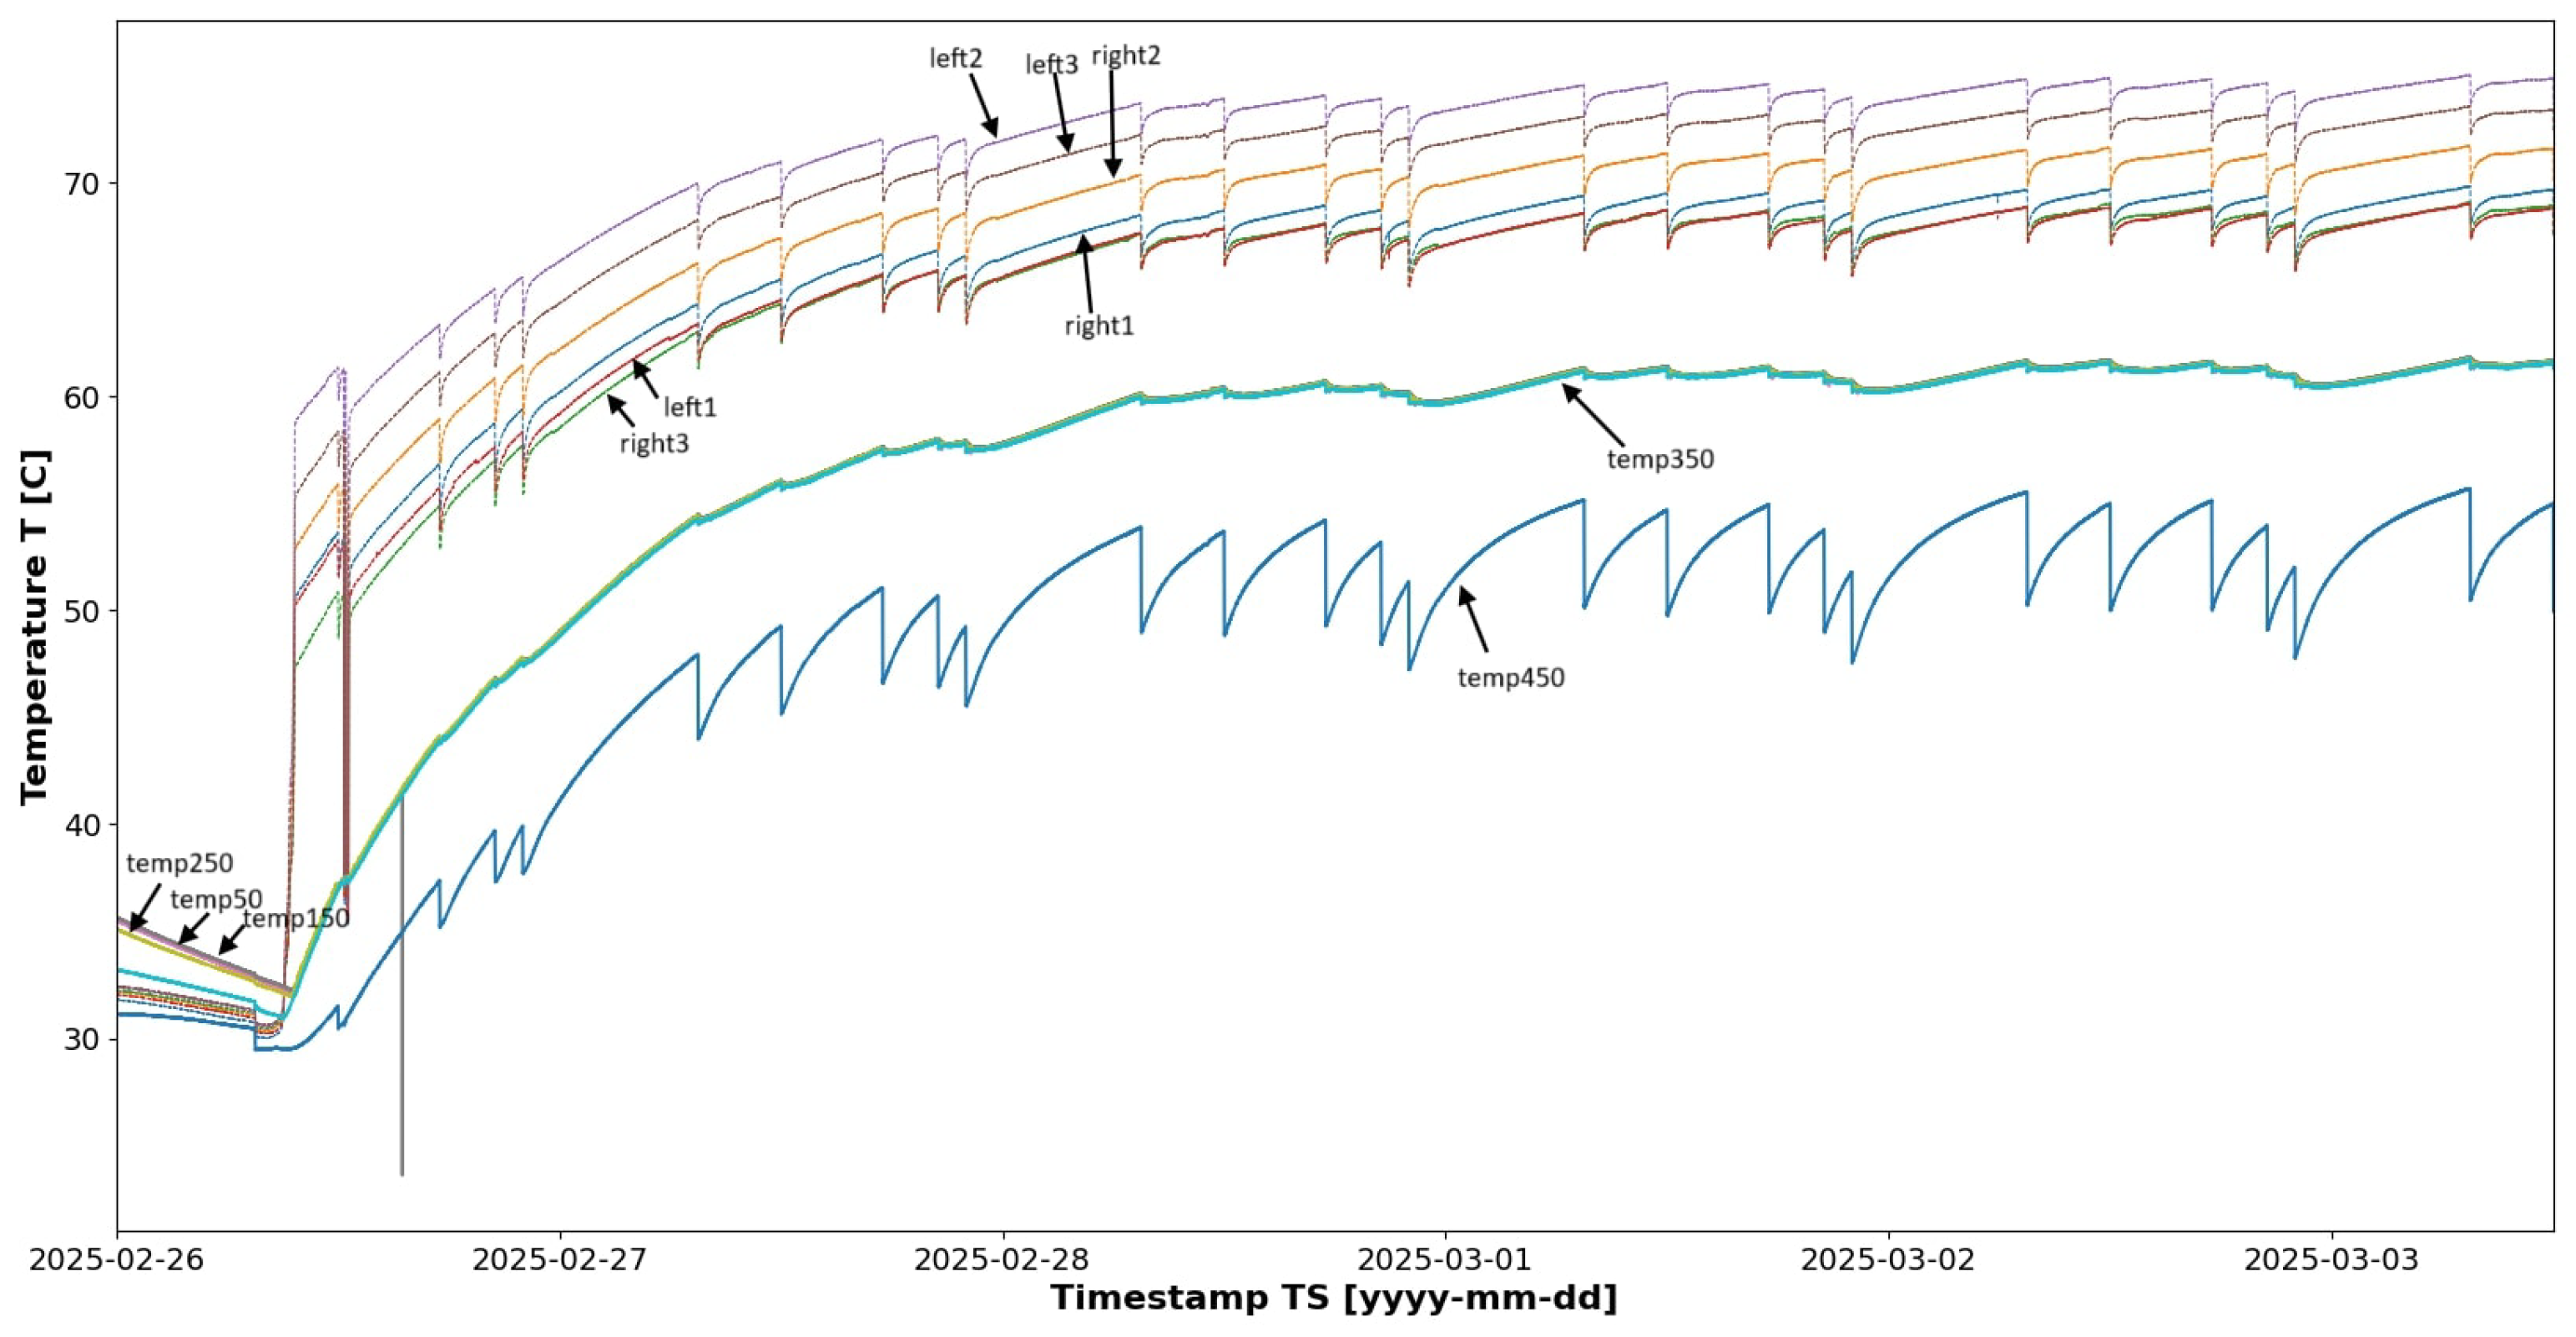
To establish a baseline of the behavior of the PTC heating element, it was connected to a power supply set to 90 V, details of which were previously described. The baseline can be seen in Figure 14 for one test at UAA. The lines labeled “Right1” through “Right3” and “Left1” through “Left3” represent the core temperature of the heating element measured at specific locations inside the device (see Figure 9). The lines labeled “temp50” through “temp450” represent the tank water temperature at 100 mm depth intervals; the number indicates the depth of measurement from 50 mm to 450 mm from the tank upper fittings.
As can be seen, the heating element core heated nearly instantly and reached the maximum temperature of ∼70 °C in 24 h. Core temperature was dampened by the simultaneous heating of the water in the heater tank due to the resistance dependence on temperature, with the water temperature of the tank having reached 40 °C in roughly 6 h. However, it took roughly one and half days for the water to reach its maximum stabilization temperature of around 60 °C. Once heating commenced, the “temp450” probe always measured temperatures lower than the other probes even though the range at t0 was 0.33 °C across the five probes. This is likely due to this specific probe being at the lowest depth, below the depth of the heater assembly itself, where the denser cold water is expected to rest at the bottom of the tank.
With a baseline established, the heating element was connected to the three series-connected PV panels. Figure 15 presents the heating element core and water temperatures over a period of multiple sunny days along with a brief period of partially cloudy weather during 17 to 24 March 2025.
When connected to the PV panels, the heating element’s internal temperature follows a cycle similar to a PV module’s voltage (stable voltage with simultaneous heat generation during the day before production ceases at night). The average daytime voltage throughout the experiment was 110 V, which corresponds well to the modeled behavior expected from I-V curves. When voltage is present, the heater assembly produces heat until the sun goes down, where it then cools down and remains inactive until voltage is reapplied. The tank’s water temperature subsequently follows this same daily cycle; this creates rising and falling water temperatures in the tank not seen in a traditional electric water heater. When the panels experience a period of consecutive sunny days, the daily peak temperature of the water slowly increases; however, this growth can be reset during periods of reduced incident irradiance, such as during cloudy weather.
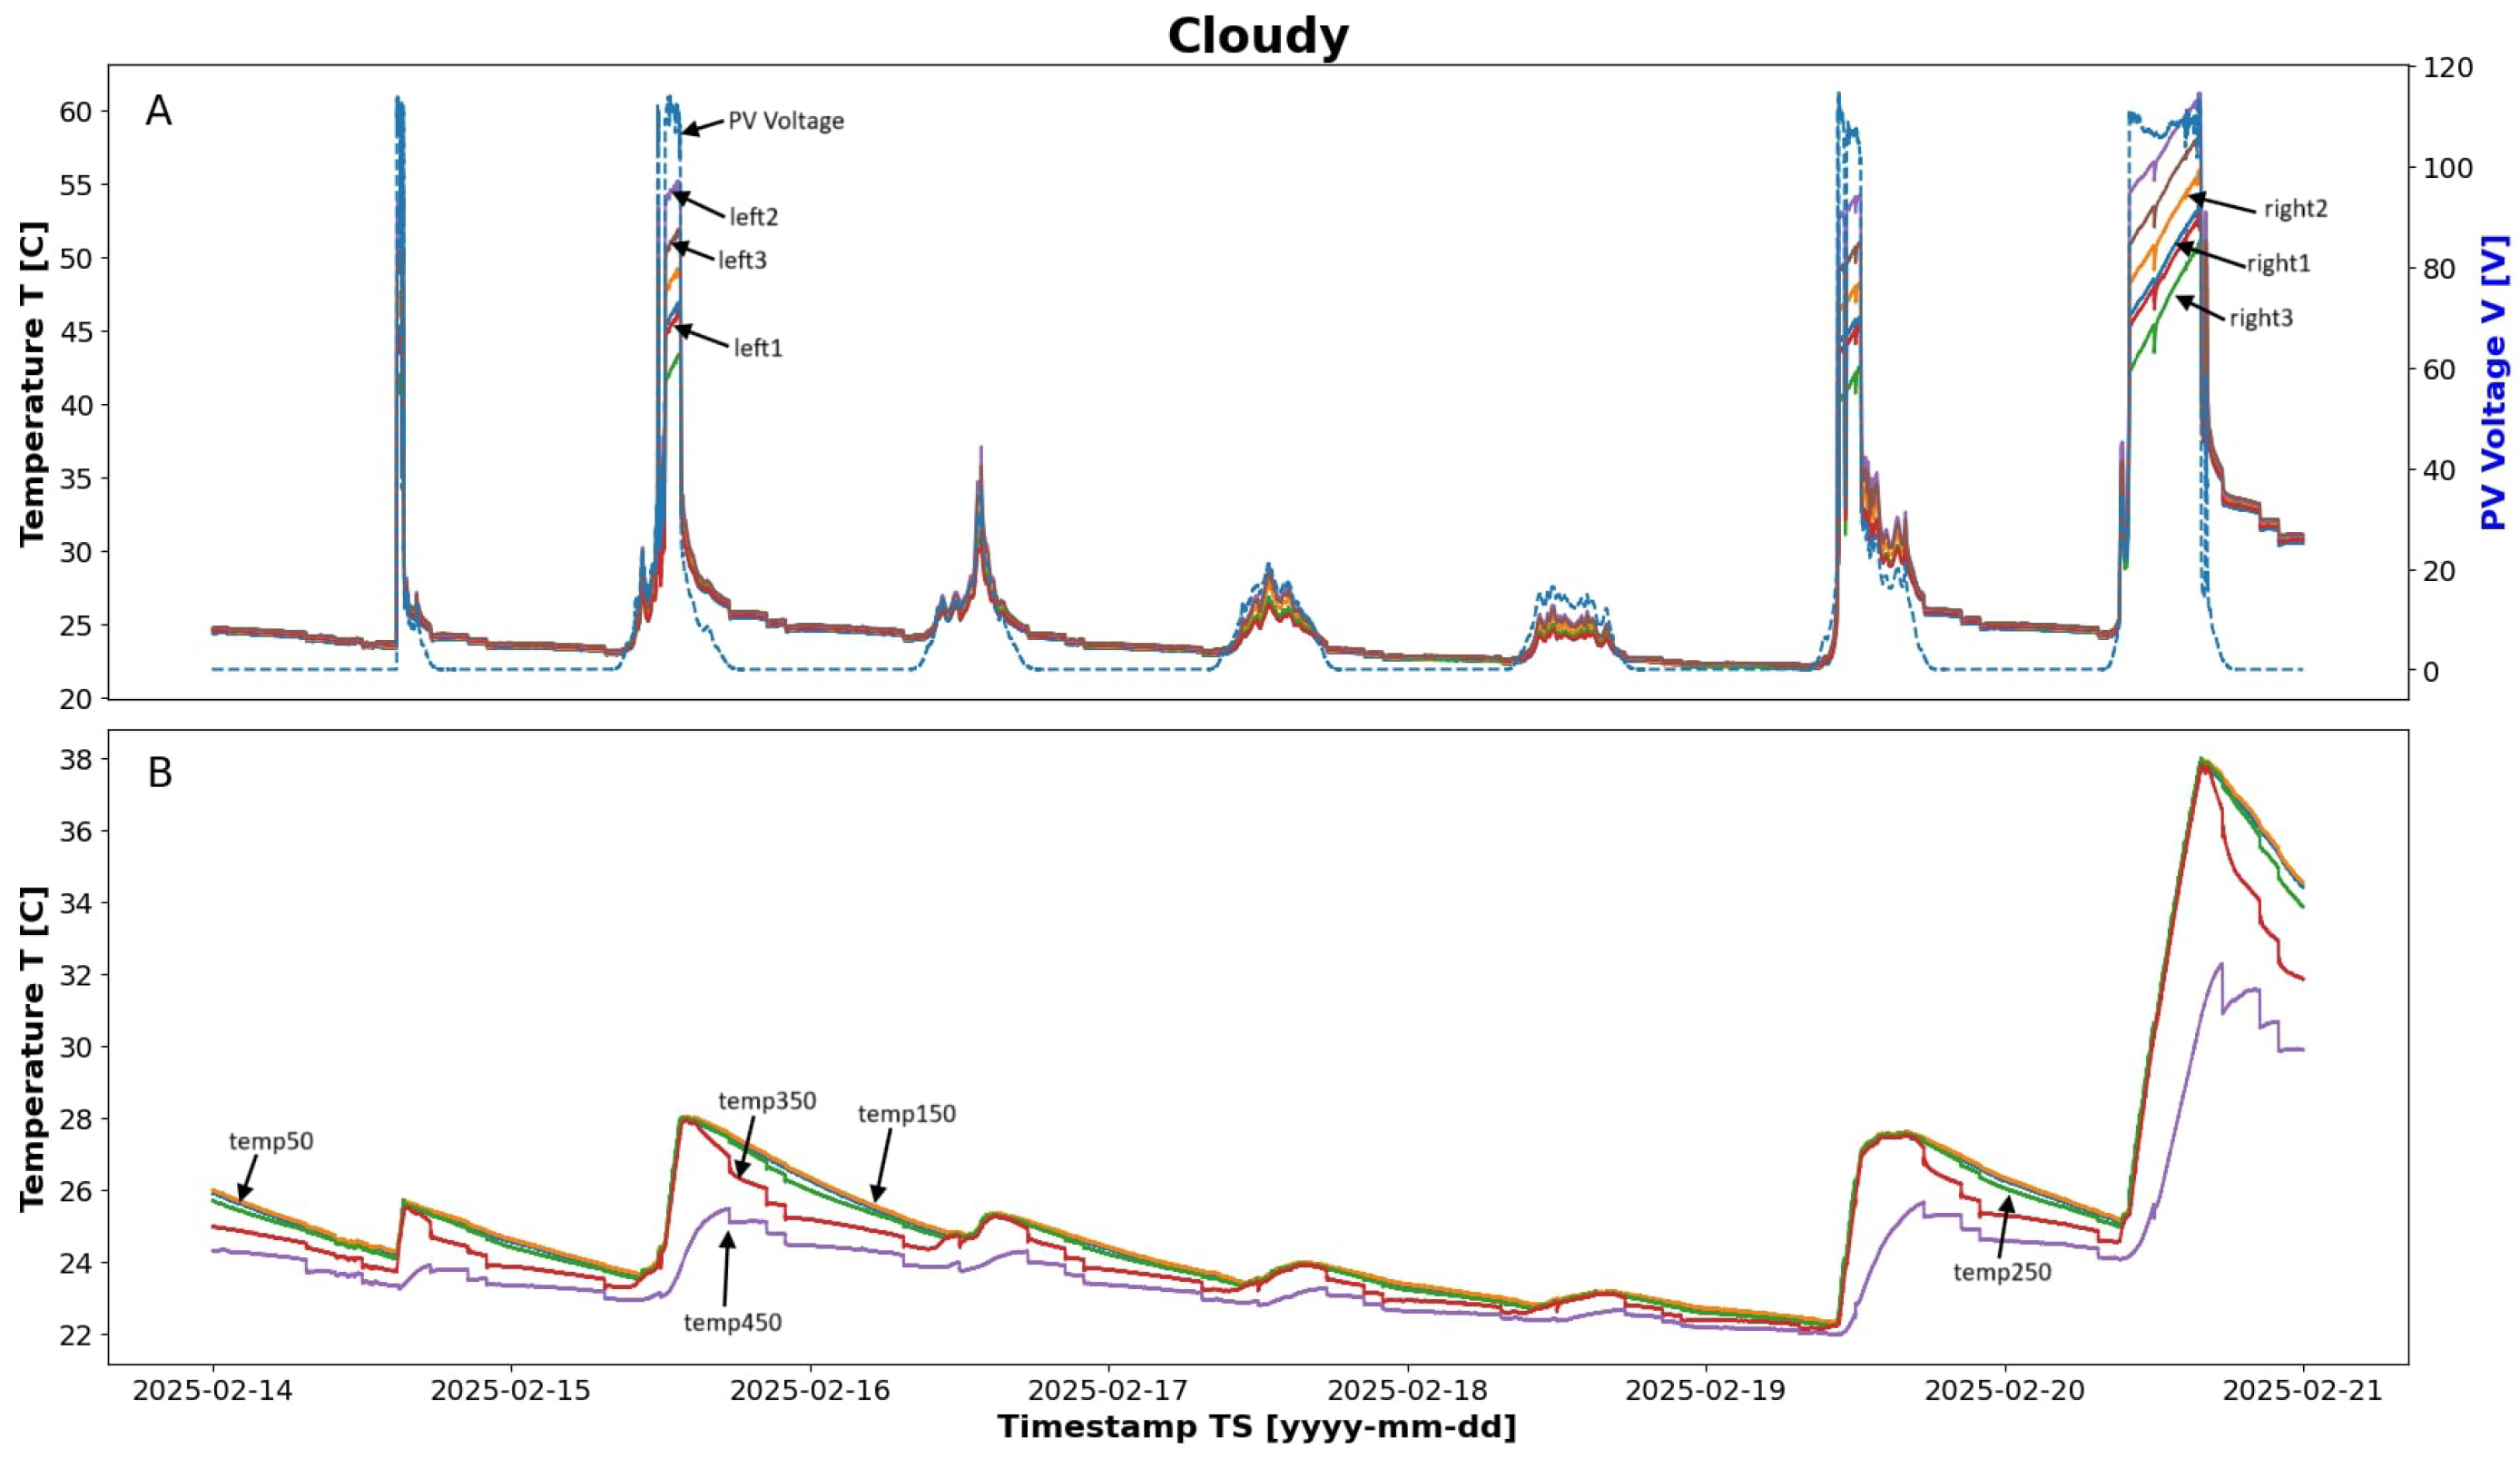
During periods of low irradiance, when the power output of the PV panels is considerably reduced, the heating element struggles to generate heat. This can be seen in Figure 16 where the stored water temperatures stayed near room temperature.
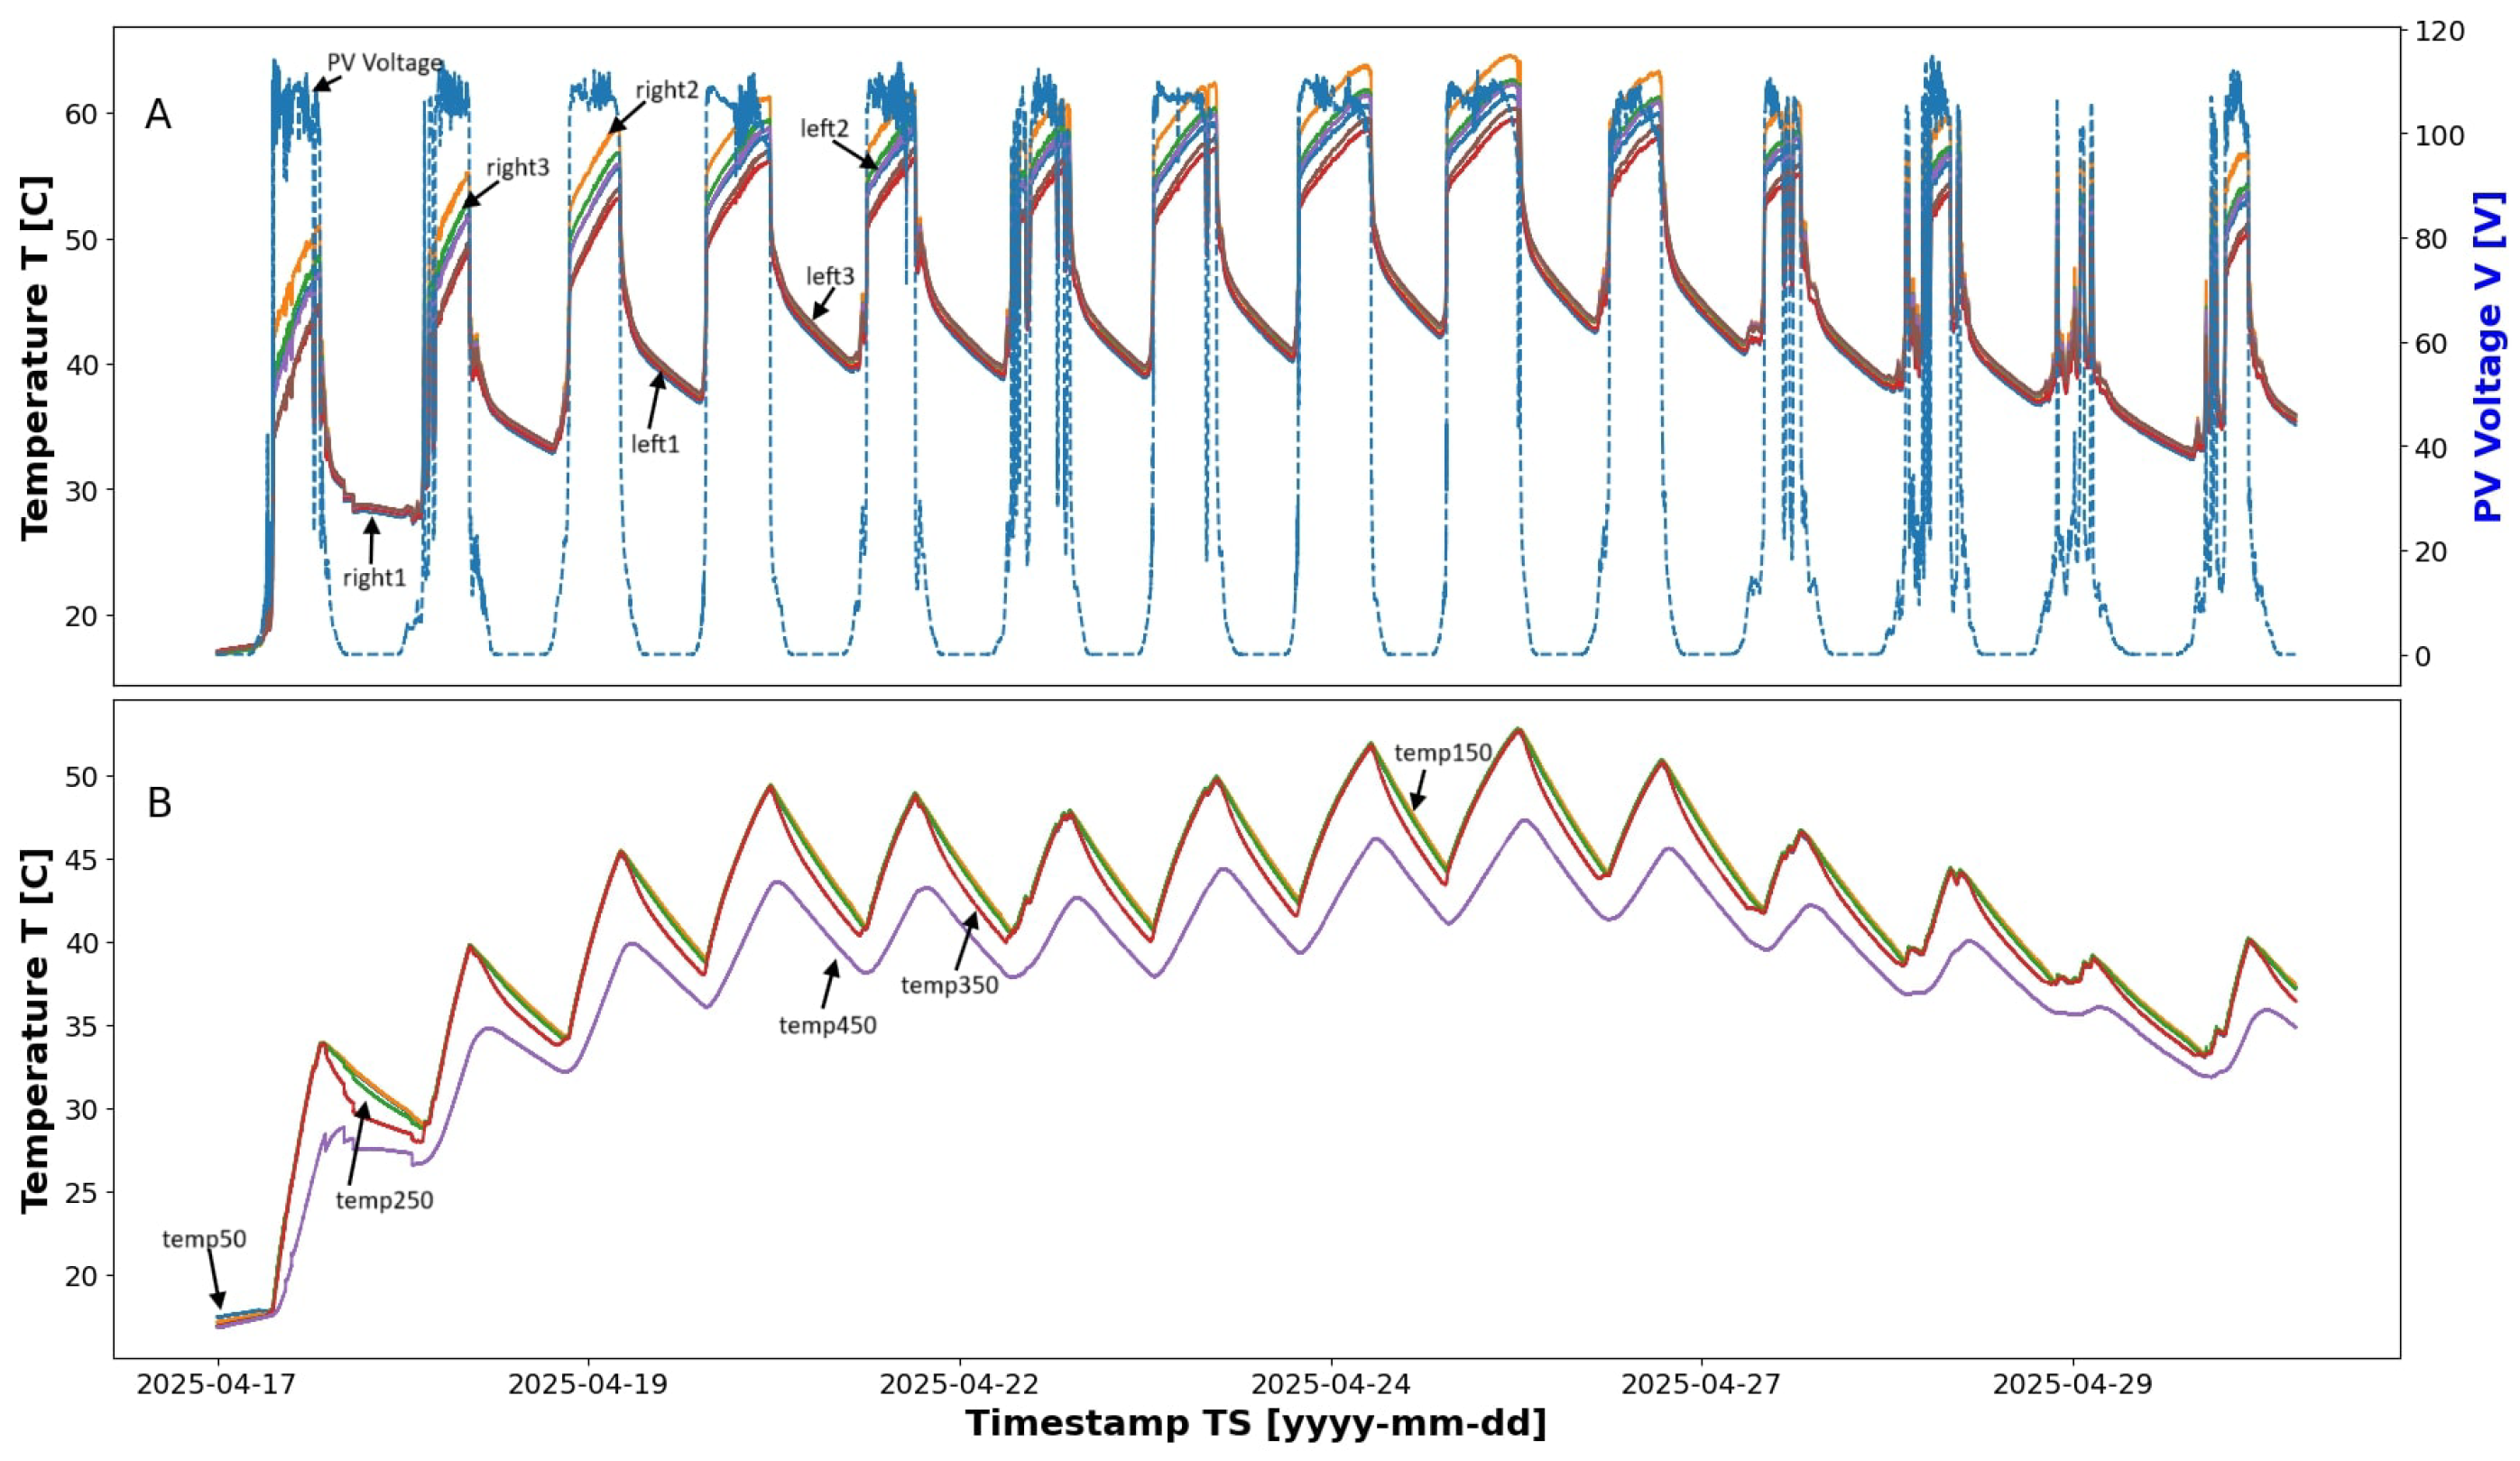
Following the 70 °C TC heating element test, the 50 °C TC heating element was installed. Time series analysis of this element during a sunny period can be seen in Figure 17.
The 50 °C TC heating element expectedly follows the same cycle of rising and falling core and water temperatures seen in the 70 °C TC element analysis. The heating element also exhibits the same behavior of rising daily peaks in the water temperature, though to a greater magnitude than the 70 °C TC element. During the sunny period, from 17 to 26 April 2025, the heating element was able to produce elevated water temperature and maintained a tighter range of elevated temperatures. However, once the weather became less sunny, 27 to 30 April 2025, the water temperature began to fall.
To observe how much heat energy is retained after the element cannot sufficiently continue to heat the water, Figure 18 represents a single-day analysis of a sunny day.
During the period of zero overnight heat generation, the insulation of the tank and residual heat from the element can retain water temperatures sufficiently high enough for use.

3.3. Discussion

When supplied with a constant voltage, as applied during bench testing, the PTC heating element performs similarly to a traditional resistive heating element. It can reach a serviceable temperature within a few hours, however it can take over a day for water temperature to reach the maximum stabilization temperature.
When supplied with power from the PV panels, both iterations of the PTC heating element follow a daily cycle of producing heat during daylight hours and becoming inactive once the sun goes down. During this period, temperatures in the water remain high enough for typical household use. However, multiple uses of hot water during this period of low power/inactivity of the element accelerate the cooling of the water in a closed-loop system during inactive periods. This analysis only simulates 30 s hand washings, so additional uses, such as hot showers, further reduces tank temperature.
This issue is mitigated during Alaska summers, where longer daylight periods can result in higher solar energy resource availability. However, during winters, the reverse is true, especially close to the winter solstice where solar PV energy production is negligible. This is illustrated in Figure 19 below, which was created using the ERA5 typical meteorological year (TMY) data product for Anchorage [21]. It synthesizes multiple years of historical meteorological data, including solar irradiance, to generate one representative year for a given location. As is apparent from Figure 19, Anchorage is subject to significant seasonal and sub-seasonal variation in solar energy availability.
This can further constrain the period during which the PTC heating element will experience peak power on any given day throughout the year. This analysis also used three south-facing PV panels, but connecting the heater to multi-facing panels (south, east, and west) could possibly extend the peak power period of the heating element.
During cloudy days, when the heating capacity is considerably reduced, water temperatures fall quickly with repeated use of hot water. An extended period of cloudy weather makes the water heater unusable for typical domestic use.

4. Conclusions

Conducted experiments showed that a PTC water heater achieved self-regulation at temperatures at or above the target safe operating temperature for a domestic use case. This demonstrated the potential for direct PV-to-PTC heating, although improvements are necessary. Heater circuit design was based on room-temperature resistance measurements of the PTC stones; an improved design would use the loaded resistance at the target potential.
In a general domestic use-case, restrictive use of hot water might be a necessity to retain hot water. However, a PV powered water heater with a PTC heating element might match certain use cases well, such as summer use facilities. A PV-to-PTC water heater can be effectively used in commercial, industrial, or research settings, where hot water demand might occur during peak heating periods. Further research should investigate the effectiveness of using a PV-to-PTC as pre-heater for a traditional water heater, potentially reducing grid energy or fuel use. A hybrid PV and utility-powered PTC water heater should also be investigated. PV-powered PTC heating use for sunny-period heating, such as for diesel generator block heating for remote communities which rely on combined PV and diesel generation could reduce fuel consumption by reducing or eliminating idle operation to maintain block temperature.

Author Contributions

Conceptualization and methodology, R.M.S.; software, R.M.S. and C.D.; validation, formal analysis, R.M.S., C.D. and H.T.; investigation, R.M.S.; resources, R.M.S. and M.W.; data curation, R.M.S., C.D. and H.T.; writing—original draft preparation, all authors; writing—review and editing, all authors; visualization, R.M.S., C.D. and H.T.; supervision, M.W.; project administration, R.M.S. and M.W.; funding acquisition, M.W. All authors have read and agreed to the published version of the manuscript.

Funding

This project is part of the Alaska Regional Collaboration for Technology Innovation and Commercialization (ARCTIC) 2 Program— Innovation Network, an initiative supported by the Office of Naval Research (ONR) Award #N00014-22-1-2049.

Data Availability Statement

Data available upon request.

Conflicts of Interest

Author Ryan M. Smith was employed by the company Pordis LLC. The remaining authors declare that the research was conducted in the absence of any commercial or financial relationships that could be construed as a potential conflict of interest.

Abbreviations

The following abbreviations are used in this manuscript:
Al-BSFAluminum Backside Field
HJTHeterojunction
IBCInterdigitated Back Contact
I-VCurrent Voltage
LPMLiters per minute
PERCPassivated Emitter Rear Contact
P M P Maximum Power, Power at the Maximum Power Point
PVPhotovoltaic
P-VPower Voltage
PTCPositive Temperature Coefficient
SLESpecial limits of error
STCStandard Test Conditions (1000 W/m2, 25 °C)
TCCurie Temperature
TOPConTunnel Oxide Passivated Contact
WWatts

References

  1. Roden, J. Keeping the World in Hot Water the Water Heater Industry, Past, Present and Future. In 65th Porcelain Enamel Institute Technical Forum: Ceramic Engineering and Science Proceedings; John Wiley & Sons: Hoboken, NJ, USA, 2009; Volume 24, pp. 175–186. [Google Scholar] [CrossRef]
  2. Jepson, A. Electric heating: Its history and development. J. Inst. Electr. Eng. 1905, 35, 527–536. [Google Scholar] [CrossRef]
  3. Darling, C.R. Electrical Resistance Furnaces and Their Uses. RSA J. 1923, 71, 324–336. [Google Scholar]
  4. Marsh, A.L. Electric Resistance Element. U.S. Patent 811859, 6 February 1906. [Google Scholar]
  5. Daniels, J.; Härdtl, K.; Wernicke, R. The PTC effect of barium titanate. Philips Tech. Rev. 1978, 38, 73–82. [Google Scholar]
  6. Vijatović, M.; Bobić, J.; Stojanović, B.D. History and challenges of barium titanate: Part II. Sci. Sinter. 2008, 40, 235–244. [Google Scholar] [CrossRef]
  7. Rowlands, W.; Vaidhyanathan, B. Additive manufacturing of barium titanate based ceramic heaters with positive temperature coefficient of resistance (PTCR). J. Eur. Ceram. Soc. 2019, 39, 3475–3483. [Google Scholar] [CrossRef]
  8. Chatterjee, S.; Maiti, H.S. A novel method of doping PTC thermistor sensor elements during sintering through diffusion by vapour phase. Mater. Chem. Phys. 2001, 67, 294–297. [Google Scholar] [CrossRef]
  9. Vijatović, M.; Bobić, J.; Stojanović, B.D. History and challenges of barium titanate: Part I. Sci. Sinter. 2008, 40, 155–165. [Google Scholar] [CrossRef]
  10. Ting, Y.H. Self-regulating PTC heating systems: A new approach for electric heating appliances. IEEE Trans. Ind. Appl. 1972, IA-8, 338–344. [Google Scholar] [CrossRef]
  11. Syrtsov, S.; Shut, V.; Kashevich, I.; Sedlovsky, A.; Watts, B. Positive temperature coefficient of resistivity in thin films of barium titanate. Mater. Sci. Semicond. Process. 2002, 5, 223–225. [Google Scholar] [CrossRef]
  12. Company Name Withheld. Personal Communication Regarding PTC Heater Use Cases. Private in-Person Conversation with R.M. Smith, 1 March 2023.
  13. Smith, R.M.; Seigneur, H.; Hoflich, A. A Comprehensive Database Approach to Track Industry Trends and Parameter Evolution in Photovoltaic Modules. In Proceedings of the 2024 IEEE 52nd Photovoltaic Specialist Conference (PVSC), Seattle, WA, USA, 9–14 June 2024; IEEE: Piscataway, NJ, USA, 2024; pp. 0958–0963. [Google Scholar] [CrossRef]
  14. US Consumer Product Safety Commission. Avoiding Tap Water Scalds. Technical Report. 2012. Available online: https://www.cpsc.gov/safety-education/safety-guides/kids-and-babies-home/avoiding-tap-water-scalds (accessed on 1 July 2025).
  15. US Department of Energy. Do-It-Yourself Savings Project: Lower Water Heating Temperature. Technical Report. 2025. Available online: https://www.energy.gov/energysaver/do-it-yourself-savings-project-lower-water-heating-temperature (accessed on 2 July 2025).
  16. Feldman, K.W.; Schaller, R.T.; Feldman, J.A.; McMillon, M. Tap water scald burns in children. Pediatrics 1978, 62, 1–7. [Google Scholar] [CrossRef] [PubMed]
  17. Lowell, G.; Quinlan, K.; Gottlieb, L.J. Preventing unintentional scald burns: Moving beyond tap water. Pediatrics 2008, 122, 799–804. [Google Scholar] [CrossRef] [PubMed]
  18. FLIR. E40 Technical Data Sheet; FLIR: Wilsonville, OR, USA, 2012. [Google Scholar]
  19. Teledyne FLIR. Use Low-Cost Materials to Increase Target Emissivity. Available online: https://www.flir.com/discover/rd-science/use-low-cost-materials-to-increase-target-emissivity/ (accessed on 2 July 2025).
  20. Design 1st. Emissivity Values. Available online: https://www.design1st.com/Design-Resource-Library/engineering_data/ThermalEmissivityValues.pdf (accessed on 2 July 2025).
  21. Hersbach, H.; Bell, B.; Berrisford, P.; Hirahara, S.; Horányi, A.; Muñoz-Sabater, J.; Nicolas, J.; Peubey, C.; Radu, R.; Schepers, D.; et al. The ERA5 global reanalysis. Q. J. R. Meteorol. Soc. 2020, 146, 1999–2049. [Google Scholar] [CrossRef]
Figure 1. PTC devices such as N-type doped barium titanate exhibit a typical behavior charted as the logarithm of resistance versus linear temperature. RR represents the device’s rated resistance at 25 °C. With rising temperature, the resistance initially drops slightly, then increases near the Curie temperature (TC). Beyond TC, resistance follows a predictable rate ( α ) until reaching maximum resistance (RMAX) at TMAX. Above TMAX, resistance decreases. The proposed system operates near or below the Curie temperature.
Solar 05 00042 g001
Figure 2. The nominal STC resistance for commercially available silicon modules of various cell architectures has remained stable, by architecture, over time. Al-BSF, PERC, and TOPCon modules generally fall between 2 Ω and 5 Ω (dashed lines to guide the eye) while HJT and IBC architectures show larger spread at increased nominal resistance. Data from [13].
Solar 05 00042 g002
Figure 3. Current–voltage (I-V) curves for a typical silicon module are shown (left) with constant resistance lines between 1 Ω and 20 Ω at three irradiances. Analysis of power dissipation along lines of constant resistance yields power–resistance (P-R) curves such as shown (right) which suggest that an ideal PTC heater resistance lies in a narrow range.
Solar 05 00042 g003
Figure 4. Diagram of the experimental setup. The bench-test experimental setup used a constant voltage power supply; the second experiment utilized three series-connected PV modules.
Solar 05 00042 g004
Figure 5. Current-voltage (top) and power-voltage (bottom) curves at 700 and 400 W/m2 and 0 °C for a series-connected string of three 270 W modules. Constant resistance lines of 20 Ω , 25 Ω , and 30 Ω are superimposed over the I-V and P-V curves showing where potential PTC heating elements would operate.
Solar 05 00042 g005
Figure 6. The ideal loading resistance for a series-connected string of three 270 W modules is shown for temperatures in Anchorage, Alaska, −40 °C to +45 °C and irradiances of 200 to 1200 W/m2. A nominal irradiance of 700 W/m2 was chosen for PTC element selection, yielding an ideal resistance range between 15.1 Ω and 21.2 Ω .
Solar 05 00042 g006
Figure 7. Design schematic of the heater assembly showing eight ceramic PTC elements per side in a dual sandwich configuration. All measurements are in millimeters unless otherwise noted.
Solar 05 00042 g007
Figure 8. Component breakout of the designed heater assembly. Not shown are the PTC stones, polyimide electrical insulating film, electrical conductors, and diagnostic thermocouples.
Solar 05 00042 g008
Figure 9. Design schematic of the heat spreader showing the thermocouple locations on each side for monitoring the heater assembly thermal performance. Positions 1, 2, and 3 indicate the extent of thermocouple depth as measured from the outer end of the component. Detail C is the cross-section of the heat spreader. All measurements are in millimeters unless otherwise noted.
Solar 05 00042 g009
Figure 10. Images of the original heating element removed from the as-received water heater (bottom) and the experimental PTC heating assembly (top) showing power leads to each electrode of the heater core and the six heater core thermocouples. Each experimental heating assembly is visually identical.
Solar 05 00042 g010
Figure 11. Infrared images of heater “A” at various voltages in free air. Polyimide tape was attached to the thermowell assembly to improve emissivity. Stabilized temperature is consistent along the length of the assembly and is a function of applied voltage.
Solar 05 00042 g011
Figure 12. Heater power and resistance comparison through the first 300 s (5 m) of operation under constant potential from a bench power supply. The left side shows the only test of the 50 °C TC heater at 90 V. The right side shows tests of the 70 °C TC heaters at 60 V, 90 V, and 110 V. Loaded resistances significantly differ from the initial measured unloaded resistances.
Solar 05 00042 g012
Figure 13. Heater power and resistance comparison through the first 4500 m (75 h) of operation under constant potential from a bench power supply. The left side shows the only test of the 50 °C TC heater at 90 V. The right side shows tests of the 70 °C TC heaters at 60 V, 90 V, and 110 V. Loaded resistances significantly differ from the initial measured unloaded resistances.
Solar 05 00042 g013
Figure 14. Time series graph of the 70 °C TC heating elements contained within heater “A” powered via a power supply set to 90 V. Lines labeled left1-3/right1-3 represent temperature readings of heating element cores. Lines labeled temp50-450 represent temperature in water heater tank at depths of 50 mm to 450 mm, see text for details. Note that temp50 through temp350 overlay with very little difference.
Solar 05 00042 g014
Figure 15. Time series graph of the 70 °C heating element powered via PV panels during a period of sunny weather in March 2025. Graph (A) represents the temperature readings of the cores of the heating element. Lines labeled left1-3/right1-3 represent temperature readings of heating element cores, see text for details. Graph (B) represents the temperature readings of the water in the tank. Lines labeled temp50-450 represent temperature in water heater tank at depths of 50 mm to 450 mm, see text for details.
Solar 05 00042 g015
Figure 16. Time series graph of the 70 °C TC heating element powered via PV panels during a period of cloudy weather in February 2025. Graph (A) represents the temperature readings of the cores of the heating element. Lines labeled left1-3/right1-3 represent temperature readings of heating element cores, see text for details. Graph (B) represents the temperature readings of the water in the tank. Lines labeled temp50-450 represent temperature in water heater tank at depths of 50 mm to 450 mm, see text for details.
Solar 05 00042 g016
Figure 17. Time series graph of the 50 °C TC heating element powered via PV panels during a period of sunny weather in April 2025. Graph (A) represents the temperature readings of the cores of the heating element. Lines labeled left1-3/right1-3 represent temperature readings of heating element cores, see text for details. Graph (B) represents the temperature readings of the water in the tank. Lines labeled temp50-450 represent temperature in water heater tank at depths of 50 mm to 450 mm, see text for details.
Solar 05 00042 g017
Figure 18. Time series graph of the 50 °C TC heating element powered via PV panels during one day of sunny weather. Graph (A) presents the temperature readings of the cores of the heating element. Lines labeled left1-3/right1-3 represent temperature readings of heating element cores, see text for details. Graph (B) presents the temperature readings of the water in the tank. Lines labeled temp50-450 represent temperature in water heater tank at depths of 50 mm to 450 mm, see text for details.
Solar 05 00042 g018
Figure 19. Daily global horizontal insolation for the Anchorage, Alaska area sourced from the ERA5 data set.
Solar 05 00042 g019
Table 1. Summary table showing loaded power dissipation and resistance after 75 h of continuous operation heating 45.4 L of water. Unloaded resistances were described previously.
DeviceTC
°C
Potential
V
Loaded
Power
W
Loaded
Resistance
Ω
Unloaded
Resistance
Ω
Loading
Multiplier
Heater “A”706045.978.530.32.59
Heater “A”709067.6120.130.33.96
Heater “A”7011071.6169.430.35.59
Heater “C”509047.7169.619.88.57
Disclaimer/Publisher’s Note: The statements, opinions and data contained in all publications are solely those of the individual author(s) and contributor(s) and not of MDPI and/or the editor(s). MDPI and/or the editor(s) disclaim responsibility for any injury to people or property resulting from any ideas, methods, instructions or products referred to in the content.