

Experimental Studies on Partial Energy Harvesting by Novel Solar Cages, Microworlds, to Explore Sustainability

 ,
, 
Abstract
1. Introduction
2. Experimental Design
Configurations of the Cage
3. Results
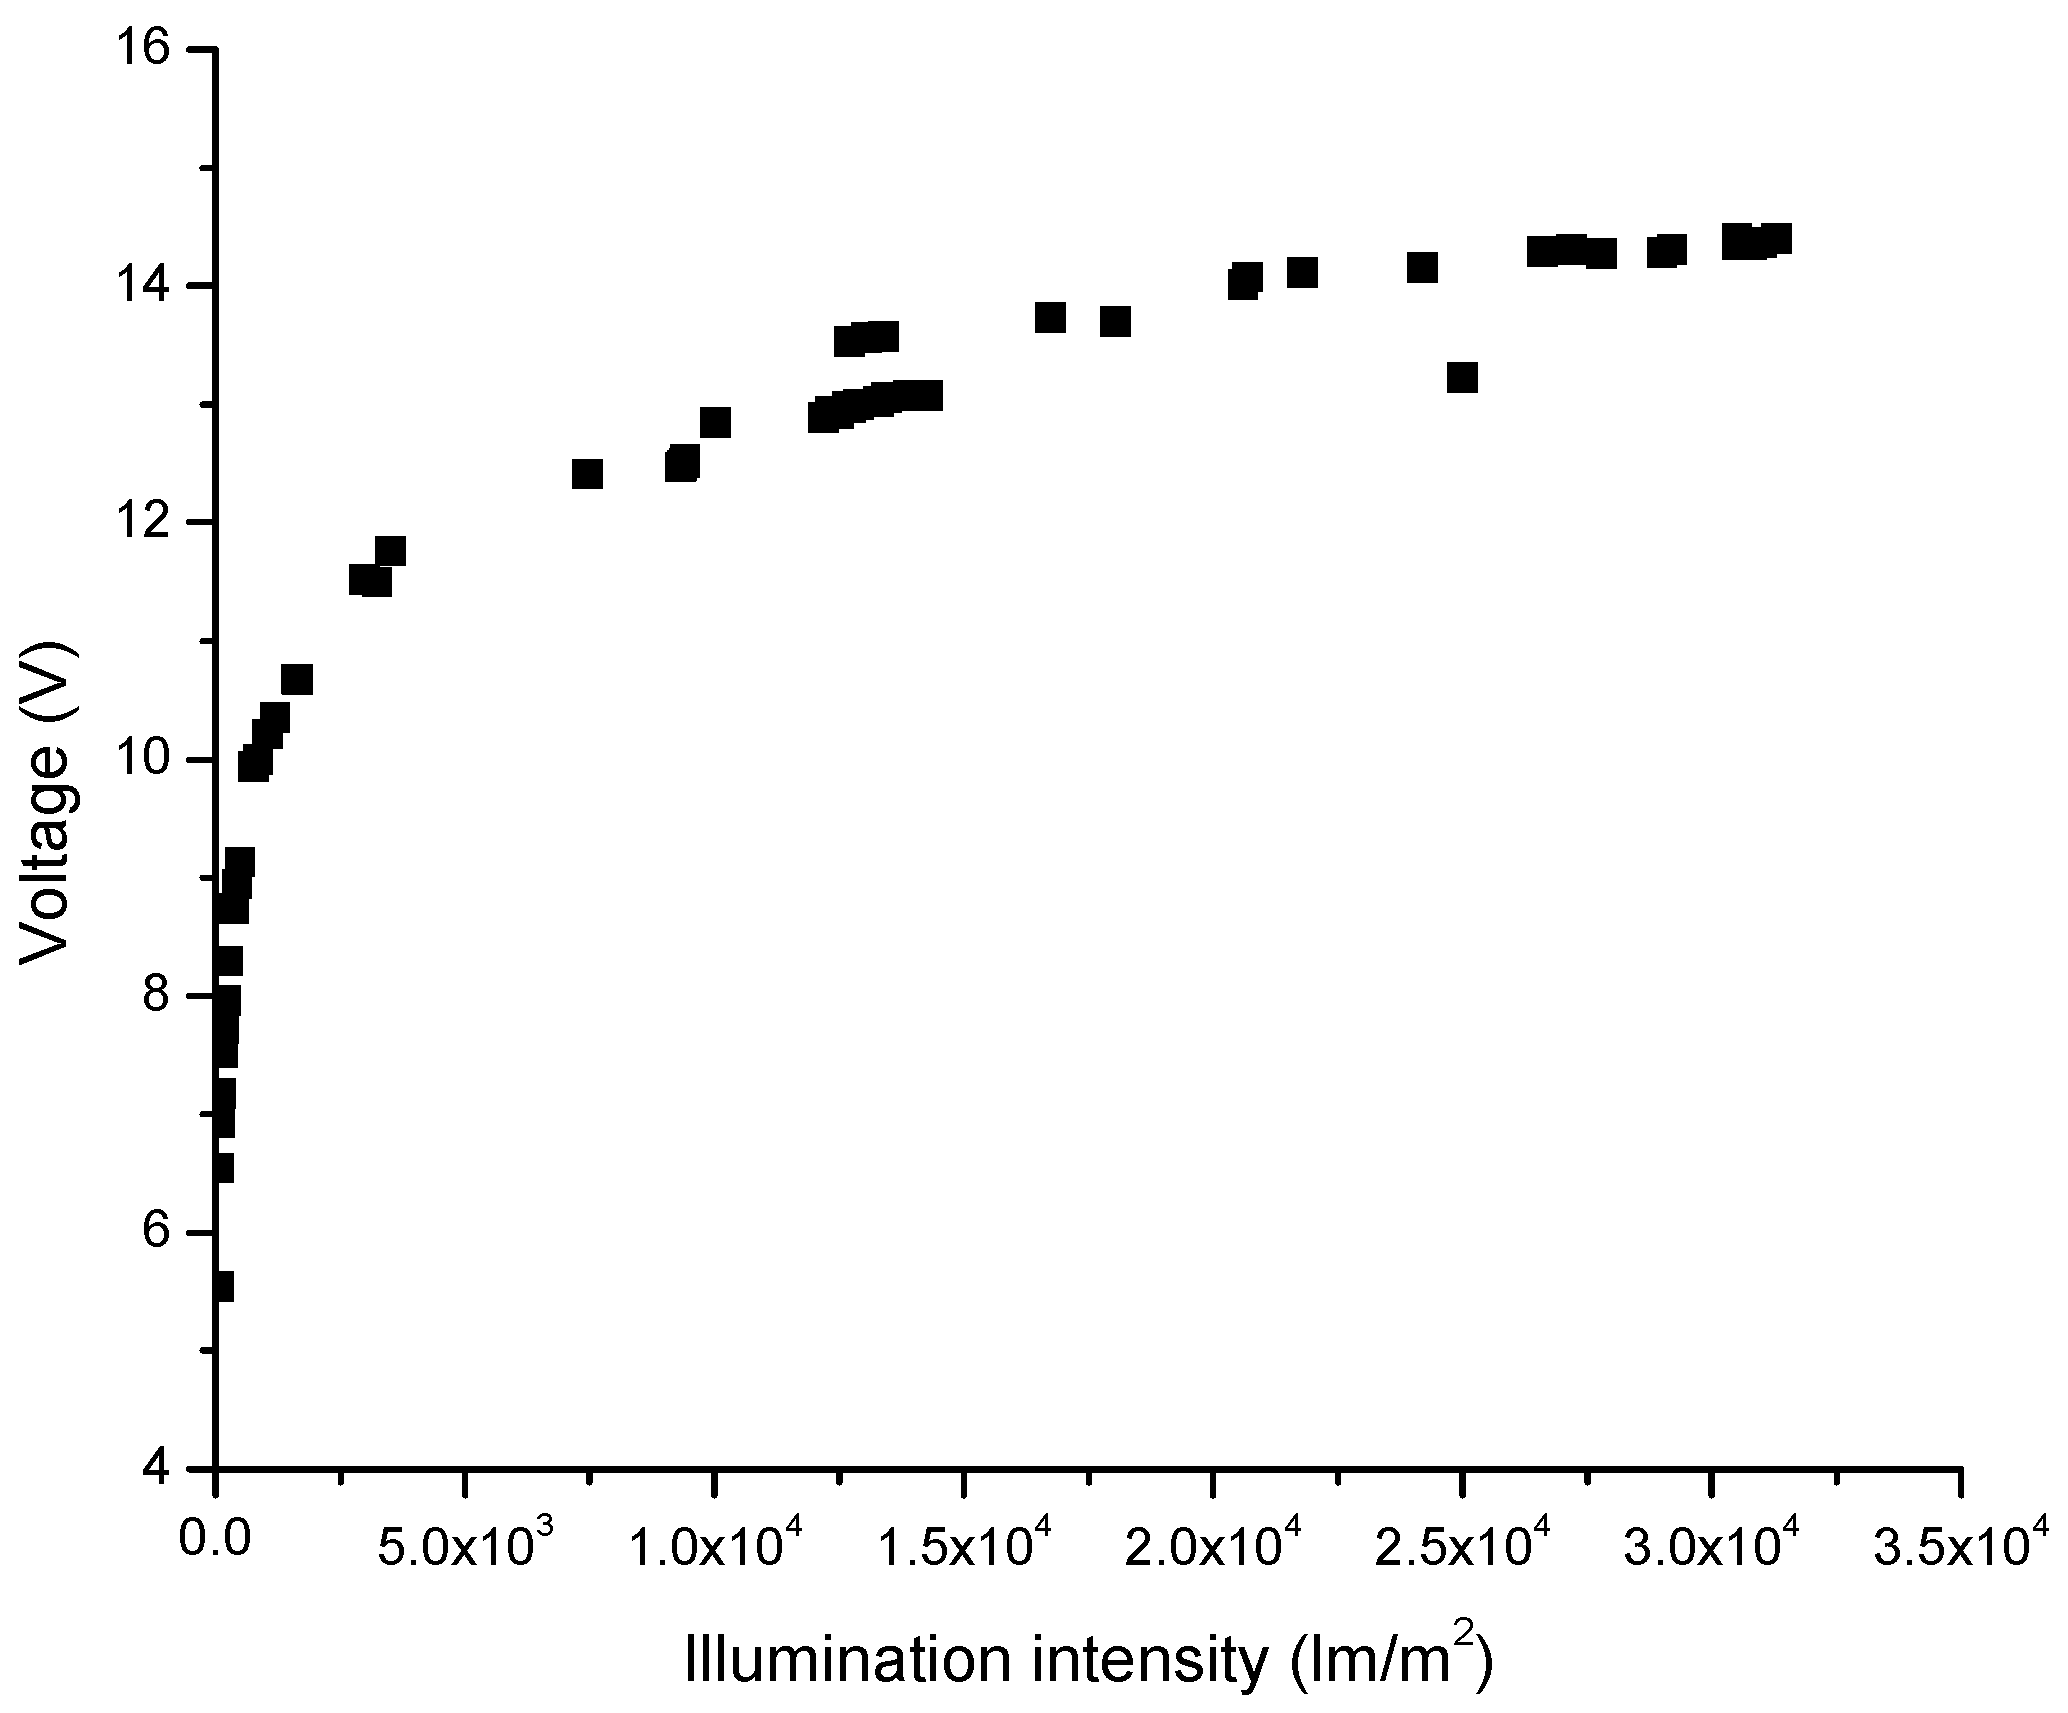
3.1. Reported Results on 3-Panel Structure
3.2. Results on 5-Panel Structure
3.3. Potential Impact on Biological System
3.4. Limitation
4. Discussion and Conclusions
Author Contributions
Funding
Institutional Review Board Statement
Informed Consent Statement
Data Availability Statement
Acknowledgments
Conflicts of Interest
Appendix A

| Variables | Meaning |
|---|---|
| PV | Photovoltaics |
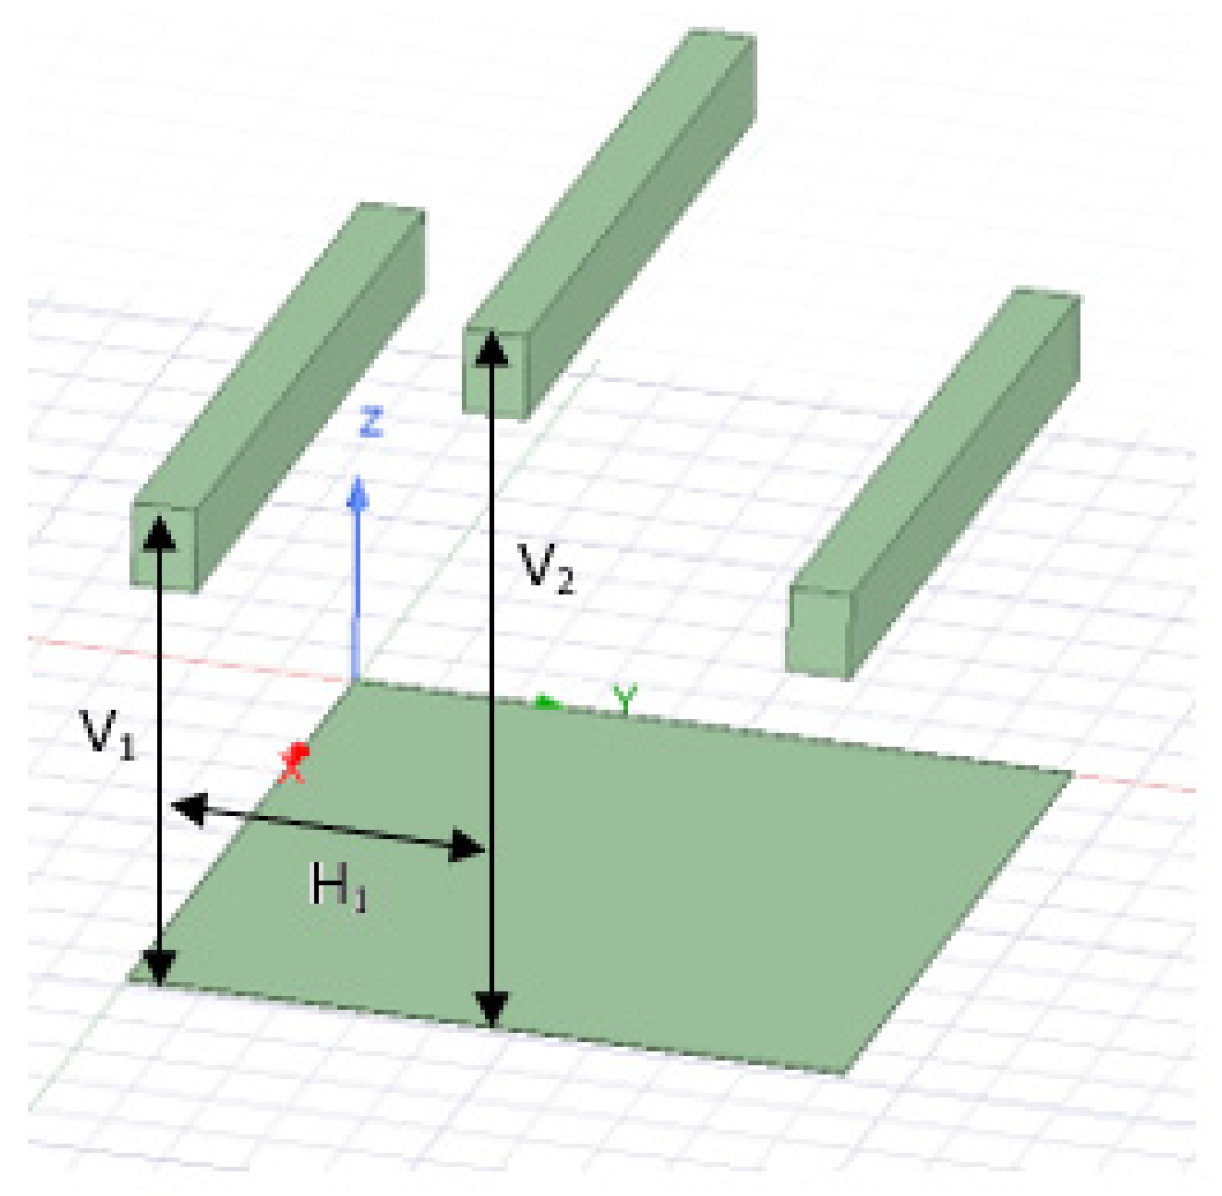
| V1 | Side panel height |
| V2 | Middle panel height |
| H1 | Horizontal distance between panels |
| MP | Measuring panel |
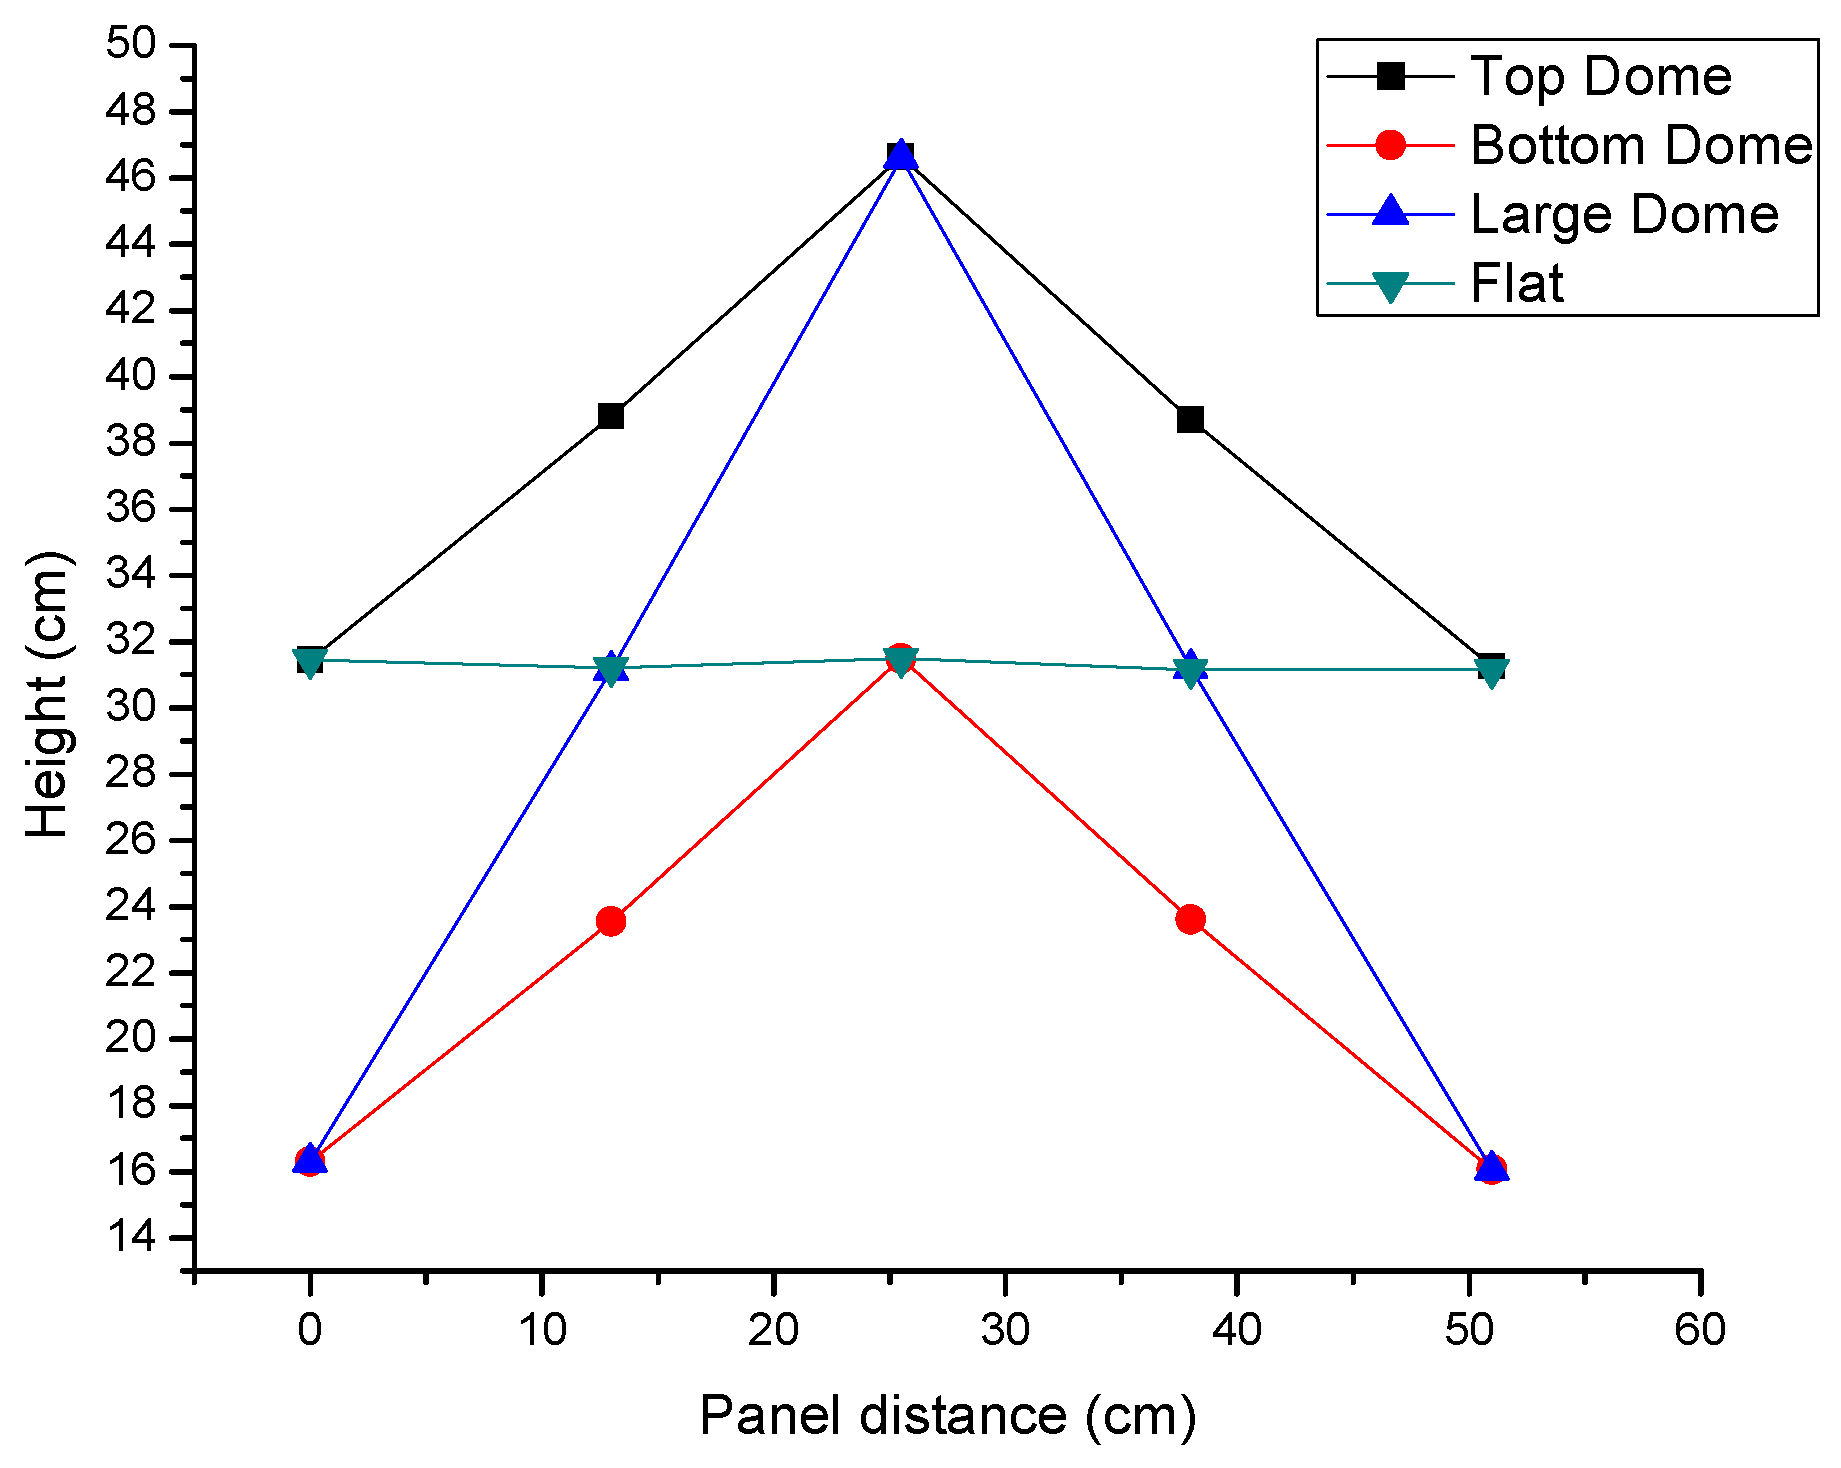
| Top Dome | The structure with largest height |
| Bottom Dome | The structure with smallest height |
| Large Dome | The structure with wide height variation |
| Flat | All panels at the same height |
| Panel voltage avg | Average voltage of 5 panels |
| MP avg | MP average voltage of diagonal measurements |
References
- IEA. World Energy Outlook 2022; IEA: Paris, France, 2022; Available online: https://www.iea.org/reports/world-energy-outlook-2022 (accessed on 9 July 2025).
- Hughes, K.M.; Phillips, C.C. A Quantitative Analysis of the Need for High Conversion Efficiency Pv Technologies In Carbon Mitigation Strategies. Solar 2024, 4, 209–221. [Google Scholar] [CrossRef]
- Widmer, J.; Christ, B.; Grenz, J.; Norgrove, L. Agrivoltaics, A Promising New Tool for Electricity and Food Production: A Systematic Review. Renew. Sustain. Energy Rev. 2024, 192, 114277. [Google Scholar] [CrossRef]
- Scroggins, R.E.; Fry, J.P.; Brown, M.T.; Neff, R.A.; Asche, F.; Anderson, J.L.; Love, D.C. Renewable Energy in Fisheries and Aquaculture: Case Studies from the United States. J. Clean. Prod. 2022, 376, 134153. [Google Scholar] [CrossRef]
- Ho, A.M.; Jaafar, H.Z.; Grozescu, I.V.; Zaharin, M.Z.A.B. Solar Powered Gravity-Feed Drip Irrigation System Using Wireless Sensor Network. Int. J. Environ. Sci. Dev. 2015, 6, 970–973. [Google Scholar] [CrossRef]
- Gates, D.M. Biophysical Ecology; Dover Publications: New York, NY, USA, 1980. [Google Scholar]
- Campbell, G.S.; Norman, J.M. An Introduction to Environmental Biophysics, 2nd ed.; Springer: New York, NY, USA, 1998. [Google Scholar]
- Li, Y.; Grabham, N.J.; Beeby, S.P.; Tudor, M.J. The Effect of the Type of Illumination on the Energy Harvesting Performance of Solar Cells. Solar Energy 2015, 111, 21–29. [Google Scholar] [CrossRef]
- Naimah, D.Y.N.; Novitasaria, D.; Indartonoa, Y.S.; Wulandaric, E. Technoeconomic and Environment Assessment of Rural Electrification Using Solar Photovoltaic (Case Study in Parang Island, Indonesia). Int. J. Smart Grid Clean Energy 2020, 9, 383–389. [Google Scholar] [CrossRef]
- Boyd, M. The Potential of Agrivoltaics for the US Solar Industry, Farmers and Communities. PV Tech Power 2023, 34, 8. [Google Scholar]
- Carroll, M. Available online: https://craven.ces.ncsu.edu/considerations-for-transferring-agricultural-land-to-solar-panel-energy-production/ (accessed on 10 May 2025).
- Daniels, T.L.; Wagner, H. Regulating Utility-Scale Solar Projects on Agricultural Land, Kleinman Center for Energy Policy, Aug. 2022. Available online: https://kleinmanenergy.upenn.edu/wp-content/uploads/2022/08/KCEP-Regulating-Utility-Scale-Solar-Projects.pdf (accessed on 9 July 2025).
- United States Department of Energy, Solar Energy Technologies Office. Available online: https://www.energy.gov/eere/solar/farmers-guide-going-solar (accessed on 10 May 2025).
- Khan, M.A.; Vannette, M.D. Experimental Study of a Solar Cage on Energy Harvest and Unconsumed Energy. In 2024 the 8th International Conference on Energy and Environmental Science ICEES; Springer: Cham, Switzerland, 2024. [Google Scholar]
- Edwards, G.; Walker, D. C3, C4: Mechanisms, and Cellular and Environmental Regulation of Photosynthesis; University of California Press: Berkeley, CA, USA, 1983. [Google Scholar]
- Ibrahim, N.I.; Omer, M.M.B.E. The Effect of Wavelength of Light on Solar Electrical Performance. In Proceedings of the ASME 2020 Power Conference Proceedings, Anaheim, CA, USA, 2–6 August 2020. [Google Scholar]
- Best Research Cell Efficiencies, NREL. Available online: https://www.nrel.gov/pv/cell-efficiency.html (accessed on 19 June 2025).
- Khan, M.A.; Franzel, Z.D.; Gransden, G.; Maricle, B.; Vannette, M. An Experimental Study of Partial Energy Harvesting by Solar Cages for Sustainability. In Proceedings of the ICGEA Conference, Singapore, 7–9 March 2025. [Google Scholar]
- Khan, M.A.; Gransden, G.; Franzel, Z.D.; Maricle, B.; Vannette, M. Solar Energy Harvesting Study Using Solar Cages and Sustainability. In Proceedings of the 10th International Conference on Sustainable and Renewable Energy Engineering (ICSREE 2025), Nice, France, 13–16 May 2025. [Google Scholar]
- Lambers, H.; Chapin, F.S.; Pons, T.L. Plant Physiological Ecology; Springer: New York, NY, USA, 1998. [Google Scholar]
- Niinemets, Ü. A Review of Light Interception in Plant Stands from Leaf to Canopy in Different Plant Functional Types and in Species with Varying Shade Tolerance. Ecol. Res. 2010, 25, 693–714. [Google Scholar] [CrossRef]
- Björkman, O. Responses to Different Quantum Flux Densities. In Physiological Plant Ecology I. Encyclopedia of Plant Physiology; Lange, O.L., Nobel, P.S., Osmond, C.B., Ziegler, H., Eds.; Springer: Berlin/Heidelberg, Germany, 1981; Volume 12A, pp. 57–107. [Google Scholar]

| Heights (cm) | Top Dome | Bottom Dome | Large Dome | Flat |
|---|---|---|---|---|
| Panel 1 | 31.45 | 16.3 | 16.3 | 31.45 |
| Panel 2 | 38.8 | 23.55 | 31.15 | 31.2 |
| Panel 3 | 46.65 | 31.5 | 46.6 | 31.5 |
| Panel 4 | 38.7 | 23.6 | 31.2 | 31.15 |
| Panel 5 | 31.25 | 16.05 | 16.05 | 31.15 |
| Illumination Intensity (lm/m2) | 66.5 | 310.0 | 402.0 | 3050.0 | 25,100.0 | 10,1200.0 |
| Output Voltage (V) | 4.01 | 6.47 | 6.73 | 8.68 | 9.82 | 10.26 |
| Time of a Day | Panel Voltage (V) | MP Voltage (V) |
|---|---|---|
| 10:30 a.m. | 9.74 | 9.40 |
| 11:00 a.m. | 9.84 | 8.71 |
| 11:30 a.m. | 9.62 | 9.20 |
| 12:00 p.m. | 9.49 | 8.97 |
| Top Dome | Bottom Dome | Large Dome | Flat | |
|---|---|---|---|---|
| Time | 1:30 p.m. | 1:55 p.m. | 1:47 p.m. | 2:00 p.m. |
| Panel 1 Voltage (V) | 13.41 | 13.65 | 13.48 | 13.54 |
| Panel 2 Voltage (V) | 13.47 | 13.71 | 13.58 | 13.56 |
| Panel 3 Voltage (V) | 13.48 | 13.70 | 13.61 | 13.50 |
| Panel 4 Voltage (V) | 13.48 | 13.67 | 13.57 | 13.51 |
| Panel 5 Voltage (V) | 13.51 | 13.61 | 13.44 | 13.55 |
| Panel voltage avg (V) | 13.47 | 13.67 | 13.53 | 13.53 |
| MP avg (V) | 13.25 | 13.32 | 13.40 | 13.34 |
| Top Dome | Bottom Dome | Large Dome | Flat | |
|---|---|---|---|---|
| Time | 1:40 p.m. | 2:02 p.m. | 1:51 p.m. | 2:14 p.m. |
| Panel 1 Voltage (V) | 14.40 | 14.15 | 14.07 | 14.25 |
| Panel 2 Voltage (V) | 14.43 | 14.31 | 14.43 | 14.35 |
| Panel 3 Voltage (V) | 14.37 | 14.37 | 14.34 | 14.37 |
| Panel 4 Voltage (V) | 14.40 | 14.37 | 13.94 | 14.40 |
| Panel 5 Voltage (V) | 14.34 | 14.26 | 13.87 | 14.20 |
| MP avg (V) | 14.27 | 14.12 | 14.15 | 14.34 |
| Calculated intensity (×103 lux) | 30.00 | 26.00 | 27.00 | 31.00 |
| Top Dome | Bottom Dome | Large Dome | Flat | |
|---|---|---|---|---|
| Panel equivalent light intensity (lux) | 15,999.59 | 18,723.14 | 16,847.01 | 16,801.87 |
| MP equivalent light intensity (lux) | 13,417.83 | 14,213.50 | 15,199.60 | 14,439.61 |
| % Change | 16.13 | 24.08 | 9.77 | 14.05 |
| Top Dome | Bottom Dome | Large Dome | Flat | |
|---|---|---|---|---|
| Time | 12:31 p.m. | 12:55 p.m. | 12:22 p.m. | 12:37 p.m. |
| Panel 1 voltage (V) | 13.84 | 13.89 | 14.02 | 13.99 |
| Panel 2 voltage (V) | 13.79 | 13.83 | 14.12 | 14.06 |
| Panel 3 voltage (V) | 13.97 | 13.91 | 13.89 | 13.92 |
| Panel 4 voltage (V) | 14.00 | 14.02 | 13.90 | 14.01 |
| Panel 5 voltage (V) | 13.89 | 14.04 | 13.69 | 14.00 |
| Panel voltage avg (V) | 13.90 | 13.94 | 13.92 | 13.99 |
| MP avg (V) | 13.72 | 13.83 | 13.98 | 13.87 |
| Top Dome | Bottom Dome | Large Dome | Flat | |
|---|---|---|---|---|
| Panel equivalent light intensity (lux) | 22,428.13 | 23,147.38 | 22,893.06 | 24,231.46 |
| MP equivalent light intensity (lux) | 19,488.97 | 21,256.32 | 23,927.43 | 21,938.00 |
| % Change | 13.10 | 8.17 | −4.52 | 9.46 |
| Panel Equivalent Light Intensity (klux) | MP Equivalent Light Intensity (klux) | % Change | |
|---|---|---|---|
| Top Dome | 32.00 | 14.86 | 53.55 |
| Bottom Dome | 35.00 | 14.86 | 57.53 |
| 104.00 | 55.06 | 47.05 |
| Light Intensity (klux) | Power Generated/Panel (mW) |
|---|---|
| 25 | 12.40 |
| 34 | 12.60 |
| 40 | 12.70 |
| 49 | 12.80 |
| 73 | 13.00 |
| 140 | 13.05 |
Disclaimer/Publisher’s Note: The statements, opinions and data contained in all publications are solely those of the individual author(s) and contributor(s) and not of MDPI and/or the editor(s). MDPI and/or the editor(s) disclaim responsibility for any injury to people or property resulting from any ideas, methods, instructions or products referred to in the content. |
© 2025 by the authors. Licensee MDPI, Basel, Switzerland. This article is an open access article distributed under the terms and conditions of the Creative Commons Attribution (CC BY) license (https://creativecommons.org/licenses/by/4.0/).
Share and Cite
Khan, M.A.; Maricle, B.; Franzel, Z.D.; Gransden, G.; Vannette, M. Experimental Studies on Partial Energy Harvesting by Novel Solar Cages, Microworlds, to Explore Sustainability. Solar 2025, 5, 36. https://doi.org/10.3390/solar5030036
Khan MA, Maricle B, Franzel ZD, Gransden G, Vannette M. Experimental Studies on Partial Energy Harvesting by Novel Solar Cages, Microworlds, to Explore Sustainability. Solar. 2025; 5(3):36. https://doi.org/10.3390/solar5030036
Chicago/Turabian StyleKhan, Mohammad A., Brian Maricle, Zachary D. Franzel, Gabe Gransden, and Matthew Vannette. 2025. "Experimental Studies on Partial Energy Harvesting by Novel Solar Cages, Microworlds, to Explore Sustainability" Solar 5, no. 3: 36. https://doi.org/10.3390/solar5030036
APA StyleKhan, M. A., Maricle, B., Franzel, Z. D., Gransden, G., & Vannette, M. (2025). Experimental Studies on Partial Energy Harvesting by Novel Solar Cages, Microworlds, to Explore Sustainability. Solar, 5(3), 36. https://doi.org/10.3390/solar5030036