Article

Spatial Strategies for the Renewable Energy Transition: Integrating Solar Photovoltaics into Barcelona’s Urban Morphology

by
Maryam Roodneshin
1,*,
Adrian Muros Alcojor
2 and
Torsten Masseck
2
1
Doctoral Programme in Architectural, Building Construction and Urbanism Technology, Universitat Politècnica de Catalunya UPC, 08034 Barcelona, Spain
2
Department of Architectural Technology, Universitat Politècnica de Catalunya UPC, 08034 Barcelona, Spain
*
Author to whom correspondence should be addressed.
Solar 2025, 5(3), 34; https://doi.org/10.3390/solar5030034
Submission received: 7 May 2025 / Revised: 2 July 2025 / Accepted: 4 July 2025 / Published: 23 July 2025

Abstract

This study investigates strategies for urban-scale renewable energy integration through a photovoltaic-centric approach, with a case study of a district in Barcelona. The methodology integrates spatial and morphological data using a geographic information system (GIS)-based and clustering framework to address challenges of CO2 emissions, air pollution, and energy inefficiency. Rooftop availability and photovoltaic (PV) design constraints are analysed under current urban regulations. The spatial analysis incorporates building geometry and solar exposure, while an evolutionary optimisation algorithm in Grasshopper refines shading analysis, energy yield, and financial performance. Clustering methods (K-means and 3D proximity) group PV panels by solar irradiance uniformity and spatial coherence to enhance system efficiency. Eight PV deployment scenarios are evaluated, incorporating submodule integrated converter technology under a solar power purchase agreement model. Results show distinct trade-offs among PV scenarios. The standard fixed tilted (31.5° tilt, south-facing) scenario offers a top environmental and performance ratio (PR) = 66.81% but limited financial returns. In contrast, large- and huge-sized modules offer peak financial returns, aligning with private-sector priorities but with moderate energy efficiency. Medium- and large-size scenarios provide balanced outcomes, while a small module and its optimised rotated version scenarios maximise energy output yet suffer from high capital costs. A hybrid strategy combining standard fixed tilted with medium and large modules balances environmental and economic goals. The district’s morphology supports “solar neighbourhoods” and demonstrates how multi-scenario evaluation can guide resilient PV planning in Mediterranean cities.

1. Introduction

The global energy transition requires urgent action, particularly in urban environments, which account for the majority of energy consumption and CO2 emissions. Photovoltaic systems offer a decentralised and scalable alternative to fossil fuels, supporting grid resilience and reducing energy infrastructure demands.
While urban morphology significantly influences solar performance, conventional planning often neglects its integration with solar strategies. Prior studies have addressed rooftop PV feasibility but rarely incorporate holistic spatial design approaches. To address this gap, this study introduces a PV-centric clustering methodology tailored for diverse urban configurations.
Barcelona, a compact Mediterranean city with high solar irradiance, serves as the case study. Although Spain has rapidly expanded its solar capacity, most installations remain in remote areas, leading to transmission inefficiencies. Localised rooftop PV systems in dense neighbourhoods like La Vila Olímpica can enhance both energy independence and urban resilience.
La Vila Olímpica del Poblenou, located in the Sant Martí district, is a well-known example of sustainable urban redevelopment. Transformed from an industrial zone for the 1992 Olympics, it now features energy-efficient buildings, a CHP plant, pedestrian-friendly design, and green spaces. With over 31,000 m2 of available rooftop area and its location in a dense urban core, the neighbourhood offers strong potential for rooftop PV integration, making it a relevant and strategic case for this study.
A multi-scale methodological framework was developed, integrating GIS data, 3D urban modelling, and clustering algorithms within the Grasshopper environment. The analysis combines spatial, economic, and environmental metrics to optimise PV placement and performance.
This study aims to:
  • Quantify solar potential across varied urban morphologies;
  • Optimise PV layout through clustering techniques;
  • Deliver practical strategies for sustainable, economically viable urban energy design.
By linking urban form with decentralised energy systems, this research contributes a replicable framework for advancing solar-positive neighbourhoods.

2. State-of-the-Art Review

Research on urban energy systems and solar integration has significantly advanced in recent years (Yr), moving from descriptive studies of urban form to sophisticated, data-driven modelling. Earlier works established fundamental links between urban morphology and energy performance and renewable integration. Metrics such as the surface-to-volume ratio, sky view factor, and floor space index have long been used to assess urban energy performance [1,2]. Rooftop PV systems, when well integrated, can supply up to 35–61% of local electricity demand in urban areas like New Jersey and Arizona [3], and two-thirds in Slovakia [4], reflecting the global applicability of decentralised generation across varied climatic and urban contexts. In Spain, and particularly in Barcelona, high solar radiation (4.3 kWh/m2/day) offers excellent conditions for rooftop PV deployment [5]. While compact urban forms support sustainable transportation and infrastructure efficiency, they pose challenges like mutual shading and limited rooftop exposure [6].
Recent literature emphasises the growing role of urban-scale photovoltaic (PV) systems in climate mitigation strategies. Studies by the authors of [7,8] highlight how decentralised PV deployment supports energy independence and enhances urban resilience. Scenario-based approaches now use GIS data, clustering methods, and machine learning techniques to optimise PV deployment at the district and building levels [9,10]. Advanced methods such as GIS-based solar mapping, clustering algorithms, and parametric simulation are now widely adopted to evaluate solar potential in heterogeneous urban contexts [11,12].
Computational tools, such as Ladybug, Honeybee, and the System Advisor Model [13], are increasingly used to bridge the gap between spatial design and energy performance. These tools allow integration of climate data, geometric parameters, and economic analysis into urban energy simulations [14,15]. Moreover, machine learning and evolutionary algorithms enable optimisation of PV placement to reduce shading effects and maximise yield [13,16,17].
Curreli and Coch Roura [14] highlighted how urban morphology—including building height, façade orientation, and street layout—affects solar accessibility. Economic factors, such as the payback period and policy incentives, also impact adoption. In the European context, policy changes have also catalysed PV adoption. The elimination of Spain’s “sun tax,” coupled with feed-in incentives and updated self-consumption regulations, has created a favourable environment for distributed solar systems [18,19,20]. Nevertheless, regulatory uncertainty and technical challenges, such as grid capacity, urban density, and diverse roof typologies, require spatially adaptive and interdisciplinary planning frameworks [21].
This research advances the field by introducing a clustering-based methodology tailored to the spatial, environmental, and economic dynamics of urban neighbourhoods. The selected case, La Vila Olímpica del Poblenou, holds a unique position as a landmark of sustainable urban development and serves as a representative model for compact Mediterranean cities.
Despite notable advancements in computational urbanism and energy-conscious design, a significant methodological gap remains in effectively linking urban morphology with photovoltaic (PV) system optimisation in a scalable and transferable manner. Existing approaches often address solar performance or urban geometry in isolation, lacking integrative frameworks that simultaneously accommodate spatial, environmental, and economic dimensions. To bridge this gap, the present study introduces a holistic methodology that combines multi-scalar, scenario-based analysis with 3D urban modelling and parametric clustering techniques. This interdisciplinary framework aims to support informed decision-making in complex urban environments by integrating spatial planning, energy system modelling, and economic feasibility assessments. As urban energy challenges grow increasingly complex, there is a pressing need for robust, data-driven strategies that embed PV optimisation within the broader framework of sustainable urban development [22].

3. Methodology Overview

This study applies a multi-layered approach to assess rooftop PV integration in urban areas, focusing on energy efficiency, solar potential, and spatial configuration. Morphological parameters—including building density, geometry, height-to-width ratios, orientation, and shading—were analysed for their influence on solar access [23].
La Vila Olímpica in Barcelona was chosen as a representative case due to its diverse urban layout and sustainability relevance. GIS and 3D modelling tools (Rhinoceros 6 SR17 (version 6.17.19235.15041, released on 23 August 2019) [24], Grasshopper [25], and its plugins Ladybug and Honeybee [26]) were used to extract key spatial features. PV simulations using PVWatts and EnergyPlus [27] modelled hourly outputs across a full year, accounting for shading and system losses.
The method we used integrates urban form analysis, PV sizing, solar modelling, and financial evaluation using an evolutionary optimisation algorithm [28], enabling the identification of optimal configurations under different economic and environmental conditions [28]. Figure 1 shows the 3D satellite model; Table S7 in the Supplementary Materials outlines the neighbourhood’s morphological features.
The full workflow includes the following: (1) 3D neighbourhood modelling via ArcGIS Desktop version 10.3 [29] and Rhino; (2) rooftop solar radiation analysis under spatial-temporal variation; (3) a two-tier shading study accounting for inter-building and inter-row effects; (4) a financial model exploring cost sensitivity to system size, efficiency, and module area; and (5) a multi-scenario optimisation to evaluate performance under environmental and economic constraints.

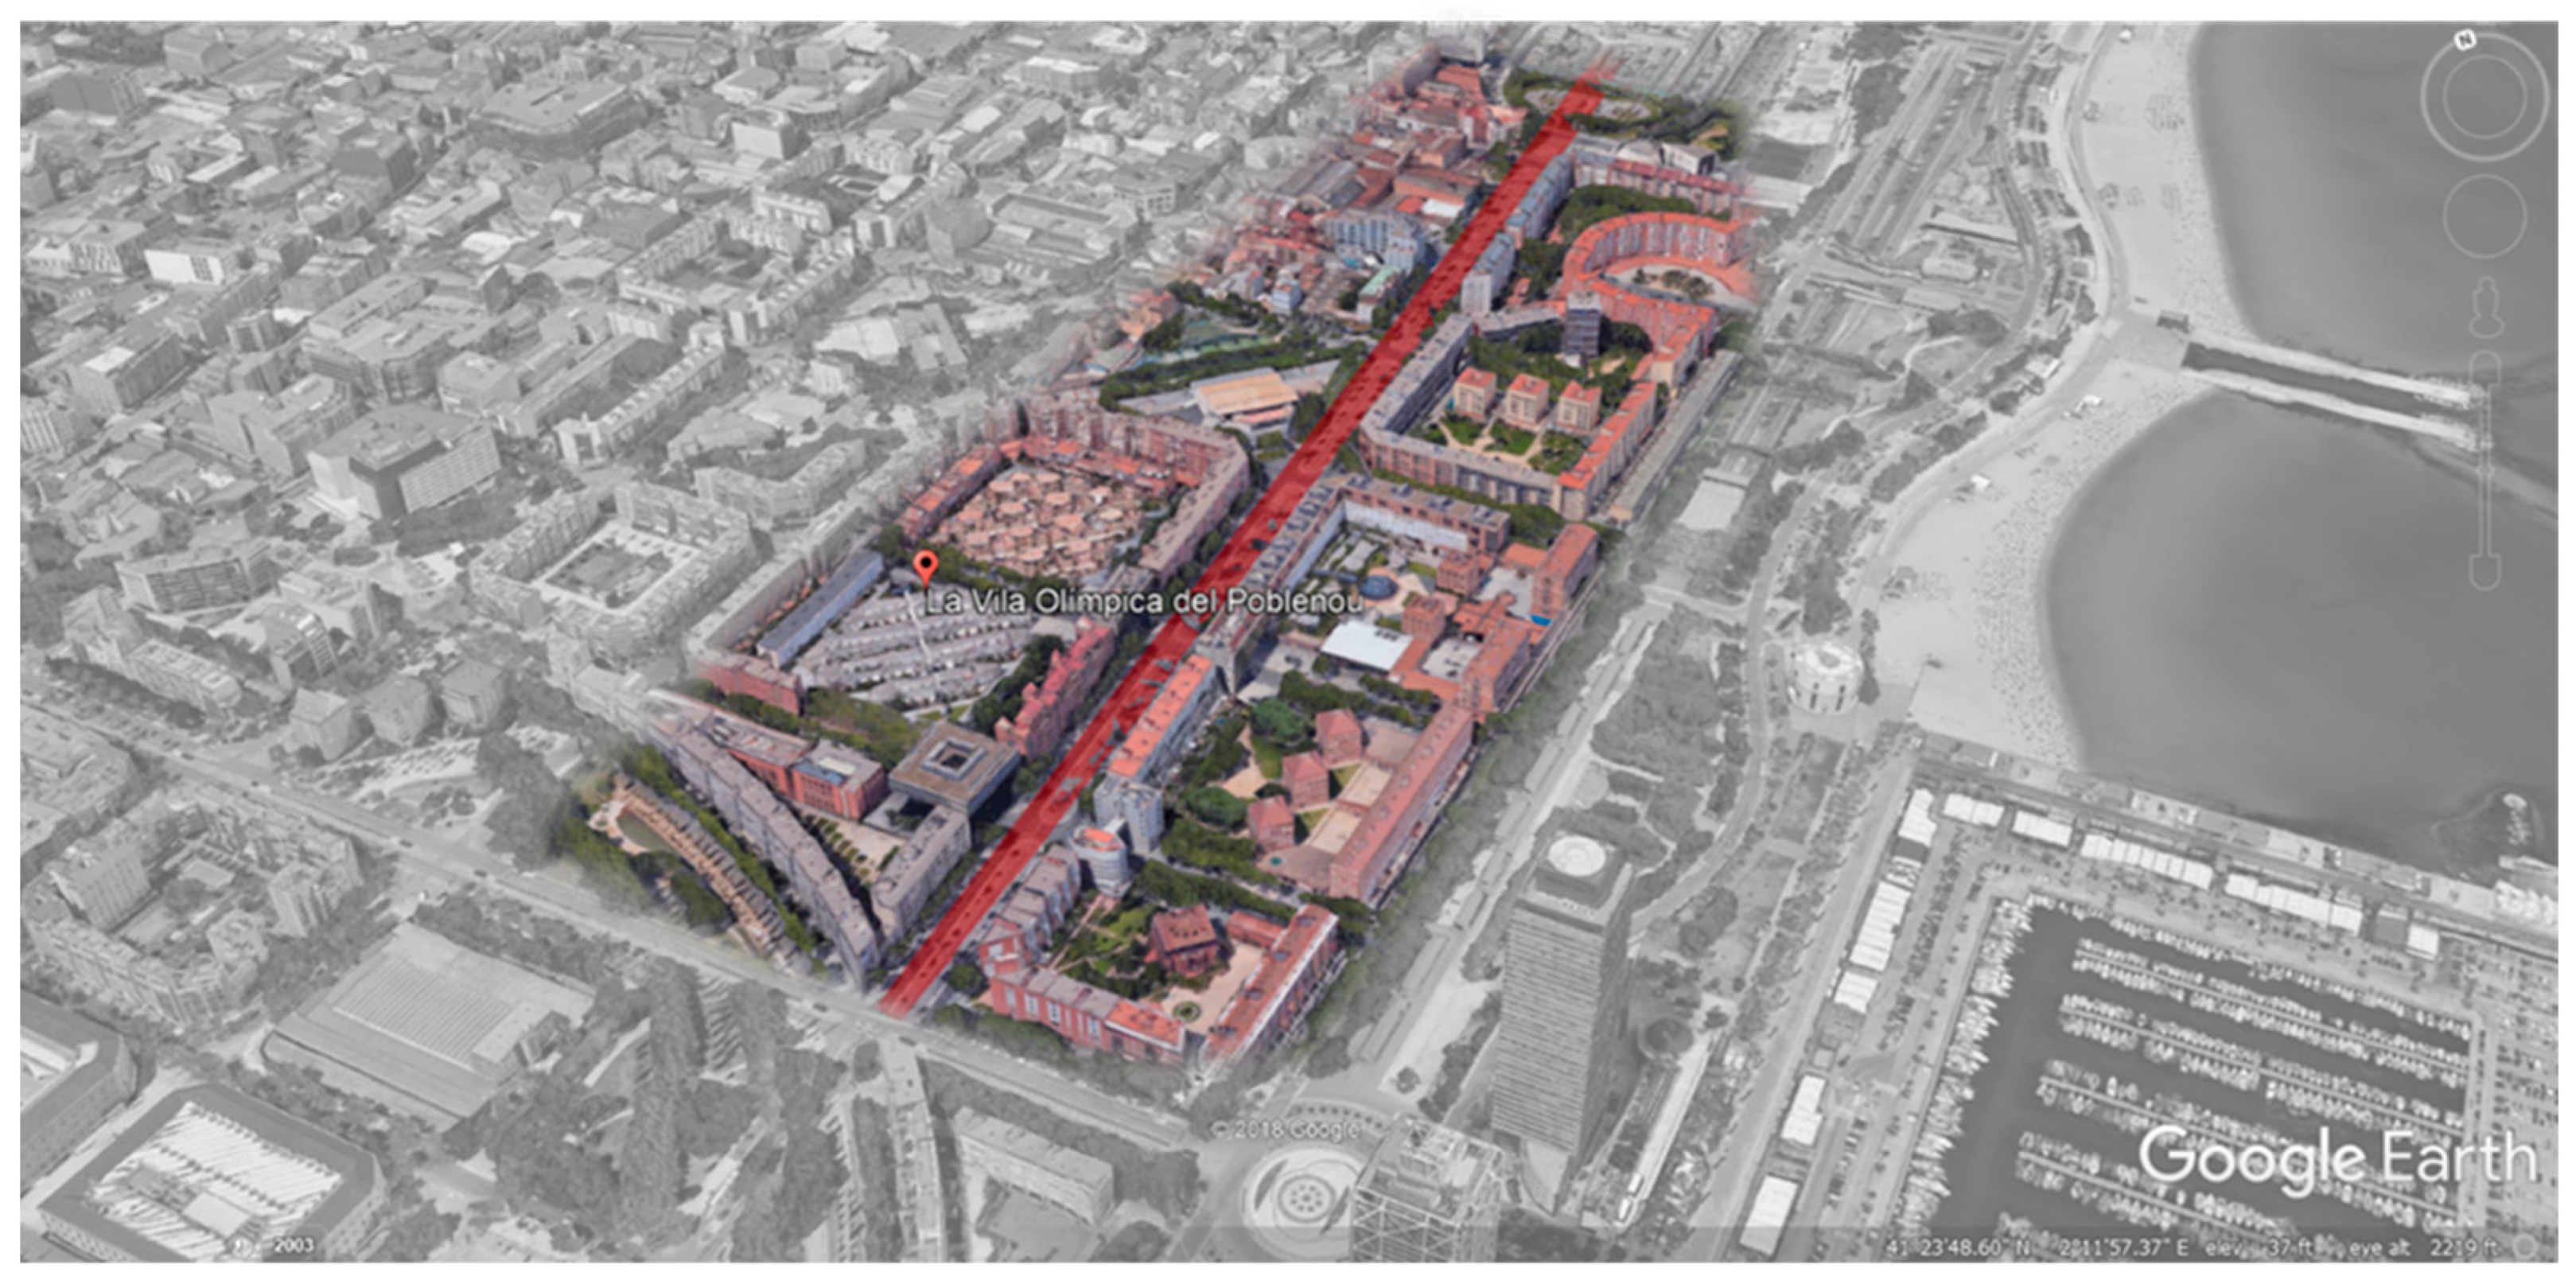
3.1. Neighbourhood Morphology and 3D Modelling

The selected area in La Vila Olímpica del Poblenou, Barcelona (~31,150 m2), was selected for its morphological diversity and solar potential. A detailed 3D model was developed using ArcGIS (Feature Analyst) and Rhino (Grasshopper plugins). Figure 2 and Figure S1 (Figures S1–S40 and Tables S1–S6 referenced in this section are provided in the Supplementary Materials File) showcase buildings with specific tags in the Rhino platform, offering a visual representation of the tagged buildings within a digital environment, showing buildings’ height, compactness, roof area, and inclination, which were classified for PV analysis. A census-based approach, following Schallenberg-Rodriguez [30], estimated rooftop availability, using aggregated building stock and land-use data to complement the geometric 3D modelling, shown in Table S7.

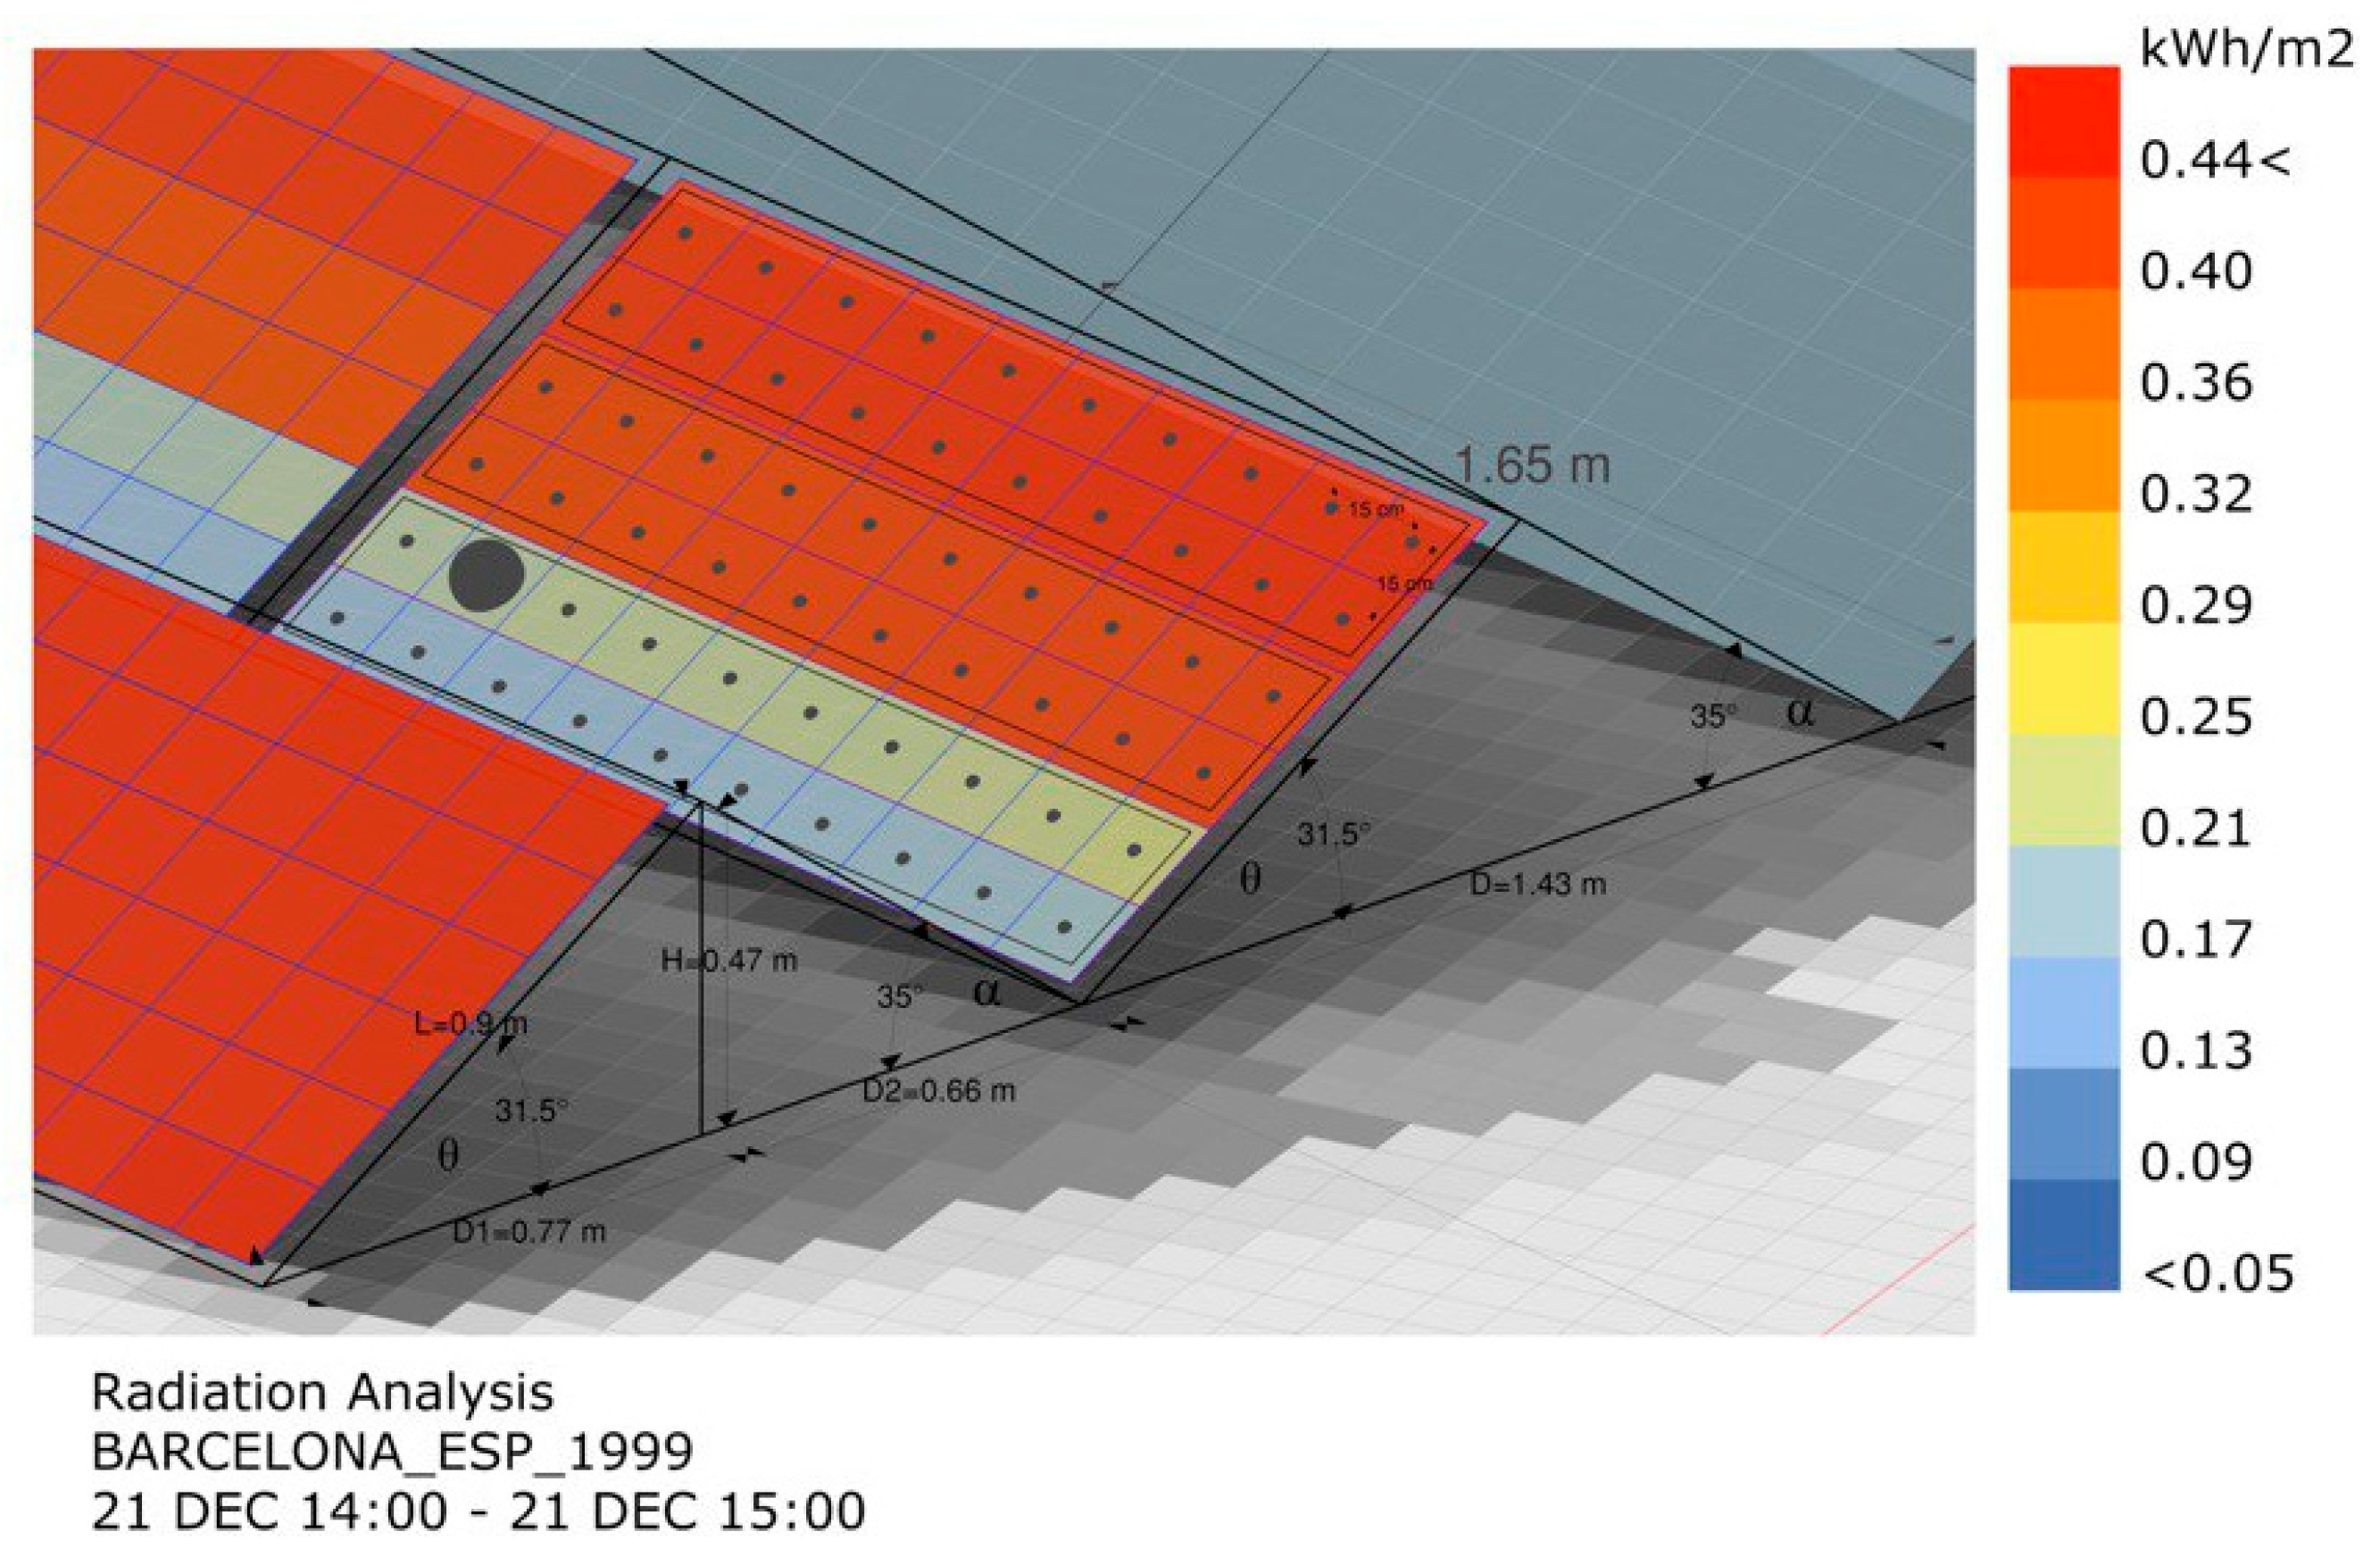
3.2. Solar Radiation, Electricity Modelling, and Geometrical Placement of PV Panels

Electricity generation was modelled using EnergyPlus (2021), incorporating Barcelona-specific EnergyPlus Weather (EPW) data [31] across 8760 hourly intervals. The simulation integrates key meteorological variables, solar irradiance, ambient temperature, and wind speed, to estimate alternating current (AC) output, cell temperature, and energy losses [13]. The sun’s position was calculated hourly to determine solar altitude (α) and azimuth (β), which define the module orientation and angle of incidence (AOI). These geometric angles, essential for reducing shading and improving energy yield [32], are detailed in Appendix A and Figures S2 and S3 of the Supplementary Materials.
After calculating the total rooftop area, reductions were applied to identify usable space for PV installations. Shading, obstructions, tilt angle, and service area (SA) requirements were considered [4,33,34]. A 90 cm roof-edge offset and a 31.5° tilt (from the Perez model) were used [35] (Figure 3), reducing the ground coverage ratio (GCR) from 100% to ~42%. Panels not meeting radiation thresholds were also excluded. The Setback Ratio (SBR = D2/H) was used to optimise spacing, balancing compactness and shading [13,36,37]. Higher tilts reduce SA needs, while flatter installations require dedicated access paths [35]. Figures S2–S4 illustrate the reduction process. Rooftop availability declined from 80% to ~42% when tilt increased from 0° to 30% (Table S2). Module allocation followed the following constraint:
Nopvr (L/GCR) WARS (θ) Arear
where Nopvr is the number of panels, L and W are panel dimensions, ARSθ is the usable roof surface, and Arear is the total rooftop area (see Appendix A).
Irradiance was mapped at multiple test points (15.15 cm grid) across each module, simulating 8760 h annually, using Ladybug and SkyMtx (version (6.17.19235.15041, released on 23 August 2019) [31,38], Figure 4.
Total irradiance, comprising direct (Ib), diffuse (Id), and ground-reflected (Ir) components, was corrected with spectral (F1) and optical (F2) modifiers. The resulting plane-of-array irradiance (IPOA) was IPOA = F1 × (Ib × F2 + Id + Ir) × (1 − Ls/100), where Ls represents system losses. Corrections were applied for air mass (AM), AOI, and sky clearness (ε) using the Tregenza sky model and the Perez all-weather model [38,39]. Detailed calculations, including angular modifiers and albedo adjustments, are provided in Appendix A. Final performance simulations were conducted using the System Advisor Model (SAM) [13].

3.3. Submodule Integration and Power Optimisation

Submodule integrated converters (subMICs) equipped with maximum power point tracking (MPPT) were used to improve PV output under partial shading and heterogeneous irradiance conditions. Compared to traditional bypass diodes, subMICs recover ~7% more energy and reduce power losses by up to 3% under full ground coverage conditions [40,41].
In our configuration, modules were installed in landscape orientation and connected to central inverters operating at 98% efficiency. Systems based on SolarEdge architectures achieved up to 98.5% energy output in shading scenarios, 13.5% more than conventional setups, by combining bypass diodes and direct current (DC) optimisers [42].
System simulations incorporated a derate factor of ~92% to reflect losses from mismatch, wiring, and tracking [13]. Final AC output accounted for inverter, transformer, and grid connection efficiencies [43,44,45], supported by irradiance modelling on a fine mesh to reflect shading impacts at the submodule level. The integration of energy performance and economic feasibility through parametric simulation in Grasshopper (Ladybug and Honeybee) enables robust assessment across scenarios.

3.4. Shading Loss Factors and SPPA Viability

Panels were divided into 15 cm × 15 cm grid cells Figure 4, with evaluations performed at the centre point of each cell to assess shading losses. This involved analysing solar radiation for 60 test points across 8760 h annually. Grid points experiencing shading losses exceeding a defined threshold were excluded from further analysis to ensure that only zones contributing effectively to AC output were considered.
To optimise the selection of high-performing modules, we employed the Galapagos evolutionary solver within the Grasshopper environment. This tool facilitated the identification and elimination of panels with suboptimal performance, enhancing the overall efficiency and cost-effectiveness of the PV system. The resulting eligible zones were then used to calculate normalised energy generation per square meter, facilitating cross-building comparisons. Finally, the results supported the evaluation of each building’s eligibility for solar power purchase agreements (SPPAs), weighing the benefits of shared generation systems against standalone PV system efficiency [7].

3.5. Financial Model Analysis

A bottom-up financial model adapted from NREL [46] and localised to Spain assessed system costs (10 kW–1 MW), considering capital, operation and maintenance (O&M), inverter replacements, and a 0.7%/year degradation rate over 30 years. Simulations were performed using OpenStudio (version 6.17.19235.15041, released on 23 August 2019), EnergyPlus, and SAM [13], incorporating local tariffs and heating, ventilation, and air conditioning (HVAC) profiles.
A solar power purchase agreement (SPPA) model evaluated third-party ownership scenarios targeting a net present value (NPV) ≥ EUR 2.5 M and an internal rate of return (IRR) ≥8% [14]. Key financial indicators included levelized cost of energy (LCOE), payback period, and power purchase agreement (PPA) pricing. Inputs follow standards from prior studies and financial guidelines [13,38,47,48,49,50,51,52,53,54], including tax credits, incentives, depreciation methods, and inflation assumptions, and are presented in Table S3.
The integration of energy performance and economic feasibility through parametric simulation in Grasshopper (Ladybug and Honeybee) enables robust assessment across scenarios.

3.6. Optimisation Assumptions, Scenarios, and Strategies

The optimisation strategy focuses on module dimensions, tilt, orientation, and solar altitude angle, with module size identified as the primary independent variable. Scenarios are defined based on geometric constraints, cost-performance trade-offs, and energy yield potential. The following scenarios are analysed:
(a)
Small modules, 0.36 × 1 m2;
(b)
Small modules with rotation, small modules optimised by adjusting the neighbourhood’s optimal deviation angle as an added variable;
(c)
Medium modules, 1 × 2.5 m2;
(d)
Large modules, 2.5 × 10 m2;
(e)
Generation (Gen) 10.5 (extra-large modules, 2.94 m × 3.37 m);
(f)
Common medium module size, maintaining a medium module while optimising other variables;
(g)
The standard spacing configuration is based on minimum solar altitude at partial shading times (e.g., 21 December, 9 a.m./3 p.m.);
(h)
Standard fixed tilt-orientation configuration. Assumes a 31.5° tilt and 180° orientation (south-facing) in Barcelona while optimising other variables.
The model assumes multi-crystalline silicon (mc-Si) PV modules with 20% efficiency, chosen for low cost, ease of production, and reduced environmental impact [55]. PV placement respects rooftop constraints: 90 cm boundary offset, ≤75% roof coverage, and ≤70% GCR.
System size is calculated using active module area × panel count × efficiency under Standard Test Conditions (STCs) (1000 W/m2, 25 °C, AM 1.5).

3.7. Clustering Strategy

Clustering techniques are applied to group PV modules based on geographic proximity and solar energy uniformity, forming a cluster with at least one subarray (Figure 5). Arrays on the same or nearby rooftops are grouped if their spatial coordinates and height differences fall within defined thresholds, enhancing uniform irradiance and system efficiency.
This study employs K-means (the K-means clustering algorithm was used, where K denotes the predefined number of clusters, and the “means” refers to the centroid of each cluster) clustering [18] in conjunction with a 3D proximity algorithm to optimise groupings based on irradiance, location, and building ID (Figure S5). Each PV array consists of one or more subarrays, depending on array size and cluster structure. Building fragmentation and multi-height geometry directly influence clustering potential and system layout.
The method evaluates trade-offs: more clusters reduce irradiance variation and CO2 emissions but raise costs due to additional components; fewer clusters cut costs but may compromise energy performance. Larger clusters benefit from economies of scale-less wiring, and fewer combiner boxes, but are less efficient when rooftops are fragmented or vertically misaligned.
The clustering optimisation is demonstrated in La Vila Olímpica, assessing CO2 savings, NPV, energy yield, LCOE, and total cost. Results highlight the need to balance cluster size, technical performance, and financial viability for effective PV integration in dense urban environments.

3.8. Multi-Objective Optimisation

The final optimisation integrates energy yield, financial feasibility, and environmental impact using a multi-objective evolutionary algorithm implemented in Grasshopper’s Galapagos component [56]. The algorithm maximises energy generation while minimising costs and CO2 emissions, producing configurations optimised across normalised metrics: NPV, LCOE, payback period, IRR, energy yield, and performance ratio (PR), combined into a weighted performance score.
Key steps include the following:
  • Building and roof setup: defining geometry, orientation, and shading.
  • PV configuration: applying a 31.5° tilt, with specified module sizes and spacing.
  • Panel layout generation: simulating layouts based on usable area.
  • Solar radiation and mesh analysis: assessing irradiation using local weather data to filter suboptimal zones.
  • Utility cost modelling: incorporating real electricity tariffs, usage patterns, and seasonal variation.
  • Final optimisation: identifying configurations that balance energy, cost, and return within the SPPA framework.
The model considers installation costs, panel efficiency, and building-specific constraints, producing technical and financially viable solutions tailored for urban solar deployment.

4. Results with Analytical Insights

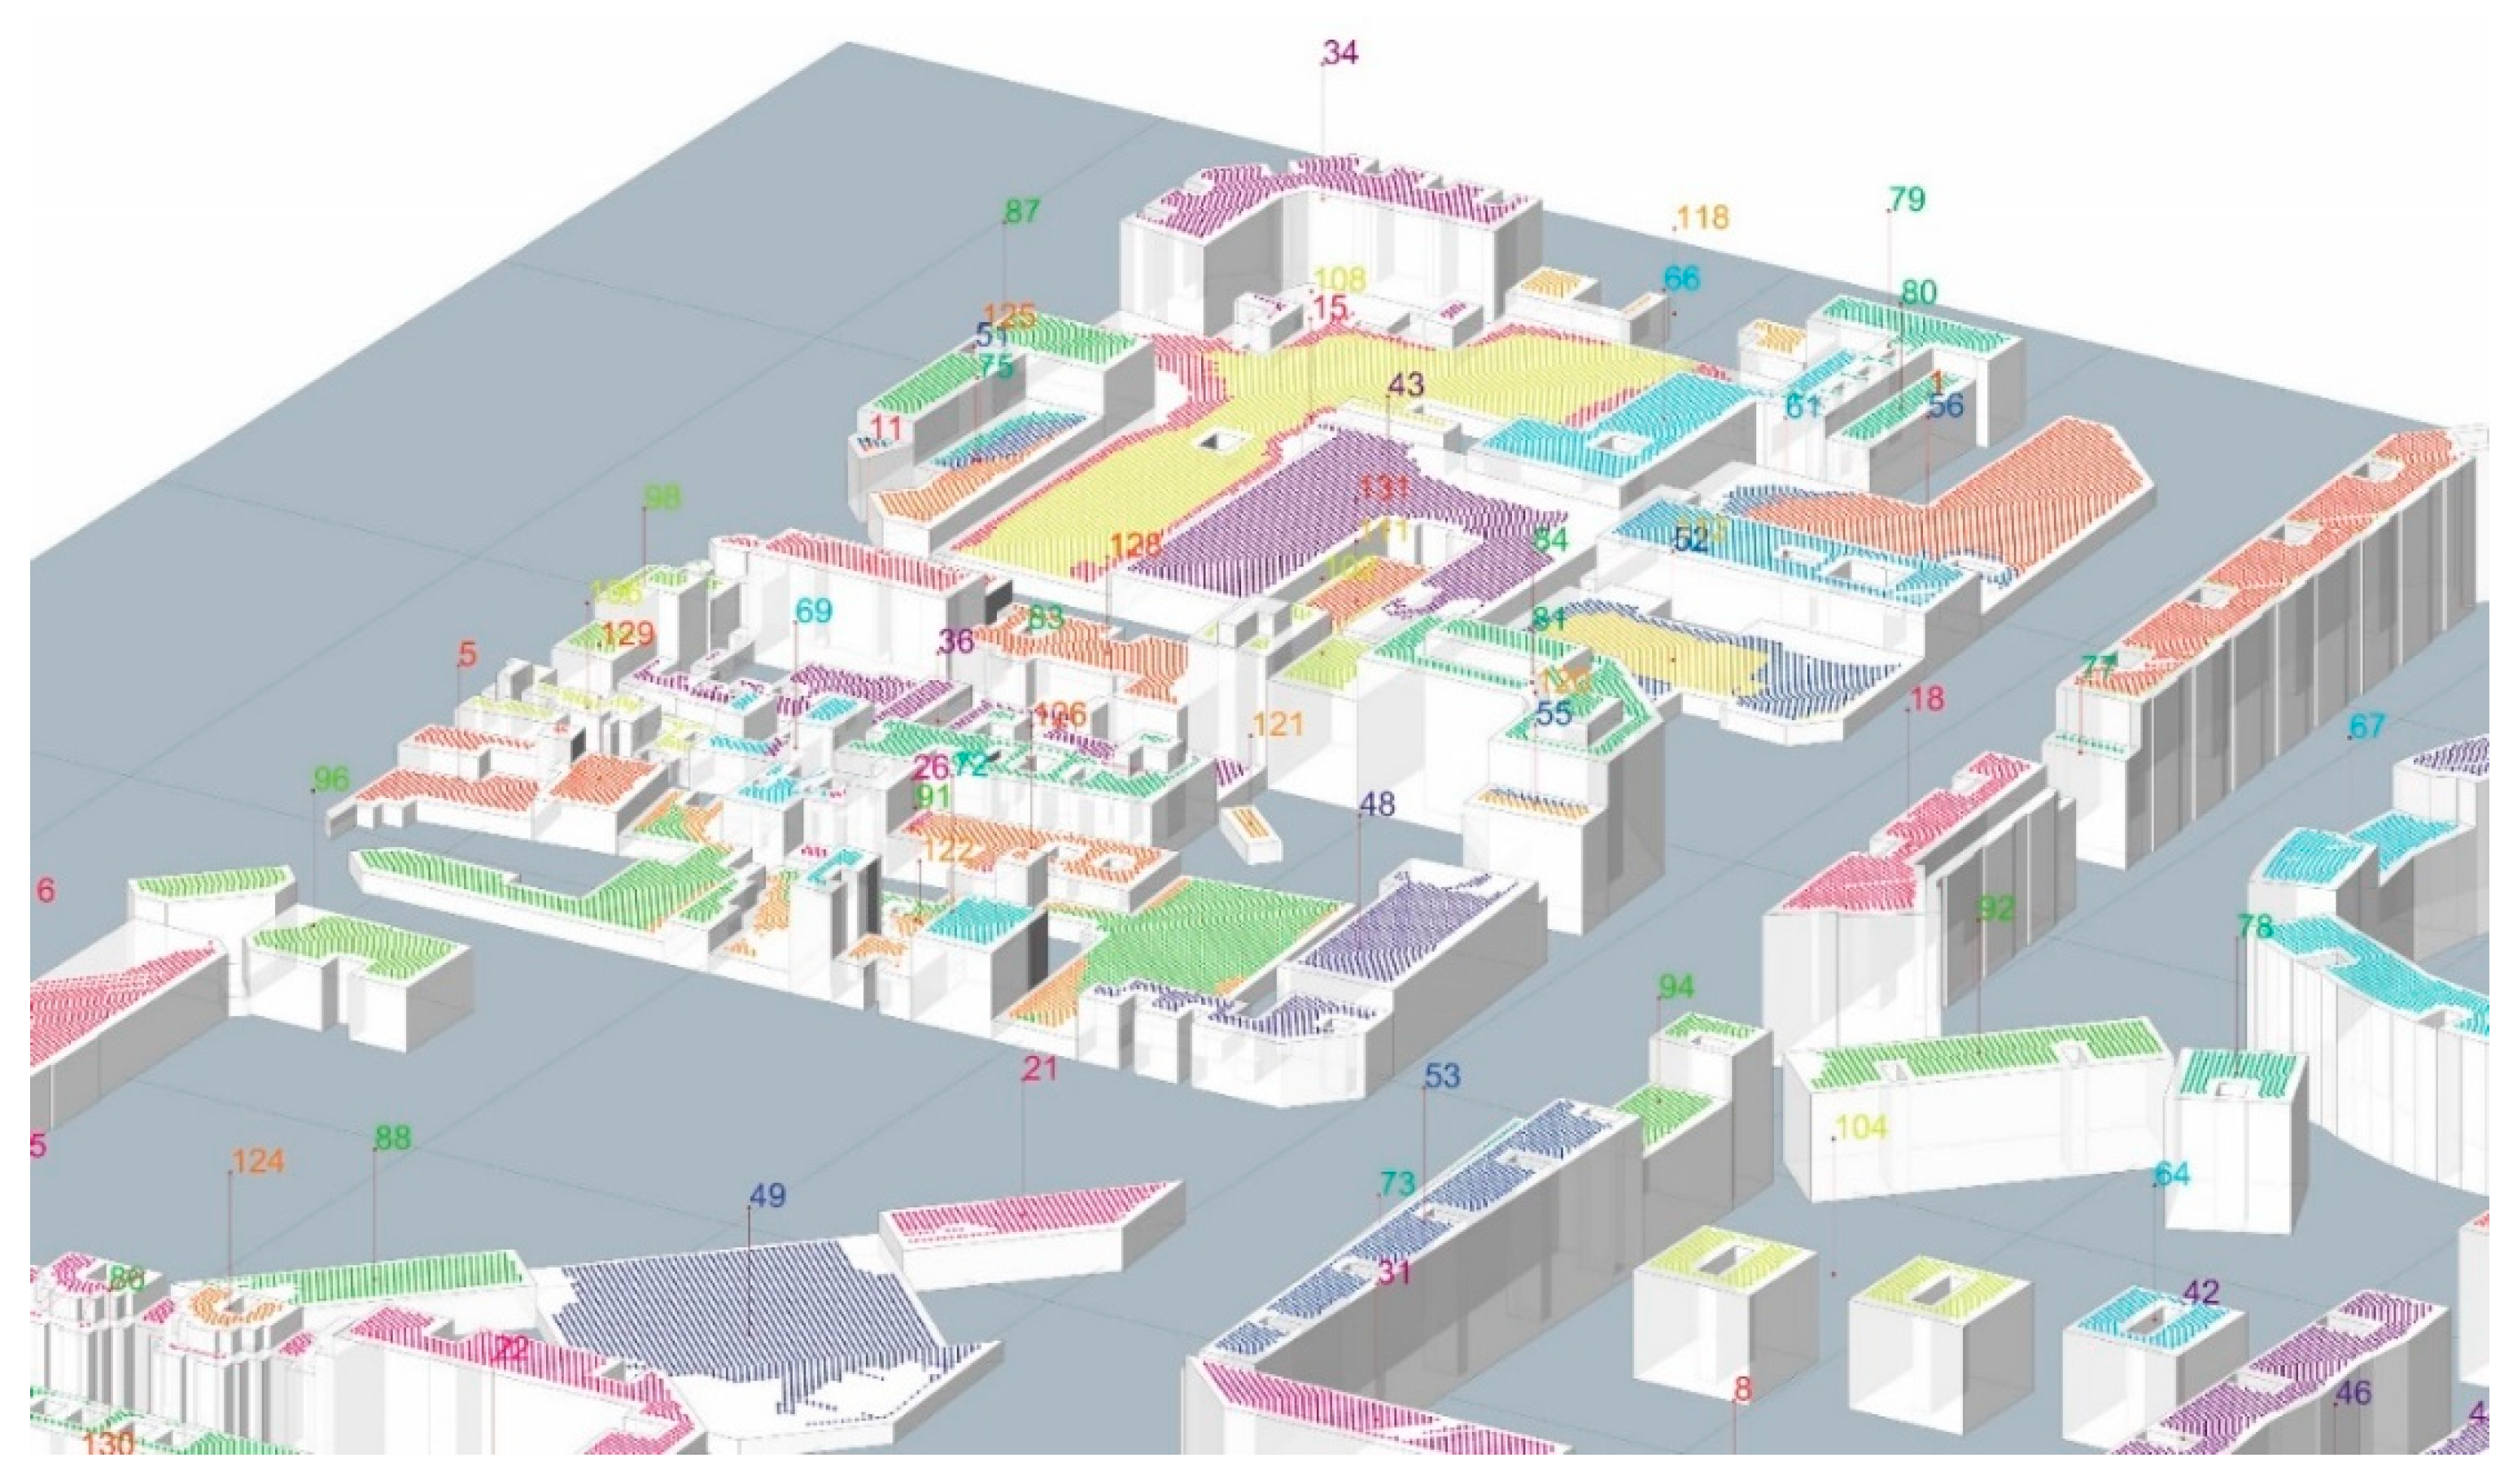
4.1. Modular Segmentation and Urban Form Analysis

To systematically assess the relationship between urban form and energy performance, the neighbourhood was divided into 81 segments using a 9 × 9 modular grid aligned along geographic axes (Figure 6; Table S4). This spatial segmentation method standardises the analysis of density and building coverage ratio (BCR), while the height-to-street width ratio was assessed separately to complement the urban form evaluation. Segment sizes adjust proportionally to the total area, ensuring comparability across different urban contexts.
This framework allows for consistent analysis of shading impacts, solar access, and energy-related urban variables. As shown in Figure 6 and Table 1, areas with higher BCRs, especially in the northeastern zone, and high Floor Area Ratios (FARs) in the eastern segment, highlight zones with concentrated built mass. These patterns indicate opportunities for targeted energy-efficiency strategies in compact urban clusters, supporting data-driven planning for sustainable interventions.

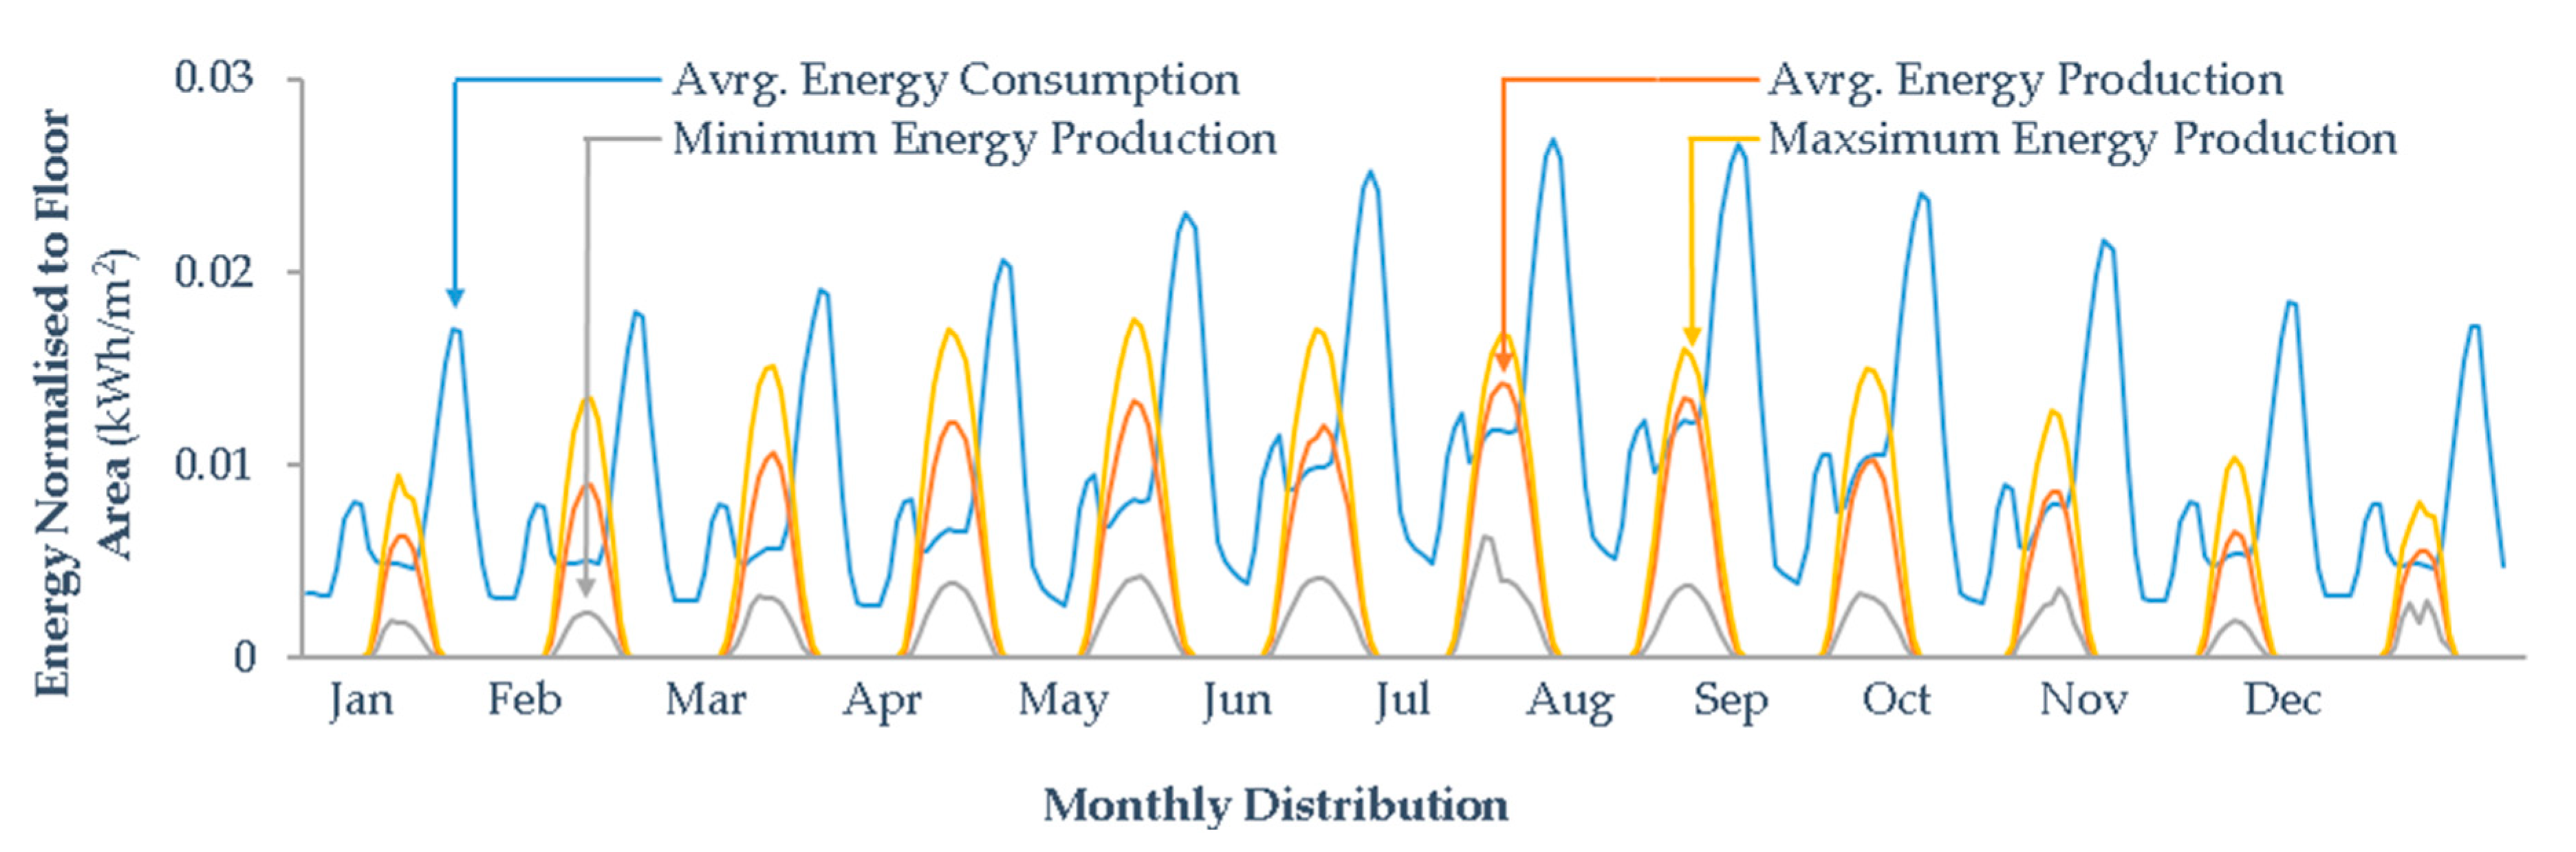
4.2. Small Module Scenario as Baseline Configuration and Energy Analysis

To enable consistent comparison across design setups, the small module scenario was selected as the reference case due to its technical viability, economic relevance, and compatibility with urban spatial constraints. Its compact scale allows for greater placement flexibility and refined design integration. All subsequent figures and performance metrics are based on this configuration, supporting comparative analysis across spatial, financial, and energy criteria. Simulations conducted with Honeybee and local EPW data reveal peak residential energy demand in Barcelona during early morning and evening hours (06:00–08:00, 17:00–22:00), for lighting. In January 2023, residential lighting costs reached EUR 0.80–1.00/m2 following tariff adjustments [57].
Figure 7 illustrates the seasonal and daily variations between PV production and energy consumption, normalised per floor area (Figure S6). While energy generation peaks in the summer, demand remains steady throughout the year, revealing a temporal mismatch, most notably on day 226, which underscores the need for energy balancing strategies, such as storage or load shifting.

4.3. Total Energy Production Calculation Process

The analysis of the small module scenario reveals significant energy losses throughout the production process, despite an initial energy potential of 64.84 million kWh under STCs. After accounting for various factors, such as shading, reflection, temperature effects, wiring, diode losses, and inverter inefficiencies, the actual energy production is reduced to approximately 8 million kWh annually. This highlights the substantial impact of inefficiencies on the final energy output in the small module scenario (Figure S7).

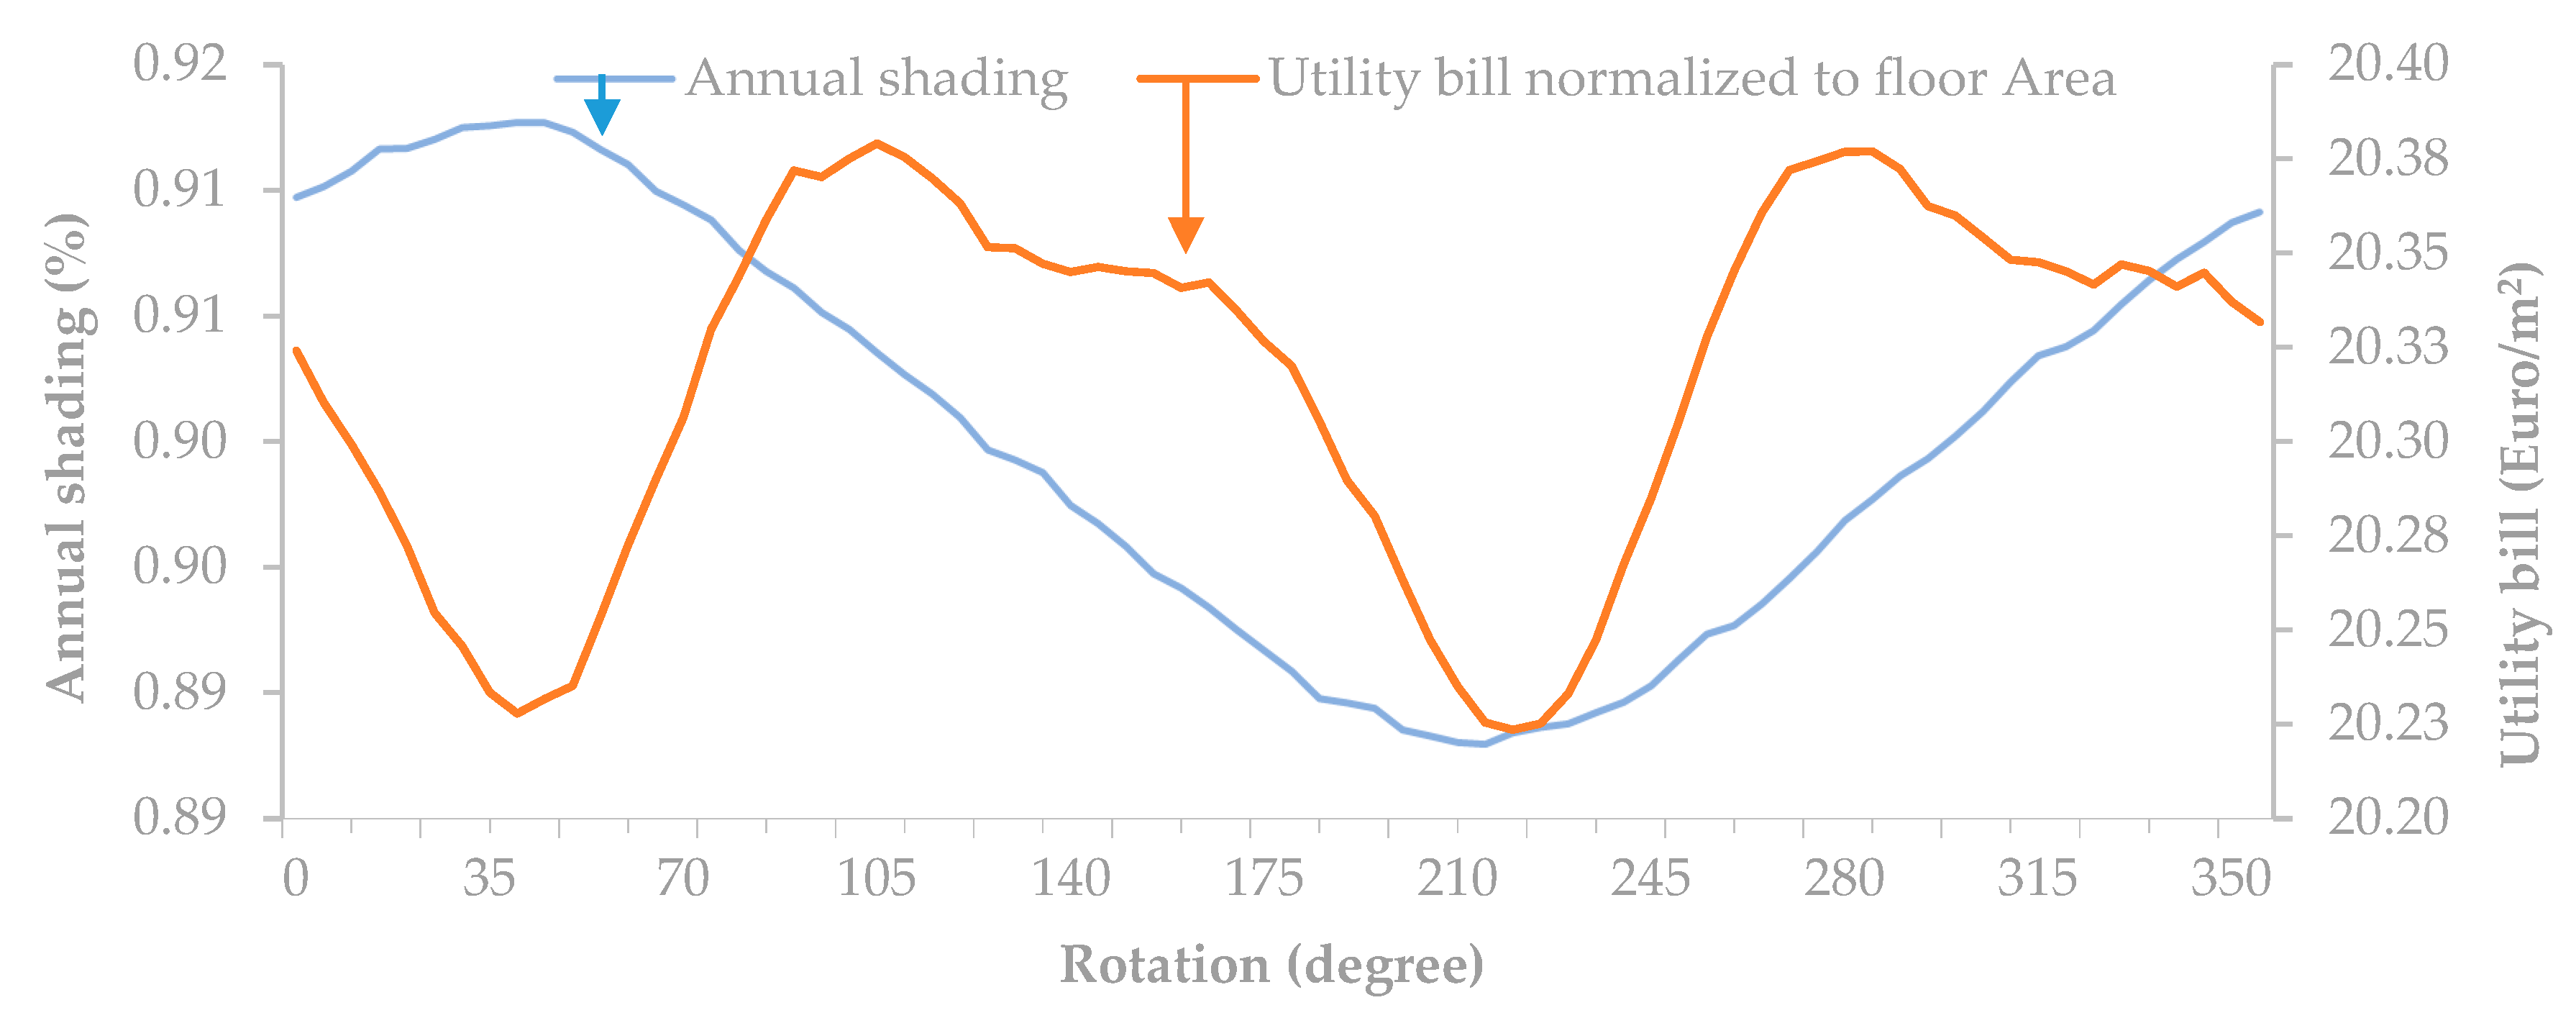
4.4. Analysing the Effects of Hypothetical Neighbourhood Rotation on Utility Bills and Shading

Figure 8 shows that rotating the neighbourhood by 35° minimises utility bills (~20.22 EUR/m2) and maximises annual solar access (~91.6%) by optimising south-facing roof exposure. Although not the focus of the study, this finding underscores the role of orientation in boosting solar potential and lowering energy costs, offering practical guidance for energy-conscious urban design.
In the small module scenario, around 80% of PV panels receive over 90% of annual solar radiation, confirming overall system efficiency. Rotation slightly improves shading conditions, further reducing losses and enhancing output. This reinforces the value of orientation optimisation in dense urban contexts.
The 35° deviation identified through the optimisation process represents an ideal orientation for energy, environmental, and economic performance. While real-world implementation may be limited by existing infrastructure, it offers a strategic reference for future planning aimed at sustainable, high-performance neighbourhoods.
The optimisation results, summarised in Table 2 and Table 3, cover the eight distinct scenarios: (a) small modules, (b) small modules with neighbourhood rotation, (c) medium modules, (d) large modules, (e) Gen 10.5 modules, (f) medium modules with common sizes and high tilt, (g) standard spacing based on sun angles, and (h) fixed tilt with standard configuration. Each scenario was optimised independently through a multi-objective approach.
Table 2 reveals key differences:
Scenarios d and e, with larger modules, result in fewer panels but higher average (Avrg) system sizes optimised for energy efficiency.
Scenarios a and b involve smaller modules across more buildings, maximising participation.
Scenario f emphasises tilt effects, while g explores spacing based on sun altitude and azimuth.
Scenario h, with high tilt and fixed orientation, produces a distinct configuration due to its unique design parameters.
Among the scenarios analysed in Table 3, Scenarios “d” and “e” emerge as the most financially viable, with Scenario “d” showing the highest net present value (NPV) and a relatively short payback period. Scenario “h” excels in environmental performance, exhibiting the lowest CO2 emission rate and the highest capacity factor, making it the most environmentally friendly option. Scenarios “c” and “d” demonstrate the lowest levelized cost of energy (LCOE), indicating cost-efficient energy production. Additionally, Scenario “e” offers significant benefits to property owners with the lowest negative host NPV per square meter. Overall, while Scenarios “d” and “e” balance profitability and efficiency, Scenario “h” stands out for its strong environmental credentials, highlighting the trade-offs involved in selecting the optimal solar panel installation configuration.

4.5. Weighted Average Methodology

The weighted average methodology adopted in this study uses exponential function weights to differentiate and prioritise performance metrics across scenarios. Each metric is adjusted by a specific coefficient and exponent to reflect its relative importance based on study objectives. Metrics are grouped into financial, energy performance, LCOE, and environmental categories, with key submetrics including NPV (2.5, 1.5), total energy (4, 2), and the CO2 emission rate (1.5, 3) (Table S5). These metrics were assigned tailored scoring weights using the exponential function A×B, where A is the coefficient, B is the exponent, and x is the raw metric value. A two-stage weighted average process is applied to generate composite scores, enabling multi-objective optimisation that balances profitability, energy yield, and environmental impact. This method ensures precision, flexibility, and a robust basis for comparative analysis across scenarios [58]. Table 4 highlights key trade-offs among scenarios. Scenario b shows the best overall balance in financial, energy, and subtotal metrics. Scenario e (Gen10.5) excels financially but underperforms in energy and LCOE, while d (large modules) leads in LCOE but lags elsewhere. Scenario h (fixed tilt) ranks highest in environmental impact but is weaker in other areas.

4.6. Clustering Analysis

This section evaluates how the size and configuration of PV system clusters affect CO2 emissions, financial outcomes, and energy performance. Clustering is based on module proximity and rooftop layout, enabling comparison between smaller independent clusters and larger aggregated systems. The Supplementary Materials provide supporting figures illustrating these configurations and results (Figures S8–S14).
Smaller PV clusters demonstrate superior environmental performance, due to enhanced efficiency from optimised positioning and orientation. Independent operation improves sunlight capture, load management, and energy yield. Additionally, using micro-inverters reduces mismatch losses and maximises energy output at the module level.
However, increasing the number of smaller clusters raises capital and operational expenditures due to a higher quantity of inverters and associated maintenance. As a result, financial indicators such as the net present value (NPV), Modified Internal Rate of Return (MIRR), and payback period tend to decline. This trade-off suggests that while energy performance improves, financial returns may diminish unless mitigated by scale or incentives.
Performance ratios increase when modules with similar solar exposure are clustered, minimising the impact of shading variability. In contrast, larger clusters, particularly those connected in series, are more vulnerable to partial shading losses, which can degrade performance across the entire array. Although energy production may increase with clustering, the levelized cost of energy (LCOE) also rises due to mounting complexity, additional wiring, and shading effects.
From the host’s perspective, a greater number of clusters can positively affect NPV through improved energy self-consumption, higher revenues, and better system management. However, this is offset by an overall increase in project costs from EUR 5 million to EUR 6 million, primarily driven by additional modules, inverters, and infrastructure.
In summary, while smaller, well-distributed PV clusters yield environmental and technical advantages, their economic viability must be carefully assessed to ensure optimal urban solar deployment strategies.

4.7. Impacts of PV Module Efficiency and Area on Energy and Financial Performance

This section examines how variations in PV module efficiency (12–30%) and module area influence key project metrics, including NPV, MIRR, LCOE, CO2 emissions, energy yield, system costs, and host coverage in the neighbourhood. Higher module efficiency leads to significant improvements in NPV (from EUR 1M to EUR 5M), MIRR (from 0.08 to 0.1), and emissions reduction (from 65 to <30 gCO2/kWh), while lowering LCOE ranges from 7.0 to 9.5 EUR ct/kWh. Changes in module area reveal trade-offs: medium-size modules (2.5–3.5 m2) offer optimal NPV and yield. However, larger modules reduce capital cost per WDC and increase the MIRR, despite installation and system sizing challenges.
Additional trends in yield, payback, O&M, inverter costs, and radiation distribution are discussed. The findings highlight the balance required between system efficiency, cost, and spatial feasibility for optimal urban PV deployment. Supporting Figures S15–S34 are provided in the Supplementary Materials.

4.8. Impact of Eliminating PV Panels

This section analyses the elimination of low-irradiance PV panels in the small module scenario, assessing environmental improvements and secondary financial impacts. Eliminating modules below 525 kWh/m2 improves NPV to EUR 2.82 M and slightly lowers the payback period and the LCOE. Optimal financial performance is near 925 kWh/m2 (Figure S35).
Host energy coverage and output decrease with further panel removal, but the system performance ratio improves as shading is reduced. The LCOE and gCO2 emissions drop as less efficient modules are excluded, enhancing cost-effectiveness and environmental sustainability. The analysis covers irradiation levels from 275 kWh/m2 to 1100 kWh/m2, offering valuable insights into the trade-offs involved in PV module elimination and aiding in decision-making for optimal PV system configuration (Figures S35–S41), and Table S6 in the Supplementary Materials details these results.
As detailed in Section 3.4, the irradiance mapping and performance simulation processes, utilising Ladybug and SkyMtx tools, enabled precise identification of underperforming modules. Furthermore, the Galapagos evolutionary solver in Grasshopper was employed to optimise the irradiance threshold for panel elimination, balancing energy yield and cost-effectiveness. Finally, the results supported the evaluation of each building’s eligibility for solar power purchase agreements (SPPAs), weighing the benefits of shared generation systems against standalone PV system efficiency.

5. Discussion and Conclusions

This study explored the integration potential of photovoltaic (PV) systems at the neighbourhood scale within La Vila Olímpica, Barcelona. Through a multi-scenario analysis incorporating spatial, financial, and environmental dimensions, we identified optimal strategies for enhancing solar energy deployment in high-density urban contexts.

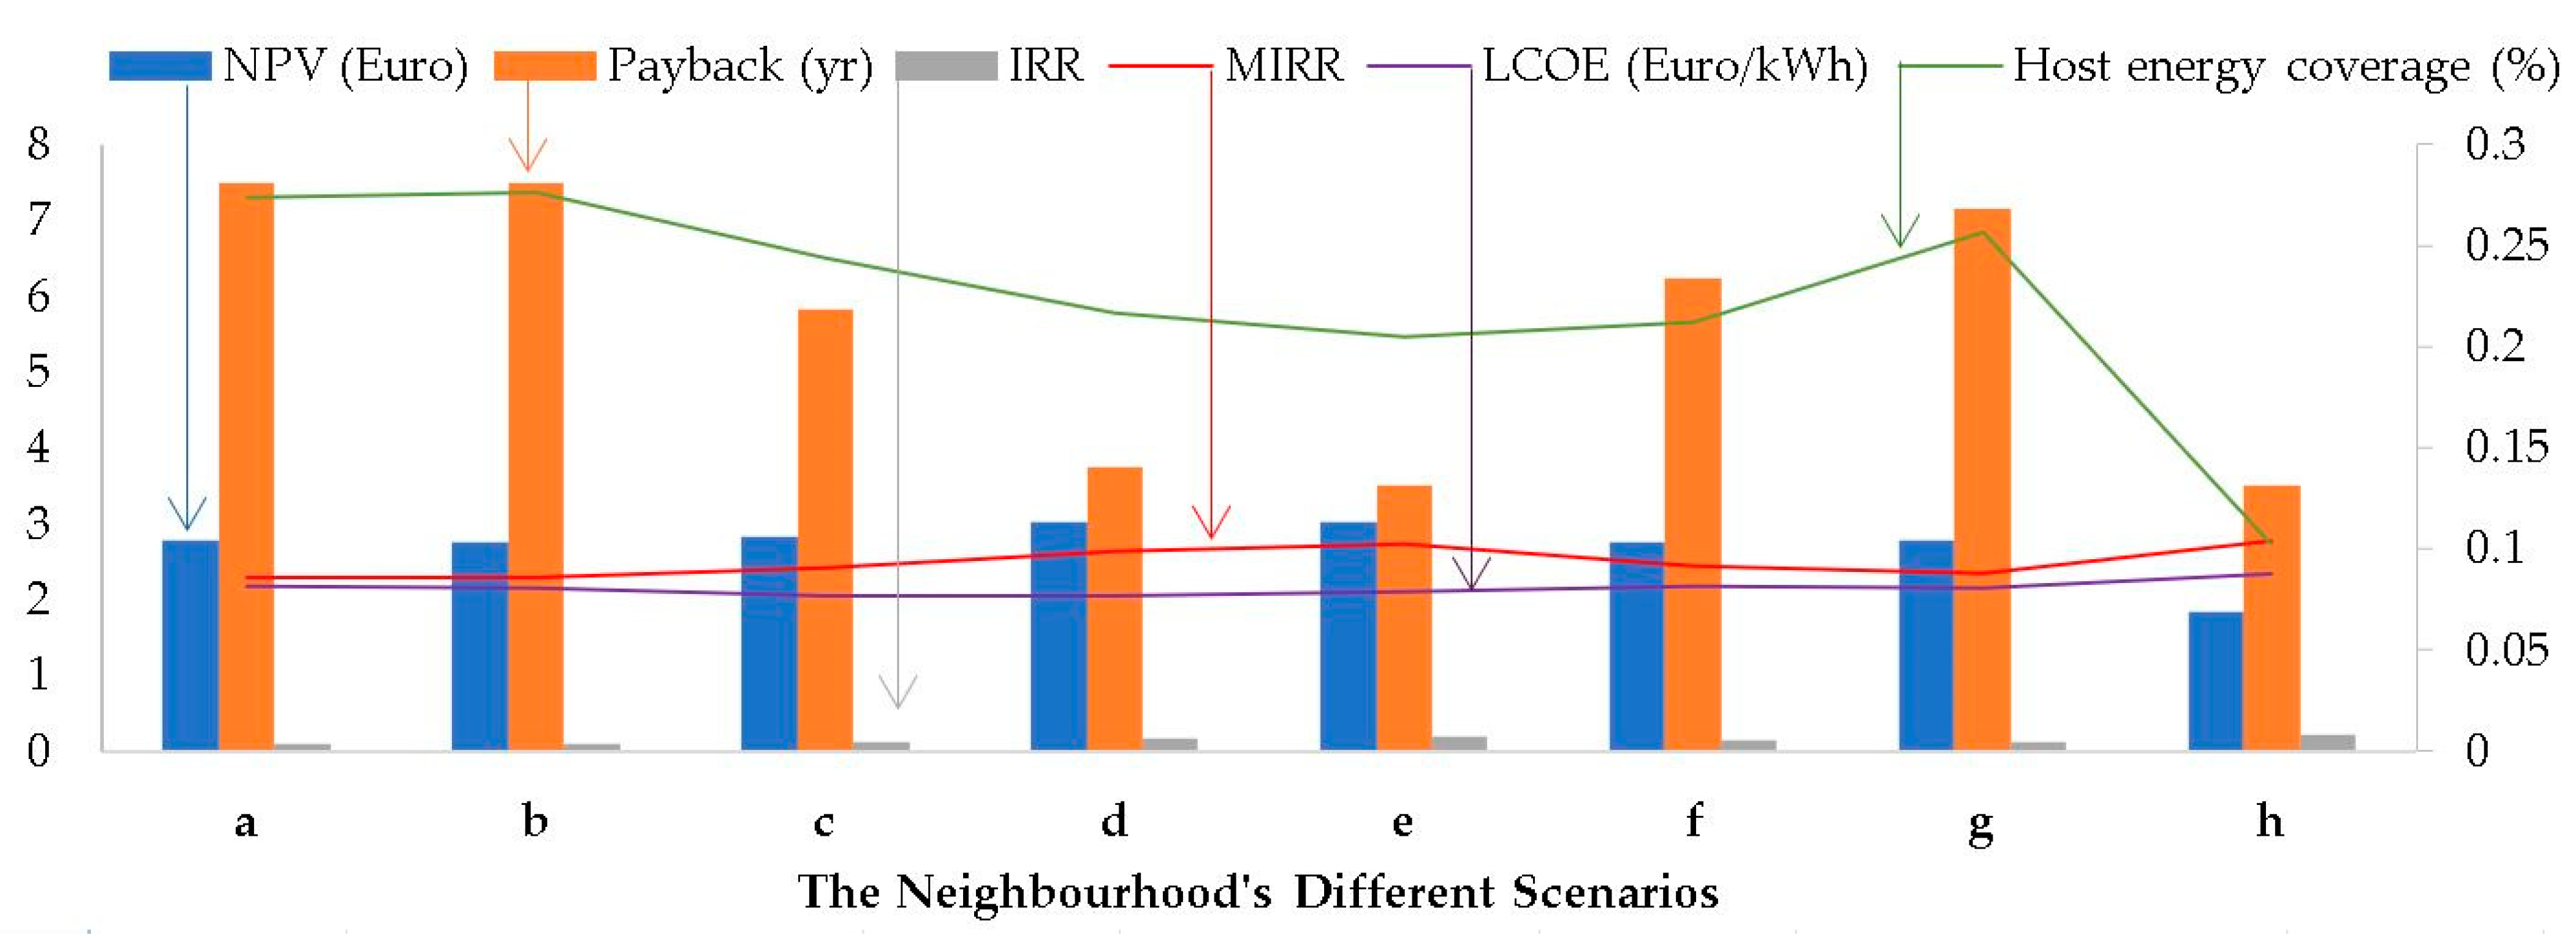
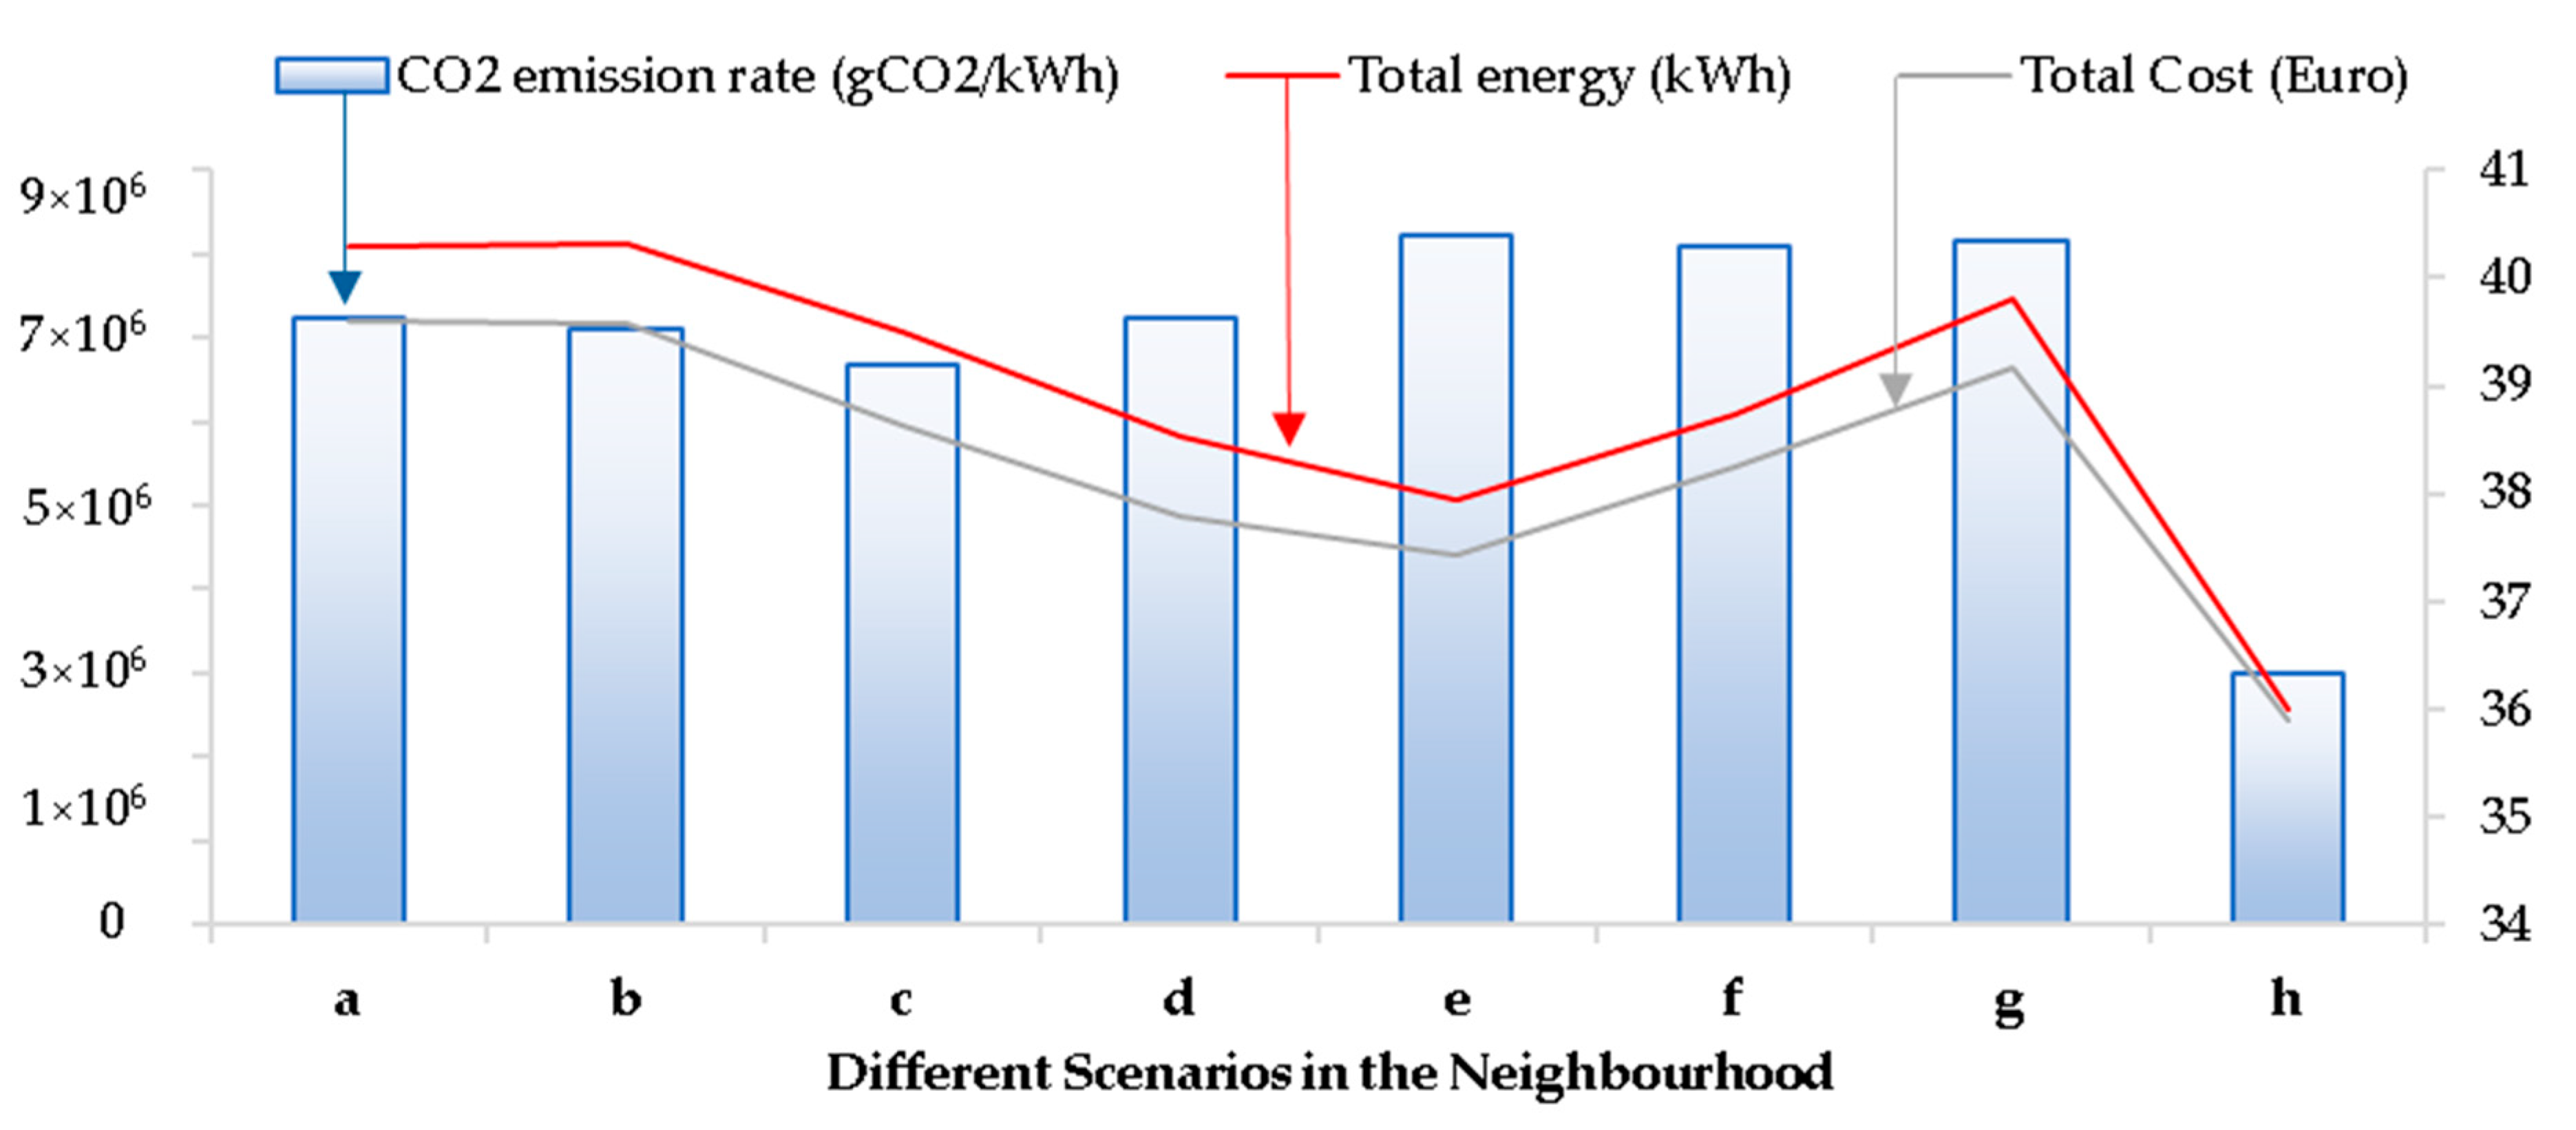
5.1. Scenario-Based Evaluation: La Vila Olímpica Case

The analysis of renewable energy scenarios, based on Figure 9 and Figure 10, highlights key findings for optimal configurations. Scenario e stands out for its superior financial performance, with the highest NPV, shorter payback periods, and better IRR and MIRR values. Scenario h excels in efficiency, having the highest performance ratio and lowest CO2 emissions, making it environmentally sustainable. On the other hand, Scenarios a and b are less favourable, with longer payback periods, lower financial returns, and reduced performance. Scenario h is less optimal due to its lower NPV, despite financial advantages, while Scenarios d and e are more favourable, offering a balance of financial performance and efficiency. Scenario c demonstrates competitive results across both dimensions.
Scenarios a and b exhibit the highest energy yields but incur significantly higher capital costs, resulting in extended payback periods and diminished financial attractiveness. In contrast, Scenario h offers the lowest CO2 emissions and the highest performance ratio, yet it underperforms financially due to a low NPV and an MIRR of only 0.07. These findings suggest that, while Scenario h provides strong environmental benefits, it may not be economically sustainable without external incentives.
Scenarios d and e offer a well-balanced profile, combining financial robustness with high energy efficiency, whereas Scenario c presents moderate outcomes across all indicators. These intermediate scenarios could be particularly suitable where urban energy strategies aim to balance return on investment with environmental or social equity goals (Figure 10).

5.2. Submodule Integrated Converter (SubMICs+) Strategy and Module Optimisation

This section evaluates the deployment of the Small Module Configuration (60 × 90 cm) integrated with SubMICS Plus technology across the neighbourhood. As shown in Figure 11, Table 5 and Table 6, this configuration achieves high energy yield and effective building coverage, particularly in dense urban settings in La Vila Olímpica, where 204 of 225 buildings (60.66%) were usable.
While the total energy output reached 8.27 GWh/year, and the specific yield exceeded 1028 kWh/kWp, the system’s total cost of EUR 7.77 million presents a financial challenge. Two strategies are proposed to improve feasibility: (1) raising the PPA price (e.g., EUR 0.128/kWh) to attract investment and (2) reducing electricity costs to increase accessibility.
Financially, the scenario achieved an IRR of 0.13, MIRR of 0.09, and NPV of EUR 3.71 million, with a payback period of 6.33 years. The LCOE of 9 EUR ct/kWh and CO2 emissions of 40.1 g/kWh confirm both the cost-effectiveness and environmental value. Geometric optimisation (11° tilt, south orientation, 0.6 m spacing) and a GCR of 48.98% further enhanced performance, while shading impacts remained minimal (0.91% annually).
Comparing SubMICs+ deployment scenarios, we highlight Scenario e as the most advantageous, offering the highest NPV, IRR, and MIRR, along with the shortest payback period. Scenarios d and e combine strong financial returns with high efficiency, while Scenario “c” presents a balanced trade-off. Conversely, Scenarios a and b underperform across financial indicators, and Scenario h, despite strong financial metrics, suffers from a low NPV and performance ratio. These results highlight the importance of scenario-specific optimisation to balance financial feasibility, energy output, and spatial constraints in urban PV planning. By integrating geometric, environmental, and financial criteria, the SubMICs+ model presents a scalable and balanced strategy for urban solar deployment, well suited to Mediterranean cities with high solar potential and architectural constraints.

5.3. Broader Urban Implications

This comparative evaluation underscores the critical role of scenario-based optimisation in balancing the multiple objectives of urban PV deployment, namely, financial viability, energy efficiency, and environmental impact. Scenario b emerges as the most balanced configuration, offering a strong trade-off between system-wide energy yield, environmental sustainability, and acceptable financial performance. While Scenario h achieves the highest environmental scores and the best performance ratio (66.81%), its low net present value (NPV = EUR 1.82 M) and limited host financial benefit reduce its feasibility without targeted incentives.
By contrast, Scenario e demonstrates peak financial returns, including the highest NPV (EUR 3.03 M), shortest payback period (3.5 years), and highest internal rate of return (IRR = 19%), despite moderate energy efficiency and a relatively lower ground coverage ratio (GCR = 35.23%). Scenarios d and c represent intermediate solutions, balancing financial and environmental priorities. In comparison, Scenarios a and b, although associated with higher energy outputs, exhibit extended payback periods and lower financial return ratios due to elevated capital costs.
Taken together, these distinctions suggest differentiated strategies for urban PV implementation. Scenario h, like configurations, may be more appropriate in high-ambition climate districts, where environmental priorities dominate, whereas Scenarios e or d align better with private sector investment logic. Importantly, the morphological characteristics of La Vila Olímpica, mid-rise density, optimal roof tilt, and a uniform grid orientation, facilitated high solar access and strong performance across all configurations. These findings reinforce the value of “solar neighbourhoods,” where active PV deployment is synergistically integrated with passive solar design, offering a replicable planning model for Mediterranean urban contexts.
In sum, this study illustrates how multi-scenario evaluation can guide smarter and more resilient urban energy planning in solar-rich regions.

5.4. Limitations and Future Work

While this research offers a robust scenario-based methodology, certain limitations must be acknowledged. Economic analyses were based on static PPA rates and did not account for regulatory or market fluctuations. Climatic simulations relied on average annual irradiance, excluding seasonal and interannual variability. Future studies should incorporate dynamic financial models, battery storage integration, and policy variables (e.g., subsidies or net metering). Expanding the analysis to other urban typologies in the Mediterranean region would test the transferability of these findings. Furthermore, integrating social indicators such as energy poverty could enhance the equity dimension of urban PV planning and support more just energy transitions.

Supplementary Materials

The following supporting information can be downloaded at: https://www.mdpi.com/article/10.3390/solar5030034/s1.

Author Contributions

Conceptualization, M.R. and A.M.A.; methodology, M.R.; software, M.R.; validation, M.R., A.M.A. and T.M.; formal analysis, M.R.; investigation, M.R.; resources, A.M.A. and T.M.; data curation, M.R.; writing—original draft preparation, M.R.; writing—review and editing, A.M.A. and T.M.; visualization, M.R.; supervision, A.M.A. and T.M.; project administration, A.M.A. All authors have read and agreed to the published version of the manuscript.

Funding

This research received no external funding.

Institutional Review Board Statement

Not applicable.

Informed Consent Statement

Not applicable.

Data Availability Statement

The data presented in this study are available on request from the corresponding author. The data are not publicly available due to their format being generated through simulation workflows and geographic processing tools that are not directly shareable in a standard repository.

Conflicts of Interest

We confirm that there are no conflicts of interest to declare in relation to this work.

Appendix A

Key equations used for solar geometry and irradiance calculations, including the angle of incidence (AOI) and plane-of-array irradiance (IPOA).
To calculate direct solar radiation (Dirtot), the incident beam irradiance is obtained from the weather file and adjusted using the shading factor SunGap (α, β) for shading effects. The beam irradiance component (Ib) is then determined by the angle of incidence (AOI), which measures the angle between the incoming solar energy and a perpendicular line to the surface. The AOI depends on the sun’s azimuth and zenith angles, as well as the surface’s orientation and tilt: A O I = cos 1 ( sin ( 90 α ) cos ( β γ ) sin θ + cos ( 90 α ) cos θ ) , where θ is the solar zenith angle, and the angle of incidence is presented in Figures S2 and S3.
We have established a formula to calculate the maximum number of solar panels that can be installed on each rooftop. If the actual installation exceeds this limit, excess panels must be removed without following a specific order. The formula is defined as follows:
N o p v r × L G C R × W A R S θ × A r e a r
where No pvr: the number of PV modules on a roof, W: the width of a module, ARSθ: available rooftop space in each tilt angle θ, GCR-SA (service area), Area r: rooftop area.
The algorithm uses the Barcelona EPW file for hourly weather data, including air temperature and wind speed, to accurately compute the sun’s position. The calculations adhere to the methods specified by employing Ladybug radiation analysis and the cumulative SkyMtx component to determine the irradiance components: plane-of-array (POA), beam (Ib), sky diffuse (Id), and ground-reflected (Ir).
A M = [ cos Z + 0.5057 ( 96.080 Z ) 1.634 ] 1 e 0.0001184 h
The F1 polynomial relates the spectral effects on Isc to the variation in air mass over the day:
F 1 = 0.918093 + 0.086257 A M 0.024459 A M 2 + 0.002816 A M 3 0.000126 A M 4
The F2 polynomial relates the optical effects on Isc to the angle of incidence (AOI):
F 2 = 1.0 2.438 e 3 A O I + 3.103 e 4 A O I 2 1.246 e 5 A O I 3 + 2.112 e 7 A O I 4 1.359 e 9 A O I 5
I P O A = F 1 ( I b F 2 + I d + I r ) ( 1 L s 100 )
Once the solar panels are positioned, specific test points on the panels are identified to measure the radiation received. This involves calculating the total radiation, which includes the following:
Direct Radiation (Ib)—sunlight reaching the panels directly.
Diffuse Radiation (Id)—sunlight scattered by the atmosphere.
Ground-Reflected Radiation (Ir)—sunlight reflected off the ground.

References

  1. Salat, S.; Bourdic, L. Urban Complexity, Efficiency and Resilience. In Energy Efficiency—A Bridge to Low Carbon Economy; InTech: Rijeka, Croatia, 2012. [Google Scholar] [CrossRef]
  2. Perini, K.; Magliocco, A. Effects of Vegetation, Urban Density, Building Height, and Atmospheric Conditions on Local Temperatures and Thermal Comfort. Urban For. Urban Green. 2014, 13, 495–506. [Google Scholar] [CrossRef]
  3. Kurdgelashvili, L.; Li, J.; Shih, C.H.; Attia, B. Estimating Technical Potential for Rooftop Photovoltaics in California, Arizona and New Jersey. Renew. Energy 2016, 95, 286–302. [Google Scholar] [CrossRef]
  4. Wiginton, L.K.; Nguyen, H.T.; Pearce, J.M. Quantifying Rooftop Solar Photovoltaic Potential for Regional Renewable Energy Policy. Comput. Environ. Urban Syst. 2010, 34, 345–357. [Google Scholar] [CrossRef]
  5. Weatherbase. Available online: https://www.weatherbase.com/weather/weatherall.php3?s=18180&cityname=Barcelona%2C+Catalonia%2C+Spain&units= (accessed on 5 May 2025).
  6. Cheng, V.; Steemers, K.; Montavon, M.; Compagnon, R. Compact Cities in a Sustainable Manner. In Proceedings of the 2nd International Solal Cities Congress, Oxford, UK, 3–6 April 2006; pp. 1–11. [Google Scholar]
  7. Hernández-Mayoral, E.; Madrigal-Martínez, M.; Mina-Antonio, J.D.; Iracheta-Cortez, R.; Enríquez-Santiago, J.A.; Rodríguez-Rivera, O.; Martínez-Reyes, G.; Mendoza-Santos, E. A Comprehensive Review on Power-Quality Issues, Optimization Techniques, and Control Strategies of Microgrid Based on Renewable Energy Sources. Sustainability 2023, 15, 9847. [Google Scholar] [CrossRef]
  8. Aelenei, L.S. Integrated Photovoltaics: An Opportunity for Urban Decarbonization. Future City 2020, 18, 17–34. [Google Scholar] [CrossRef]
  9. Sharma, P.; Mehlawat, M.K.; Gupta, P.; Pamucar, D. Cluster-Based Decision Making: A Novel Approach for Handling Large-Scale Alternatives in Rooftop Solar PV Site Selection. Artif. Intell. Rev. 2025, 58, 113. [Google Scholar] [CrossRef]
  10. Gassar, A.A.A.; Cha, S.H. Review of Geographic Information Systems-Based Rooftop Solar Photovoltaic Potential Estimation Approaches at Urban Scales. Appl. Energy 2021, 291, 116817. [Google Scholar] [CrossRef]
  11. Ahmed, S. The American University in Cairo Environmental Engineering Program Estimating Solar Energy Production in Urban Areas for Electric Vehicles. Master’s Thesis, The American University in Cairo, Cairo, Egypt, 2023. [Google Scholar]
  12. Aboushal, E.A. Applying GIS Technology for Optimum Selection of Photovoltaic Panels “Spatially at Defined Urban Area in Alexandria, Egypt”. Alexandria Eng. J. 2018, 57, 4167–4176. [Google Scholar] [CrossRef]
  13. Gilman, P.; Dobos, A.; DiOrio, N.; Freeman, J.; Janzou, S.; Ryberg, D. System Advisor Model (SAM) Photovoltaic Model Technical Reference Update; National Renewable Energy Laboratory: Golden, CO, USA, 2018. [Google Scholar]
  14. Curreli, A. How Environmental and Energy Issues Shape the Cities: A Case-Study in Barcelona, Spain. In Proceedings of the Cities in Transformation: Research & Design Ideas, Methods, Techniques, Tools, Case Studies Conference, Milano, Italy, 7–10 June 2012. [Google Scholar]
  15. Skeie, K.S.; Rokseth, L.S.; Lausselet, C.; Gustavsen, A. Characterizing and Structuring Open Datasets for Assessment of Residential Building Energy Use on the Neighborhood and Urban Scale. Energy Build. 2025, 341, 115842. [Google Scholar] [CrossRef]
  16. Sicilia, Á.; Madrazo, L.; Massetti, M.; Plazas, F.L.; Ortet, E. An Energy Information System for Retrofitting Smart Urban Areas. Energy Procedia 2017, 136, 85–90. [Google Scholar] [CrossRef]
  17. Wang, Y.; Gao, W.; Gong, M.; Li, H.; Xie, J. A New Two-Stage Based Evolutionary Algorithm for Solving Multi-Objective Optimization Problems. Inf. Sci. 2022, 611, 649–659. [Google Scholar] [CrossRef]
  18. Toward Data Sciences. Available online: https://towardsdatascience.com/understanding-k-means-clustering-in-machine-learning-6a6e67336aa1 (accessed on 5 May 2025).
  19. IEA. Spain’s Solar Power Policy Framework: IEA Survey. Available online: https://reglobal.org/spains-solar-power-policy-framework-iea-survey/ (accessed on 5 May 2025).
  20. Spain Abolishes the ‘Tax on the Sun’|Greentech Media. Available online: https://www.greentechmedia.com/articles/read/spain-abolishes-the-tax-on-the-sun#gs.9aac4y (accessed on 2 May 2019).
  21. Comisión Nacional de los Mercados y la Competencia. Spanish Energy Regulator’s National Report to the European Commission 2018; Comisión Nacional de los Mercados y la Competencia: Madrid, Spain, 2018. [Google Scholar]
  22. Li, Y.; Beeton, R.J.S.; Zhao, X.; Fan, Y.; Yang, Q.; Li, J.; Ding, L. Advancing Urban Sustainability Transitions: A Framework for Understanding Urban Complexity and Enhancing Integrative Transformations. Humanit. Soc. Sci. Commun. 2024, 11, 1–14. [Google Scholar] [PubMed]
  23. Xu, Y.; Ren, C.; Ma, P.; Ho, J.; Wang, W.; Lau, K.K.L.; Lin, H.; Ng, E. Urban Morphology Detection and Computation for Urban Climate Research. Landsc. Urban Plan. 2017, 167, 212–224. [Google Scholar] [CrossRef]
  24. Rhino. Available online: https://www.rhino3d.com/ (accessed on 5 May 2025).
  25. Grasshopper. Available online: http://www.grasshopper3d.com/ (accessed on 5 May 2025).
  26. Food4rhino. Available online: https://www.food4rhino.com/en (accessed on 5 May 2025).
  27. EnergyPlus. Available online: https://energyplus.net/ (accessed on 5 May 2025).
  28. Morganti, M.; Salvati, A.; Coch, H.; Cecere, C. Urban Morphology Indicators for Solar Energy Analysis. Energy Procedia 2017, 134, 807–814. [Google Scholar] [CrossRef]
  29. ESRI. Available online: https://www.esri.com/en-us/arcgis/about-arcgis/overview (accessed on 5 May 2025).
  30. Schallenberg-Rodríguez, J. Photovoltaic Techno-Economical Potential on Roofs in Regions and Islands: The Case of the Canary Islands. Methodological Review and Methodology Proposal. Renew. Sustain. Energy Rev. 2013, 20, 219–239. [Google Scholar] [CrossRef]
  31. EnSims. Available online: https://app.ensims.com/epw/ (accessed on 5 May 2025).
  32. Michalsky, J. The Astronomical Almanac’s Algorithm for Approximate Solar Position (1950–2050). Sol. Energy 1988, 40, 227–235. [Google Scholar] [CrossRef]
  33. Khoo, Y.S.; Nobre, A.; Malhotra, R.; Yang, D.; Ruther, R.; Reindl, T.; Aberle, A.G. Optimal Orientation and Tilt Angle for Maximizing In-Plane Solar Irradiation for PV Applications in Singapore. IEEE J. Photovolt. 2014, 4, 647–653. [Google Scholar] [CrossRef]
  34. Ma, X.S.; Yao, G.H.; Ye, L.J.; Zhi, X.F.; Zhang, S.M. Distance Calculation between Photovoltaic Arrays Fixed on Sloping Ground. J. Comput. Methods Sci. Eng. 2015, 15, 107–116. [Google Scholar] [CrossRef]
  35. Byrne, J.; Taminiau, J.; Kurdgelashvili, L.; Kim, K.N. A Review of the Solar City Concept and Methods to Assess Rooftop Solar Electric Potential, with an Illustrative Application to the City of Seoul. Renew. Sustain. Energy Rev. 2015, 41, 830–844. [Google Scholar] [CrossRef]
  36. Deline, C.; Meydbray, J.; Donovan, M. Photovoltaic Shading Testbed for Module-Level Power Electronics: 2016 Performance Data Update; National Renewable Energy Laboratory: Golden, CO, USA, 2016. [Google Scholar]
  37. Deline, C.; Sekulic, B.; Stein, J.; Barkaszi, S.; Yang, J.; Kahn, S. Evaluation of Maxim Module-Integrated Electronics at the DOE Regional Test Centers. In Proceedings of the 2014 IEEE 40th Photovoltaic Specialist Conference (PVSC), Denver, CO, USA, 8–13 June 2014; pp. 986–991. [Google Scholar] [CrossRef]
  38. Dobos, A. PVWatts Version 5 Manual—Technical Report; NREL/TP-6A20-62641; National Renewable Energy Laboratory: Golden, CO, USA, 2014. [Google Scholar]
  39. Takebayashi, H.; Ishii, E.; Moriyama, M.; Sakaki, A.; Nakajima, S.; Ueda, H. Study to Examine the Potential for Solar Energy Utilization Based on the Relationship between Urban Morphology and Solar Radiation Gain on Building Rooftops and Wall Surfaces. Sol. Energy 2015, 119, 362–369. [Google Scholar] [CrossRef]
  40. Doubleday, K.; Choi, B.; Maksimovic, D.; Deline, C.; Olalla, C. Recovery of Inter-Row Shading Losses Using Differential Power-Processing Submodule DC-DC Converters. Sol. Energy 2016, 135, 512–517. [Google Scholar] [CrossRef]
  41. Solaredge Technical Note Bypass Diode Effects in Shaded Conditions. 2010. Available online: https://knowledge-center.solaredge.com/sites/kc/files/se_technical_bypass_diode_effect_in_shading.pdf (accessed on 5 May 2025).
  42. Silvestre, S.; Boronat, A.; Chouder, A. Study of Bypass Diodes Configuration on PV Modules. Appl. Energy 2009, 86, 1632–1640. [Google Scholar] [CrossRef]
  43. Kerekes, T.; Koutroulis, E.; Séra, D.; Teodorescu, R.; Katsanevakis, K. An Optimization Method for Designing Large PV Plants. IEEE J. Photovolt. 2013, 3, 814–822. [Google Scholar] [CrossRef]
  44. Wahhab, H.A.A. Assessment of Solar Power Tower System for Closed Space Ventilation: Numerical Investigation. IOP Conf. Ser. Mater. Sci. Eng. 2021, 1094, 012025. [Google Scholar] [CrossRef]
  45. Olalla, C.; Deline, C.; Maksimovic, D. Modeling and Simulation of Conventionally Wired Photovoltaic Systems Based on Differential Power Processing SubMIC-Enhanced PV Modules. In Proceedings of the 2014 IEEE 15th Workshop on Control and Modeling for Power Electronics (COMPEL), Santander, Spain, 22–25 June 2014. [Google Scholar] [CrossRef]
  46. Fu, R.; Feldman, D.; Margolis, R.U.S. Solar Photovoltaic System Cost Benchmark: Q1 2018; NREL/TP-6A20-72399; National Renewable Energy Laboratory: Golden, CO, USA, 2018. [Google Scholar]
  47. SpainAccountants. Available online: https://www.europeaccountants.com/spain/company-tax (accessed on 5 May 2025).
  48. Openaccessgovernment. Available online: https://www.openaccessgovernment.org/spain-suspends-solar-power-tax/53112/ (accessed on 5 May 2025).
  49. Steffen, B. Estimating the Cost of Capital for Renewable Energy Projects. Energy Econ. 2020, 88, 104783. [Google Scholar] [CrossRef]
  50. Forbes. Available online: https://www.forbes.com/sites/siemens-smart-infrastructure/2022/09/15/wireless-charging-hands-free-technology-offers-a-leap-forward-for-emobility/?sh=573d28f87b98 (accessed on 5 May 2025).
  51. Kuckshinrichs, W. Lcoe: A Useful and Valid Indicator—Replica to James Loewen and Adam Szymanski. Energies 2021, 14, 406. [Google Scholar] [CrossRef]
  52. Vartiainen, E.; Masson, G.; Breyer, C.; Moser, D.; Román Medina, E. Impact of Weighted Average Cost of Capital, Capital Expenditure, and Other Parameters on Future Utility-Scale PV Levelised Cost of Electricity. Prog. Photovolt. Res. Appl. 2020, 28, 439–453. [Google Scholar] [CrossRef]
  53. Bean, P.; Blazquez, J.; Nezamuddin, N. Assessing the Cost of Renewable Energy Policy Options—A Spanish Wind Case Study. Renew. Energy 2017, 103, 180–186. [Google Scholar] [CrossRef]
  54. Goryunova, N.N. Tax Incentives for Renewable Energy: The European Experience. Eur. Proc. Soc. Behav. Sci. 2017, 19, 507–513. [Google Scholar] [CrossRef]
  55. Schlosser, V.; Dineva, M.; Bajons, P.; Ebner, R.; Summhammer, J.; Klinger, G. Local Characterization of Multicrystalline Silicon Wafers and Solar Cells. In Recent Advances in Multidisciplinary Applied Physics; Elsevier: Hoboken, NJ, USA, 2005. [Google Scholar]
  56. David, R. Galapagos. Available online: https://www.grasshopper3d.com/profiles/blogs/evolutionary-principles (accessed on 5 May 2025).
  57. IEA. Energy Policy Review Spain. 2021. Internnational Energy Agency. 2019. Available online: https://iea.blob.core.windows.net/assets/2f405ae0-4617-4e16-884c-7956d1945f64/Spain2021.pdf (accessed on 5 May 2025).
  58. Kheiri, F. A Review on Optimization Methods Applied in Energy-efficient Building Geometry and Envelope Design. Renew. Sustain. Energy Rev. 2018, 92, 897–920. [Google Scholar] [CrossRef]
Figure 1. 3D Satellite image of the selected area in the La Vila Olímpica neighbourhood.
Solar 05 00034 g001
Figure 2. Simplified 3D model of La Vila Olímpica developed for the analysis of rooftop photovoltaic (PV) potential.
Solar 05 00034 g002
Figure 3. Optimised panel positioning on rooftop with edge setbacks and tilt constraints, indicating removed panels based on shading and access requirements. (The colored areas indicate panels excluded during the optimization process due to multiple constraints and loss factors, including shading, offset requirements, and accessibility. The left image shows the irradiance gradient that guided the panel placement).
Solar 05 00034 g003
Figure 4. Irradiance distribution across PV panel surface based on point-specific simulation for a selected hour and orientation.
Solar 05 00034 g004
Figure 5. Clustering PV arrays by proximity and irradiance uniformity, visualised with different colours.
Solar 05 00034 g005
Figure 6. Spatial distribution of FAR and BCR across 9 × 9 urban segments in the case study area. (Note: Cell colors indicate relative value intensity, with darker shades representing higher values for easier comparison).
Solar 05 00034 g006
Figure 7. Monthly variation in hourly energy production and consumption normalised to floor area (kWh/m2).
Solar 05 00034 g007
Figure 8. Impact of hypothetical rotation of the case study neighbourhood on utility bills and solar access.
Solar 05 00034 g008
Figure 9. Comparative analysis of financial metrics and system performance ratios across PV scenarios. Defined scenarios: (Small modules (a): panels with a range of 0.36 to 1 m2), (small modules with rotation (b): this scenario indicates an optimisation in the small module category, with an engaging optimal deviation angle of the neighbourhood as an additional independent variable), (medium-size modules (c): panels with a range of 1 to 2.5 m2), (large-size modules (d): panels with a range of 2.5 to 10 m2 are considered large-size modules. Huge-size modules (Gen10.5) (e): panels with an area of 5.7 m2), (medium module common size (f): this scenario maintains an optimisation with medium module size, while optimising other variables). (Standard spacing (g): a modelled scenario is assumed by engaging a minimal spacing date for spacing estimation, where there is almost no partial shading caused by modules on each other (21 December at 9 am or 3 pm, depending on the orientation of panels)), (standard fixed tilted (h): a fixed tilted angle of 31.5 degrees, with an orientation of 180 degrees from the south, is another considered assumption for standard configurations).
Solar 05 00034 g009
Figure 10. Comparative analysis of energy yield, CO2 emissions, and capital cost across PV deployment scenarios in La Vila Olímpica.
Solar 05 00034 g010
Figure 11. Integrated comparison of financial, environmental, and operational metrics for SubMICs+ deployment scenarios.
Solar 05 00034 g011
Table 1. Numerical values of FAR and BCR across the 9 × 9 spatial grids (D1–D9 rows, columns 1–9).
North
000000.631.330.080000000.3510.6230.0290
00000.361.61.171.120.1200000.2360.6140.7070.2320.018
0000.550.41.171.21.291.70000.1820.2220.5010.1740.1960.243
00.011.291.040.450.871.120.810.4600.0020.2350.2270.3950.1570.1910.1170.054
0.051.181.031.460.741.361.10.800.0070.2740.3760.3640.1370.2110.2790.2780
2.130.890.741.261.551.640.82000.3560.2750.2260.2360.2510.3160.33200
0.851.171.320.951.090.640000.1350.3320.2510.2450.4150.221000
01.6711.250.81000000.2390.1870.3370.2190000
00.241.540.530000000.0340.3030.15100000
FARBCR
Table 2. Summary of optimised PV configurations for different design scenarios in Vila La Olímpica. Defined scenarios: (Small modules (a): panels with a range of 0.36 to 1 m2), (small modules with rotation (b): this scenario indicates an optimisation in the small module category, with an engaging optimal deviation angle of the neighbourhood as an additional independent variable), (medium-size modules (c): panels with a range of 1 to 2.5 m2), (large-size modules (d): panels with a range of 2.5 to 10 m2 are considered large-size modules. Huge-size modules (Gen10.5) (e): panels with an area of 5.7 m2), (medium module common size (f): this scenario maintains an optimisation with medium module size, while optimising other variables). (Standard spacing (g): a modelled scenario is assumed by engaging a minimal spacing date for spacing estimation, where there is almost no partial shading caused by modules on each other (21 December at 9 am or 3 pm, depending on the orientation of panels)), (standard fixed tilted (h): a fixed tilted angle of 31.5 degrees, with an orientation of 180 degrees from the south is another considered assumption for standard configurations).
abcdefgh
Tilt (degree)88108.5431.5531.5
Orientation (degree)180180186194158188201180
Minimum sun altitude angle considered for spacing calculation (degree)303022202032Sun altitude: 6.24_sun azimuth: 128.93
Module height (m)0.60.61.052.2531.050.91.35
Module width (m)0.91.051.652.553.31.651.22.25
PPA price (Euro/kWh)0.10.10.10.10.10.10.10.2
Spacing (m)0.70.71.53.13.61.81.15.3
Number of participating buildings (out of 255)195197187149124185194115
Avrg. system size (kW)4839.535.537.540323720.15
Total number of panels76,15267,86221,3005355276018,92337,2514081
Avrg. installed cost (Euro/W)1.371.461.361.241.221.381.431.3
Table 3. Comparative financial, environmental, and technical performance of PV installation scenarios.
abcdefgh
NPV (Euro)2.772.762.843.023.032.752.781.82
Payback (yr)7.57.55.833.753.56.257.163.5
IRR (%)1010121719131120
MIRR (%)8899109810
Performance ratio (%)63.0163.263.7662.9861.7261.8461.9766.81
Total energy (kWh)8.08 × 1068 × 1067 × 1066 × 1065.07 × 1066 × 1067 × 1063 × 106
LCOE (EUR ct/kWh)8.08.07.07.07.08.28.18.0
CO2 emission rate (gCO2/kWh)39.639.539.239.640.440.240.336.3
Host NPV/m2 (Euro/m2)−202.48−201−207.1−214.4−219.03−213.07−205.6−229.6
Host energy coverage (%)0.270.270.240.210.20.210.250.1
GCR (%)47.647.641.836.935.237.245.316
Specific Yield (kWh/kWp)10431046105510431022102410251106
CF (%)11.911.9412.0411.911.6611.6811.6912.62
Total cost (Euro)7.22 × 1067.18 × 1065.97 × 1064.86 × 1064.40 × 1065.46 × 1066.63 × 1062.45 × 106
O&M (Euro)1.10 × 1061.10 × 1060.95 × 1060.79 × 1060.70 × 1060.84 × 1061.04 × 1060.32 × 106
Inverter (Euro)0.74 × 1060.74 × 1060.61 × 1060.48 × 1060.42 × 1060.55 × 1060.68 × 1060.22 × 106
Capital (Euro)5.37 × 1065.33 × 1064.4 × 1063.58 × 1063.26 × 1064.05 × 1064.91 × 1061.90 × 106
Table 4. Composite weighted performance scores of optimised PV scenarios in Vila Olímpica based on multi-criteria analysis.
Metrics (Weighted Average)abcdefgh
Financial0.30.30.340.440.470.340.310.33
Energy performance1.031.040.90.740.650.770.950.41
LCOE0.320.330.390.40.350.310.320.15
Environmental1.121.121.141.121.081.091.091.29
Host Financial0.950.970.840.520.440.540.880.19
Total3.733.783.633.243.013.073.562.39
Table 5. Optimised geometric and financial parameters for SubMICs+ deployment scenarios.
Neighbourhood’s ConfigurationSmall Modules SubMICs+ Scenario
Tilt (degree)11
Orientation from the south0
Minimum sun altitude angle for spacing calculations66
Module height (m)0.6
Module width (m)0.9
PPA price (Euro/kWh)0.12
Spacing (m)0.6
Number of usable buildings204 from 225
Percentage of usable buildings to total60.66
Avrg. system size (kW)39
Total number of panels81,975
Avrg. installed cost (Euro/W)1.47
Table 6. Optimised SubMICs+ deployment: summary of energy, financial, and environmental performance.
Normalised total energy (kW/m2 per yr)92
NPV/m2 for 30 yrs41
NPV (Euro)3.7 × 10⁶
PAYBACK (yr)6.3
IRR (%)13
MIRR (%)9
Performance ratio (%)62
Total energy (kWh)8.3 × 10⁶
LCOE (EUR ct/kWh)9.0
CO2 emission rate (gCO2/kWh)40
Host NPV/m2 (Euro/m2)−205
Host energy coverage (%)0.27
GCR (%)49
Specific yield (kWh/kWp)1028
Capacity Factor (%)11.7
Maximum usable roof area (m2)90,365
Total cost (Euro)7.8 × 10⁶
O&M (Euro)1.14 × 10⁶
Disclaimer/Publisher’s Note: The statements, opinions and data contained in all publications are solely those of the individual author(s) and contributor(s) and not of MDPI and/or the editor(s). MDPI and/or the editor(s) disclaim responsibility for any injury to people or property resulting from any ideas, methods, instructions or products referred to in the content.

