
Failure Behavior of Aluminum Solar Panel Mounting Structures Subjected to Uplift Pressure: Effects of Foundation Defects

Abstract
1. Introduction
1.1. Expansion of Photovoltaic Power Generation and Introduction of Mounting Structure Design Guidelines in Japan
1.2. Purpose of the Study: Evaluating the Wind Resistance Performance of Solar Panel Mounting Structures with Foundation Deficiencies
2. Uplift Pressure Resistance Performance of a Solar Panel Mounting Structure with Foundation Defects Evaluated by Pressure Loading Tests
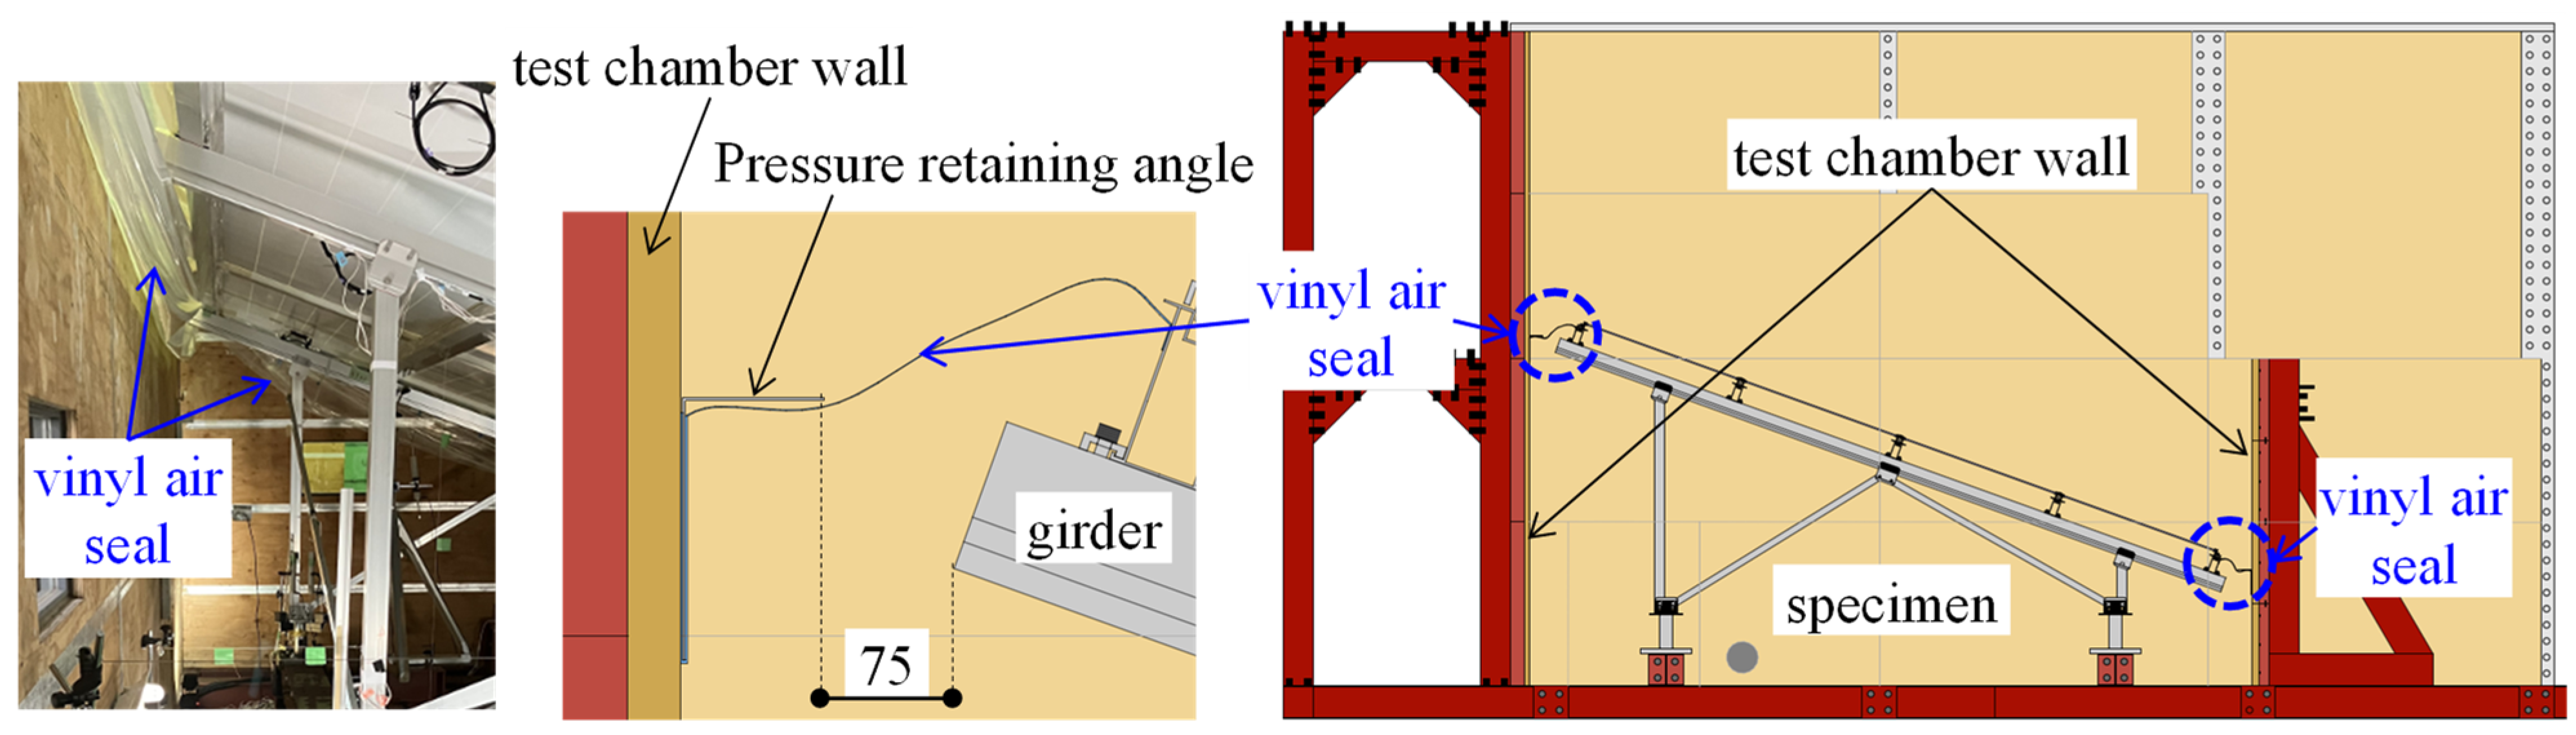
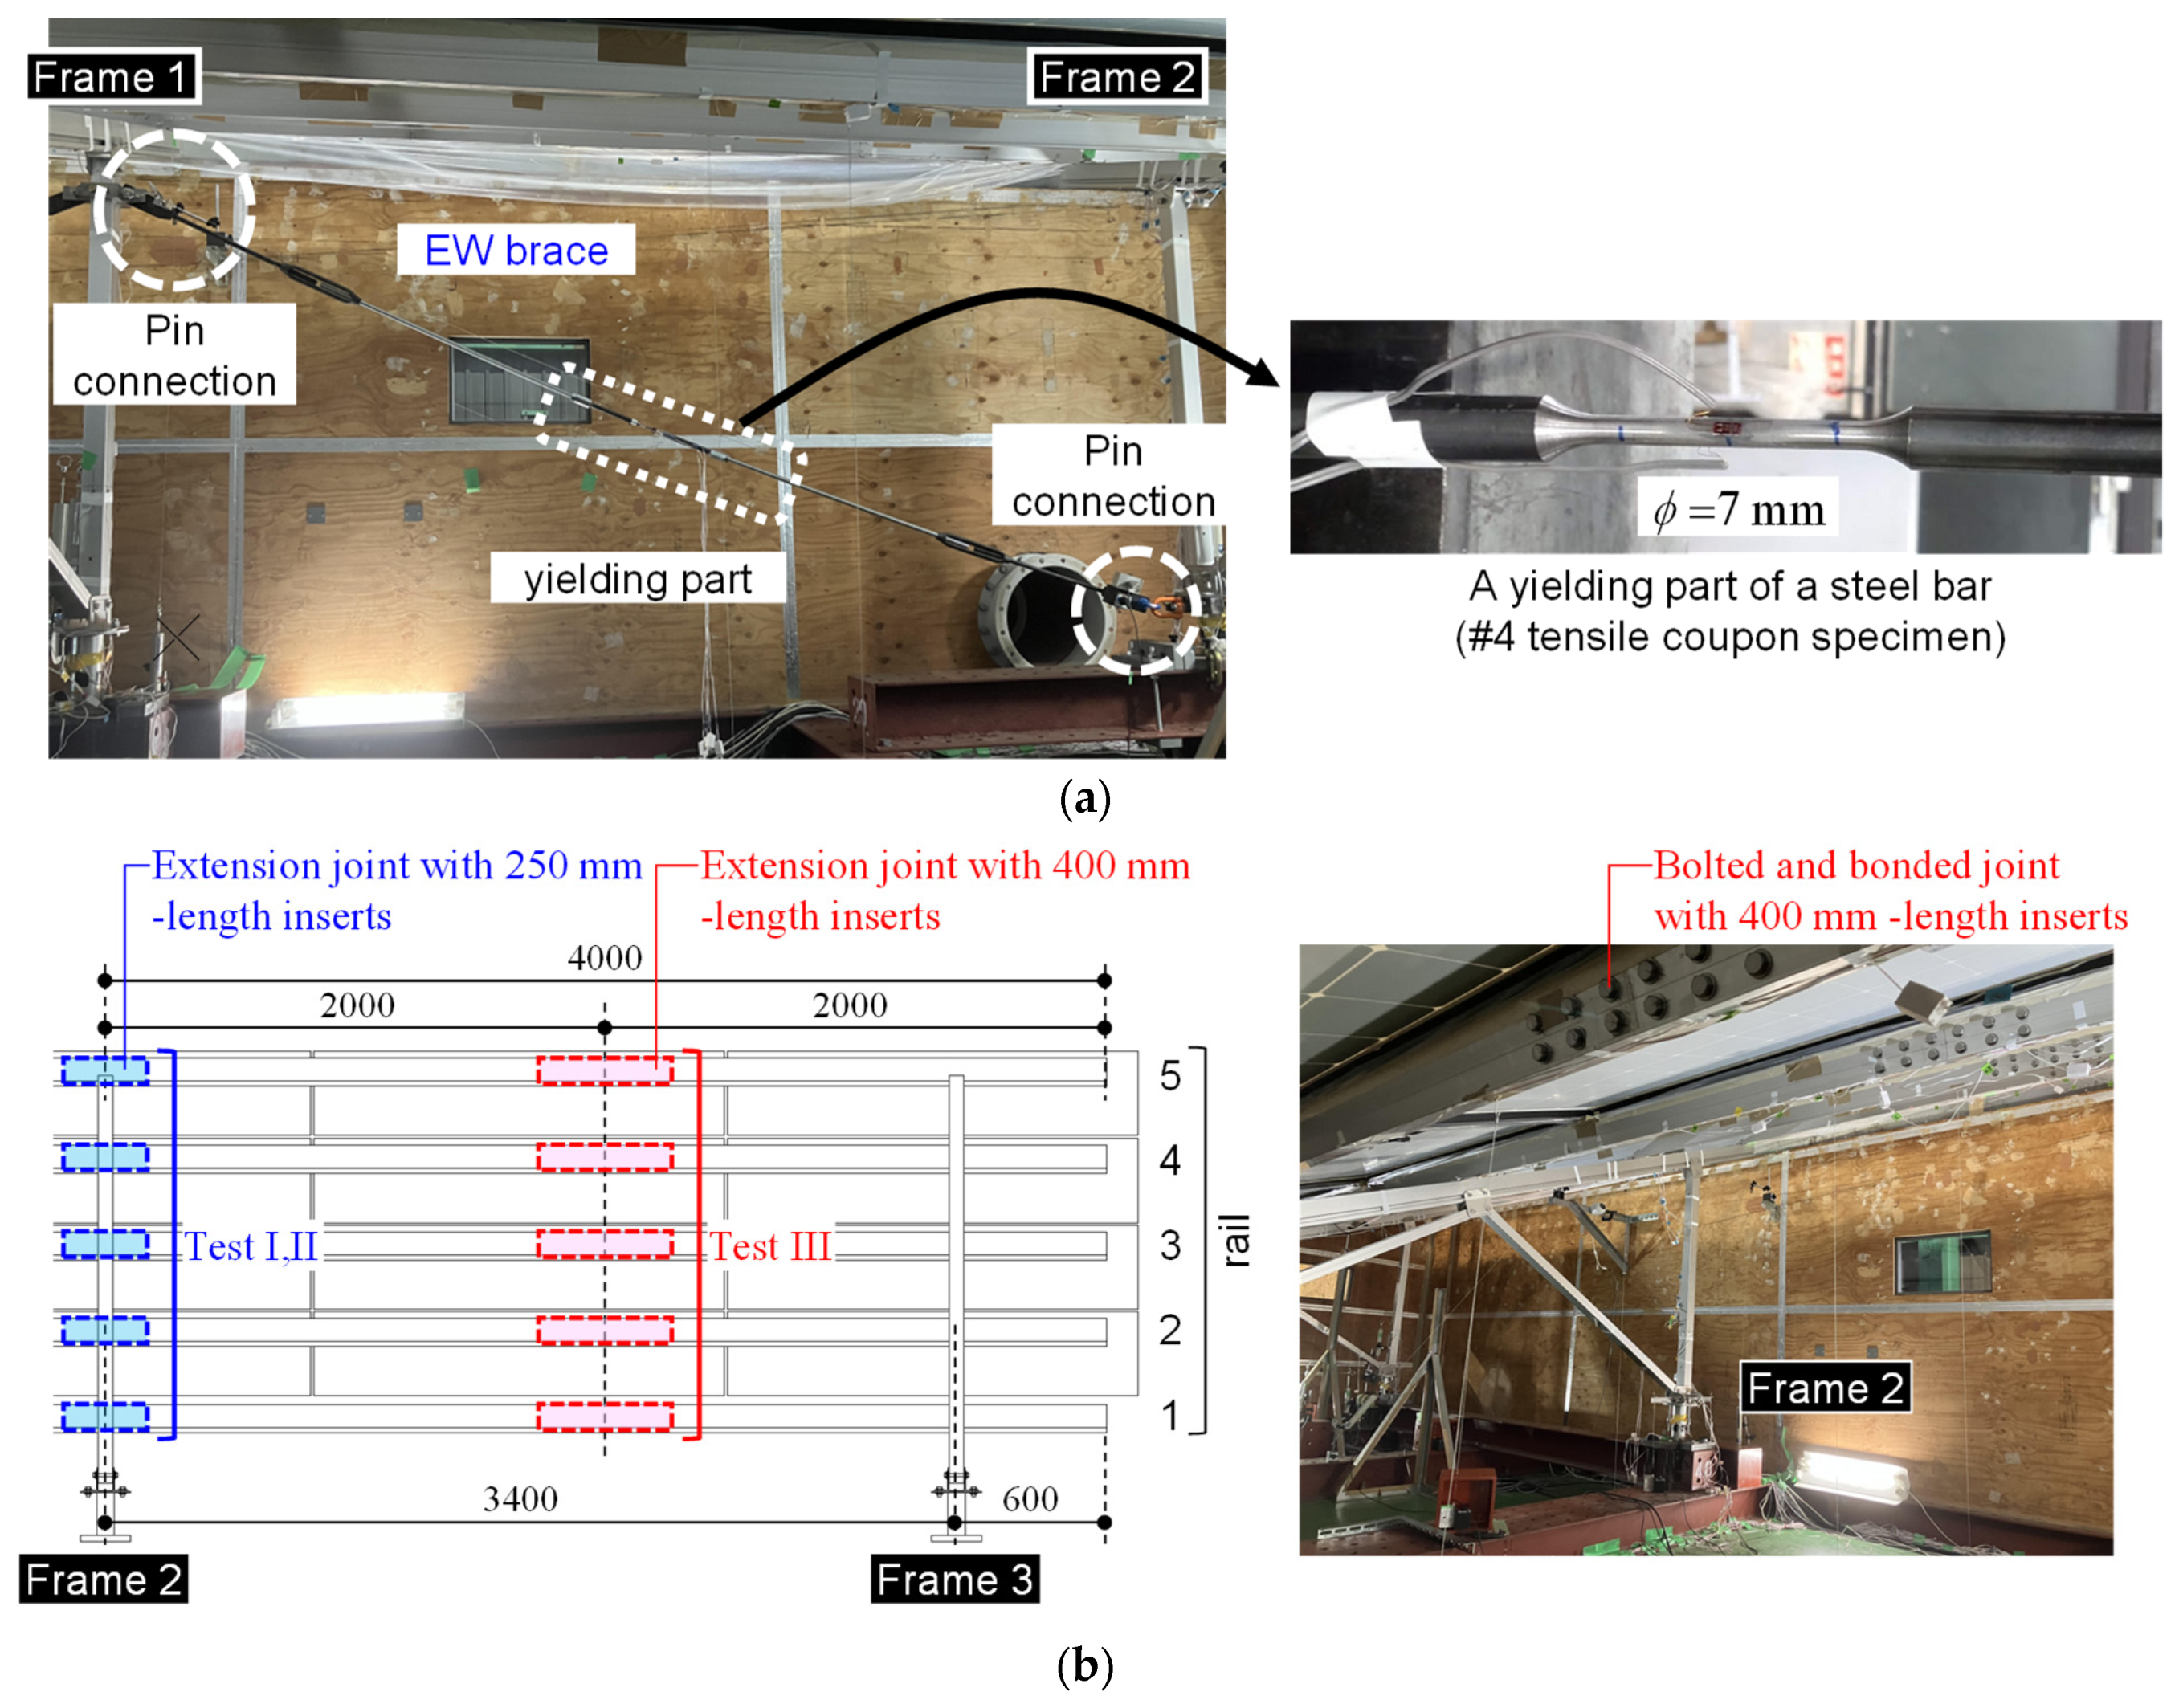
2.1. Test Setup of Full-Scale Pressure Loading Tests
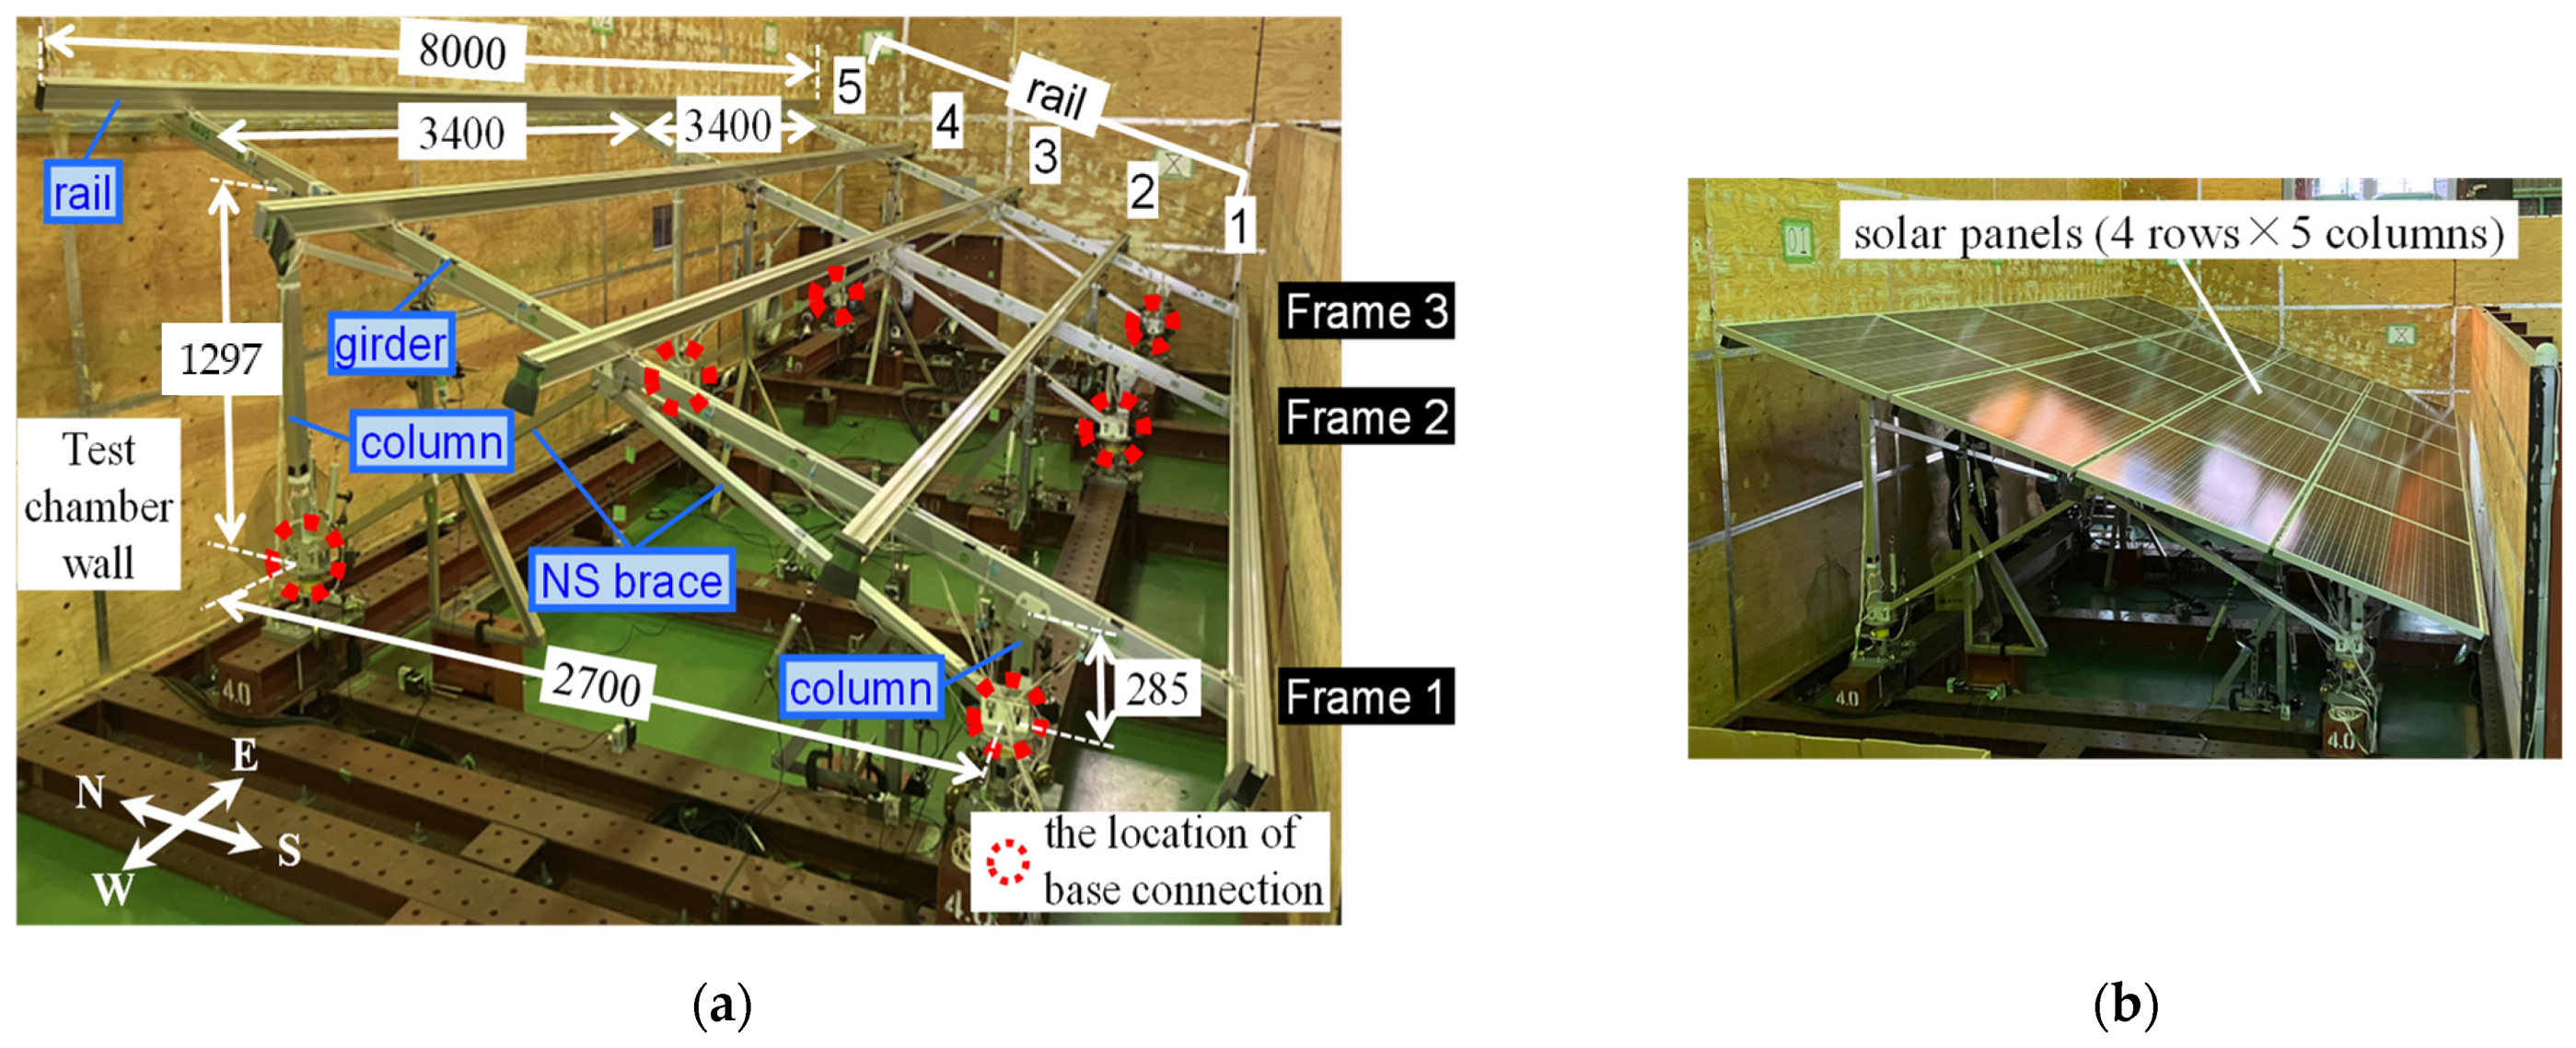
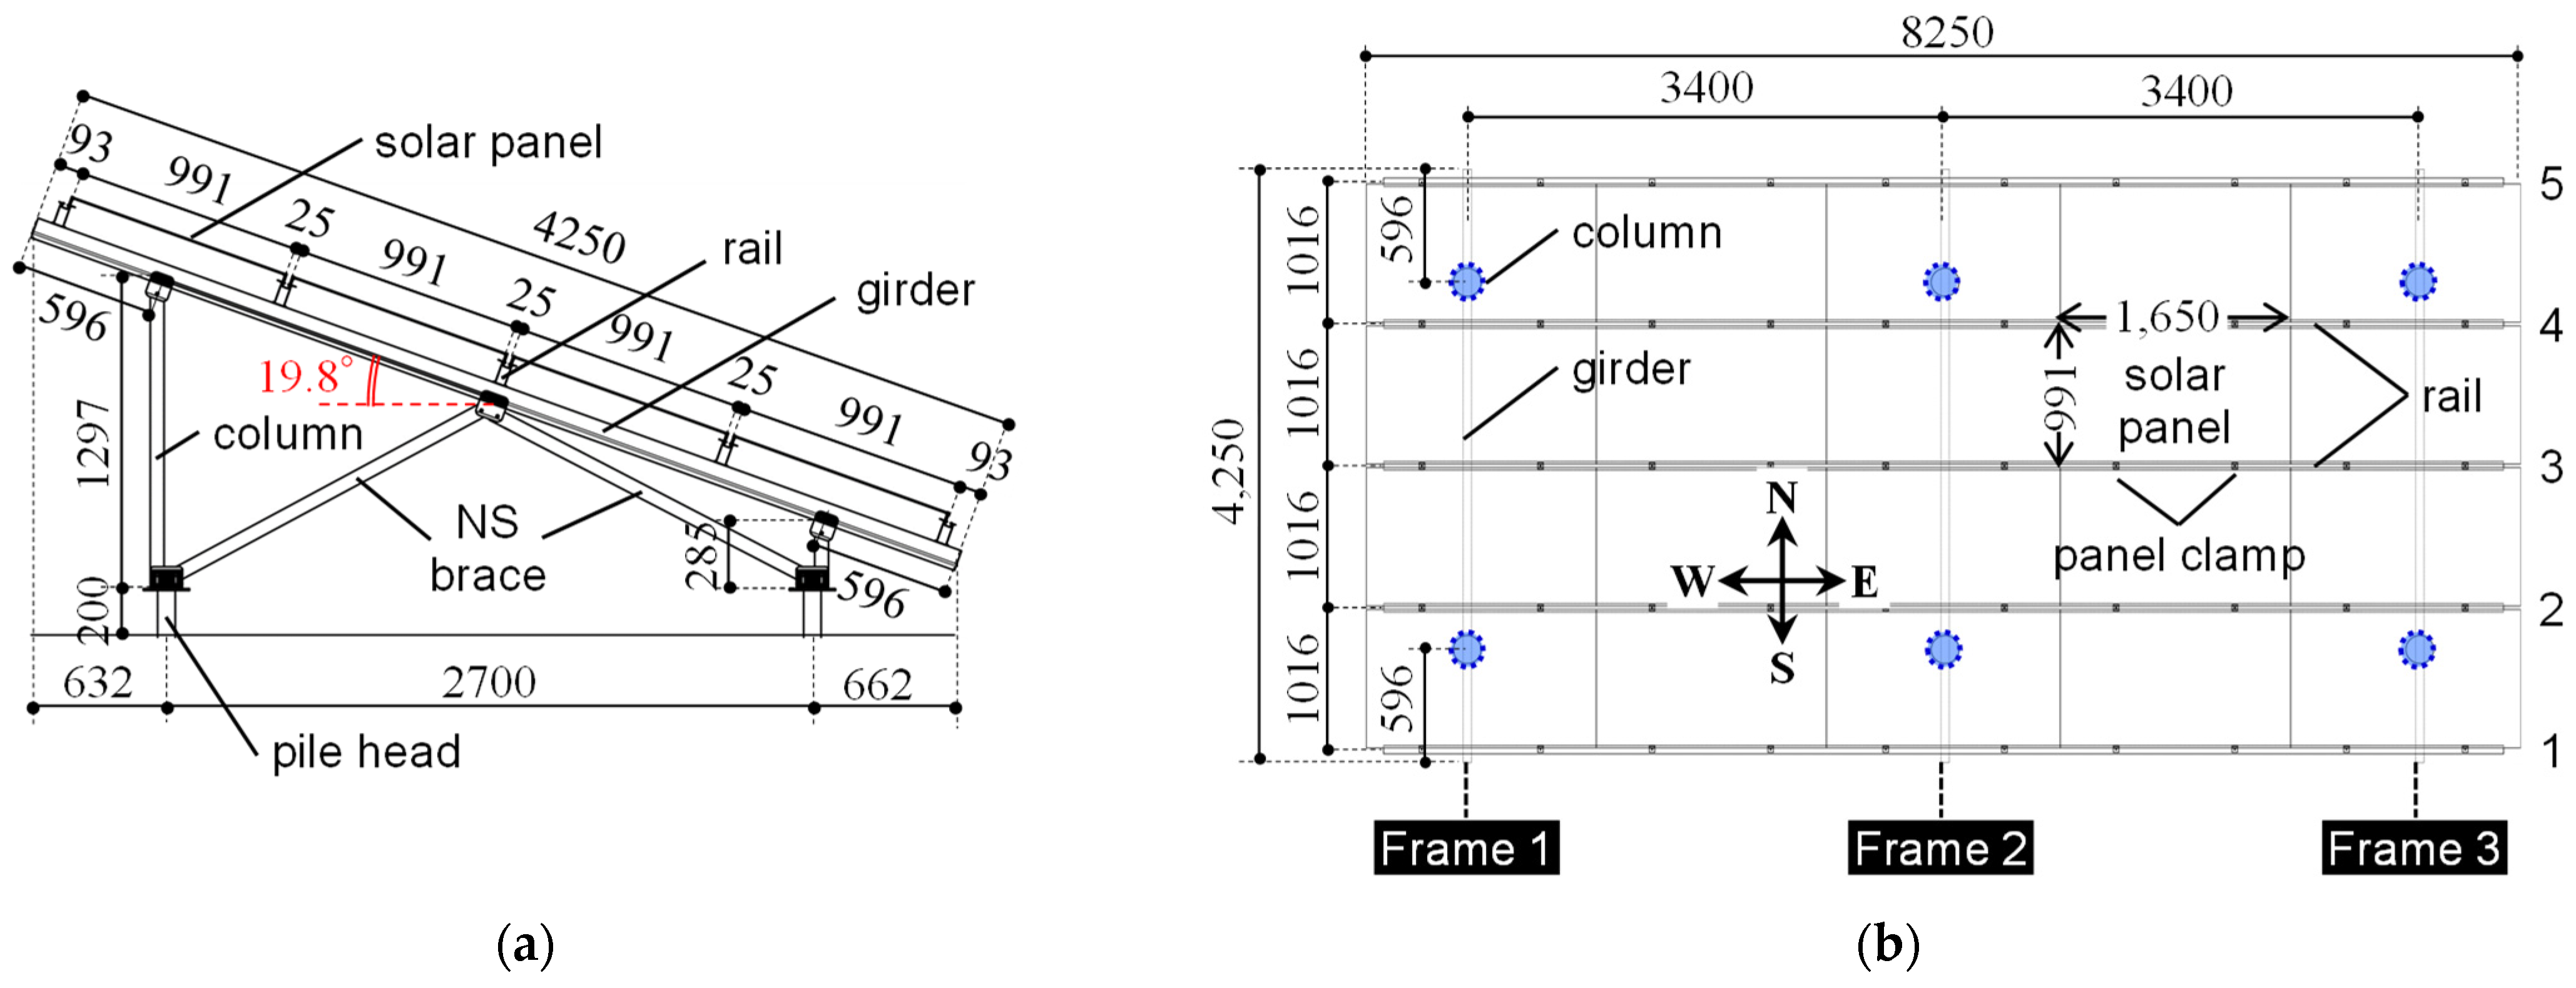
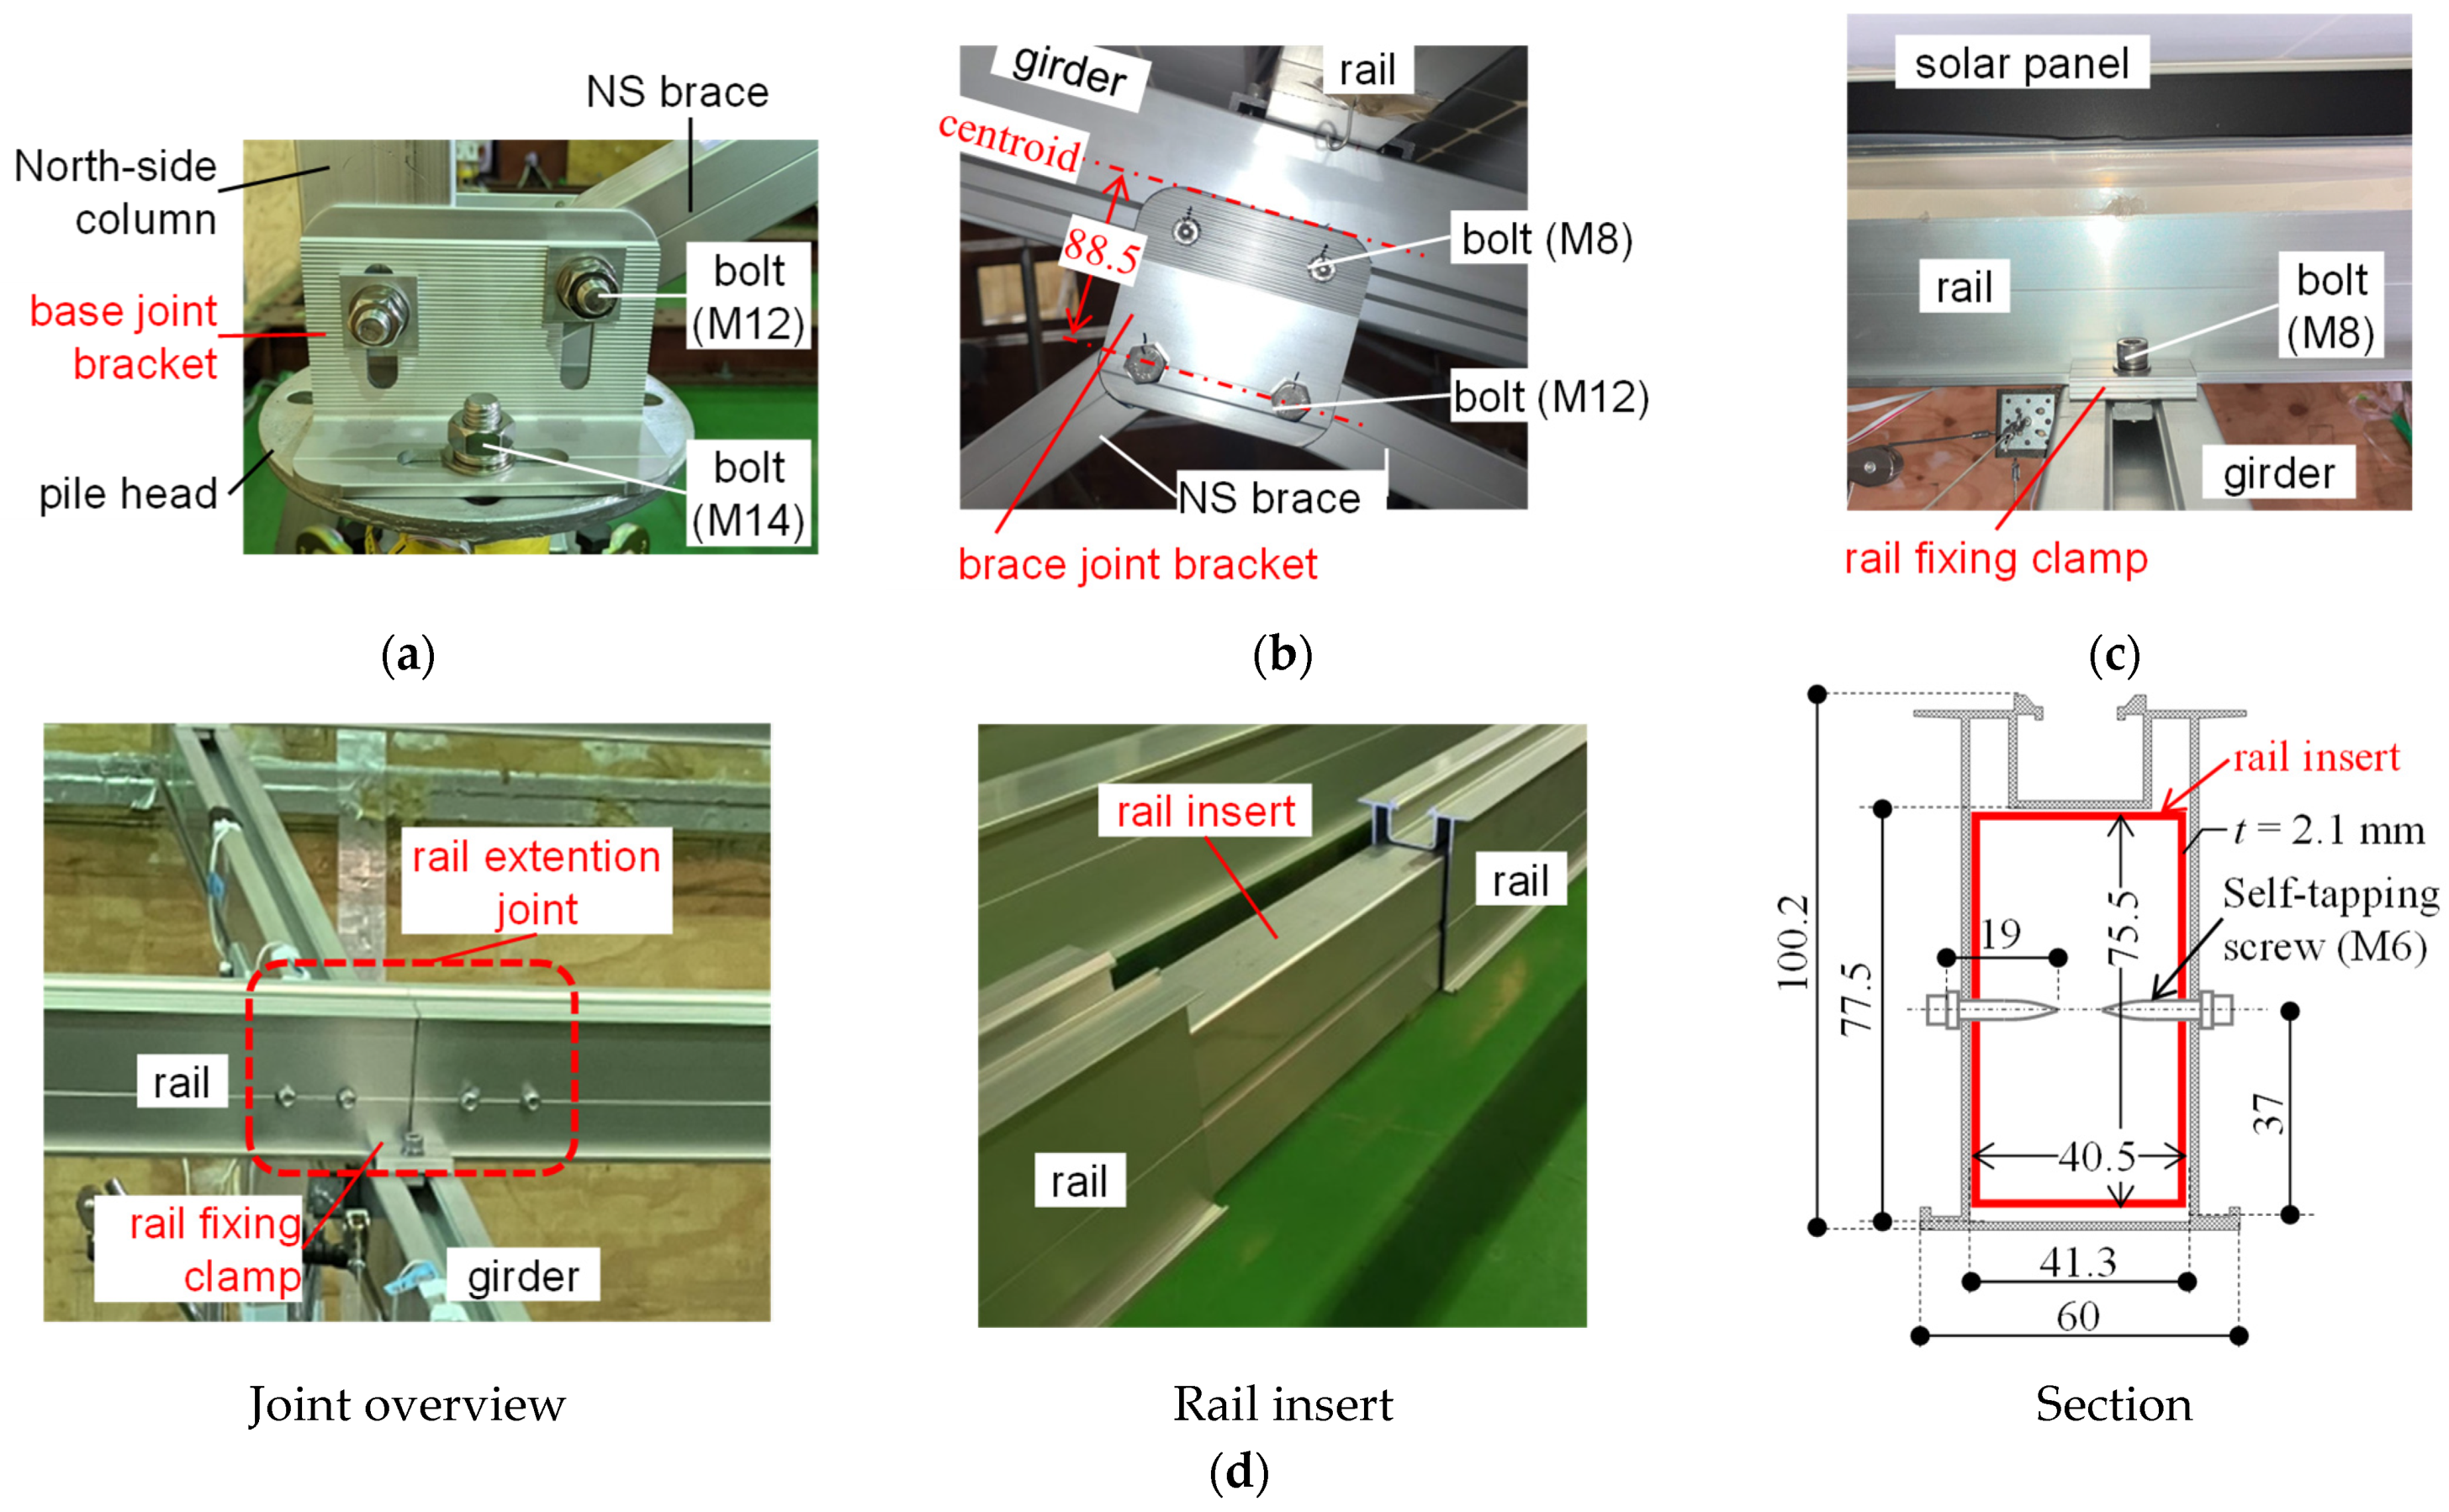
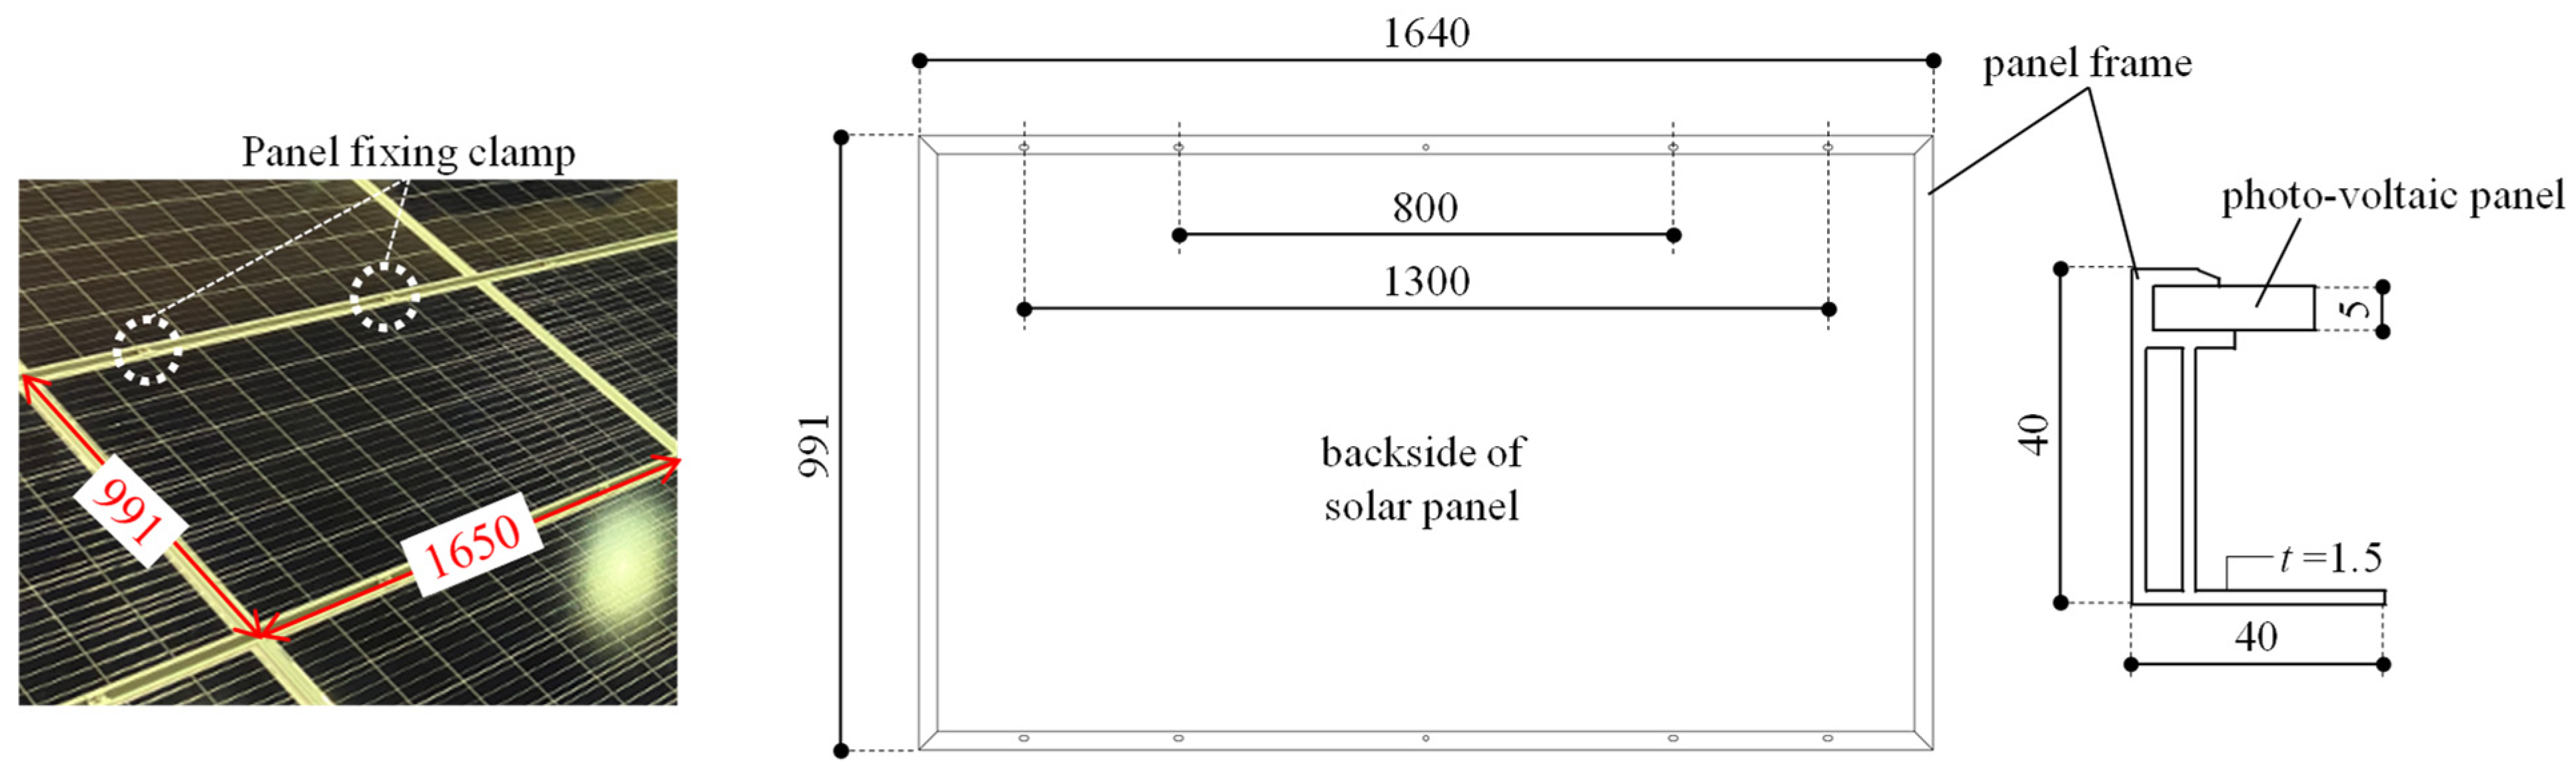
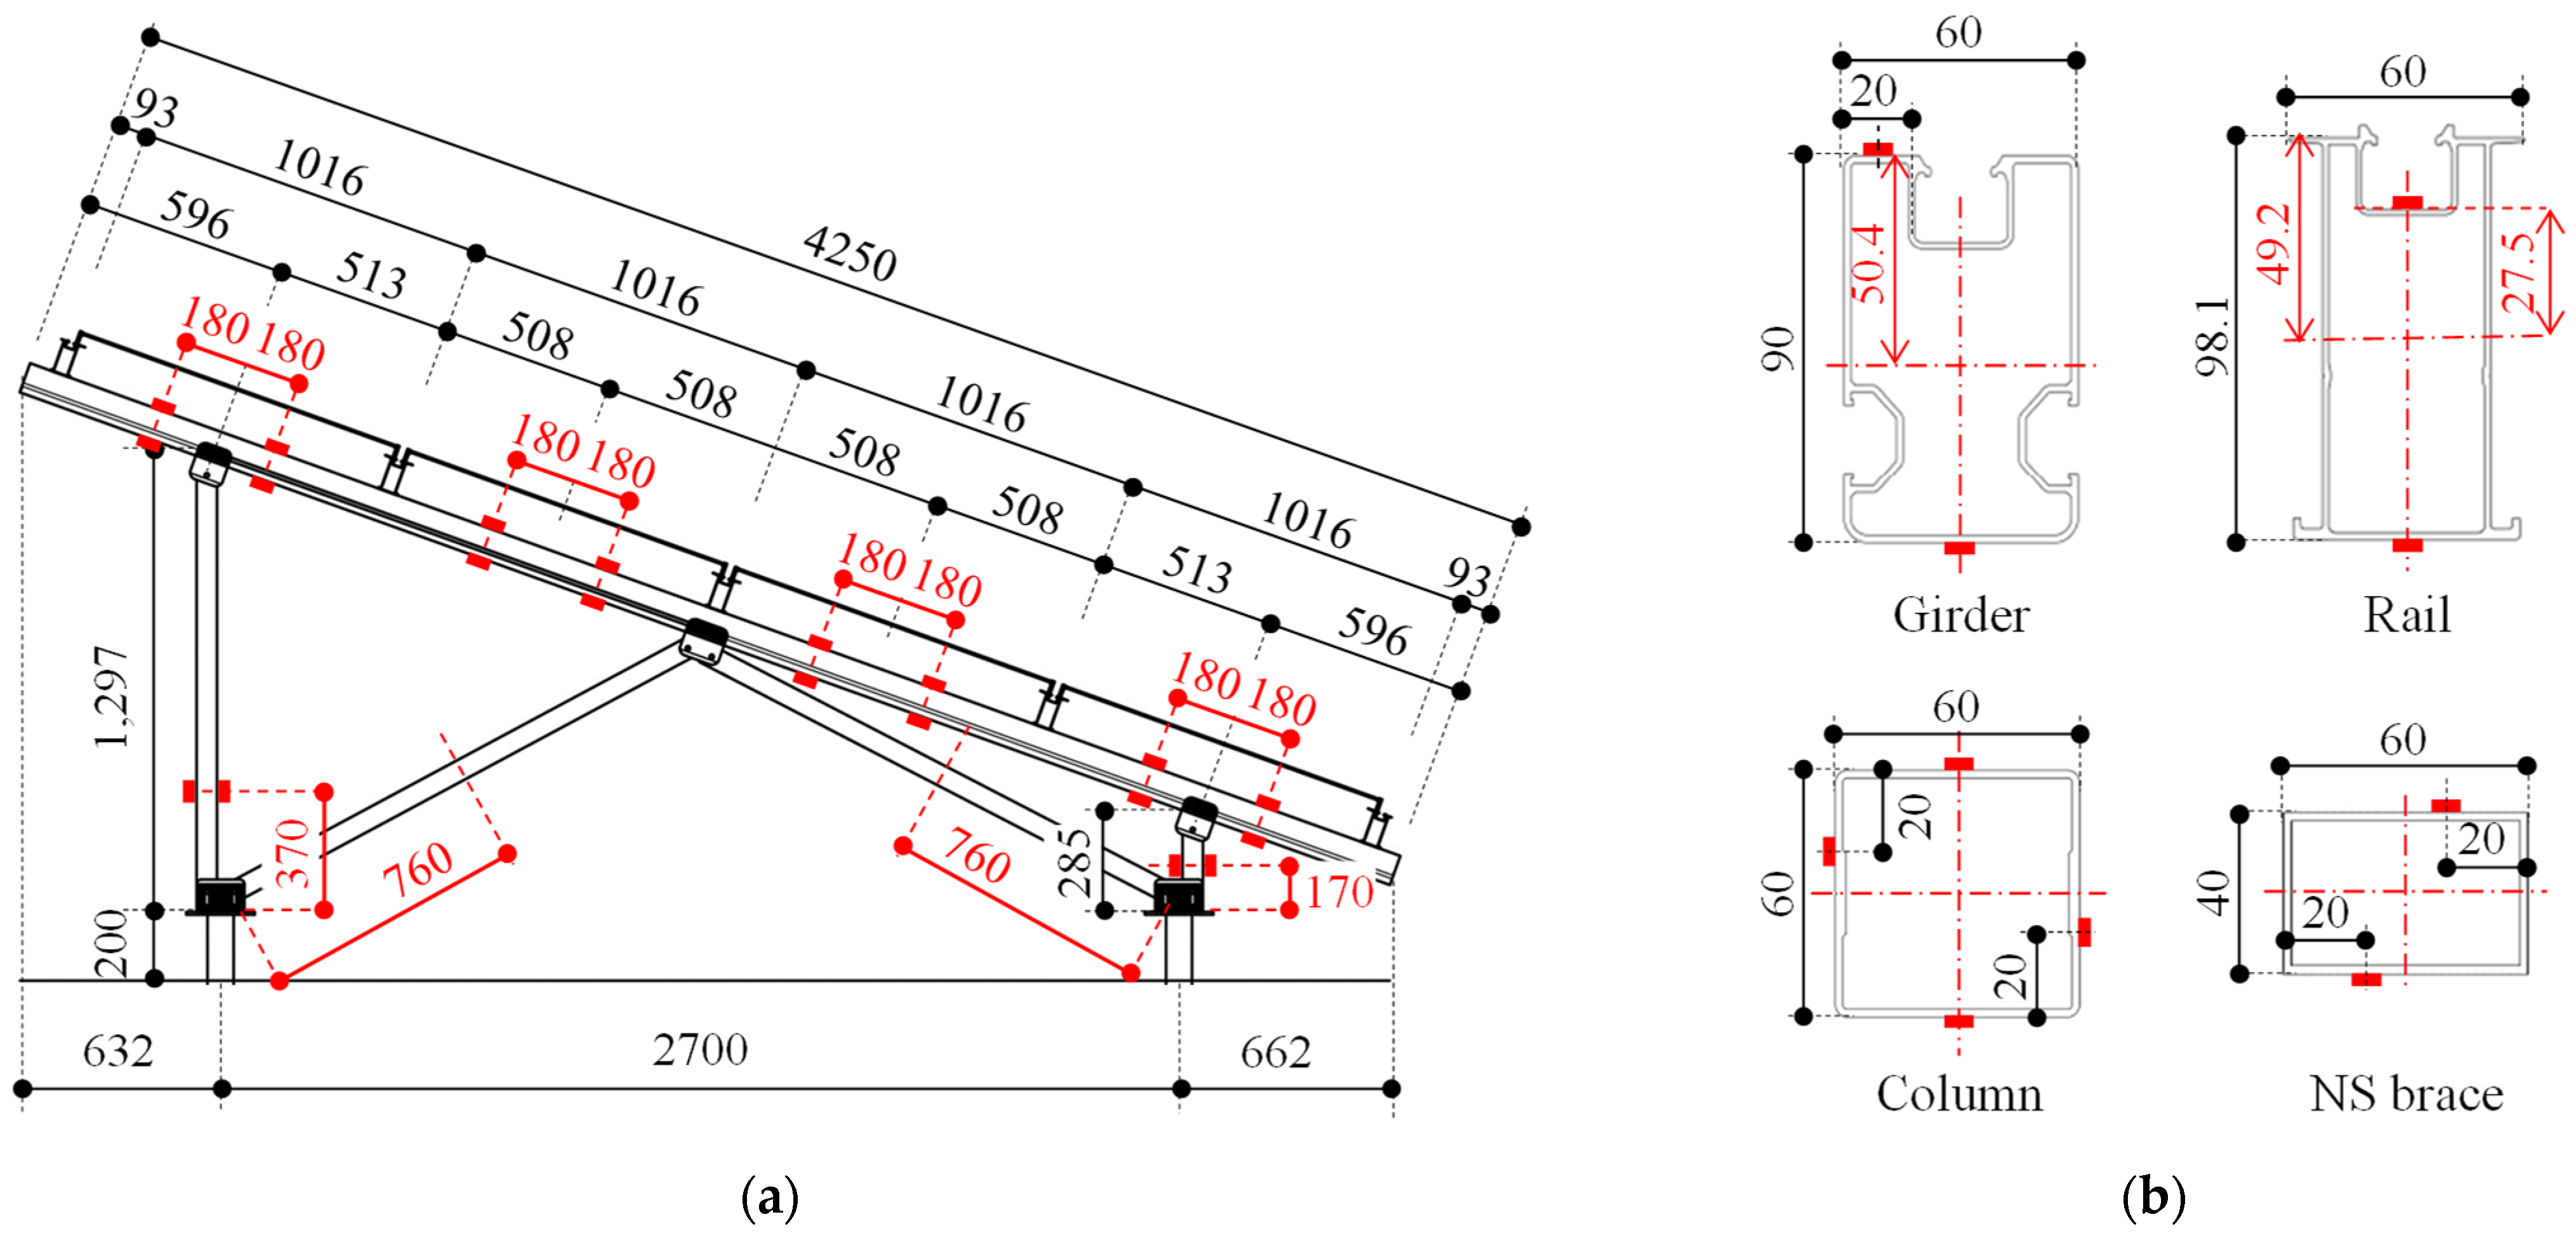
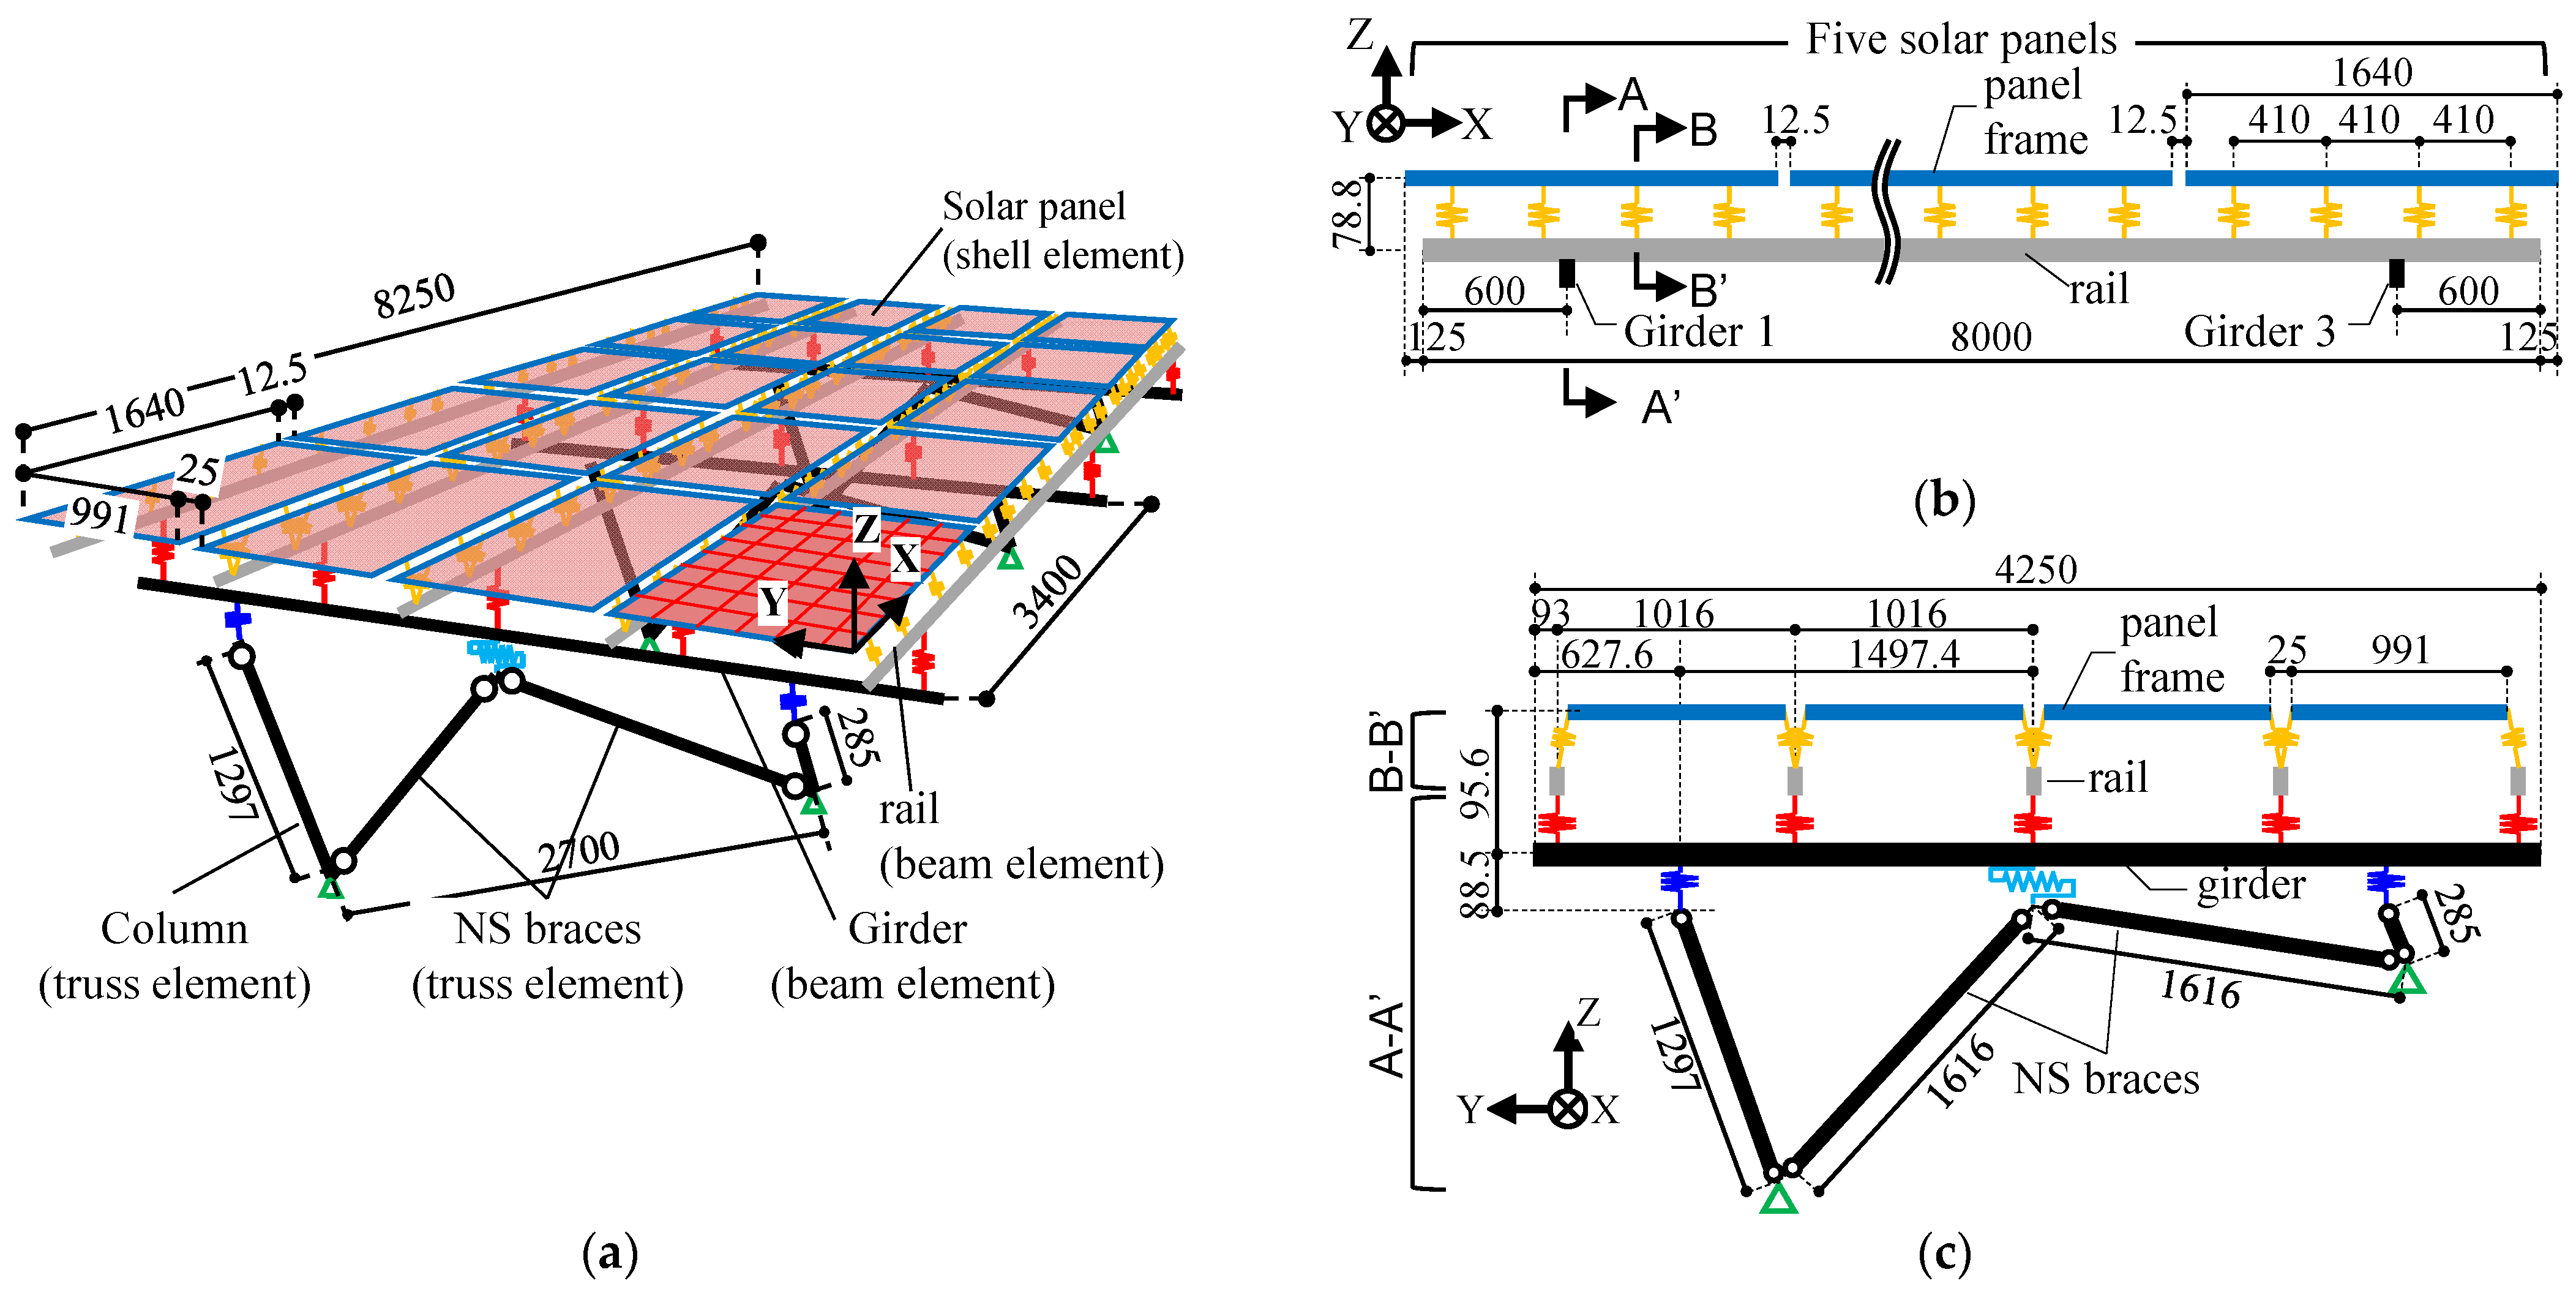
2.1.1. Solar Panel Mounting Structure Specimen
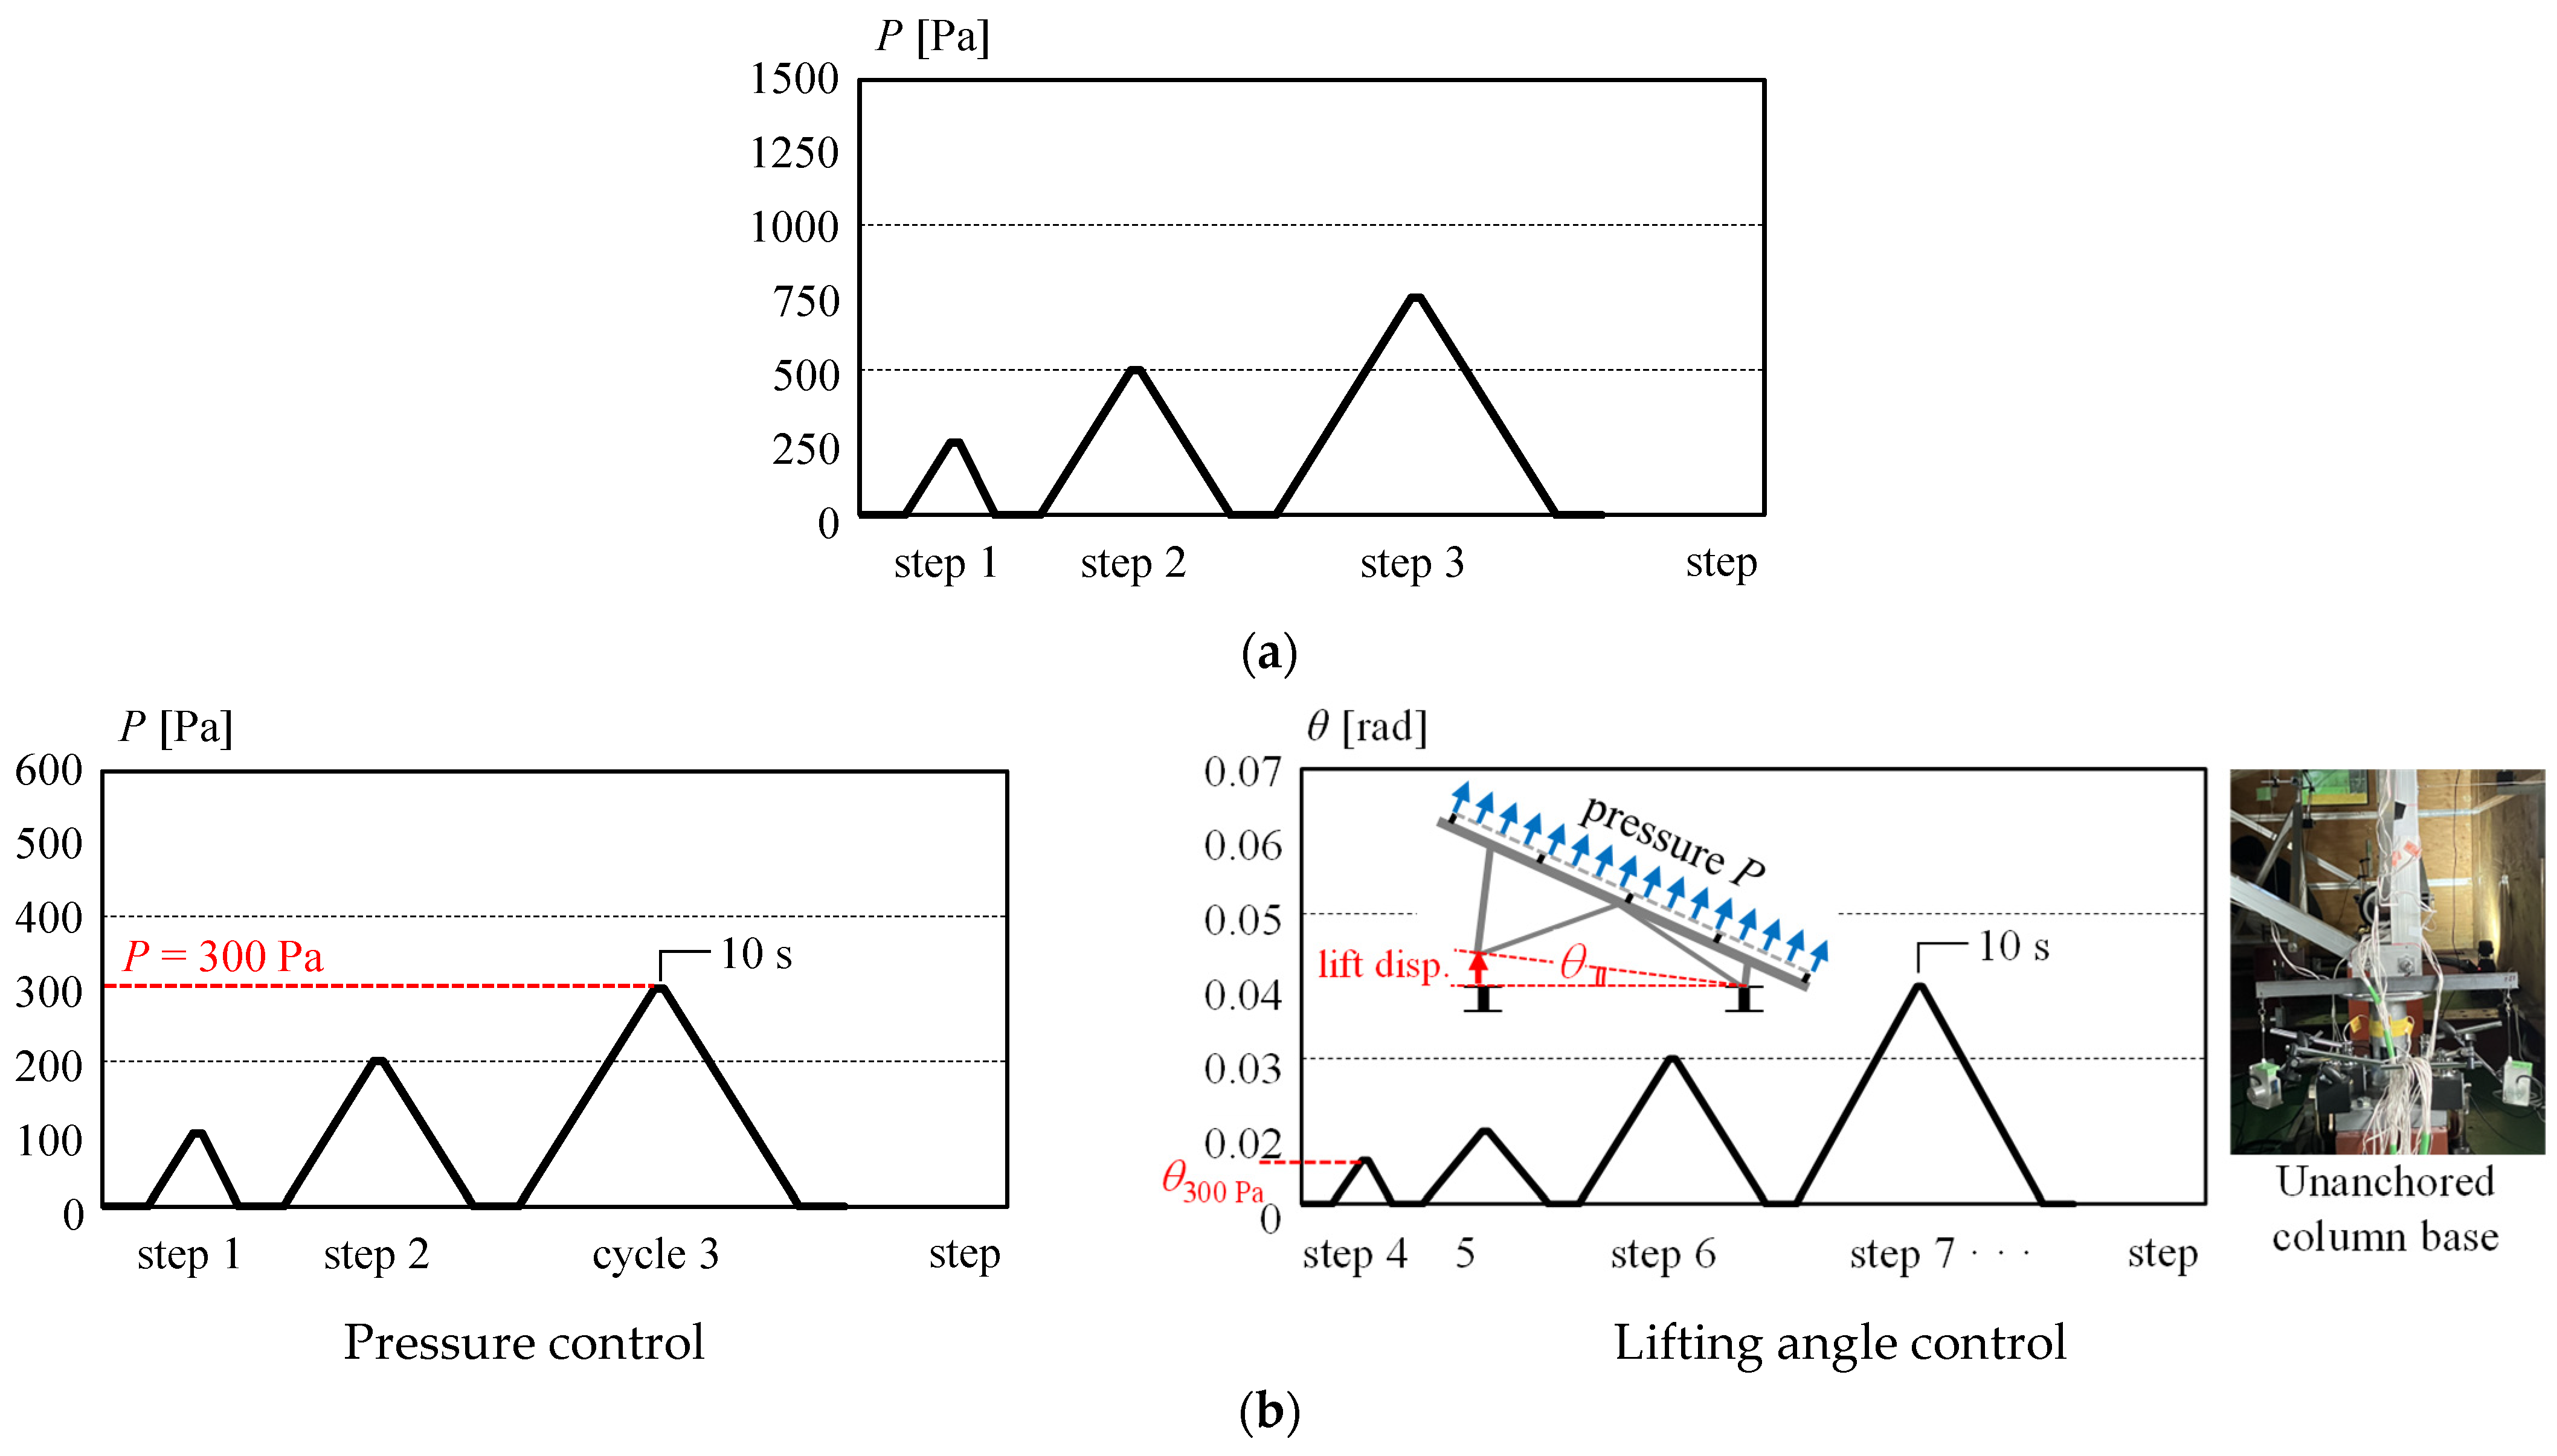
2.1.2. Specimen List and Pressure Loading Test

| Specimen | Pressure Direction | Loading Type | Support Condition | Measurement Plan |
|---|---|---|---|---|
| O | uplift pressure | Elastic—Fracture | A | |
| I | Elastic (up to 500 Pa) | A | Figure 7 | |
| Elastic—Fracture | B | |||
 | ||||
2.1.3. Measurement Plan for the Mounting Structure
2.2. Test Results of the Solar Panel Mounting Structure: Comparison Between Cases with and Without Foundation Defects
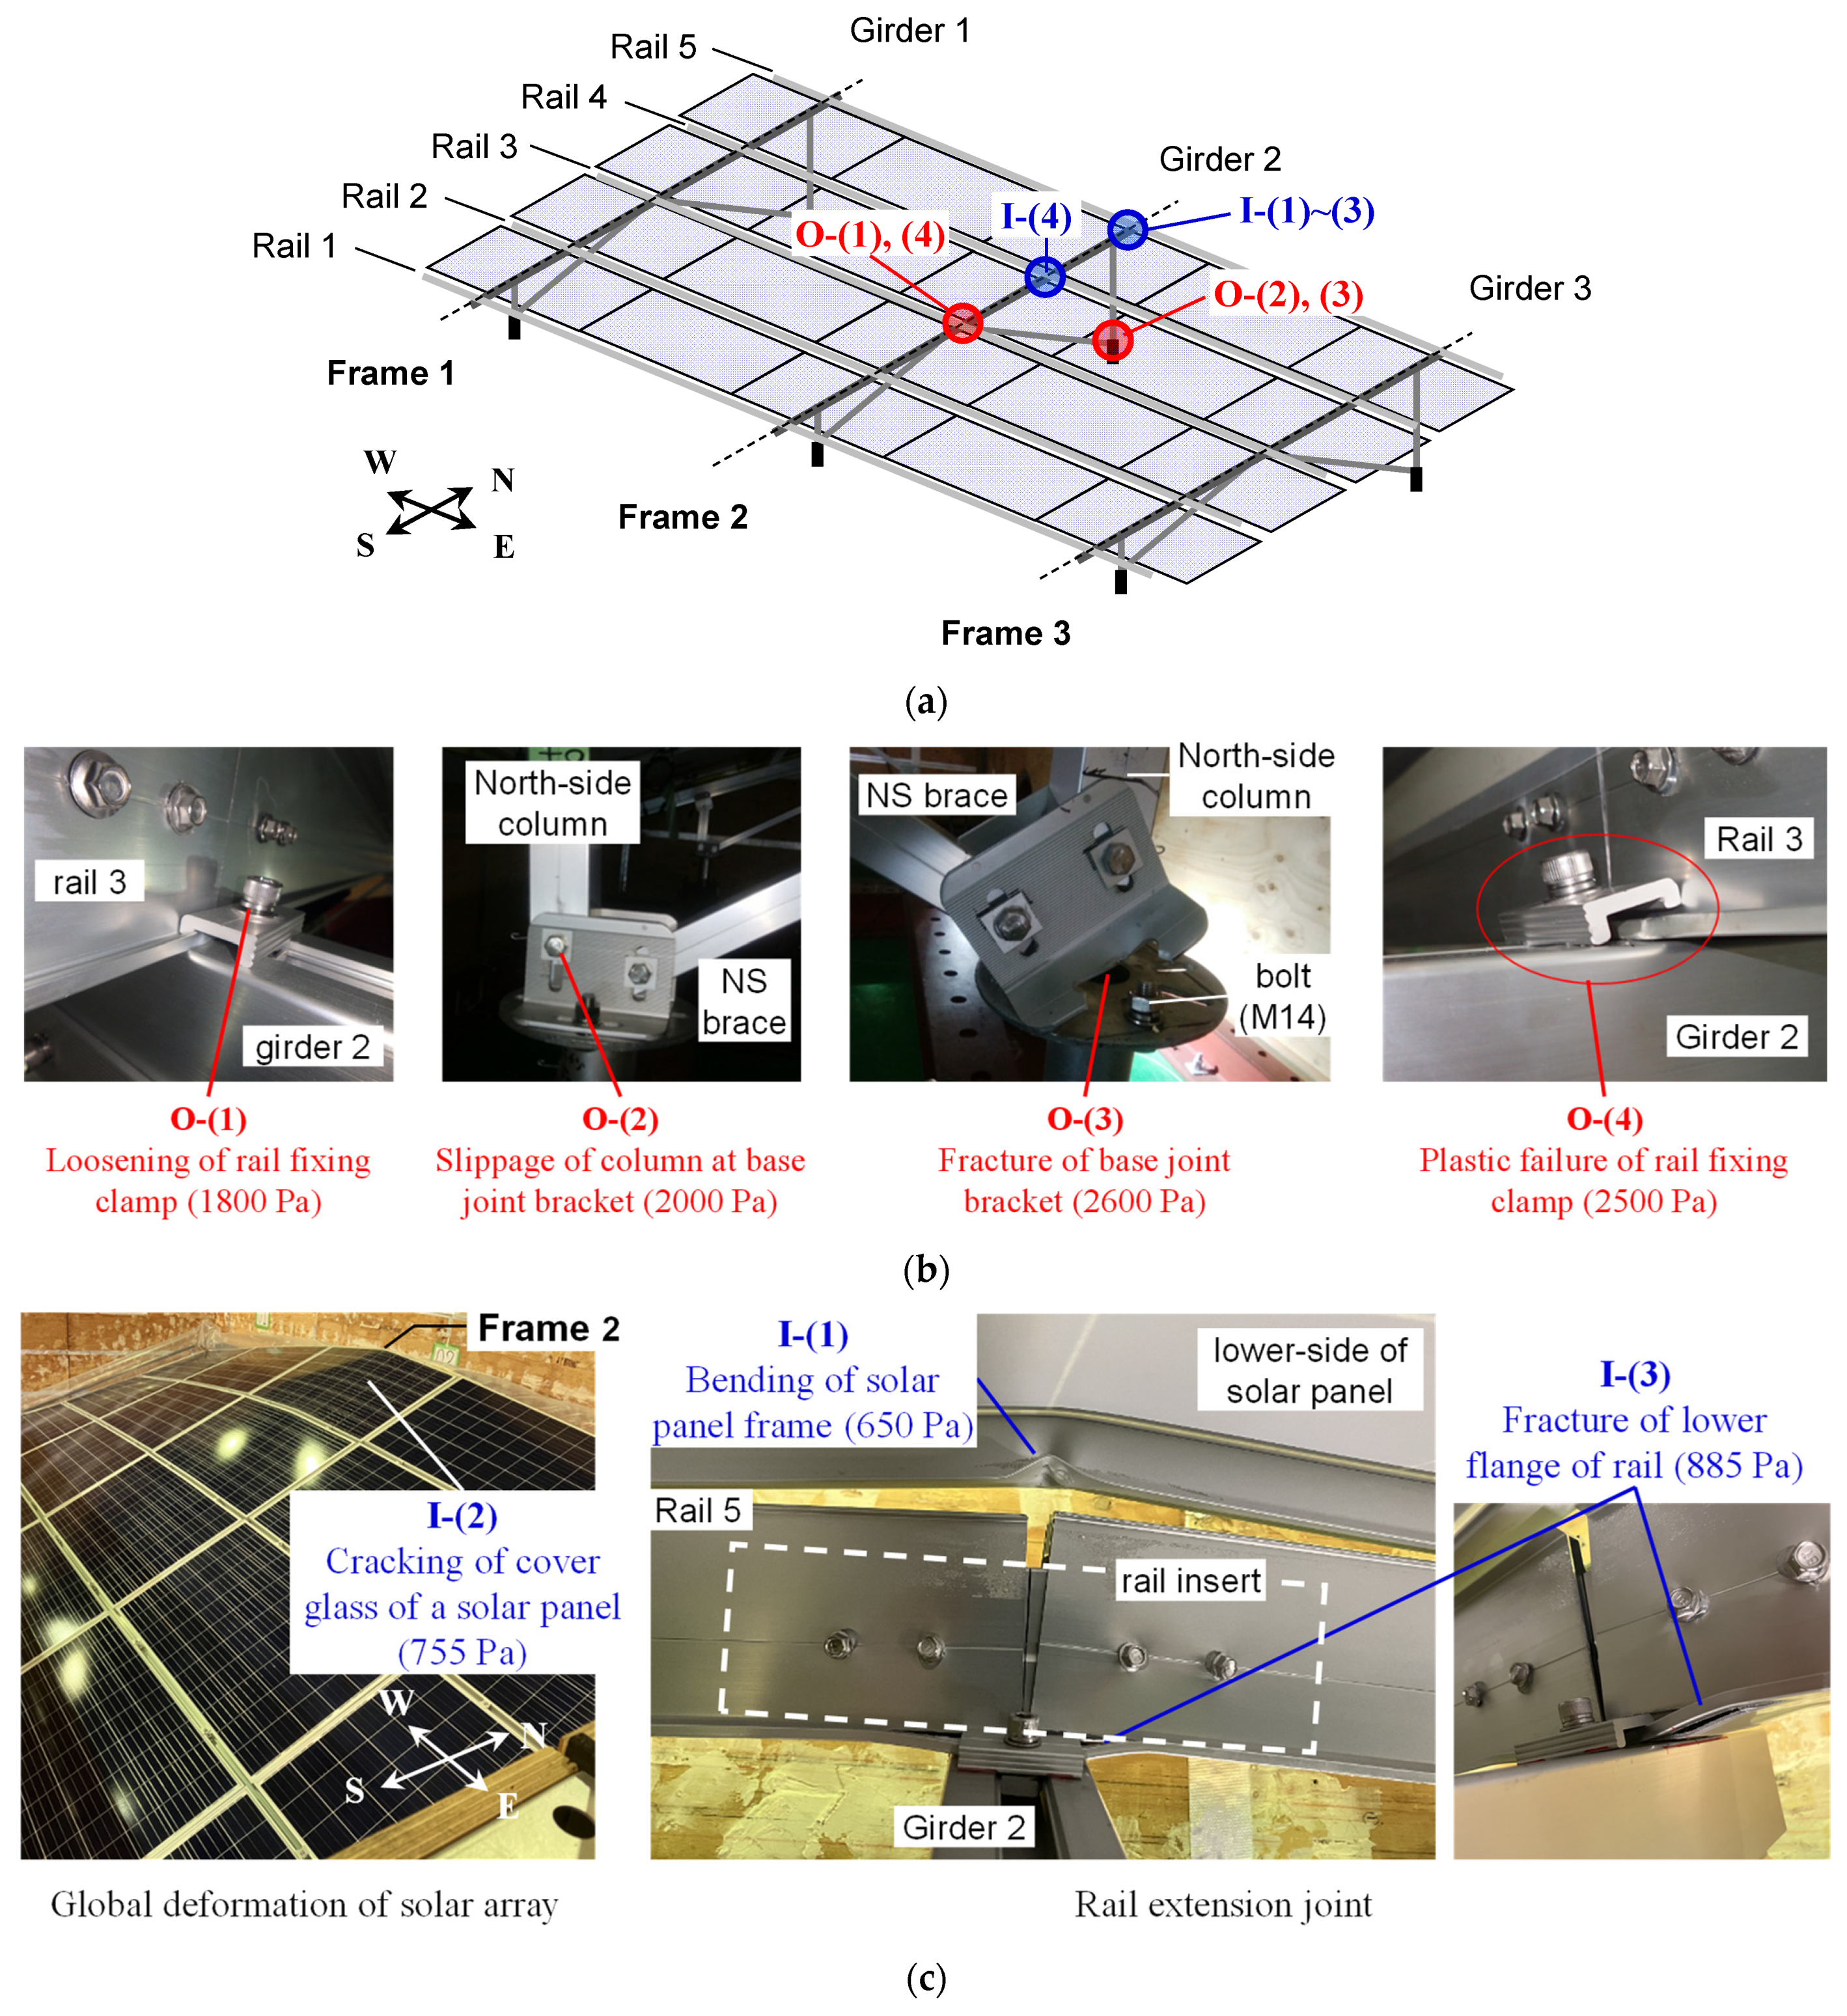
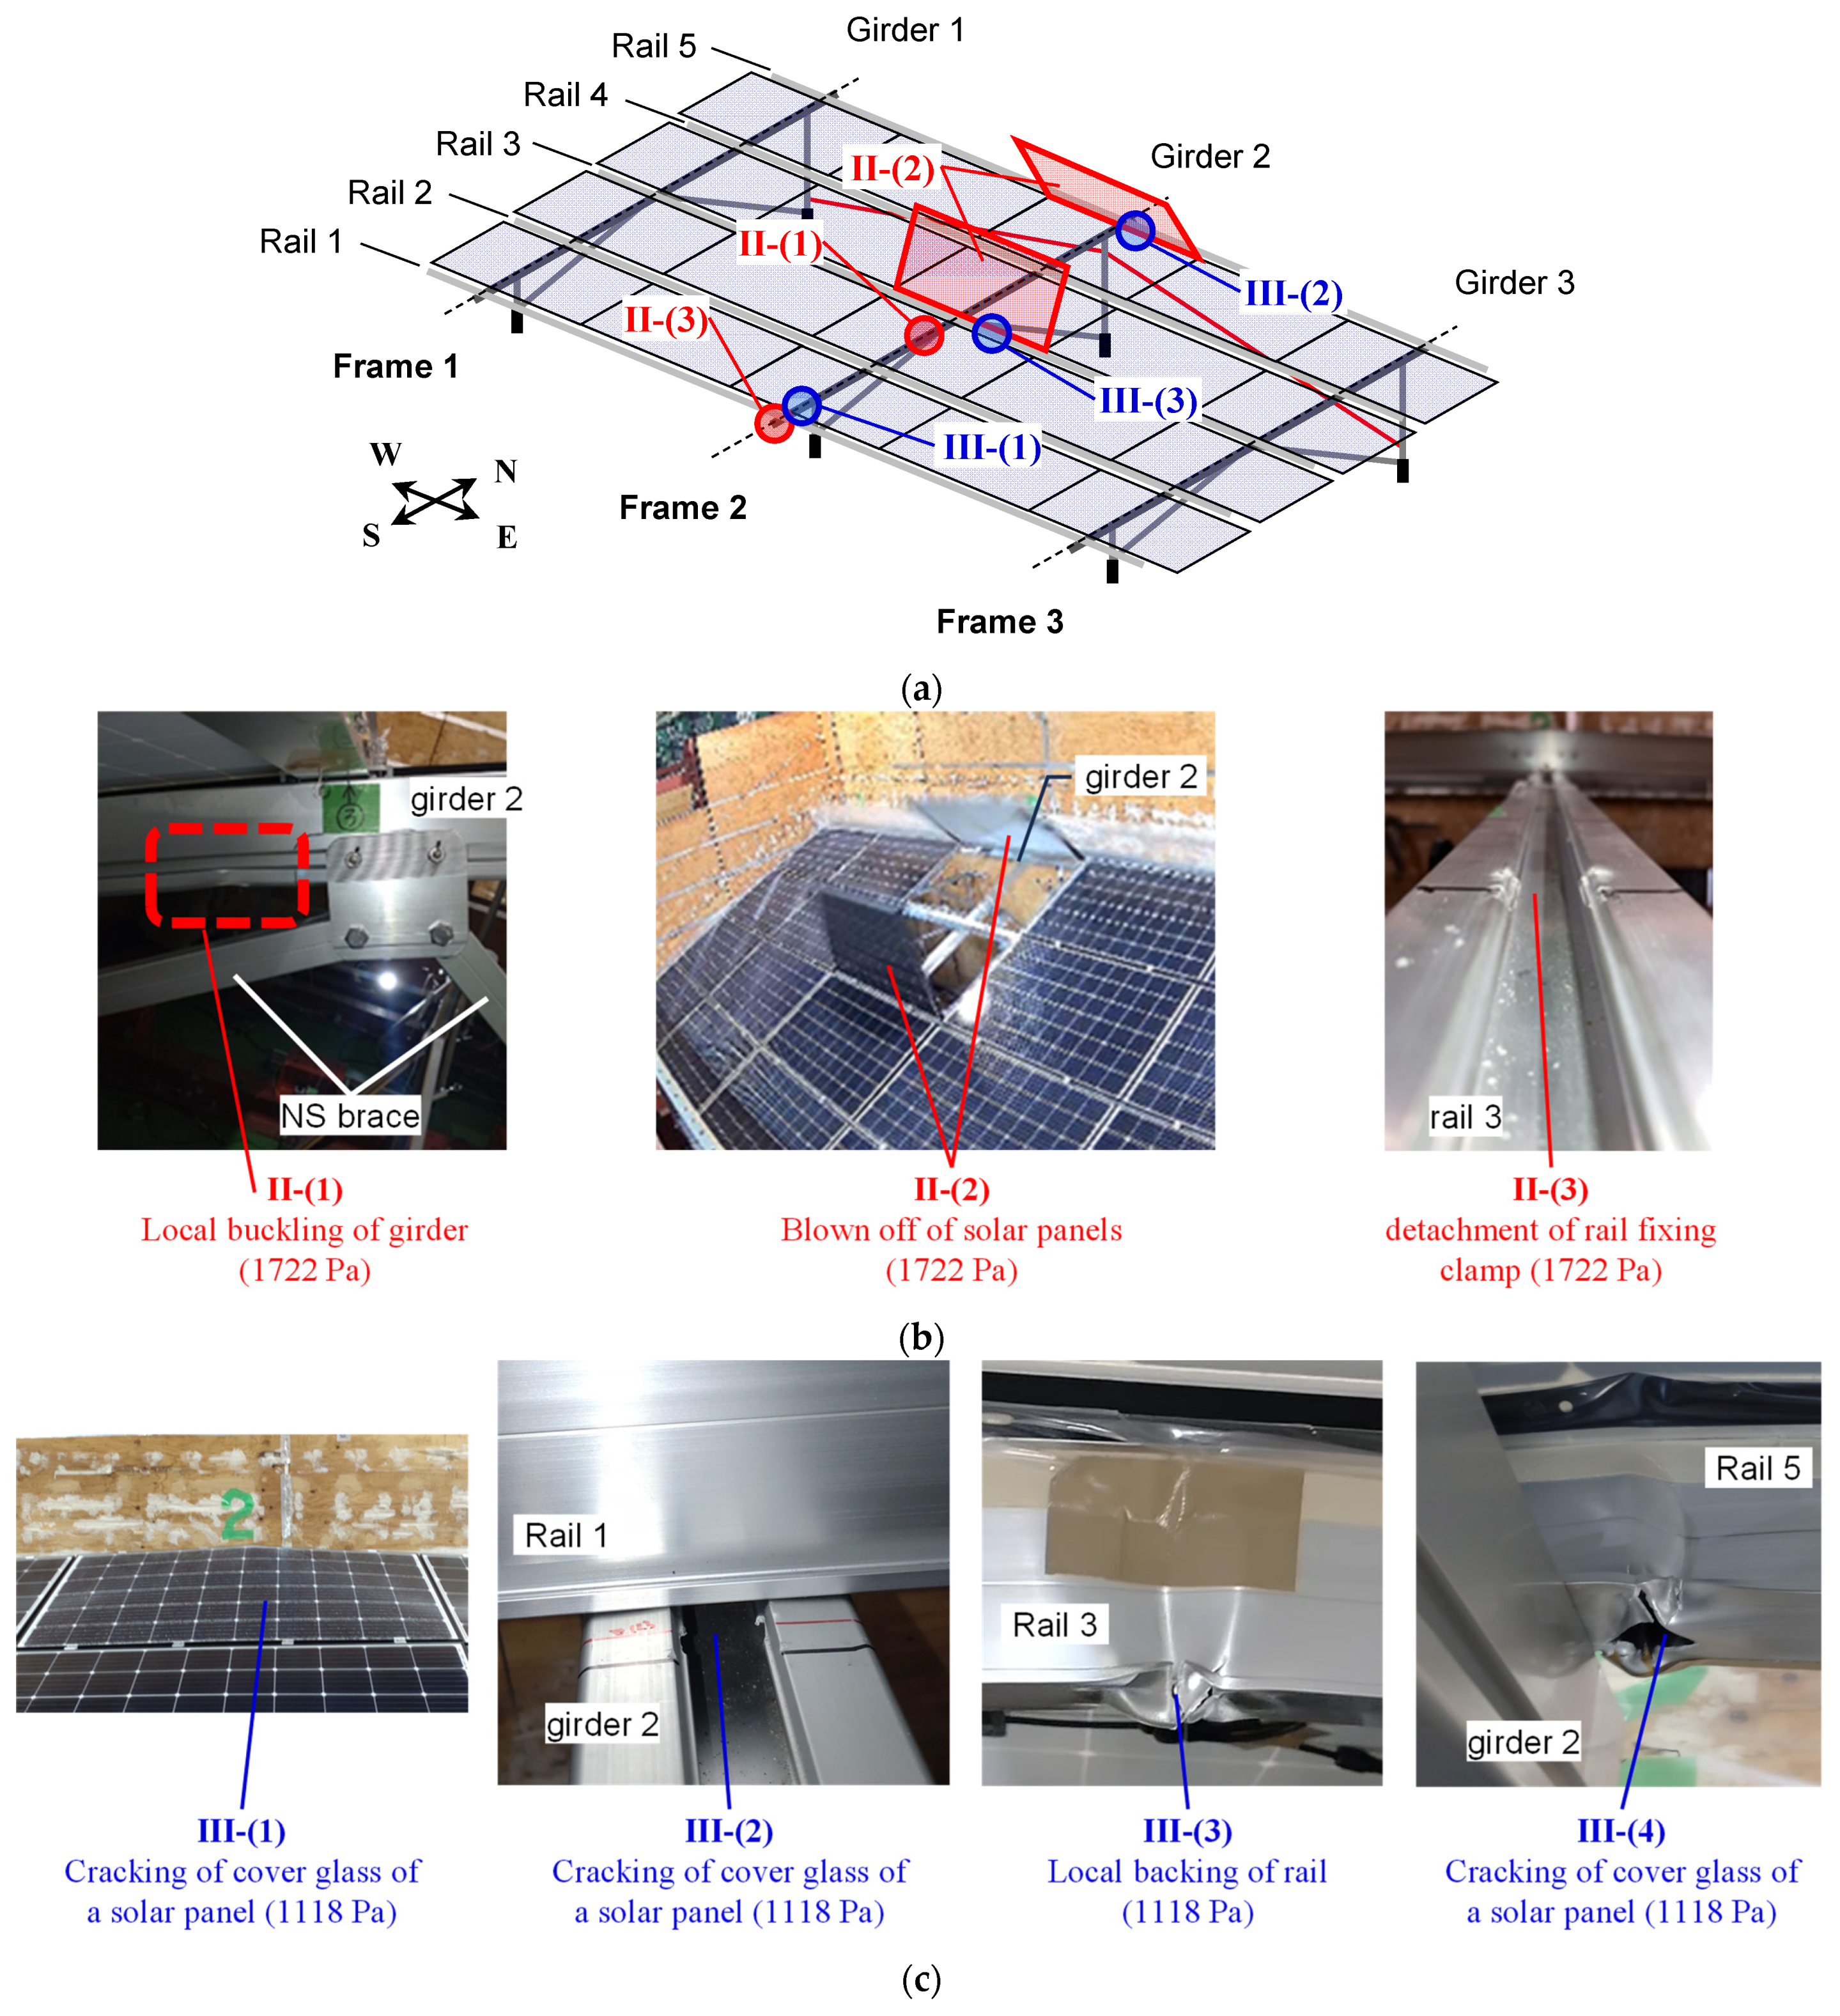
2.2.1. Fracture Behavior of the Solar Panel Mounting Structure
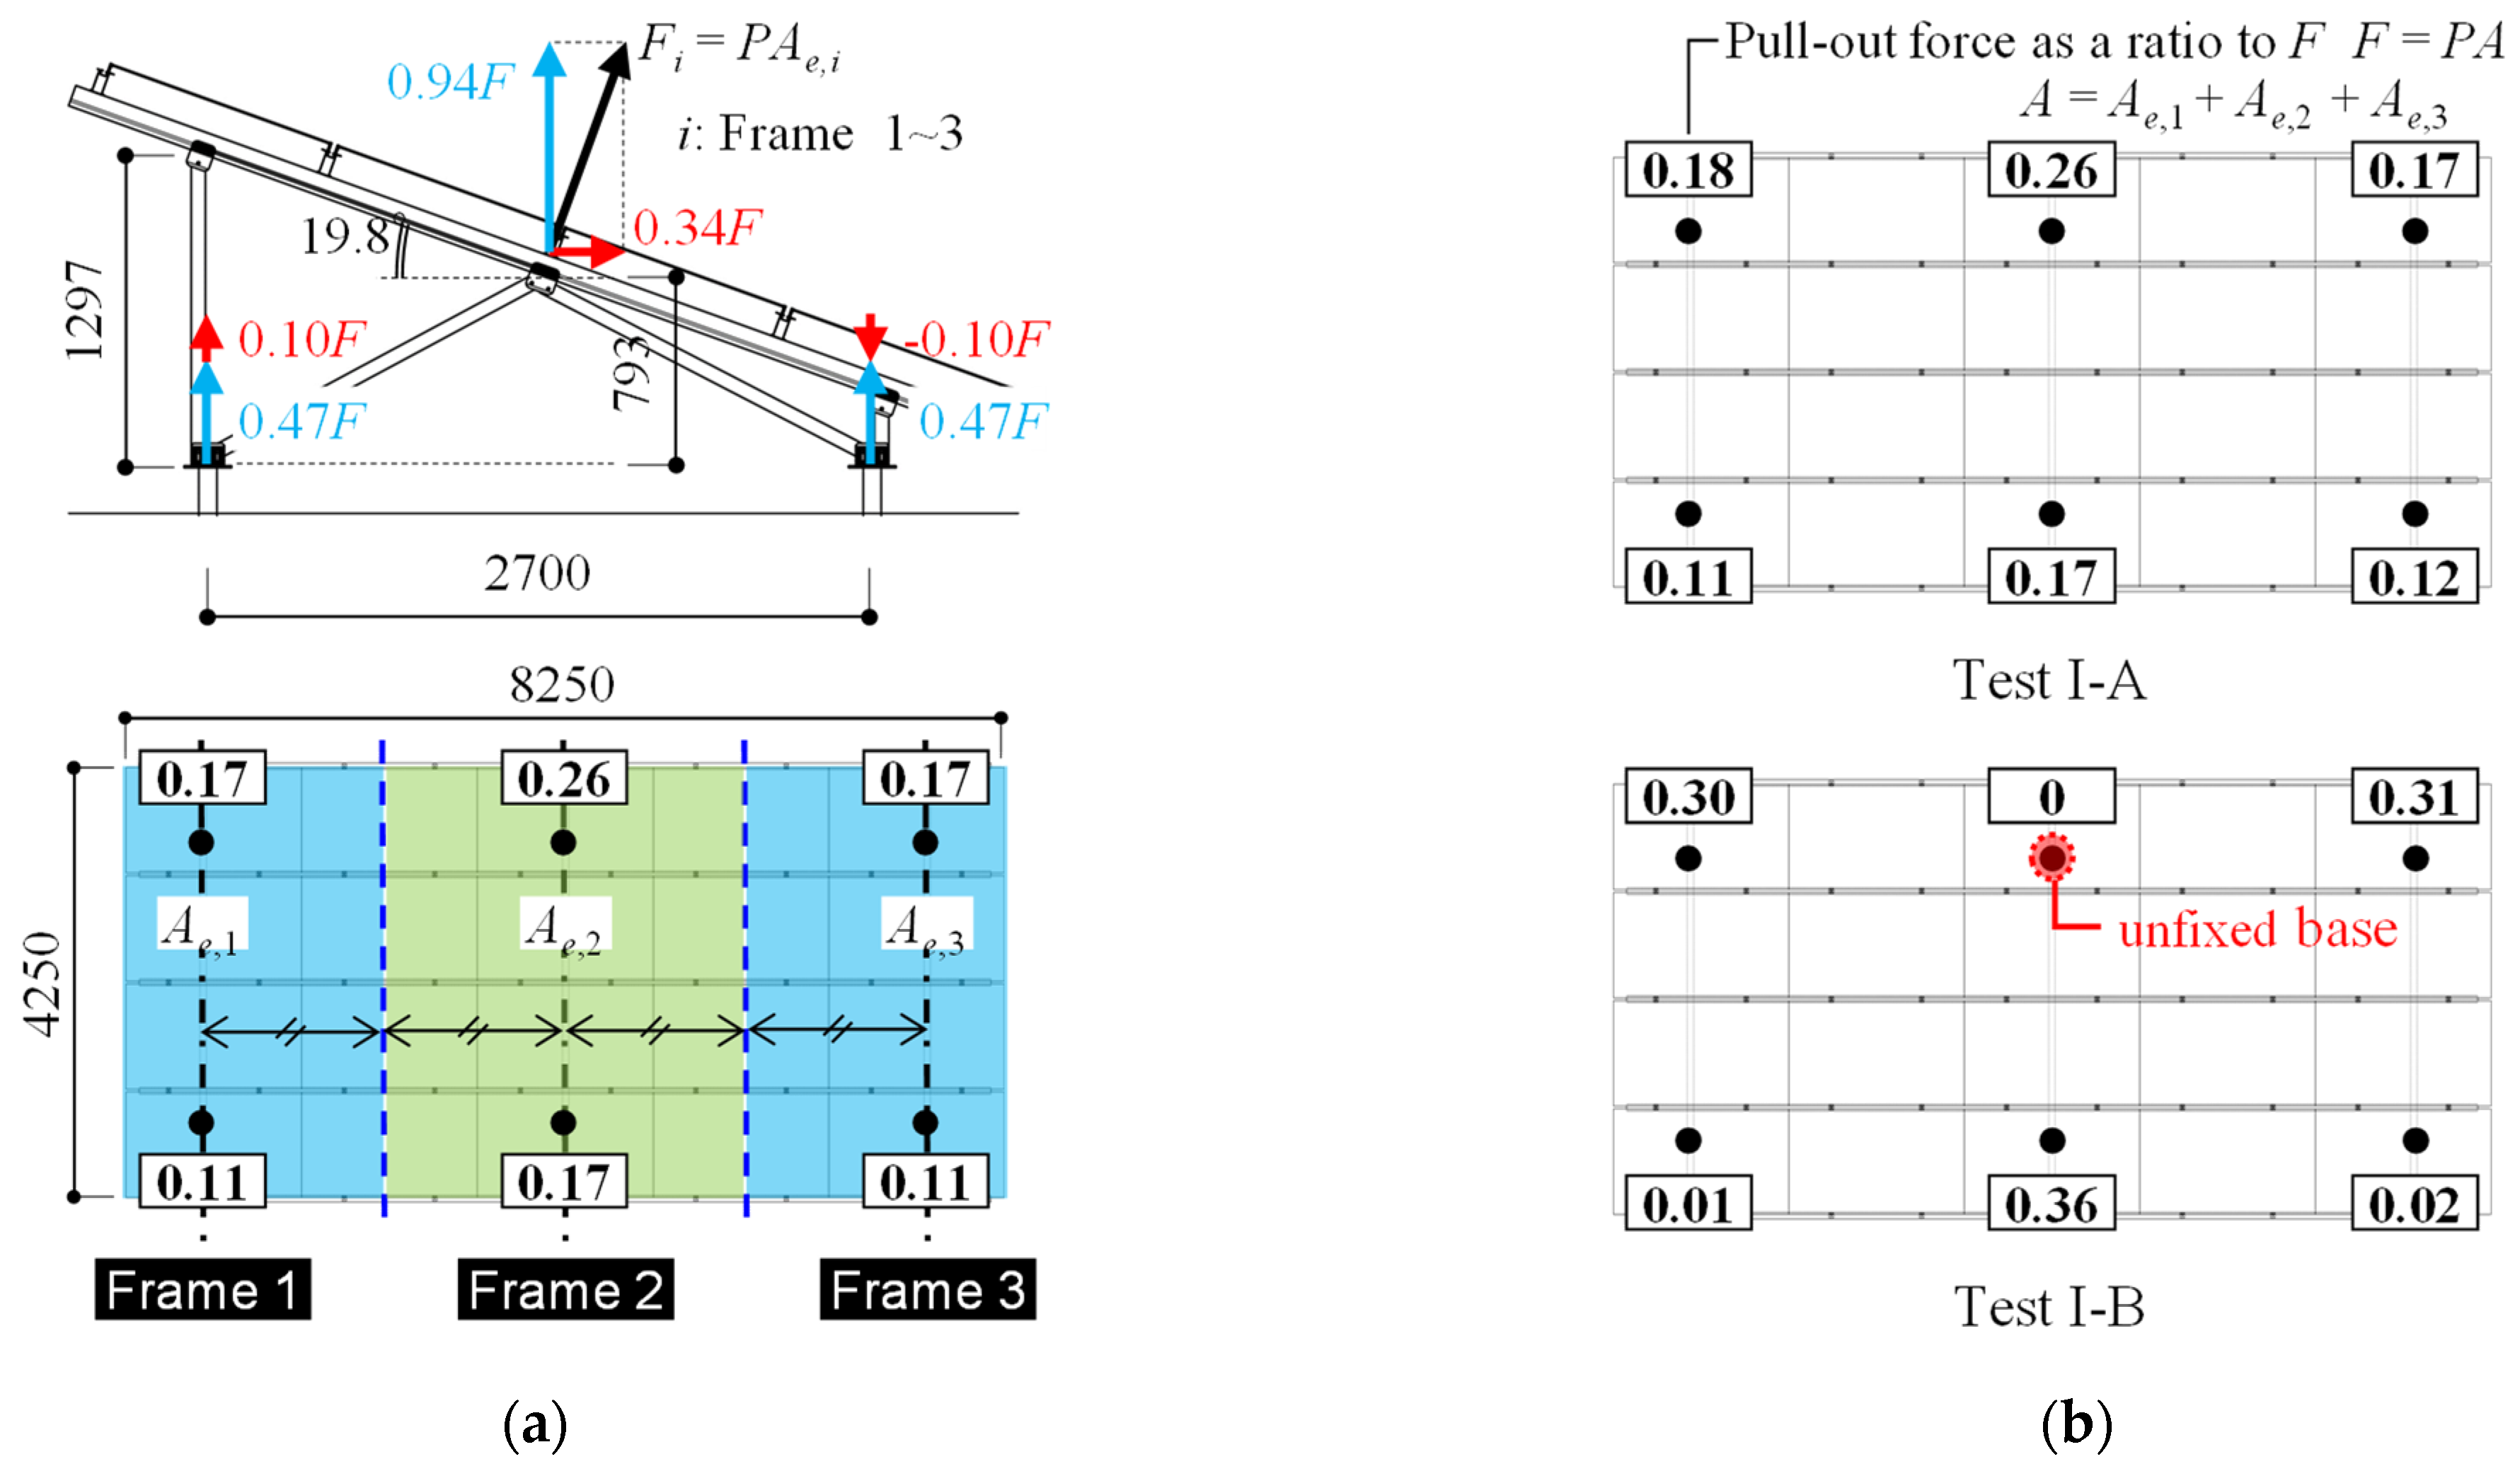
2.2.2. Load Sharing Ratio of Uplift Forces at Each Column Base
2.2.3. Stress Distribution of the Solar Panel Mounting Structure
3. Enhancement of Uplift Pressure Resistance Performance of a Solar Panel Mounting Structure with Foundation Defects
3.1. Four-Point Bending Tests of Rail Members and Rail Extension Joint
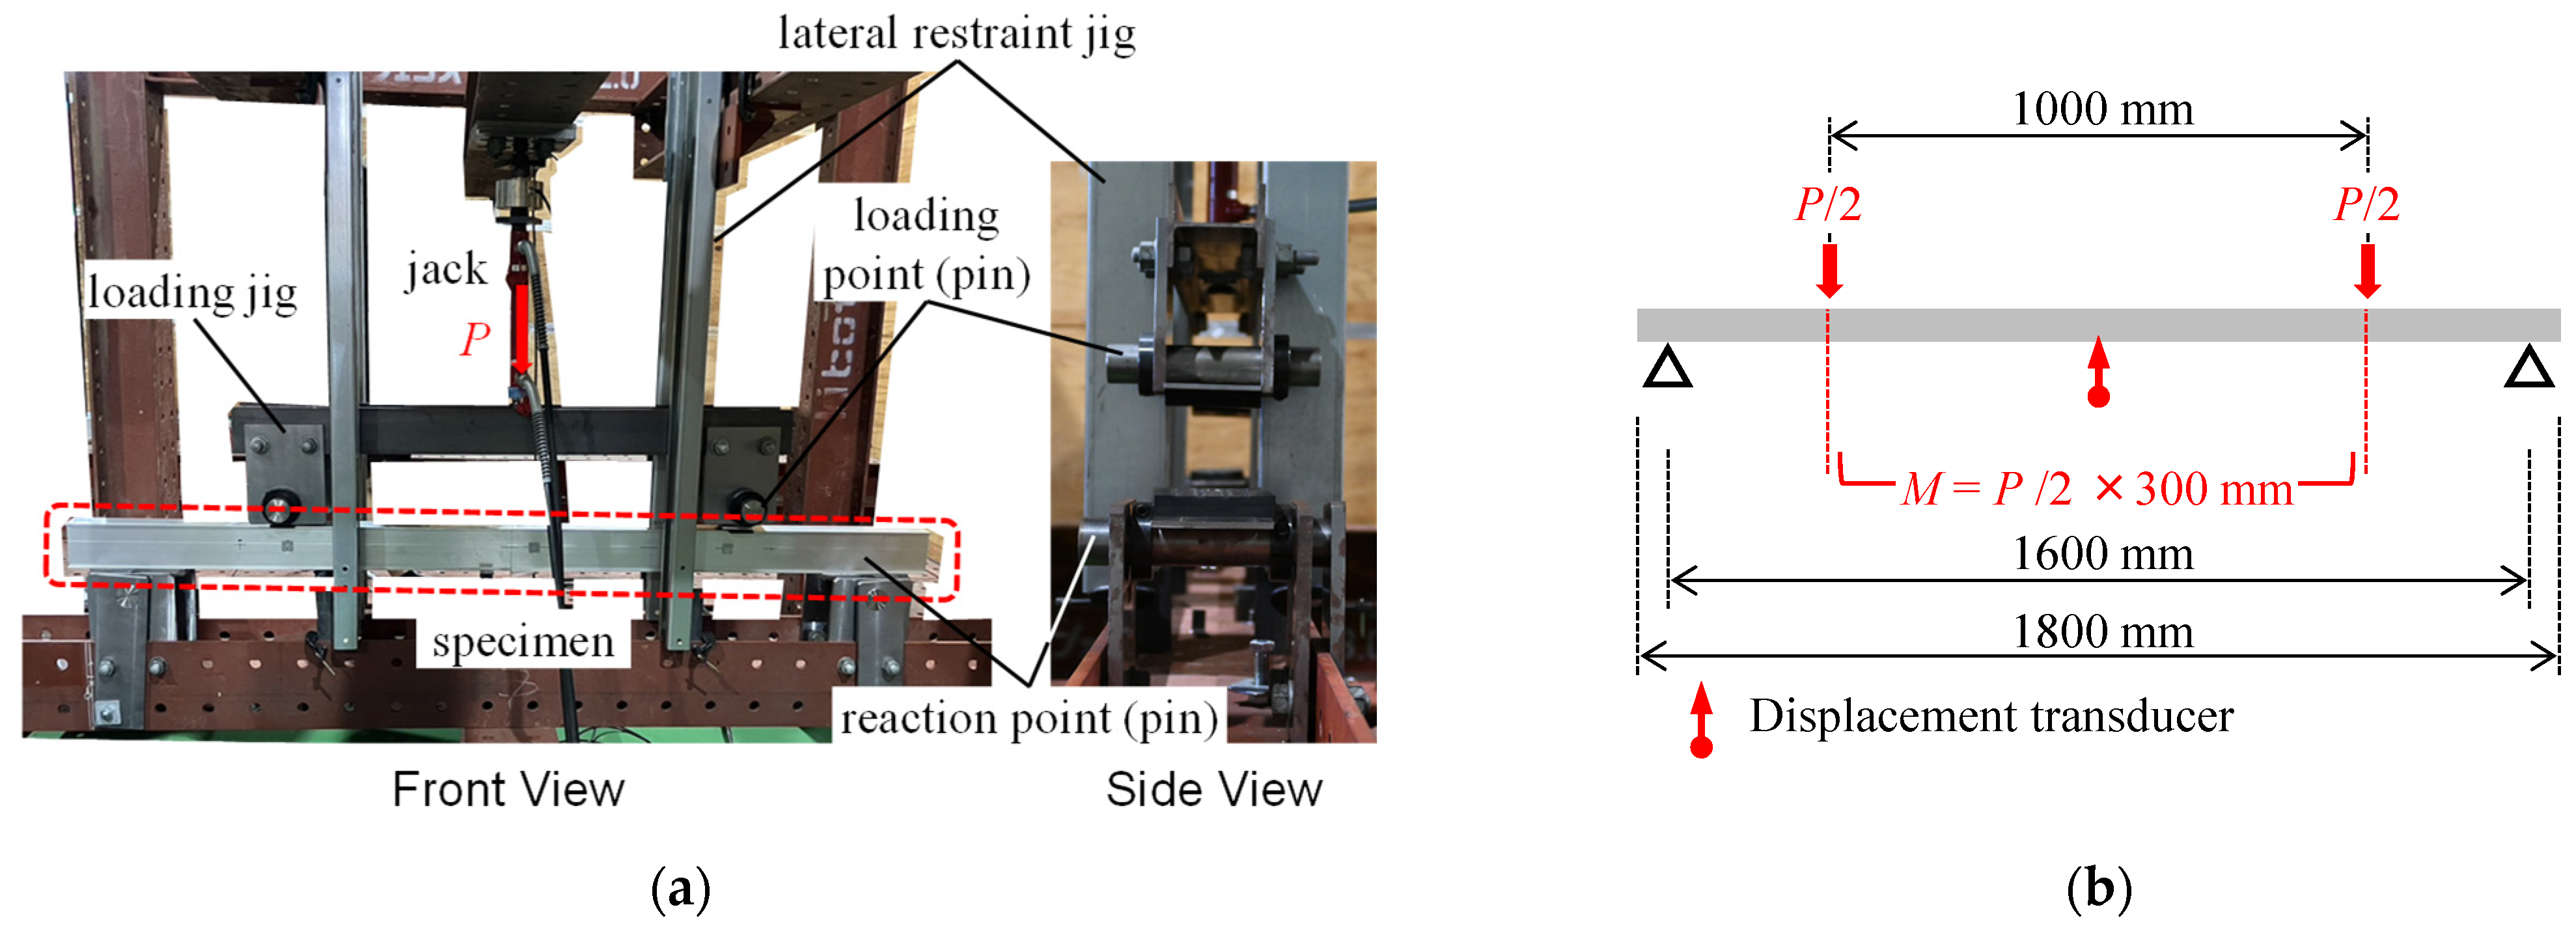
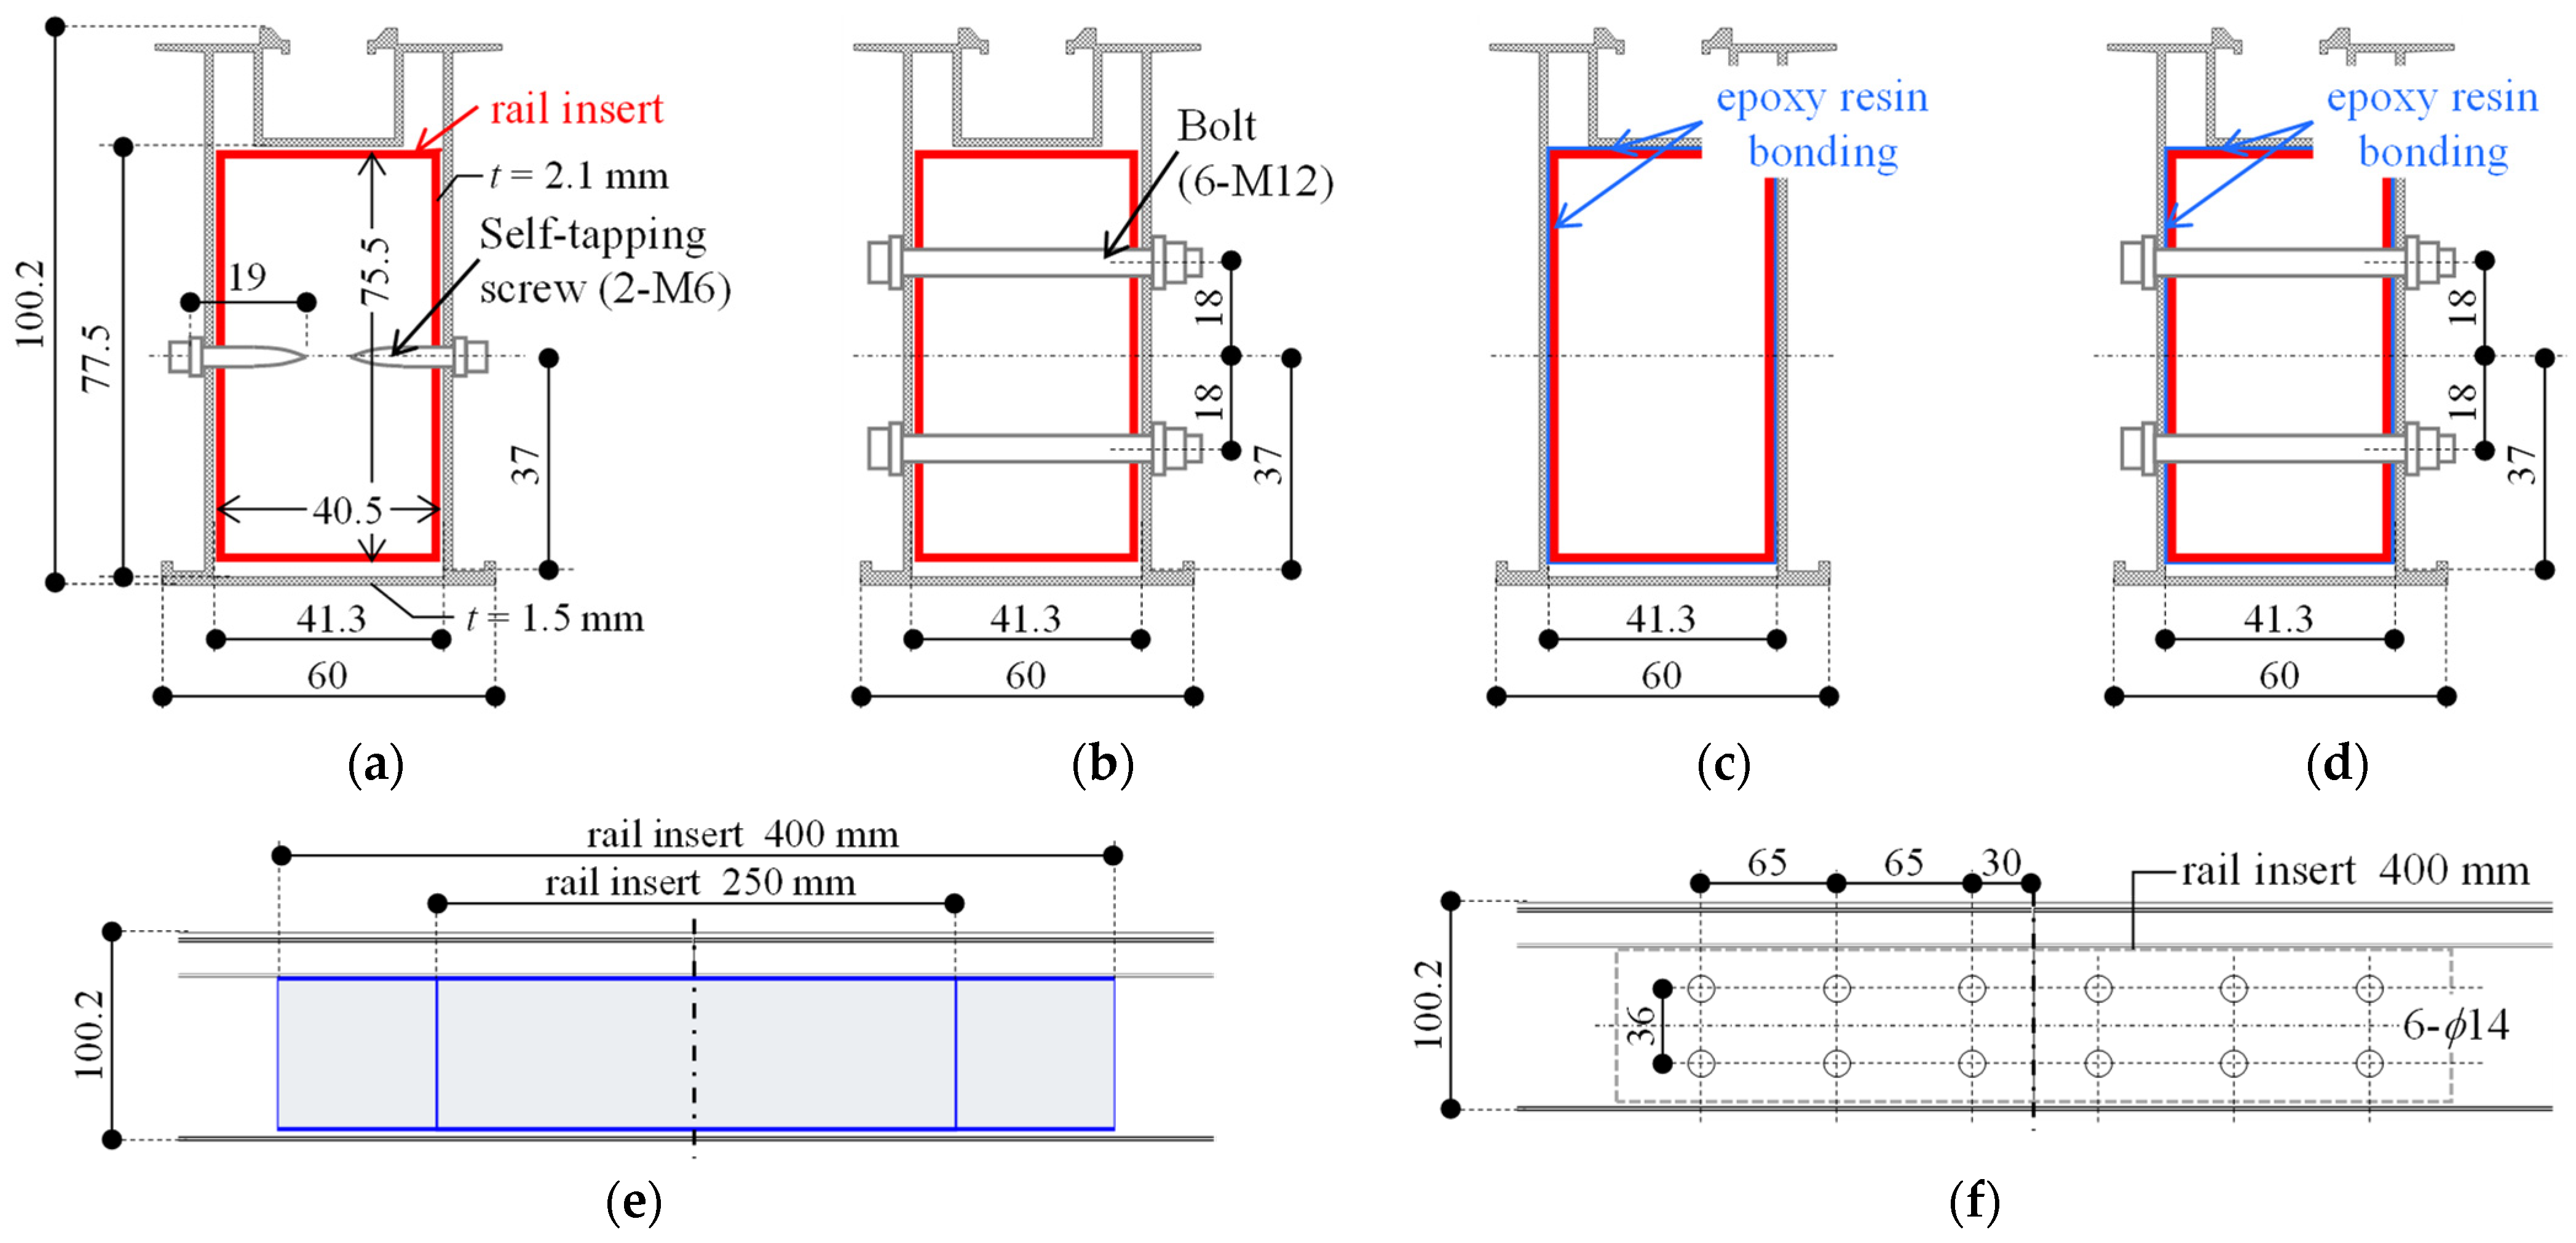
3.1.1. Test Setup of Four-Point Bending Tests
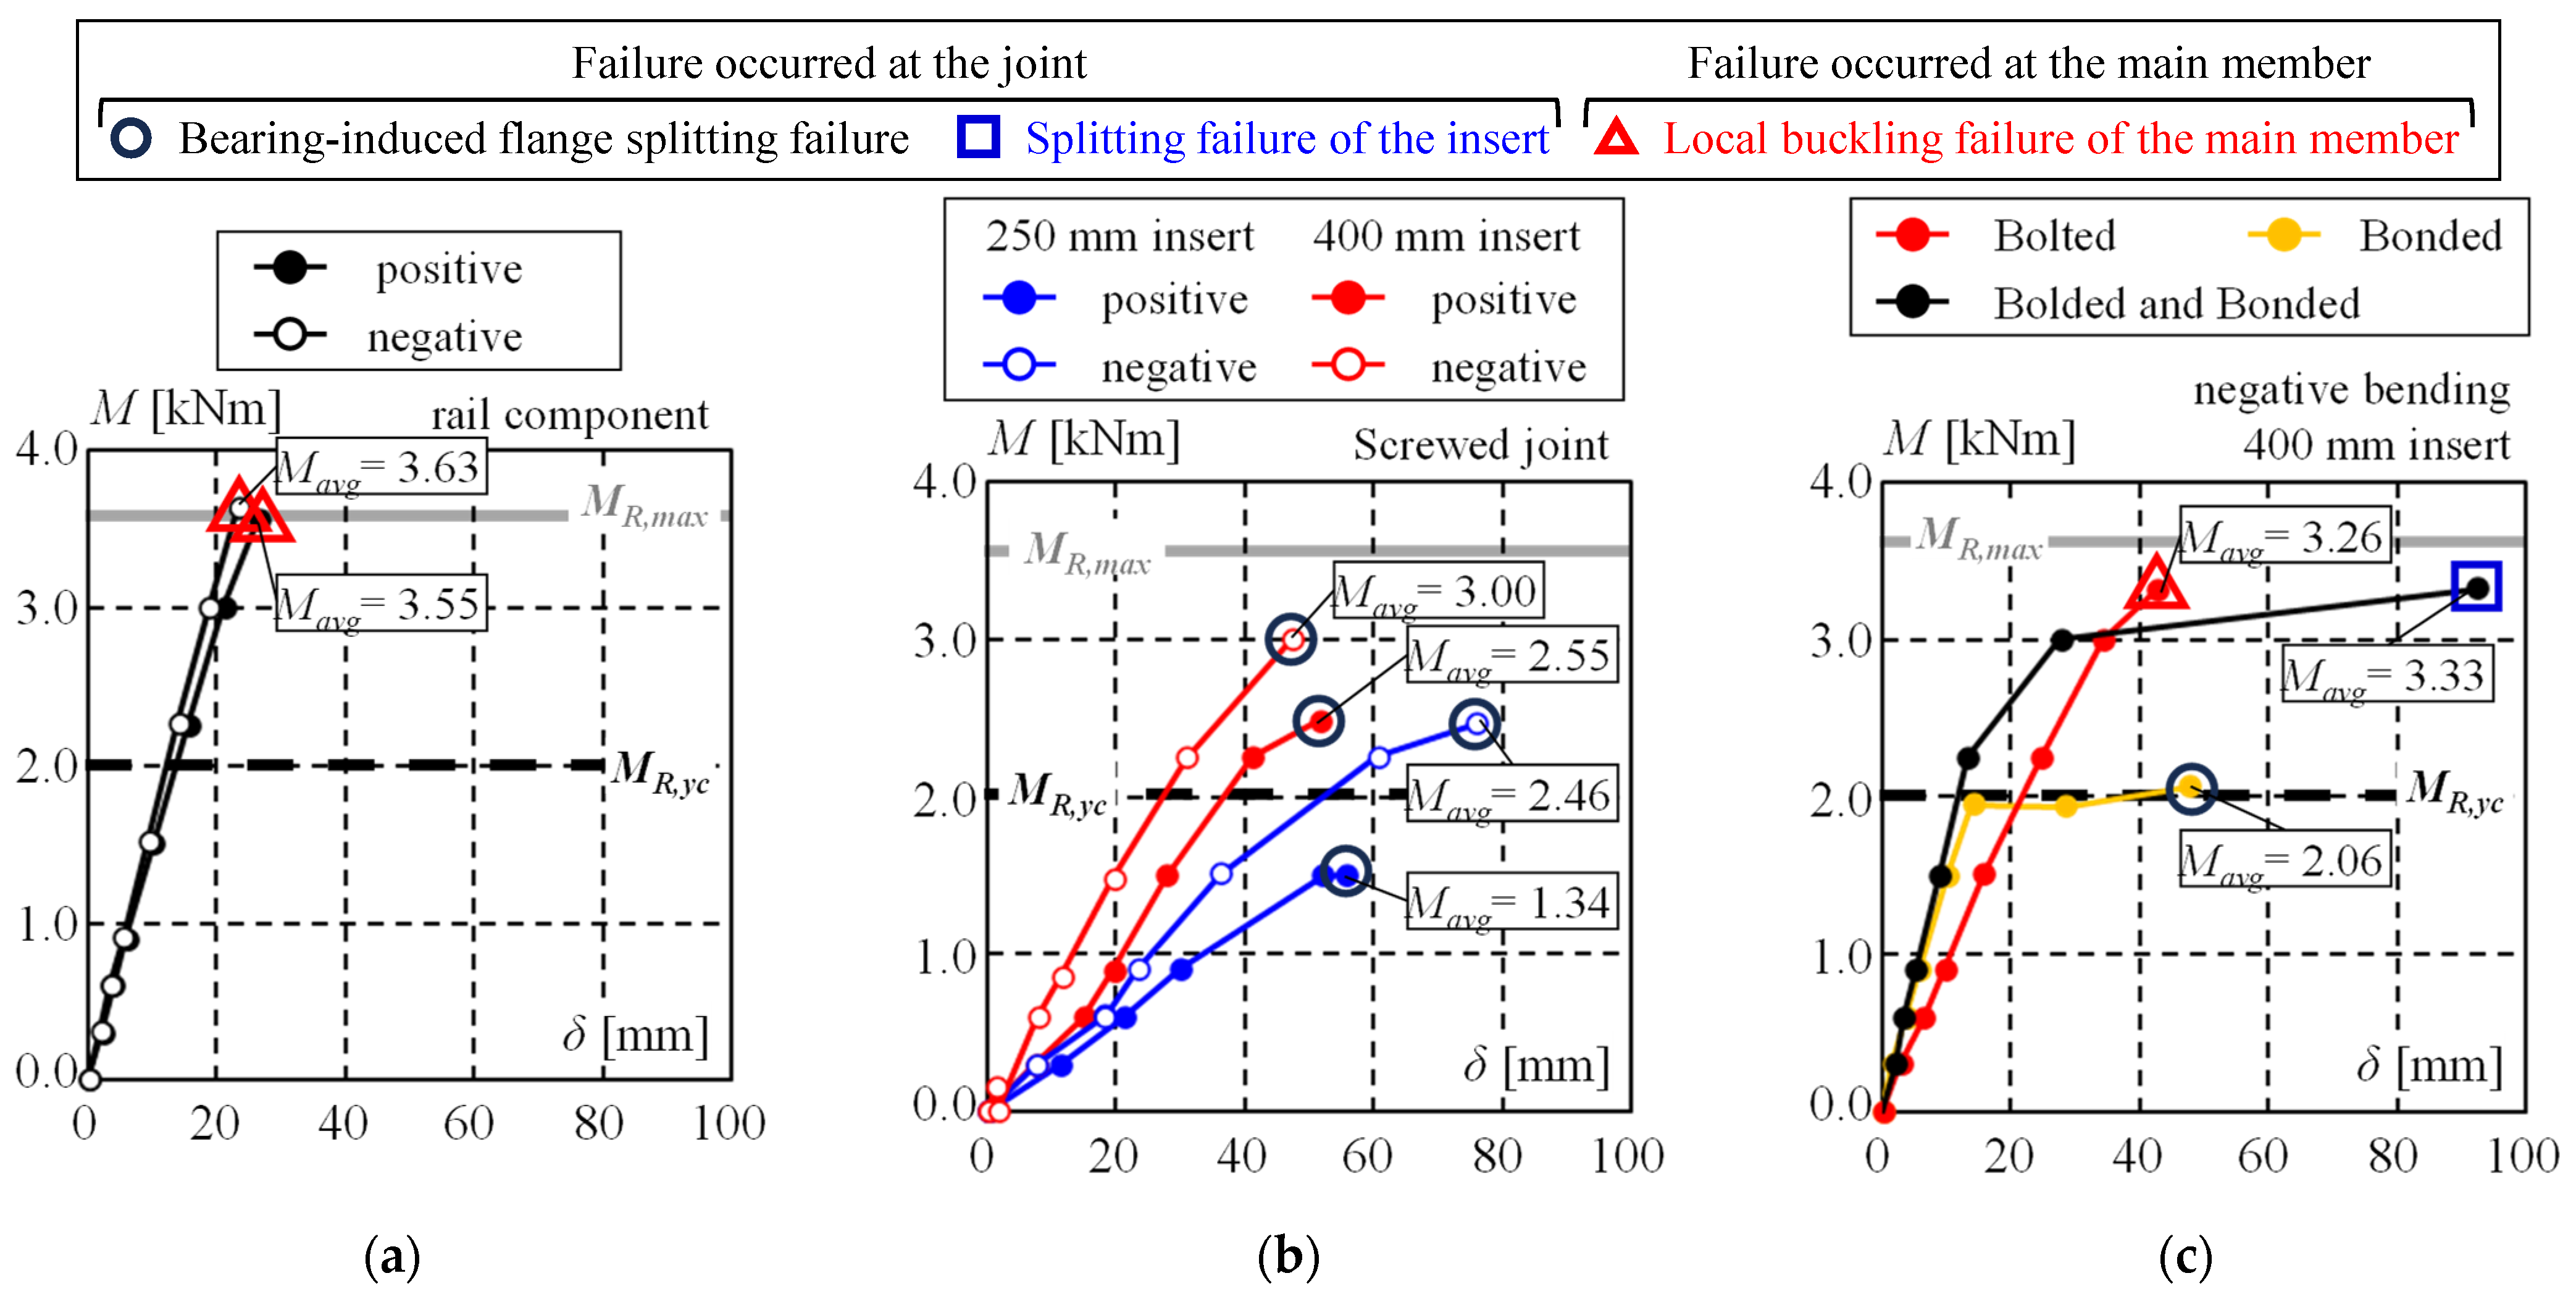
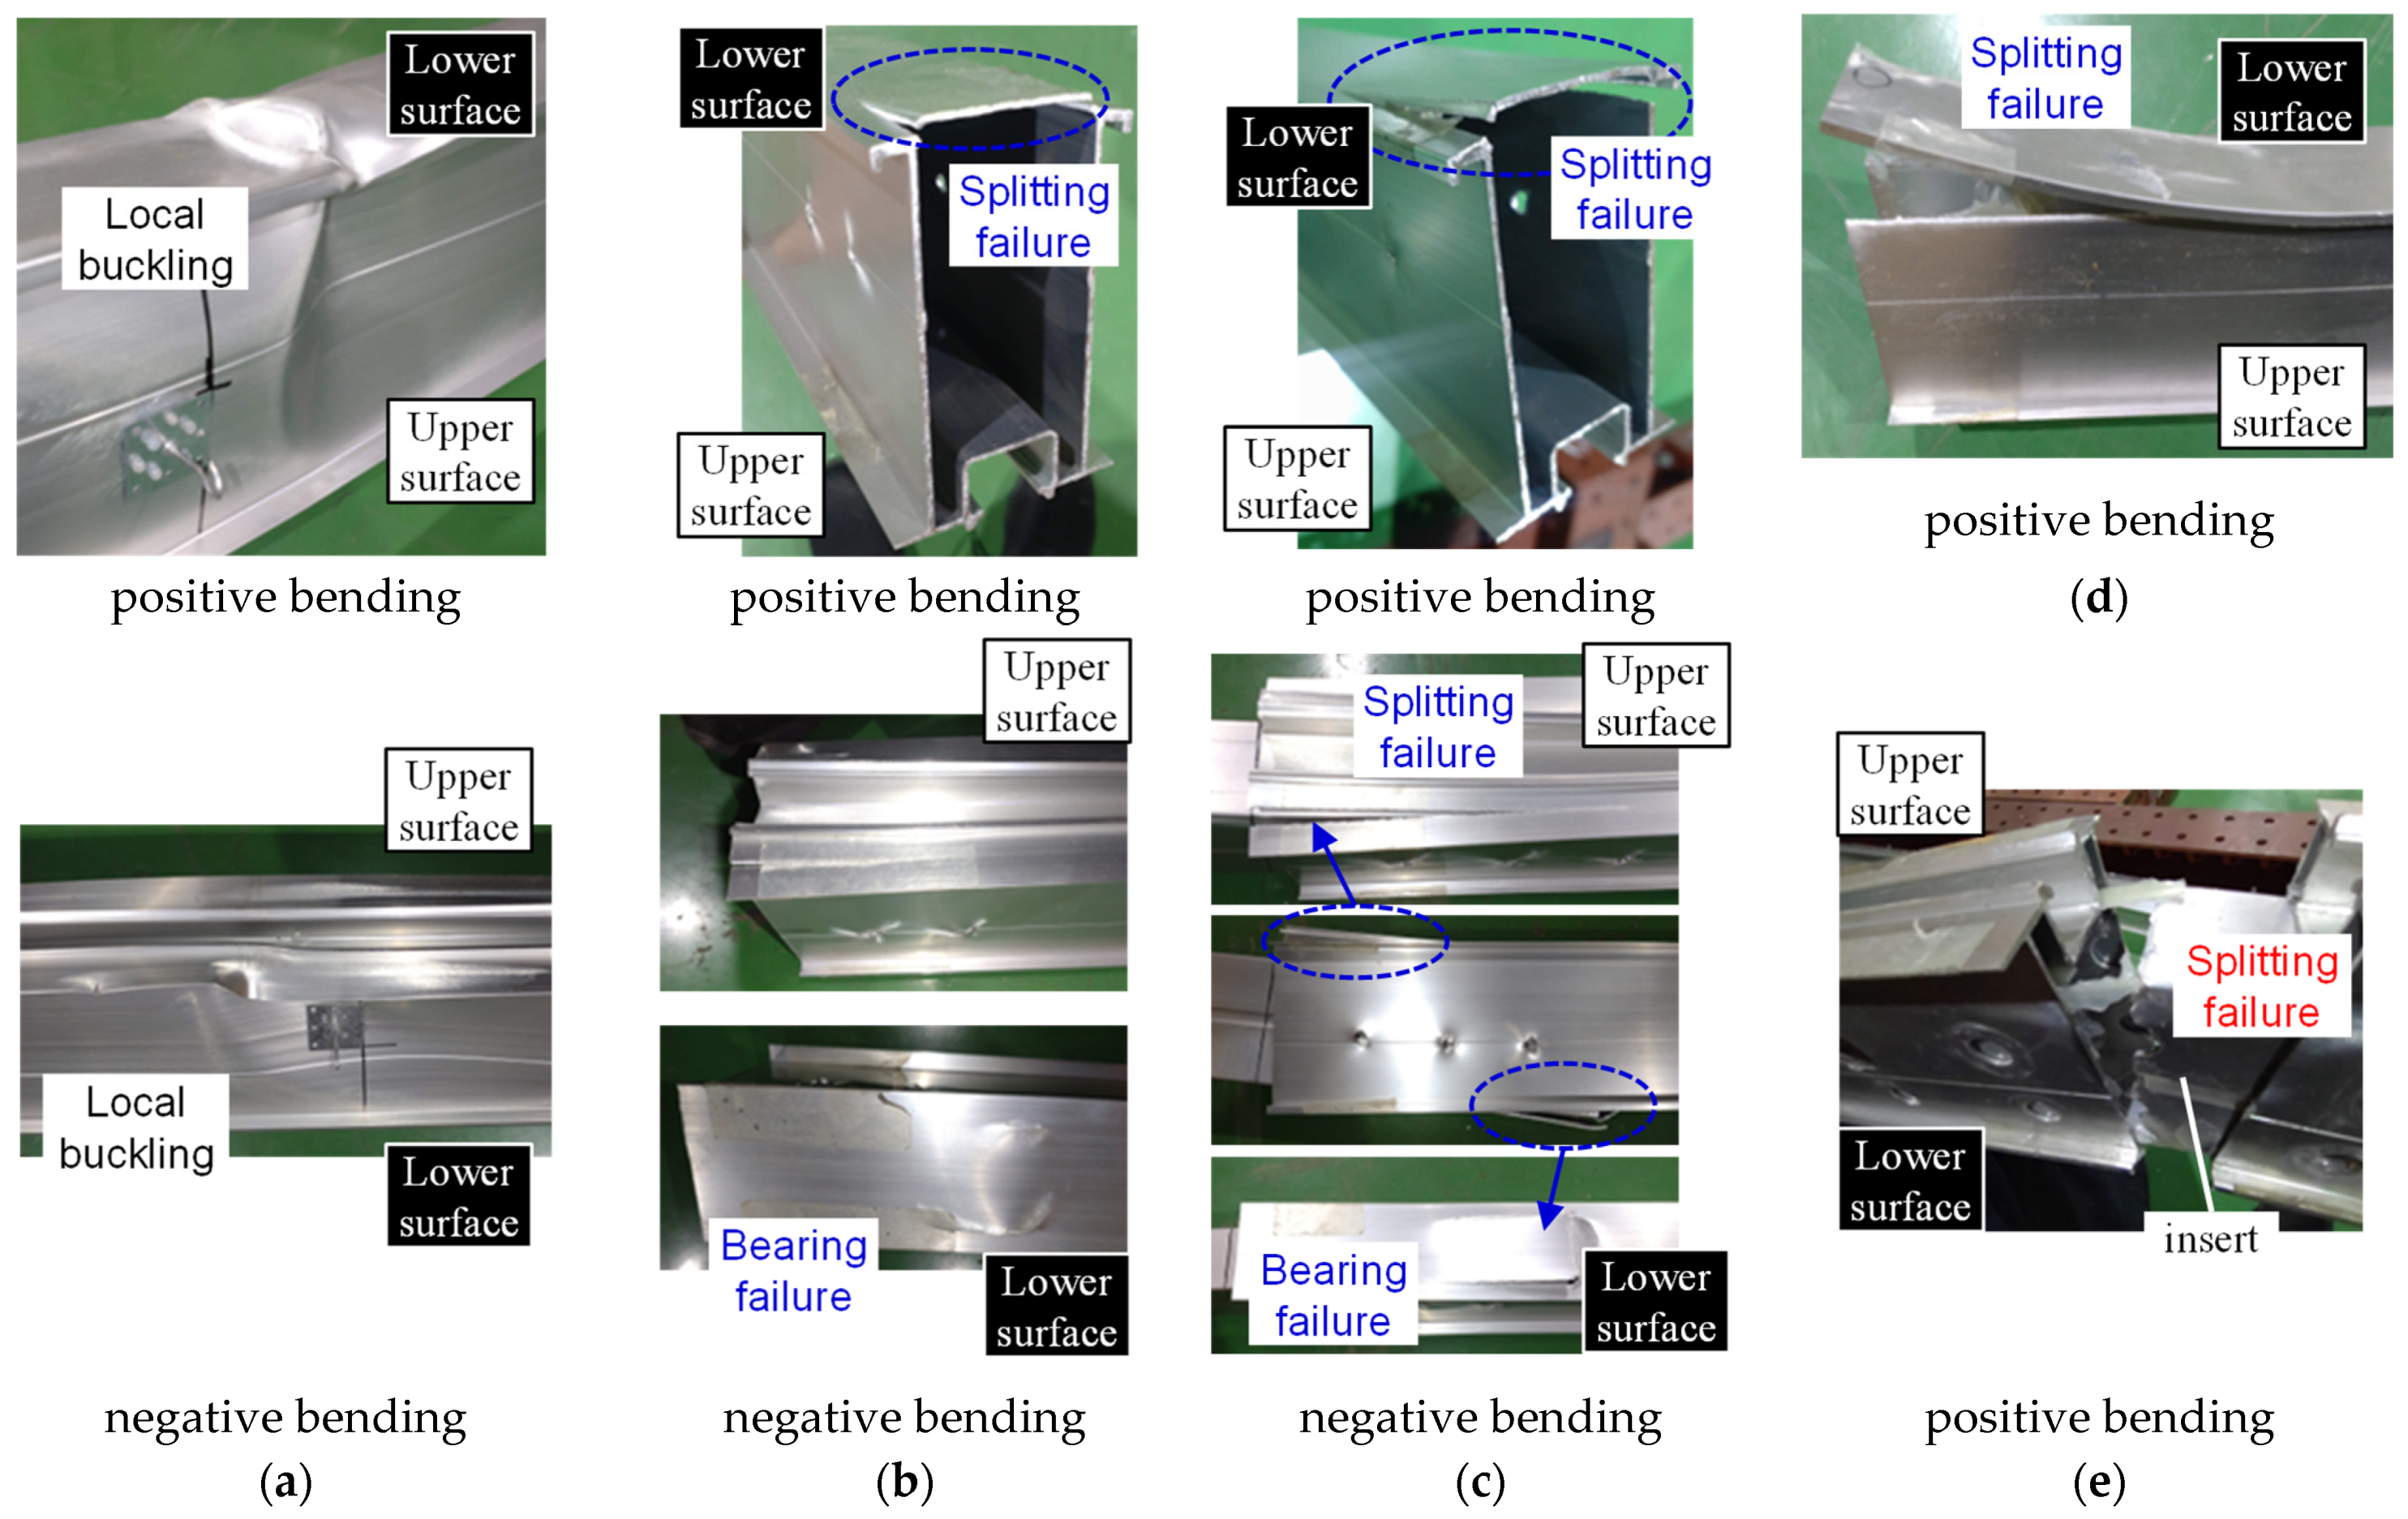
3.1.2. Fracture Behavior and Flexural Strength of Extension Joint
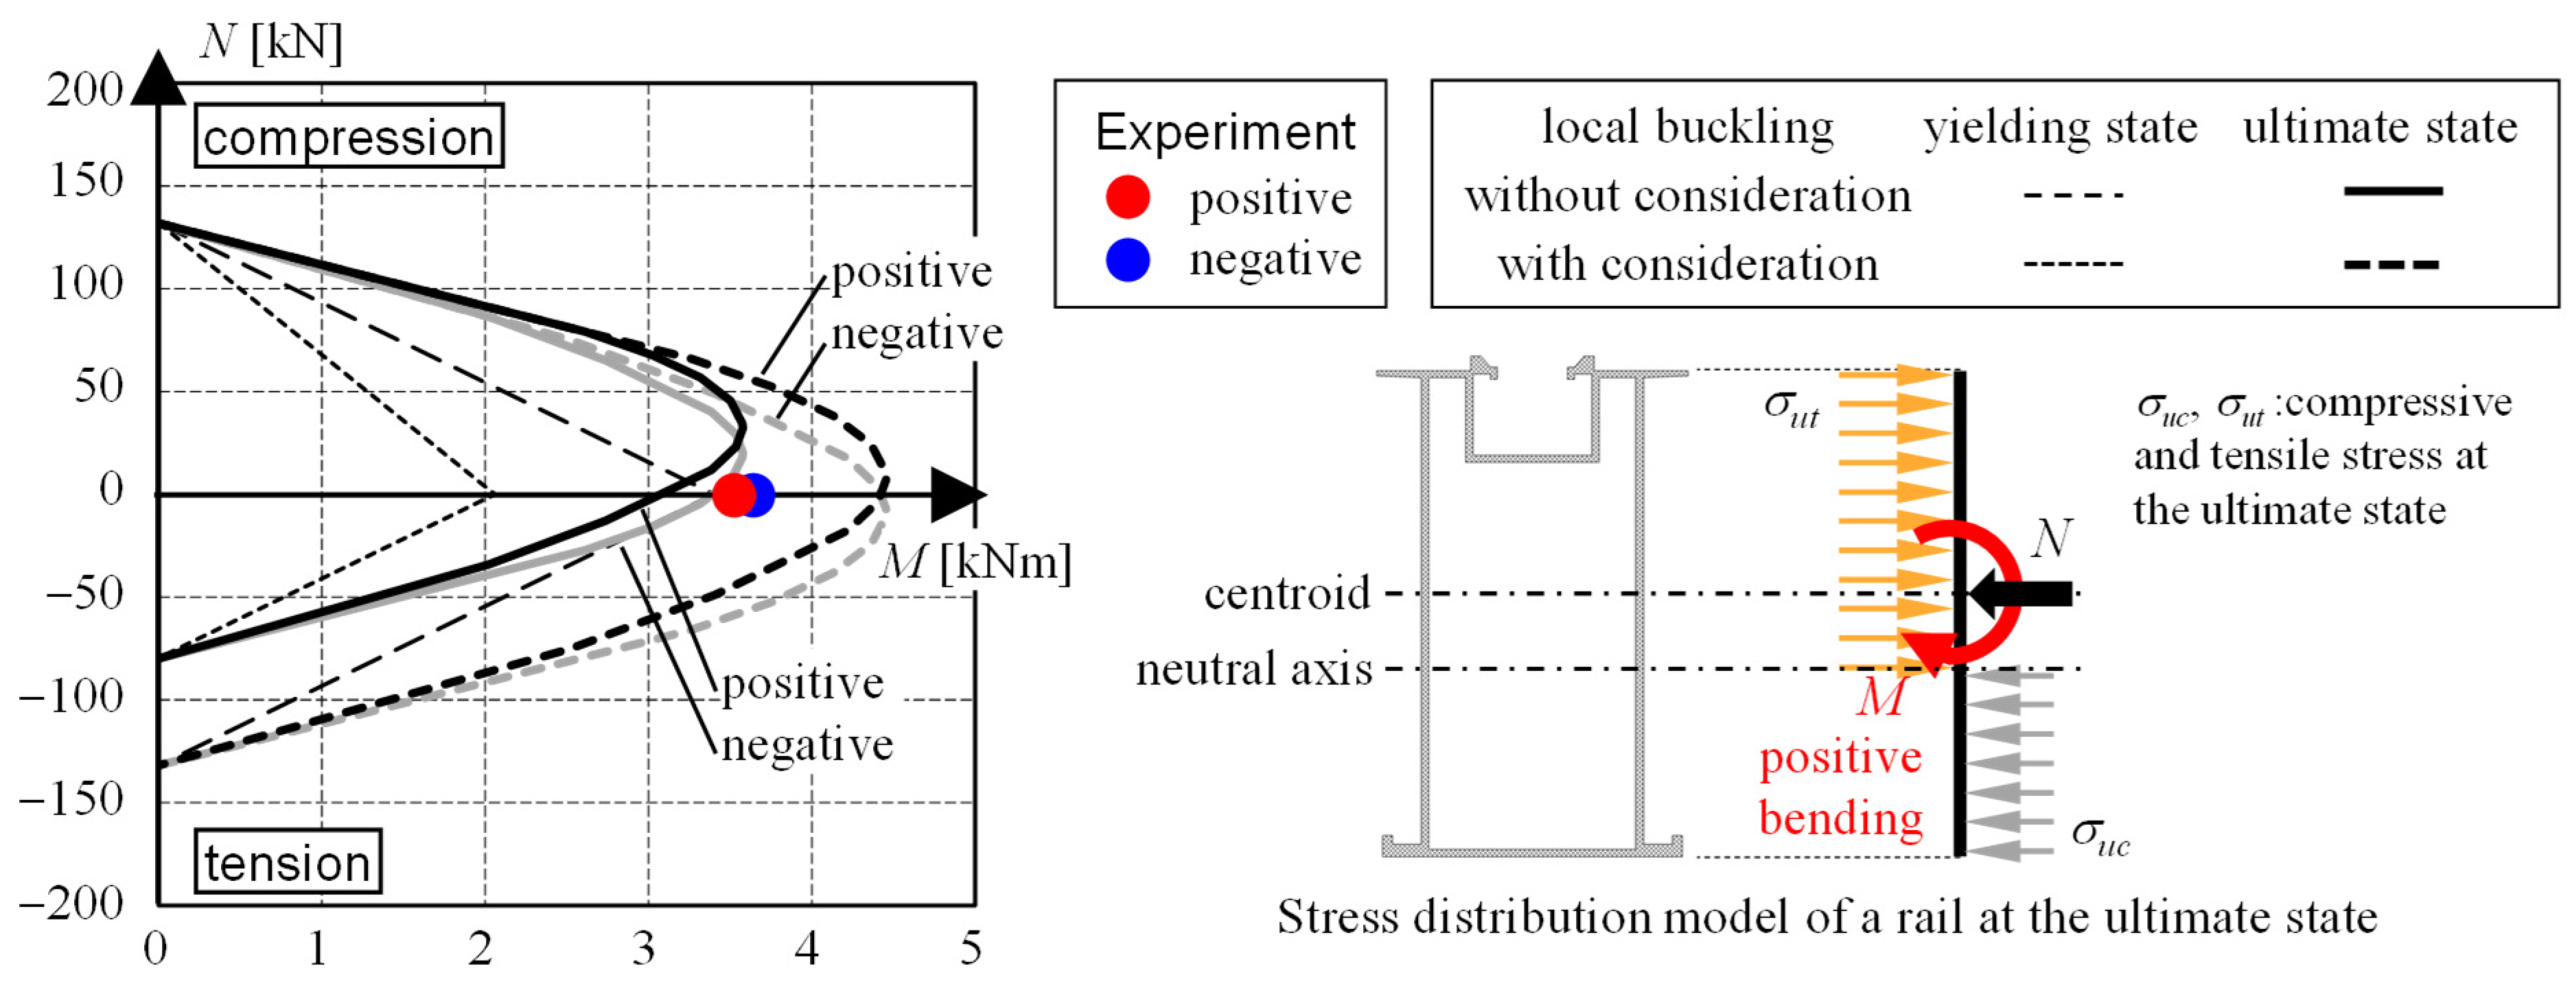
3.1.3. Flexural Strength Evaluation of Rails
- fc: Compressive strength
- Zr: Sectional modulus of the rail
| Without Consideration of Local Buckling | With Consideration of Local Buckling (Two-Edge Supported Plate Without Weld-Induced Softening Zone [24]) | ||||
| (2) | (a) | (3-1) | |||
| (b) | (3-2) | ||||
| (c) | (3-3) | ||||
- Ar: Sectional area of the rail
- Nr, Mr: Axial force and bending moment acting on the rail, respectively
3.2. Test Setup of Full-Scale Pressure Loading Test with Improvement Measures
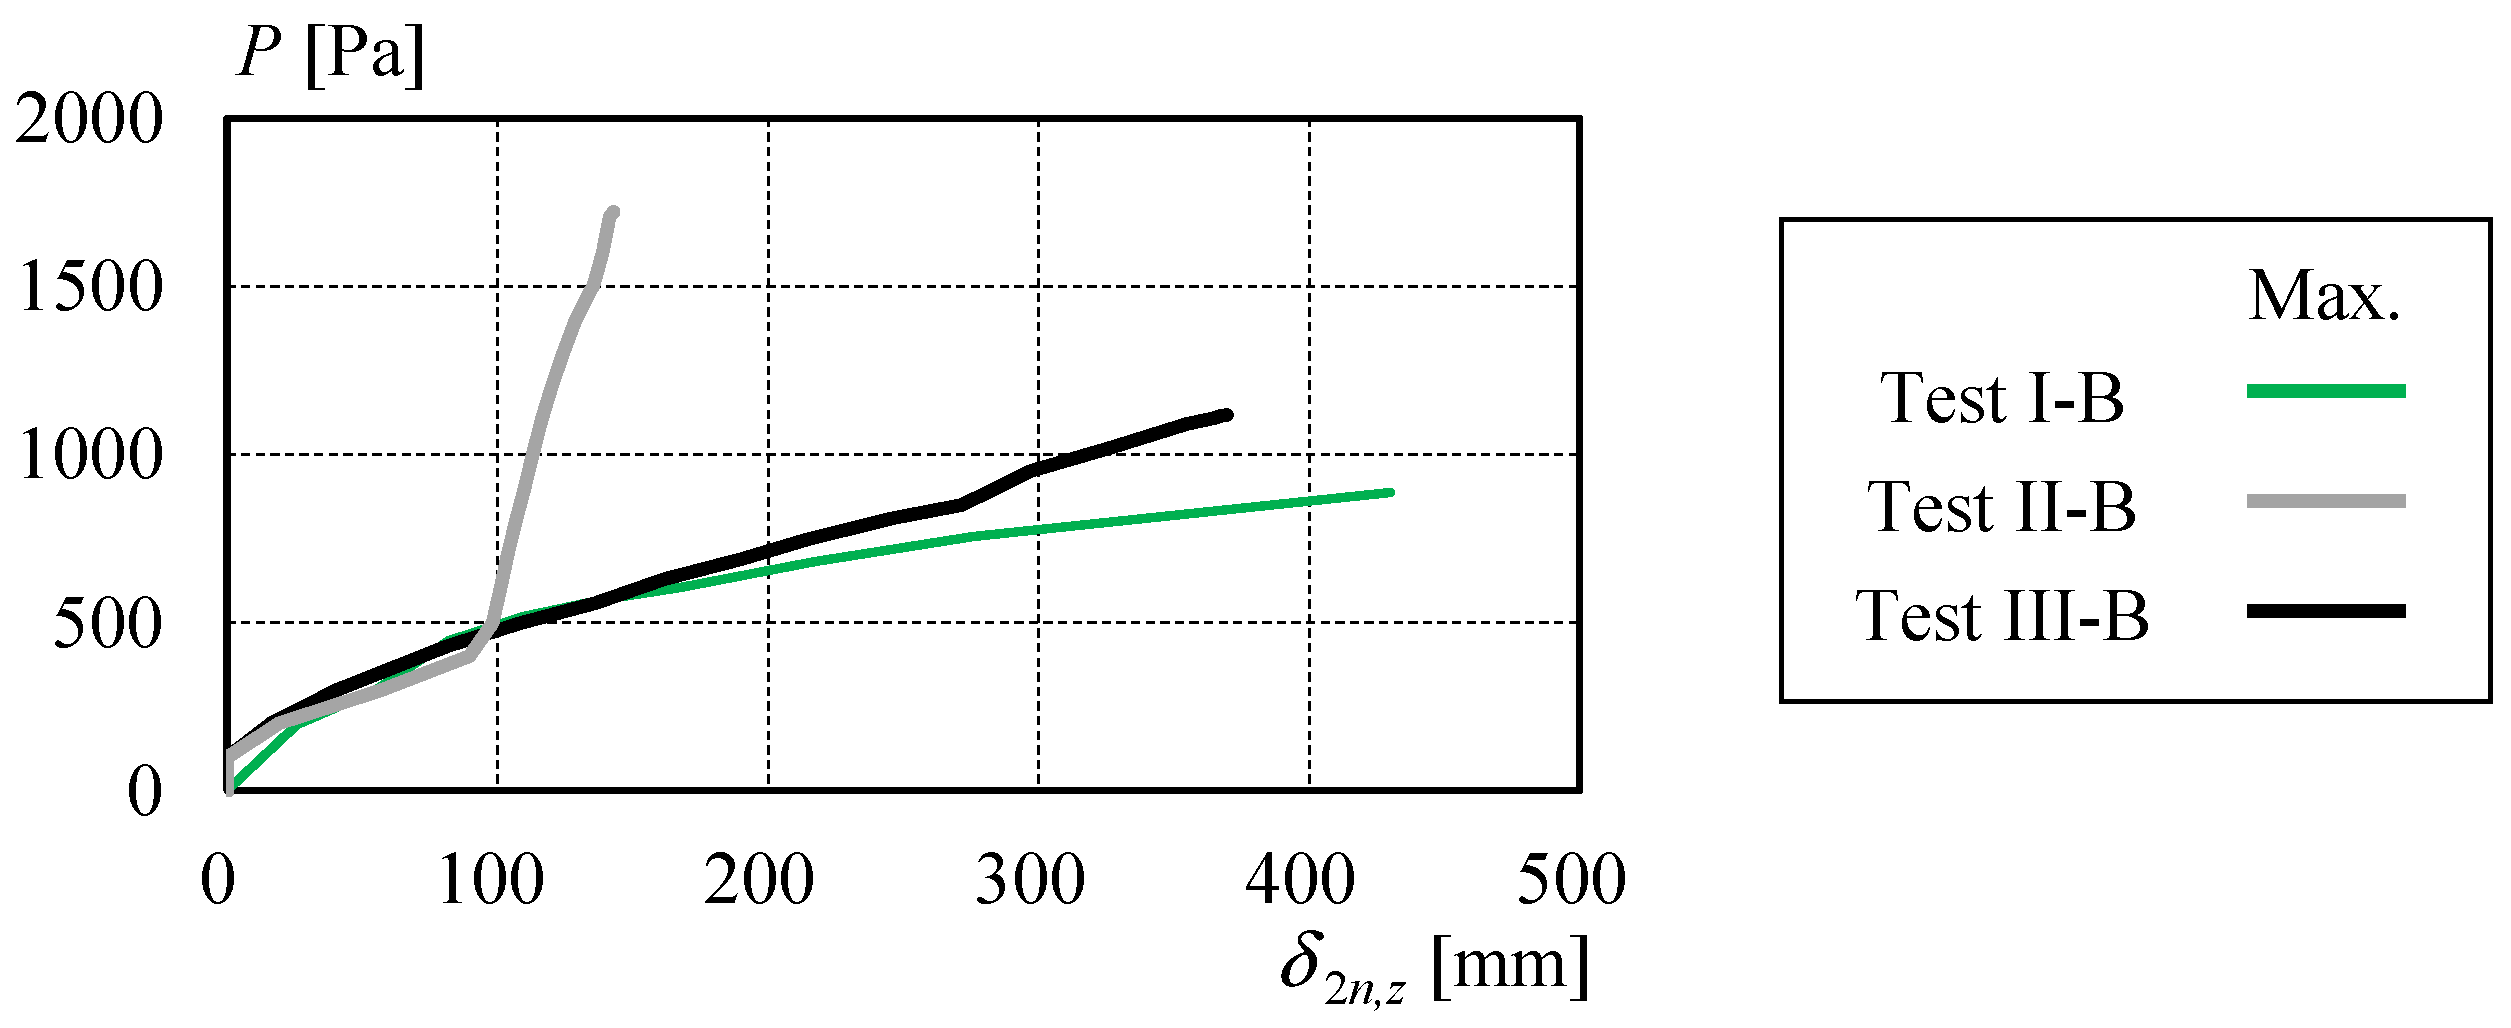
3.3. Test Results of the Solar Panel Mounting Structure with Improvement Measures
3.3.1. Fracture Behavior of the Solar Panel Mounting Structure
3.3.2. Stress Distribution of the Solar Panel Mounting Structure
3.4. Stress Demand on Solar Panel Mounting Structure Due to Foundation Defects
3.4.1. Yield and Ultimate Capacities of Major Structural Members and Joints
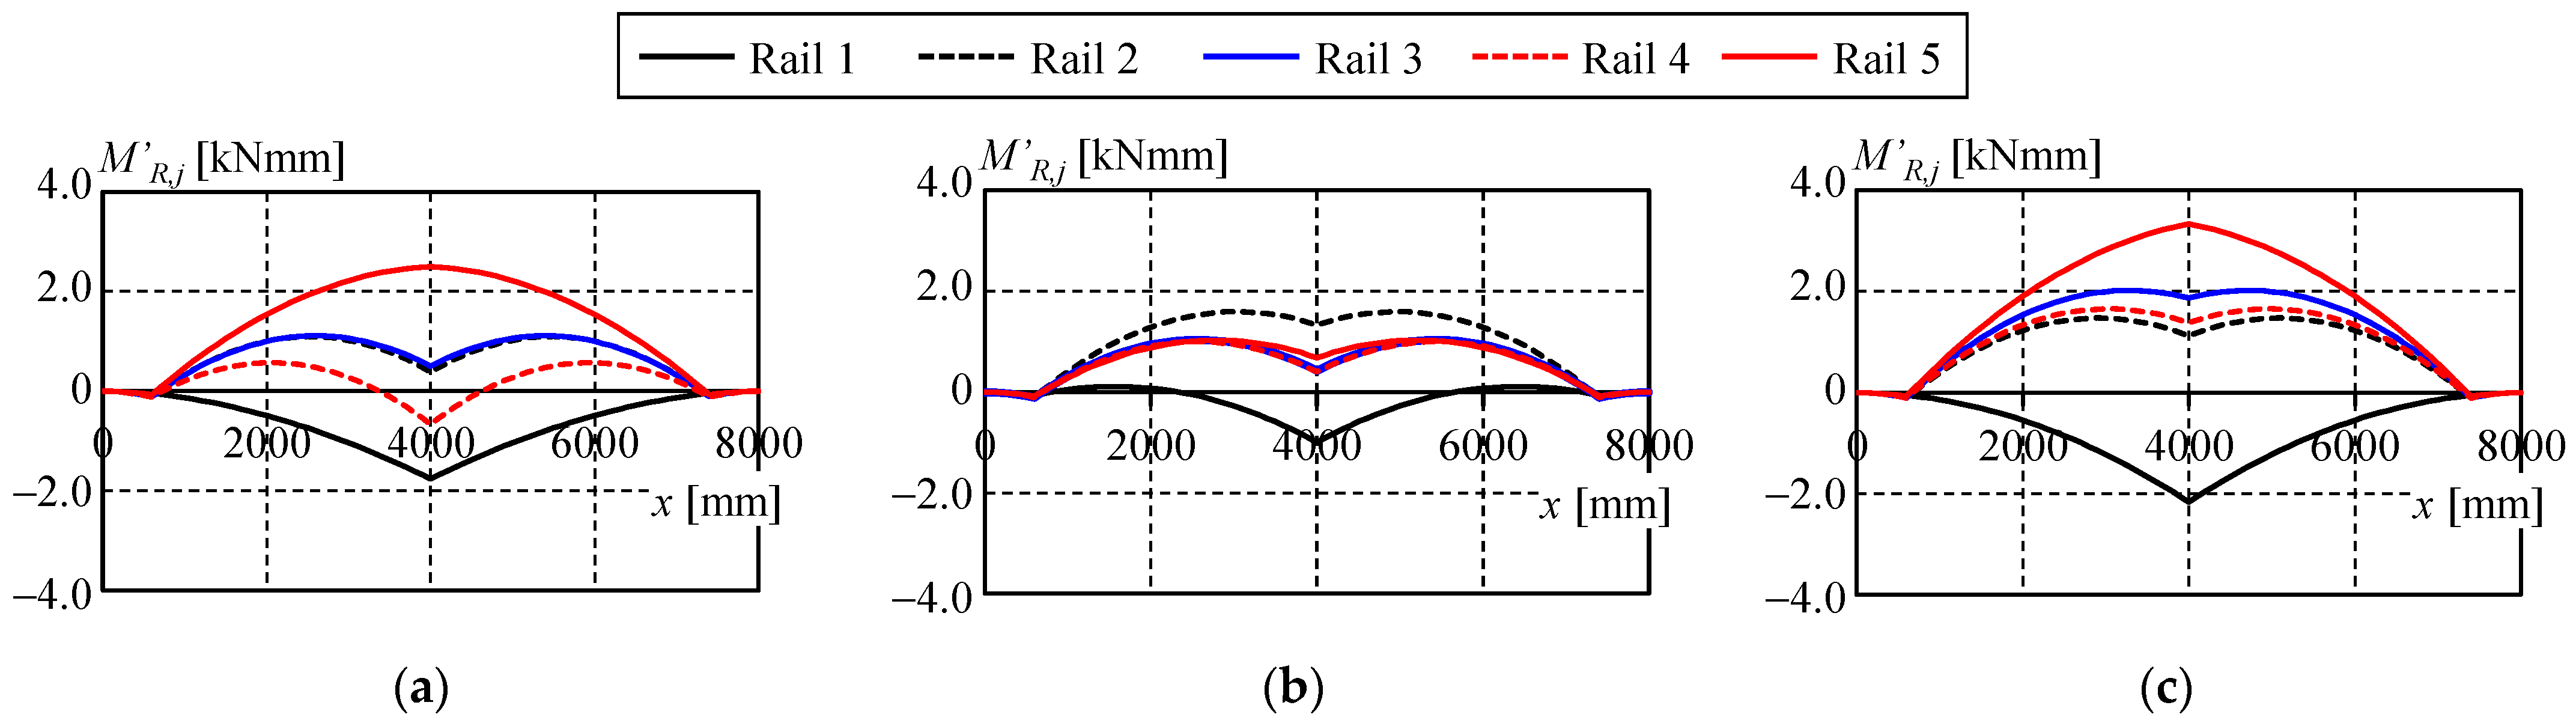
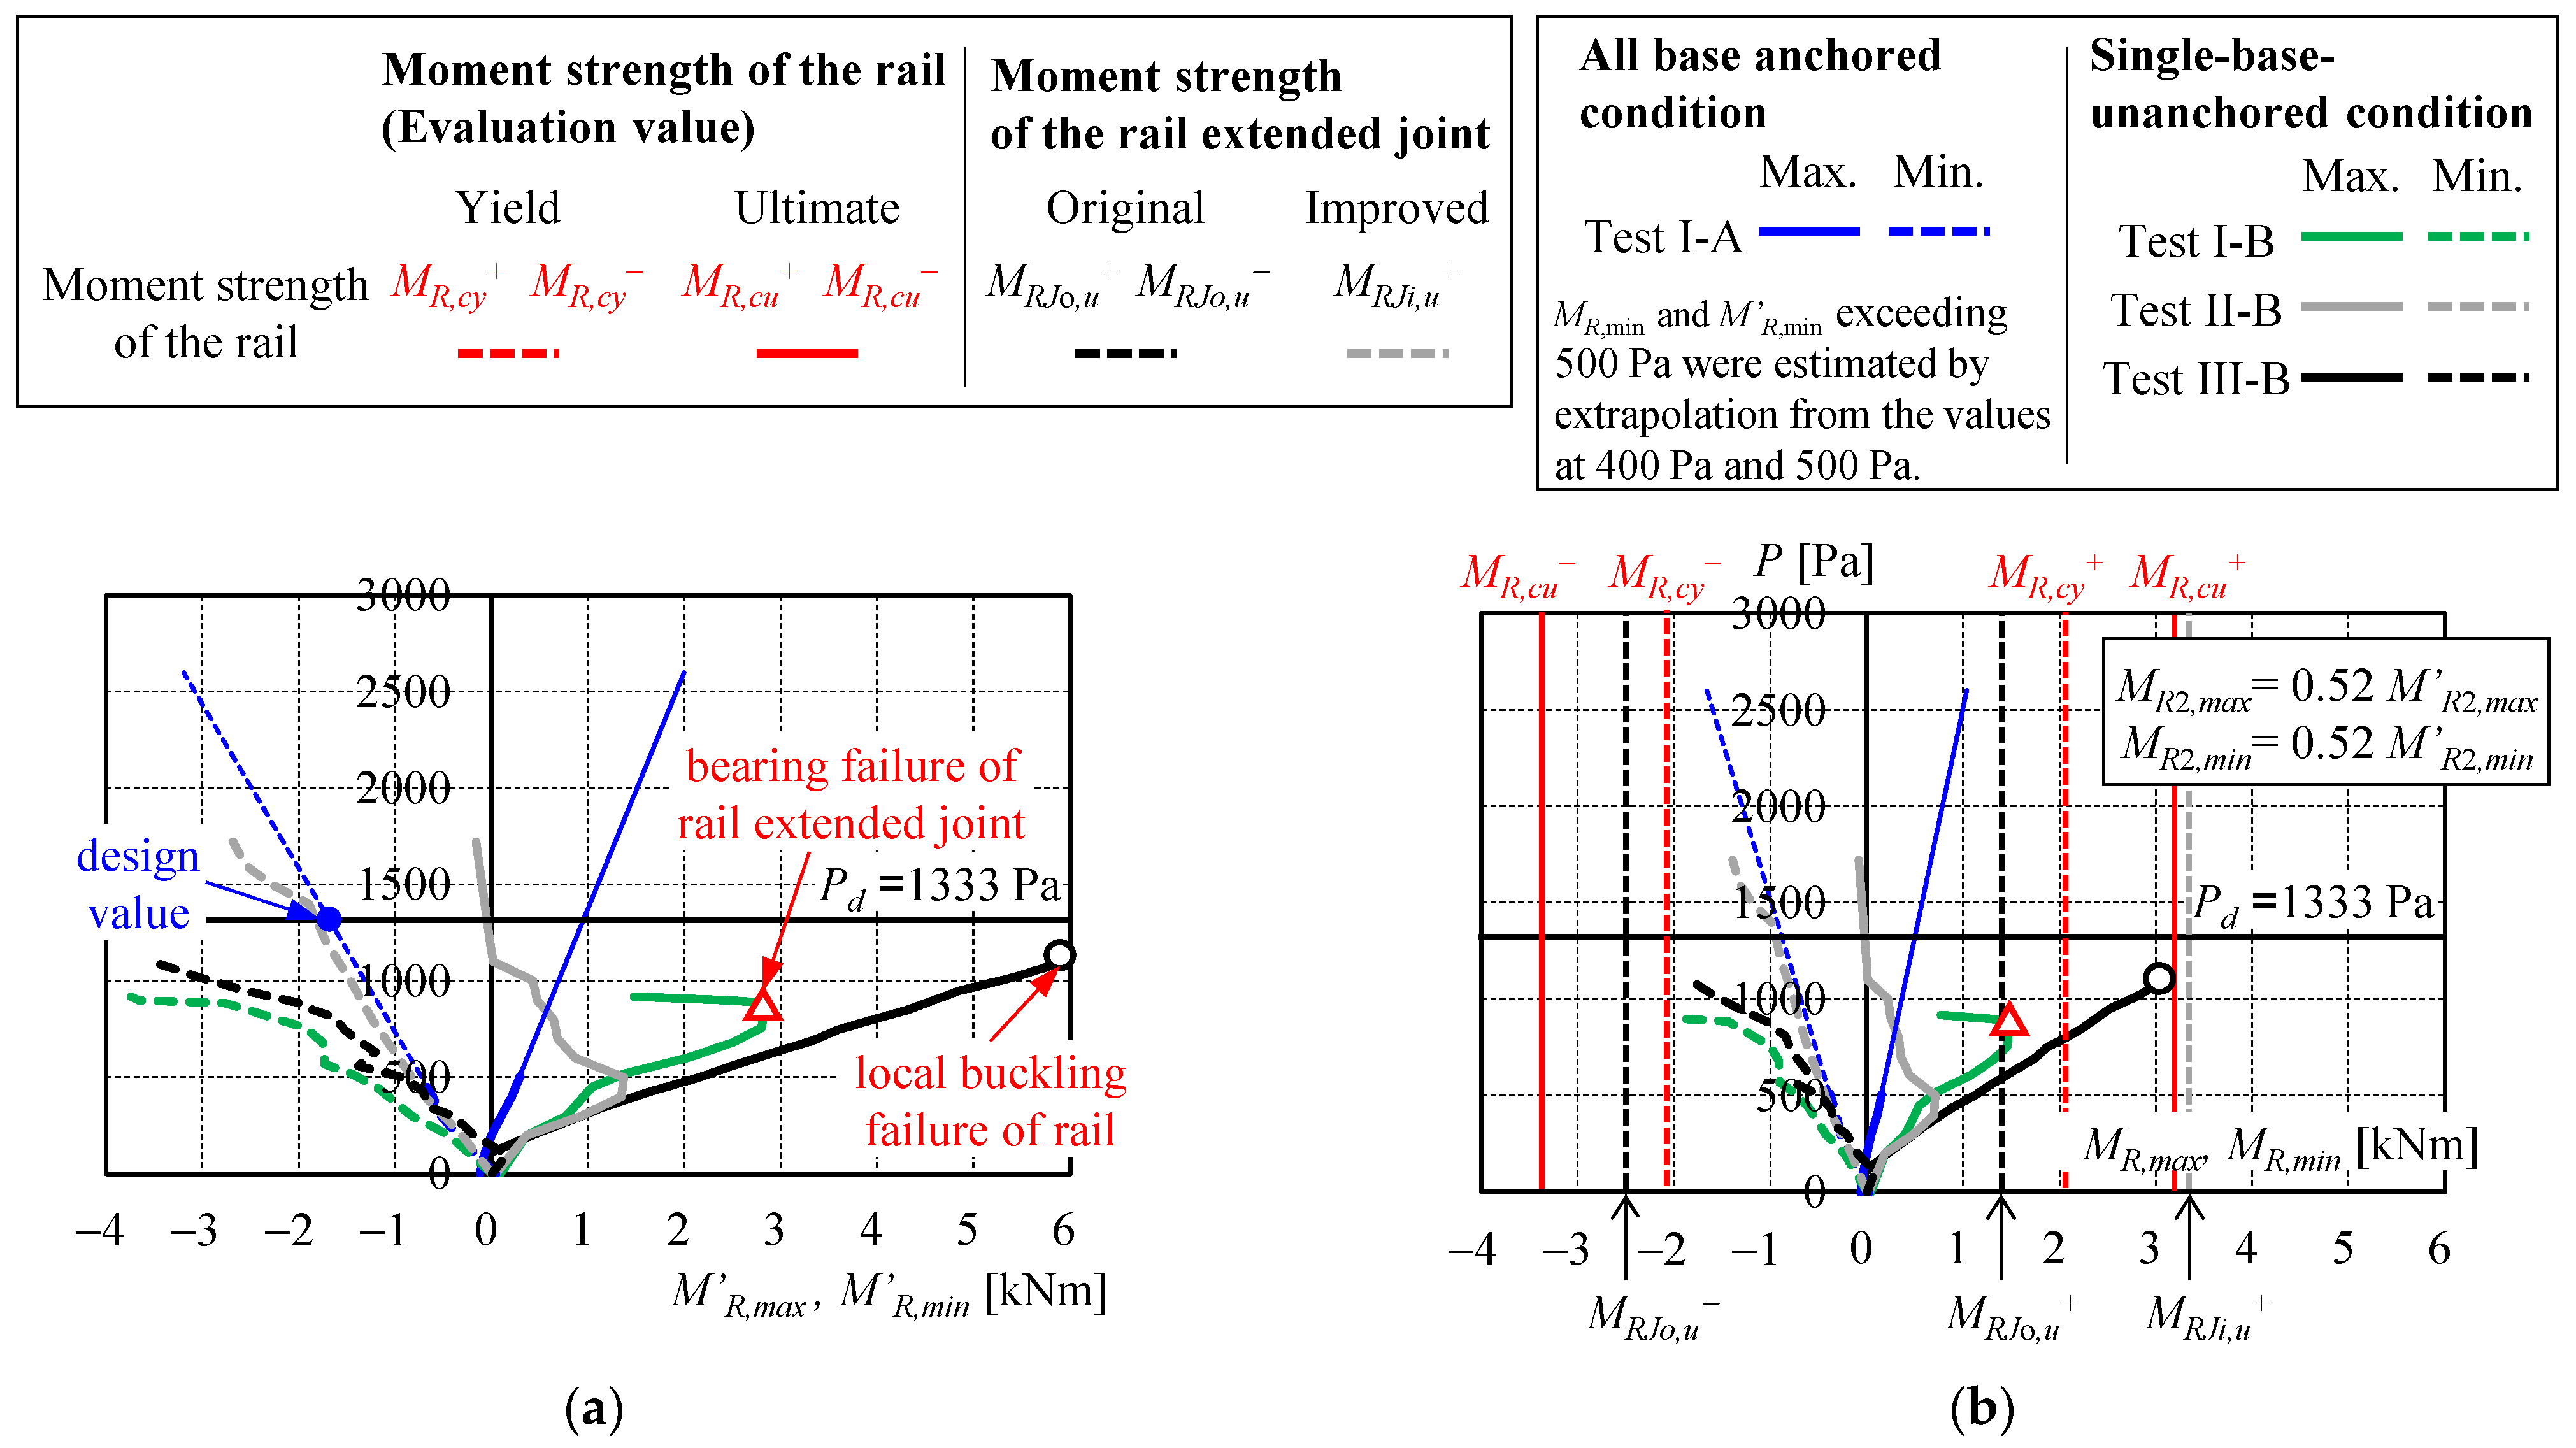
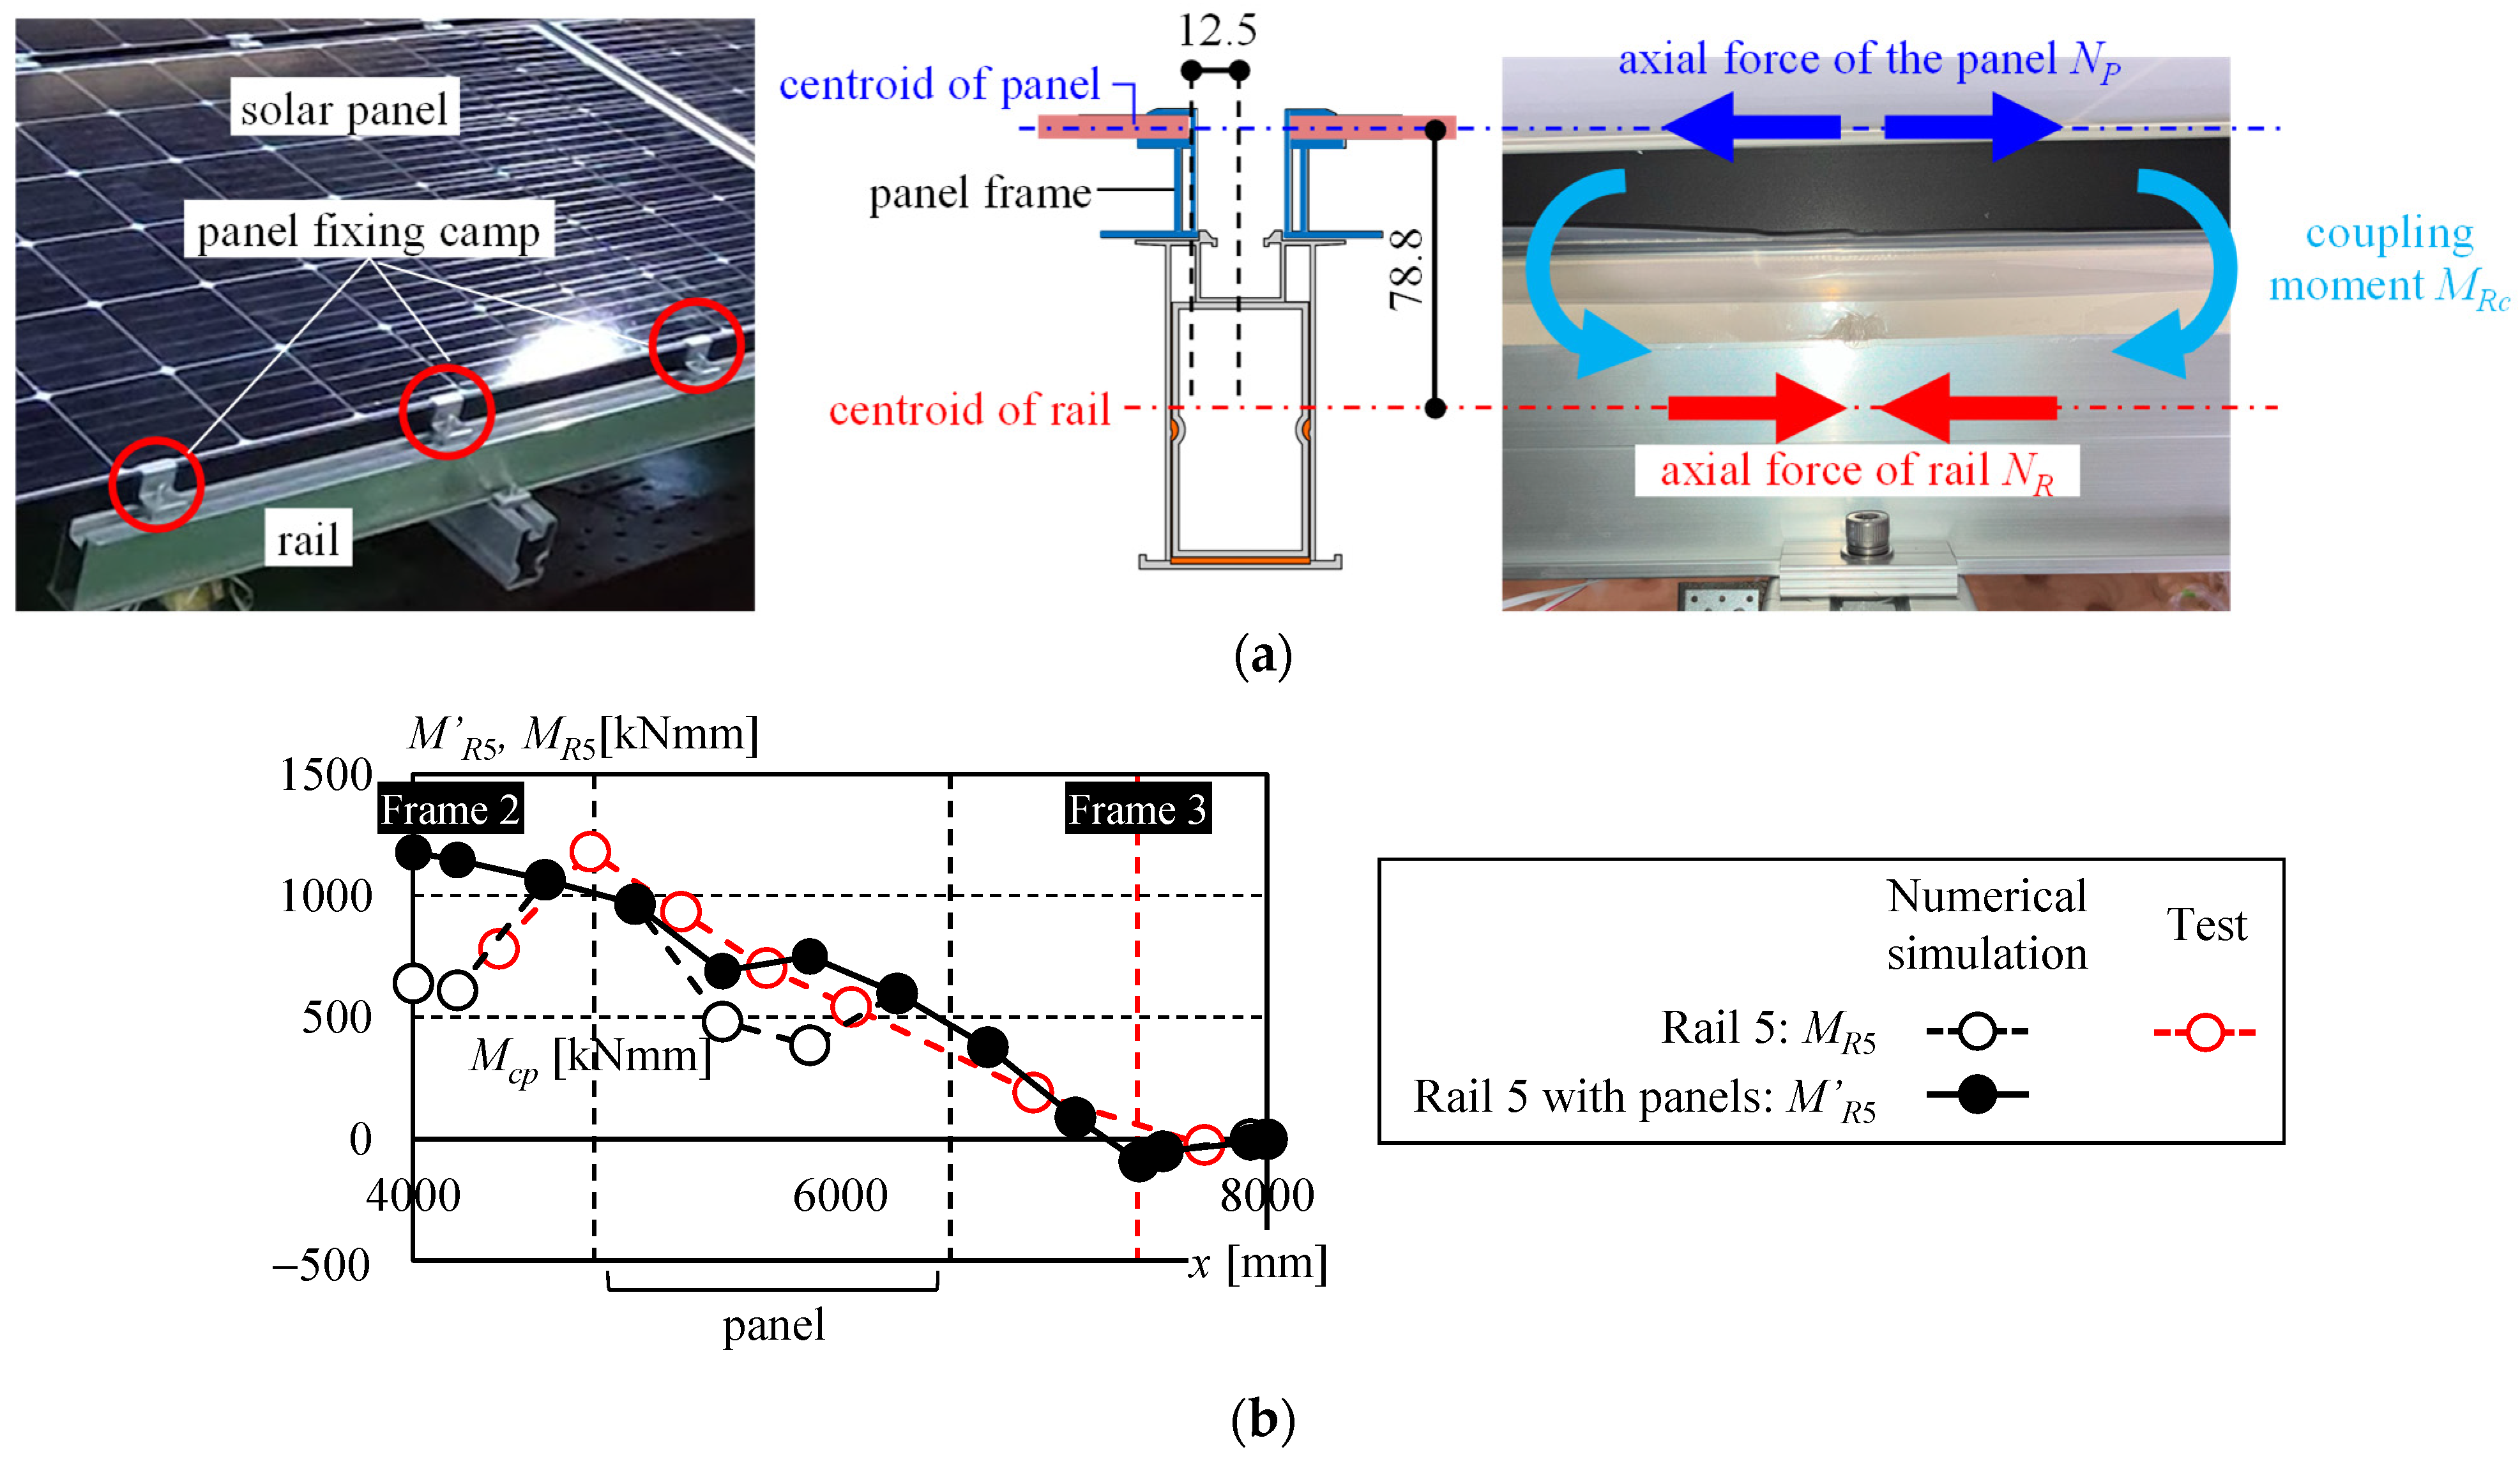
3.4.2. Stress Demand on Solar Panel-Mounting Rails
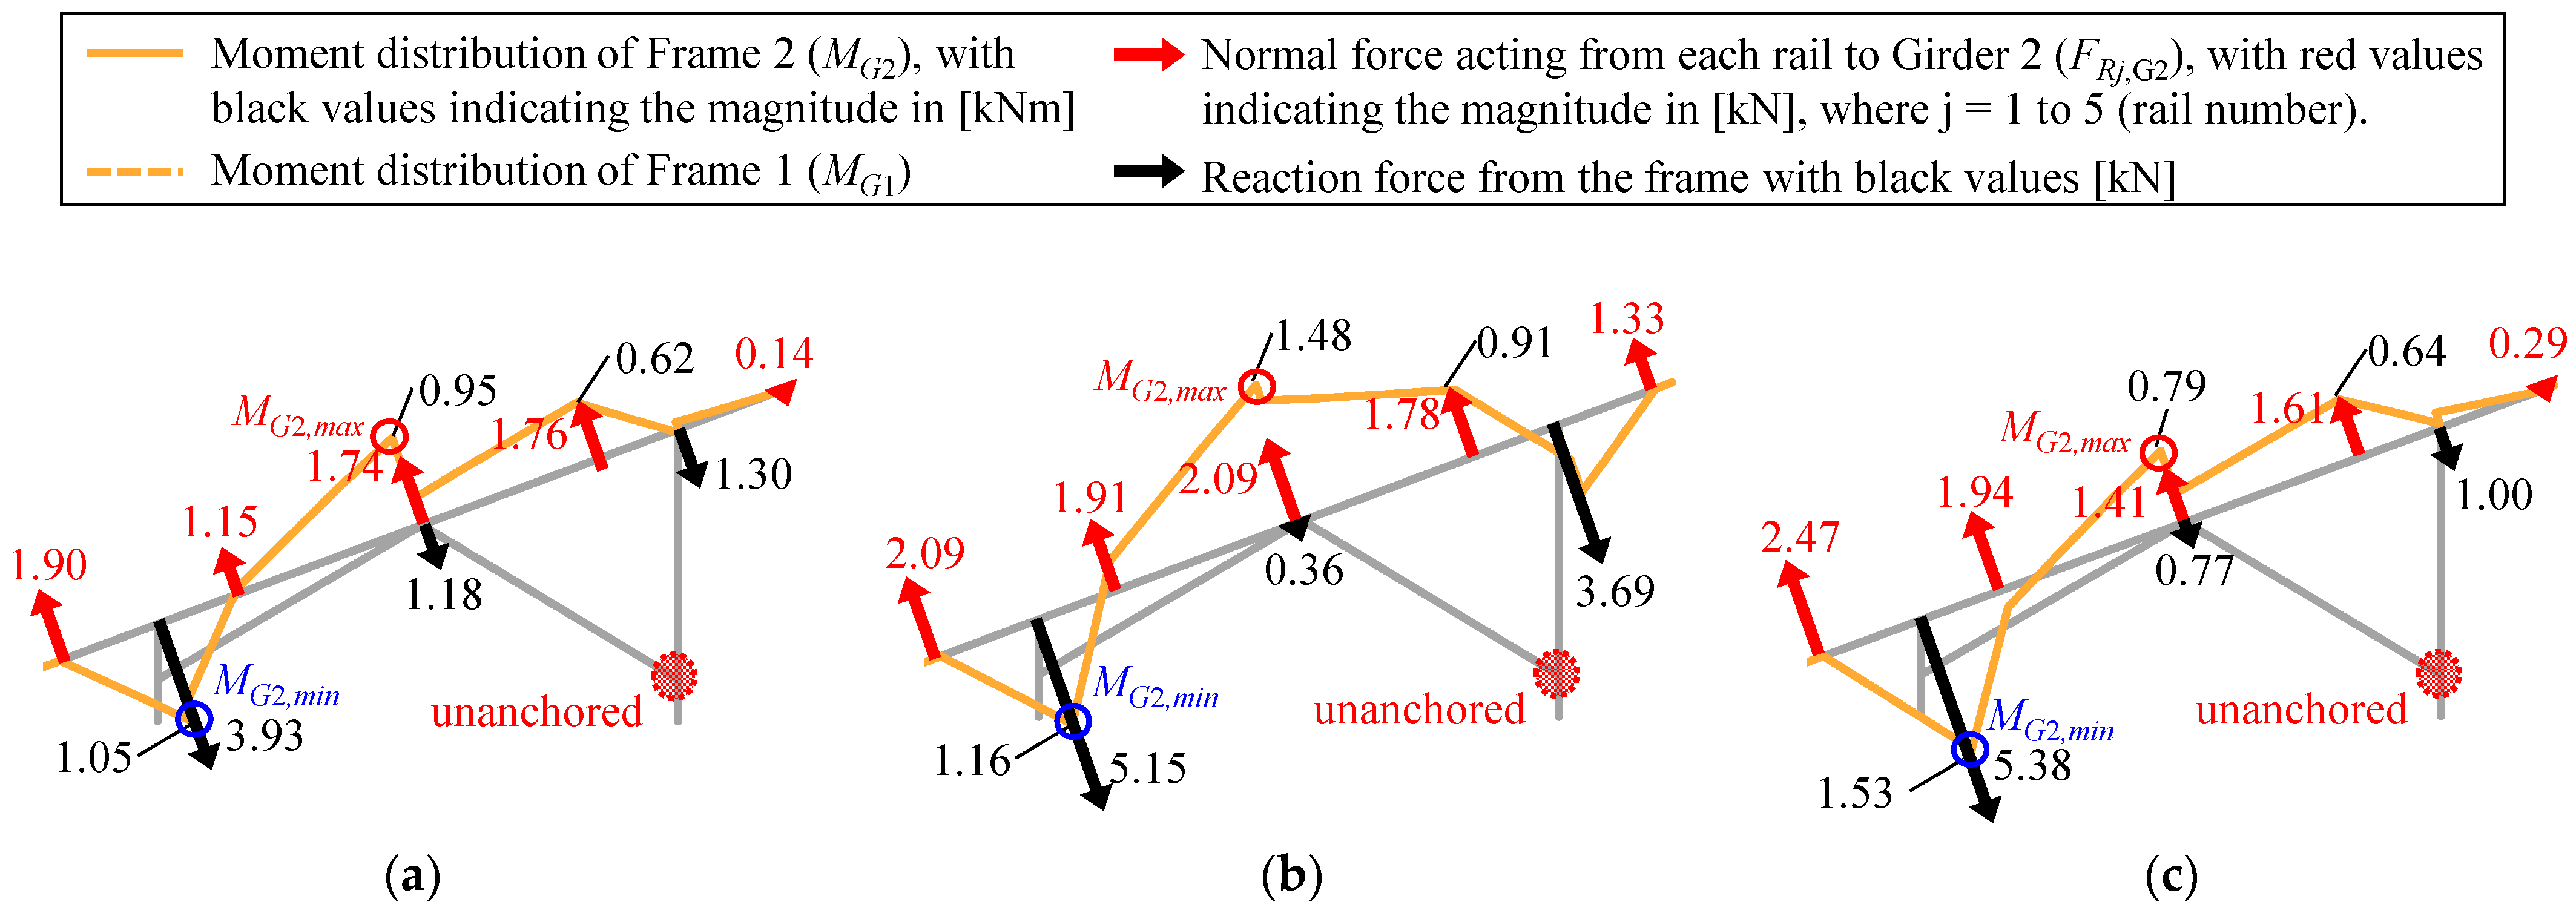
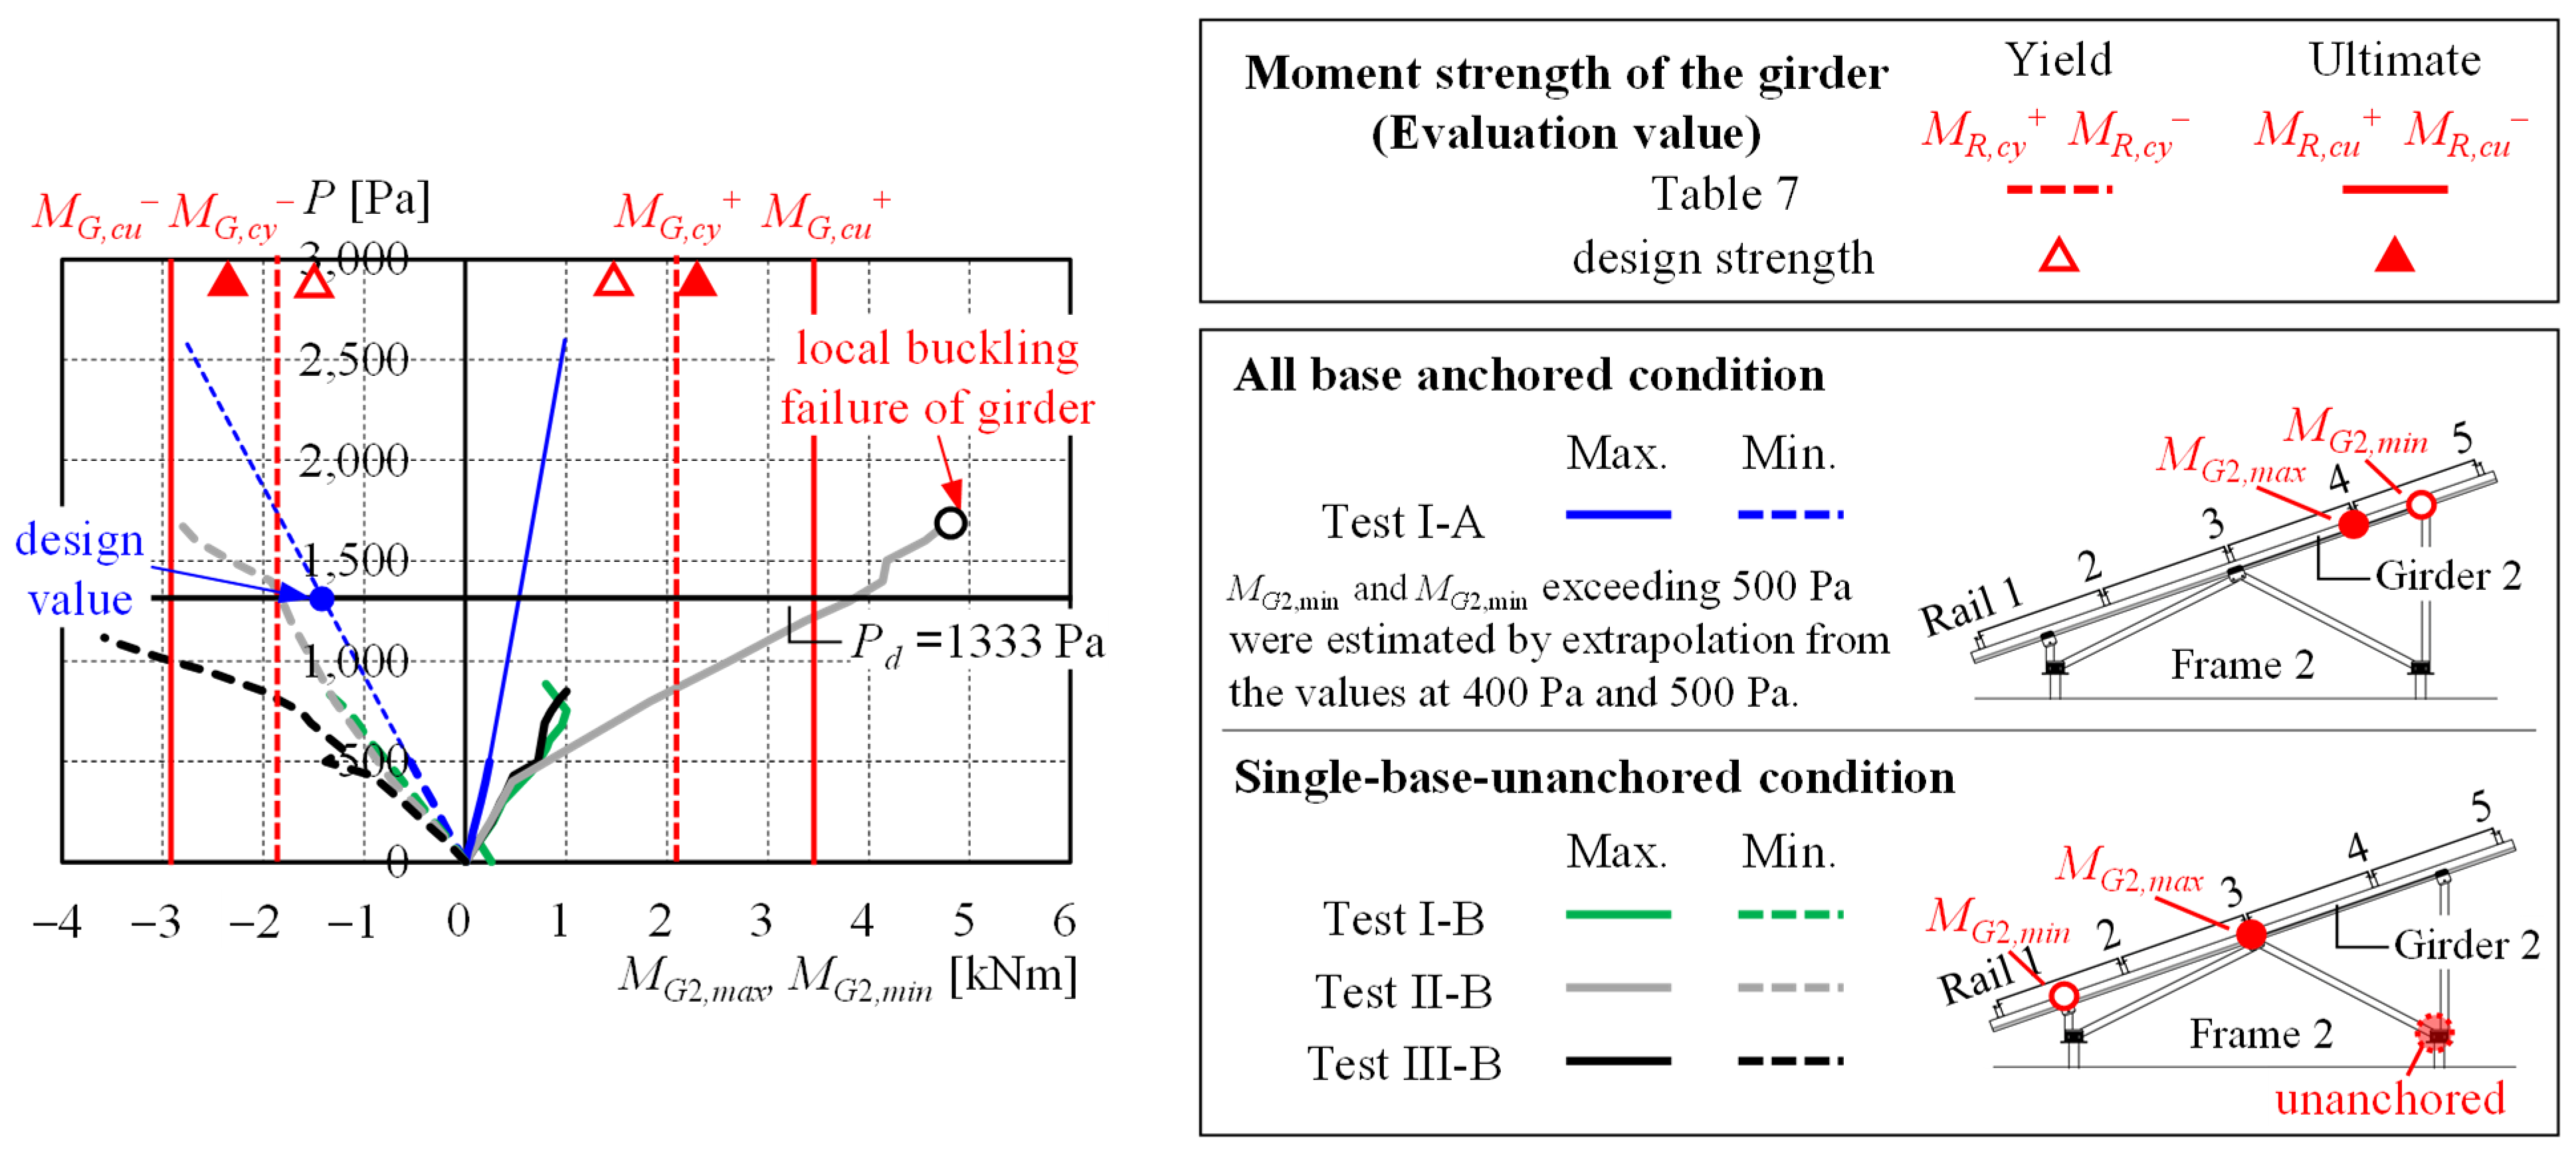
3.4.3. Stress Demand on Girders
3.4.4. Stress Demand on Column Bases and Pile
4. Effect of the Number of Spans on the Wind Pressure Resistance Performance of Solar Panel Mounting Structures with Foundation Defects
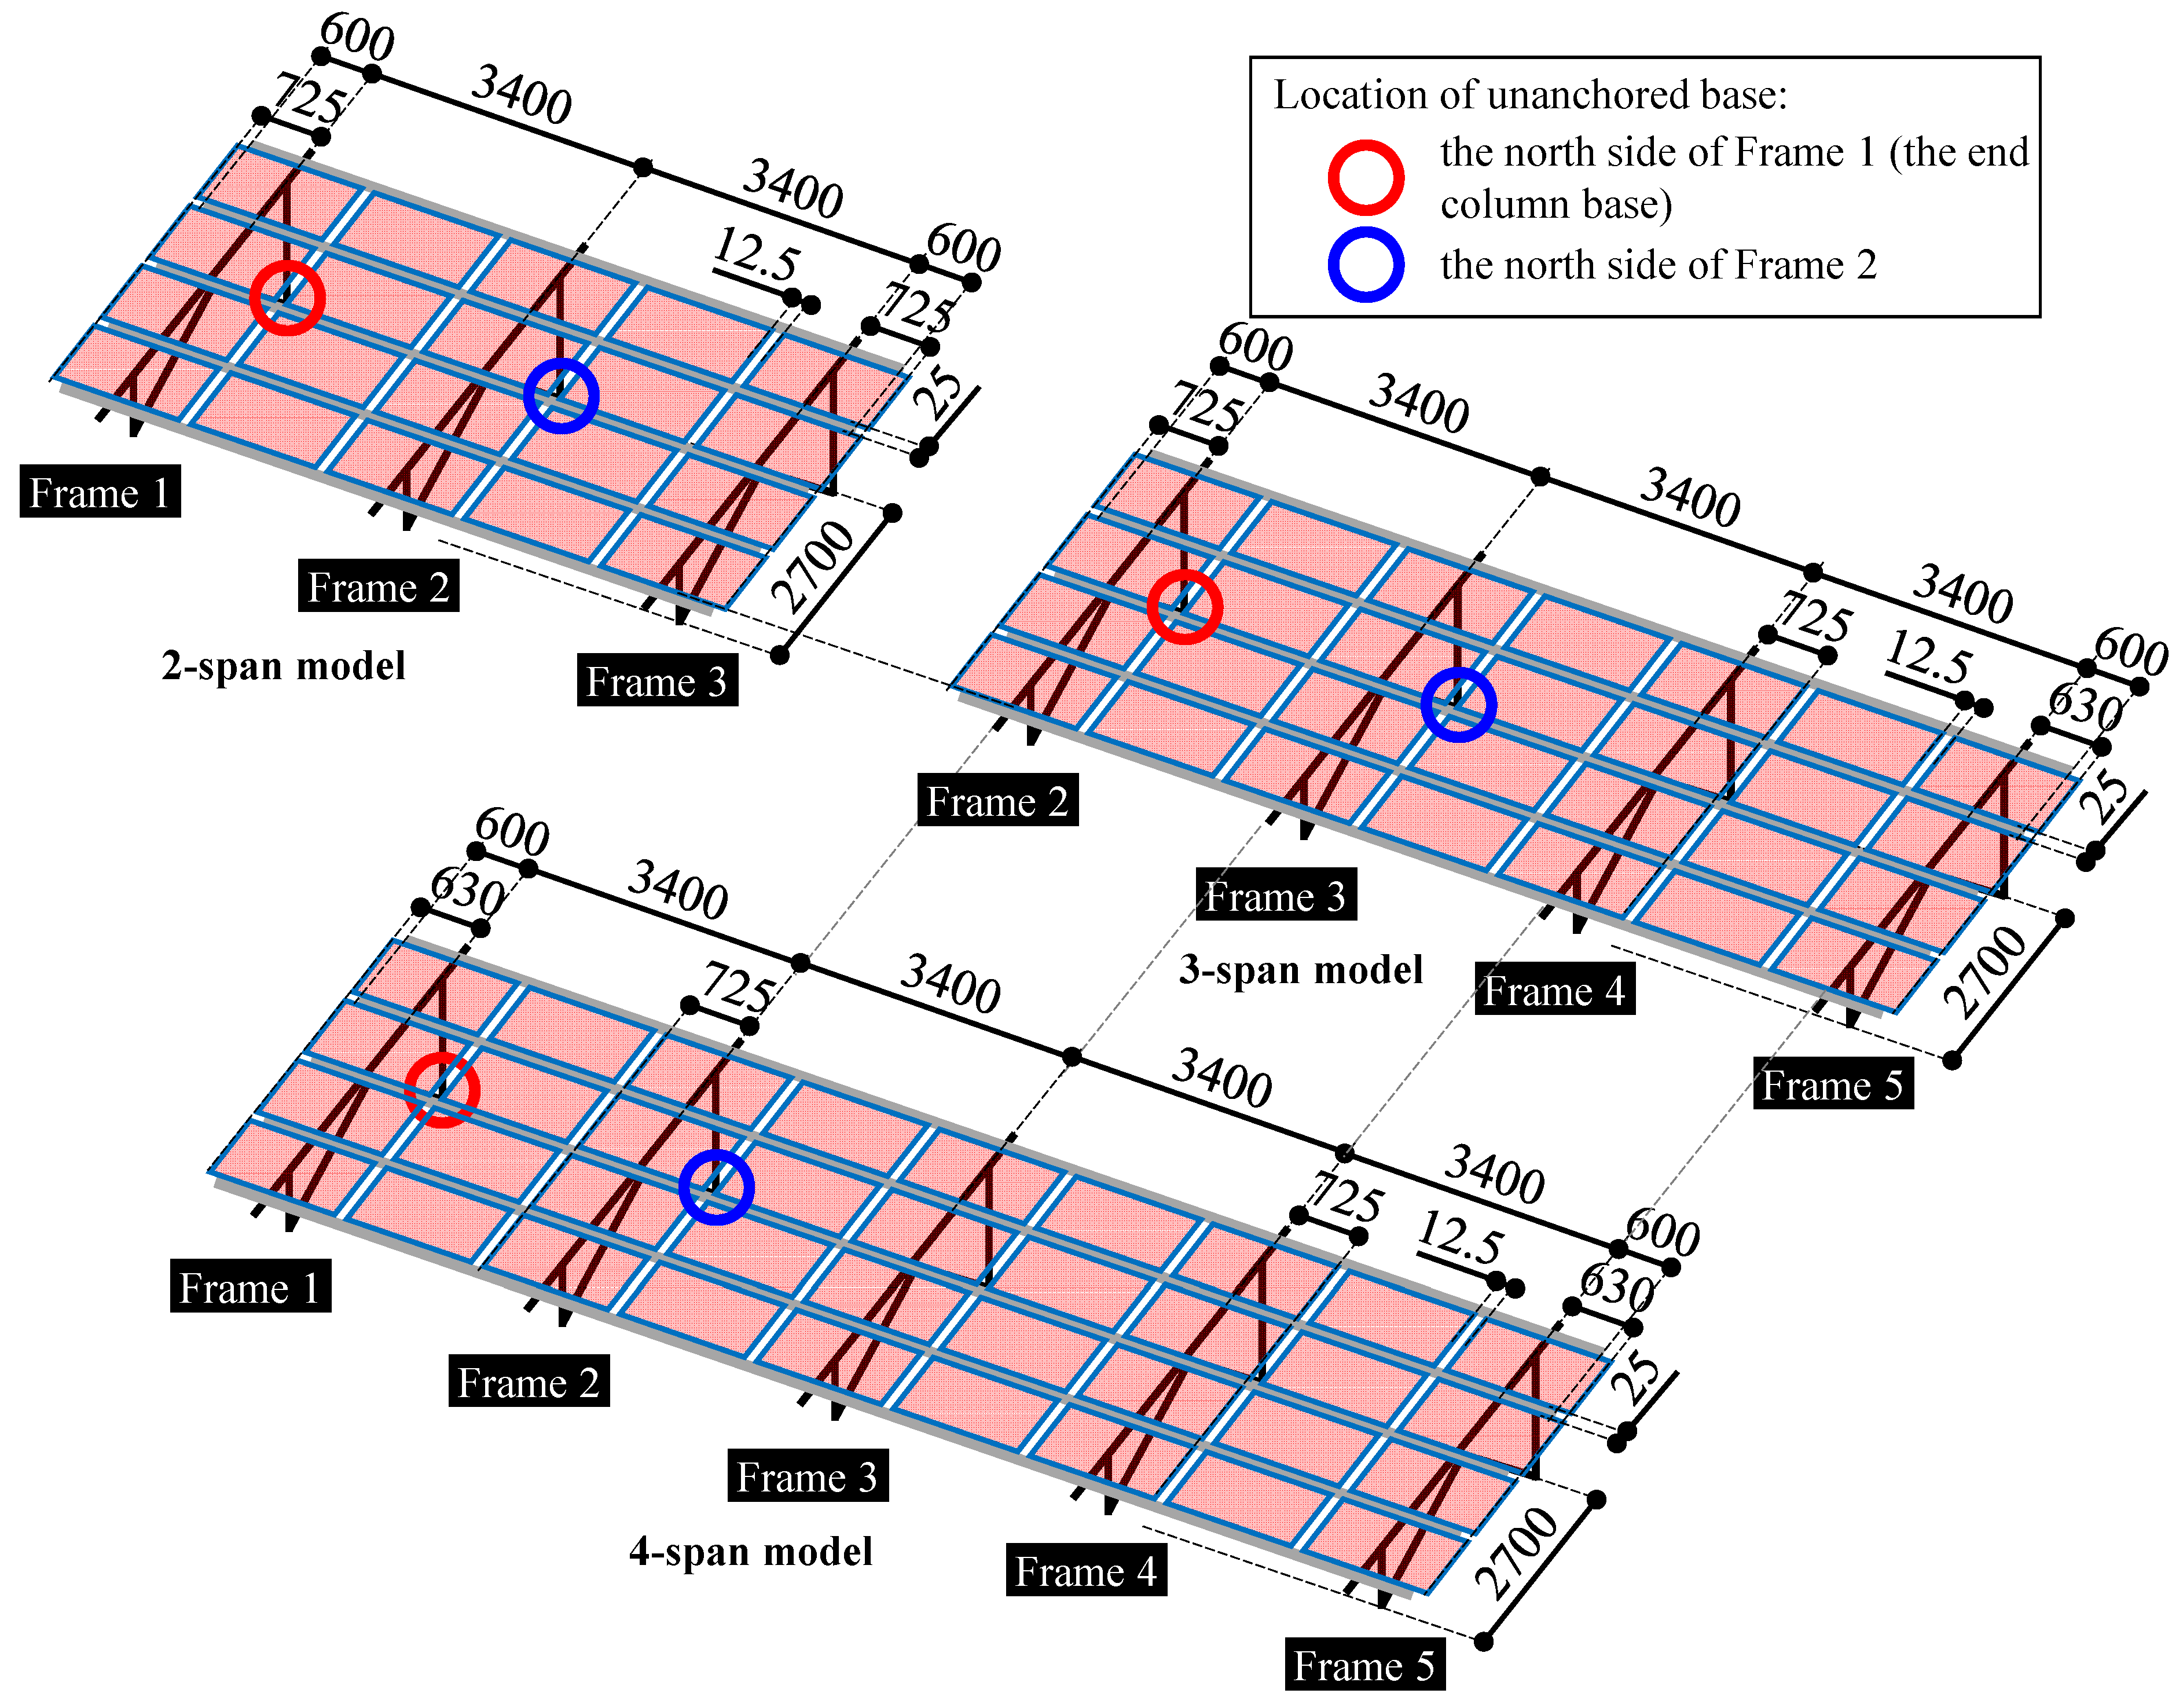
4.1. Numerical Simulation Model
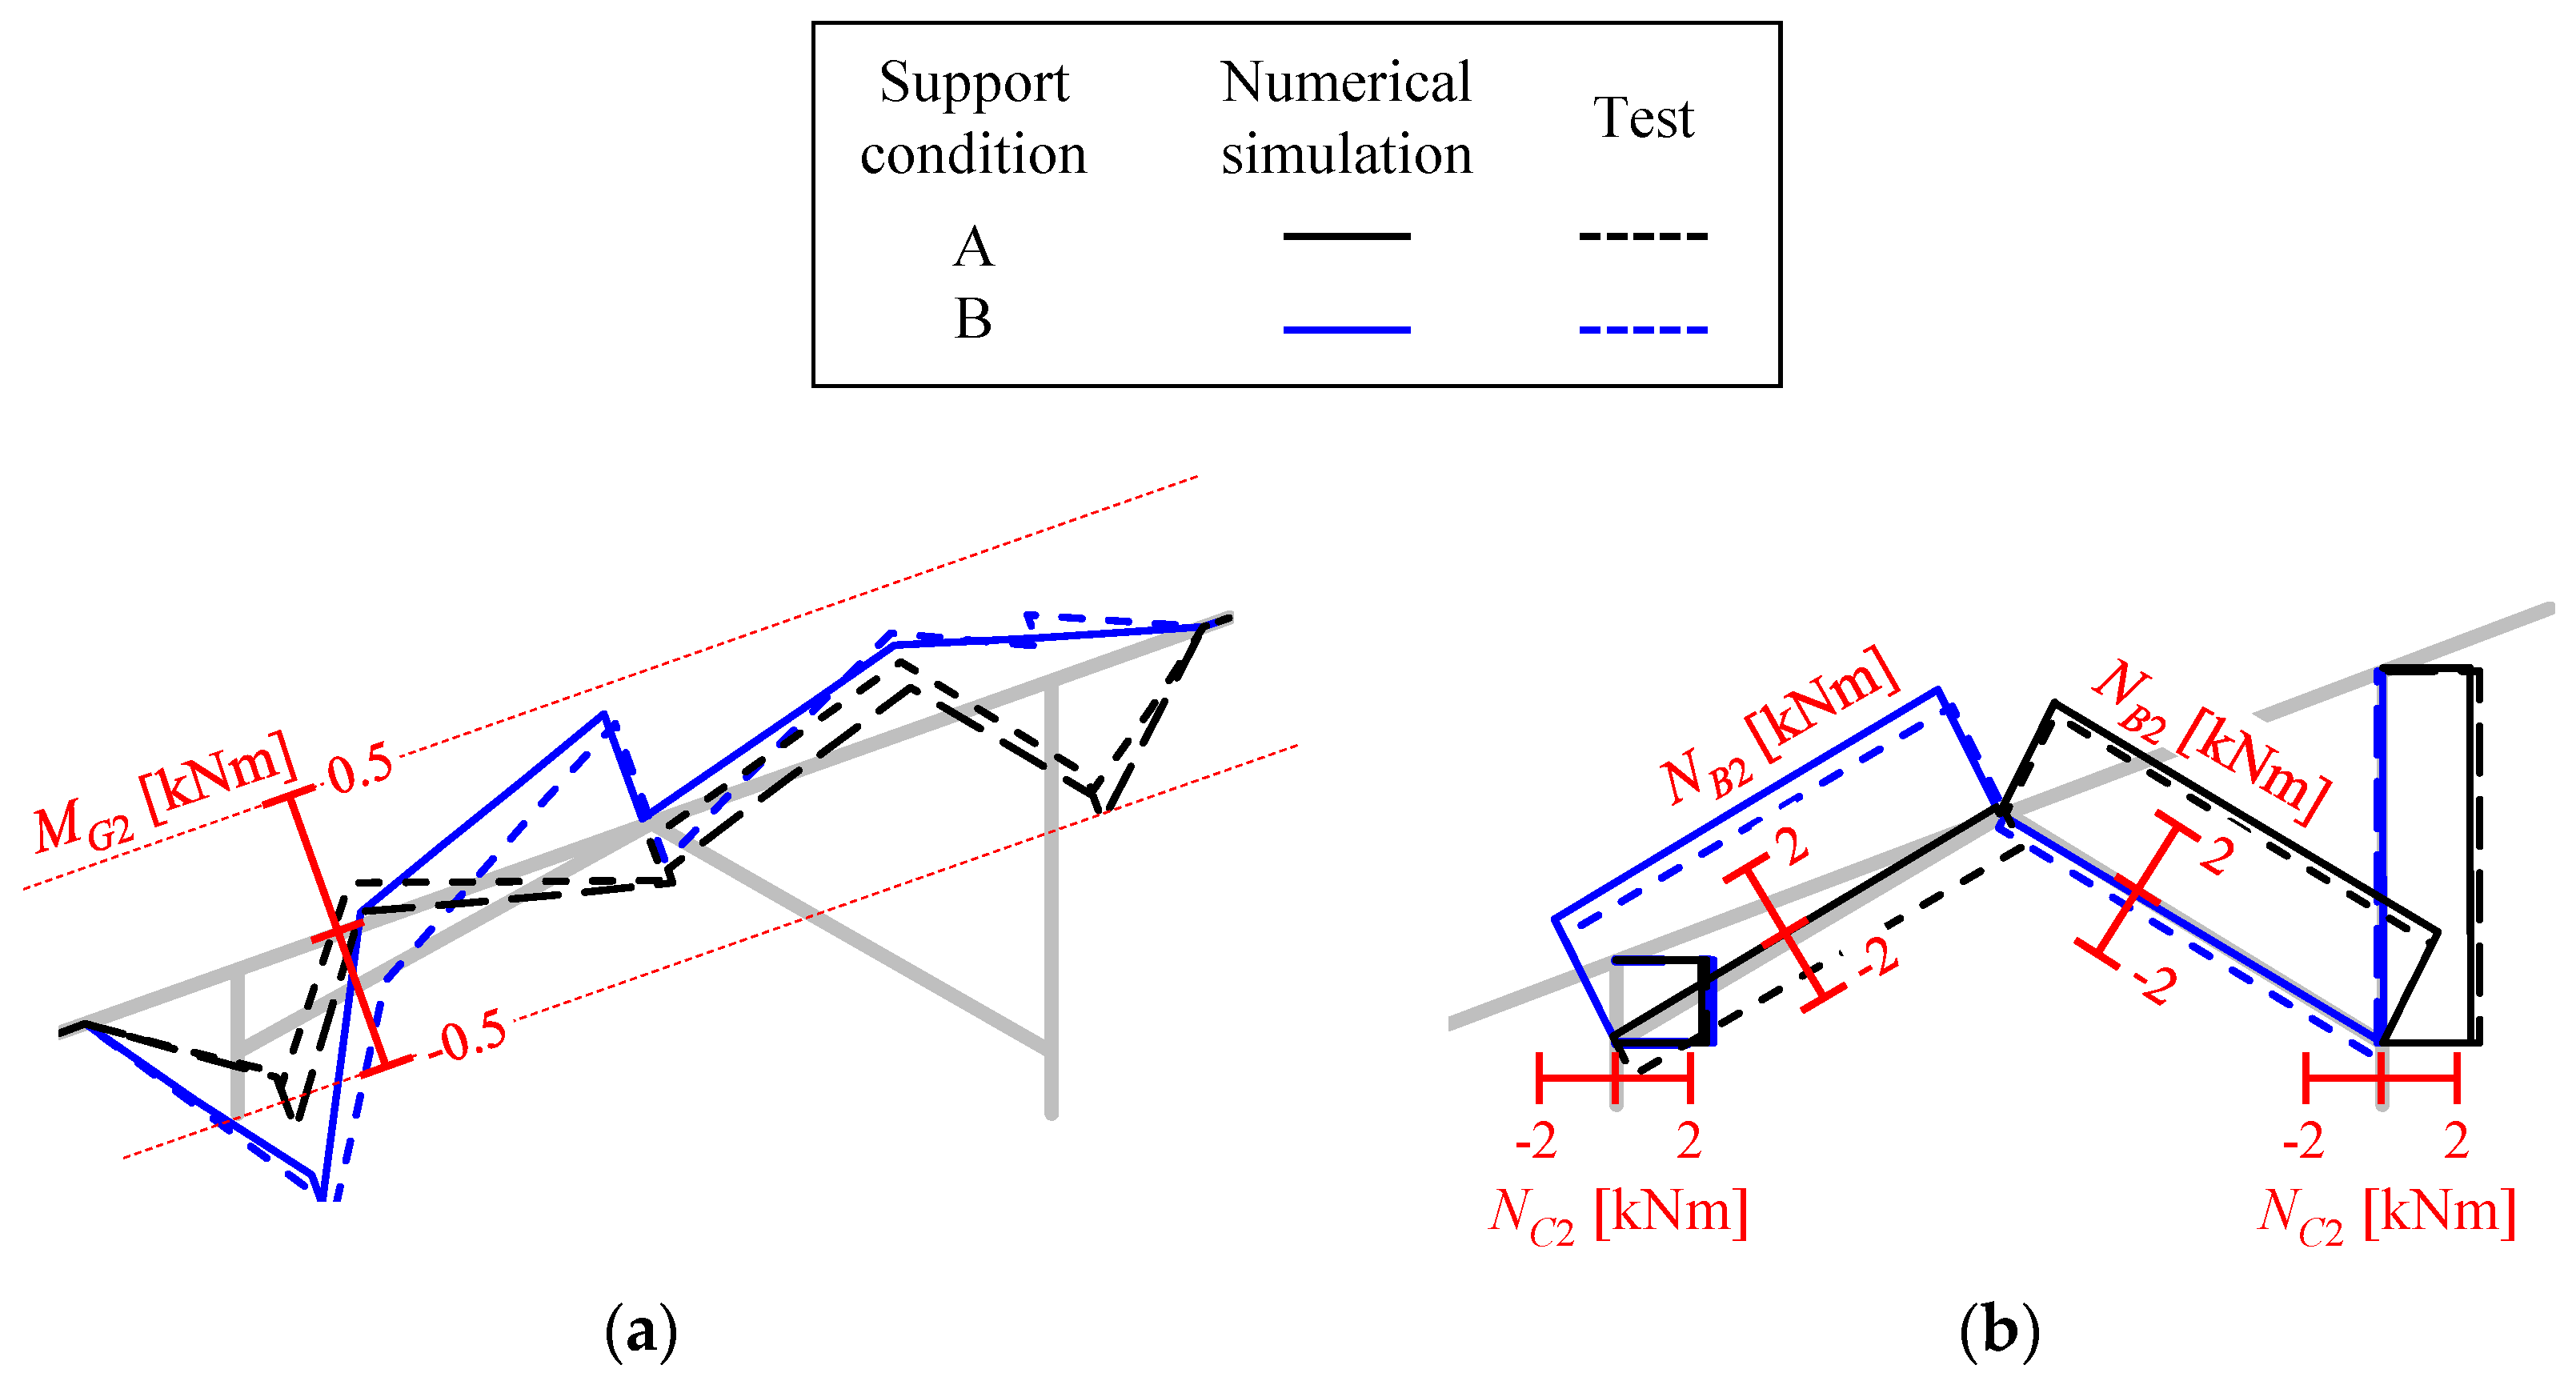
4.2. Comparison of Numerical and Experimental Results
4.3. Effect of the Number of Spans on Stress Demand
5. Conclusions
- Structural capacity of aluminum members (Section 3.1):
- From the four-point bending test described in Section 3.1, it is evident that in estimating the strength of thin-walled aluminum members used in solar panel mounting frames, the strength reduction due to local buckling must be taken into account.
- For cross-sections that can be regarded as nearly rectangular (e.g., those shown in Table 1), the ultimate bending strength at which local buckling occurs is approximately 1.5 times greater than the yield bending strength typically referenced in design (see Table 8 in Section 3.4). Therefore, even in the event of conditions not assumed in design, the structure possesses an additional safety margin of 1.5 times on top of both the design safety factor and the material-to-design strength ratio.
- Structural capacity of joints:
- The east-west rail extension joint fails earlier than the base rail when a short insert is used in the joint. To prevent premature failure before the rail reaches its yield strength, it is recommended to use an insert with a length approximately four times the rail depth and to position the extension joint away from connections with other members (Section 3.1).
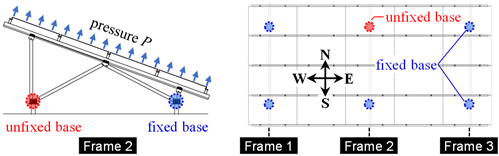
- In the mounting frame where the primary members (rails and girders) have a design safety factor of approximately 1.0, no significant damage was observed up to twice the design wind pressure Pd under the ideal condition in which all column bases were anchored. At P = 2600 Pa, however, pull-out failure occurred at the column base.
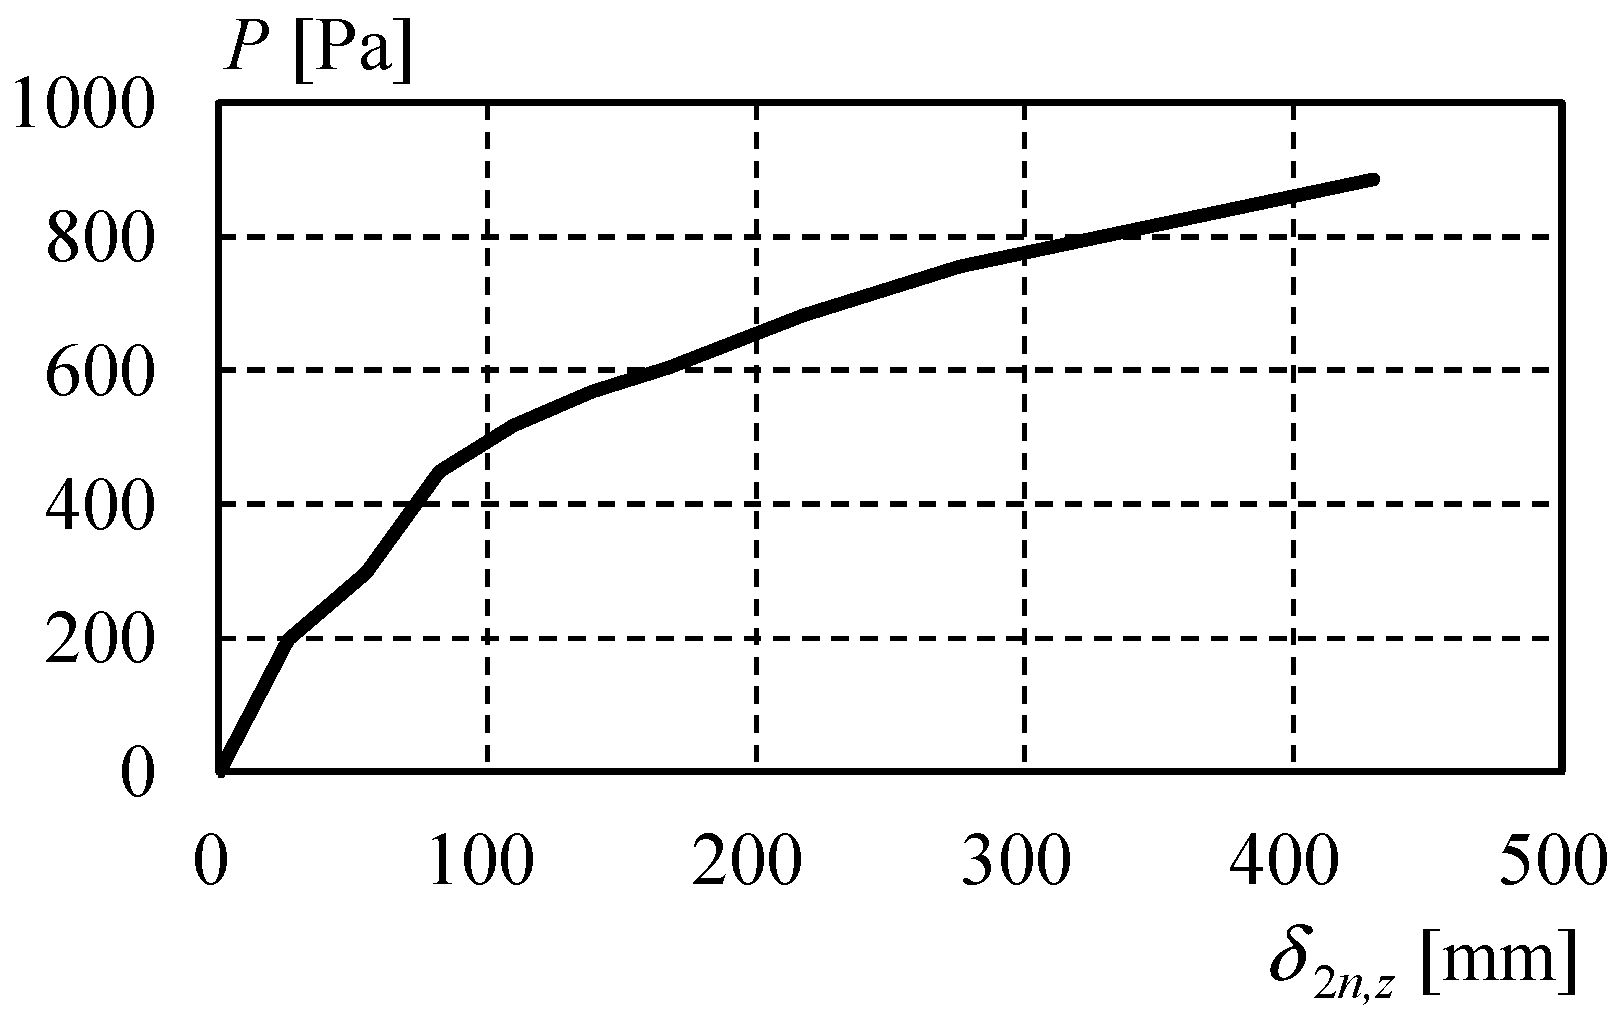
- Under the single-base-unanchored condition modeling foundation defects, the rail extension joint became a weak point, leading to bending of the solar panel frame and failure of the rail extension joint at a pressure equal to half the design wind pressure Pd. Experimental results confirmed that the addition of east-west braces to restrain the unanchored column bases, along with reinforcement and relocation of the rail extension joint, was effective in increasing the failure pressure.
- The most critical failure mode to be avoided in buildings and structures during a storm is the detachment and scattering of components, as this can lead to secondary damage. In solar panel mounting systems, the scattering of panels or any part of the frame must be prevented under all circumstances. In the structural configuration adopted for the present test specimens, it was found that local buckling of the girder could cause the solar panels to be blown off. In contrast, when local buckling occurred in the rail, the overlying solar panel only bent together with the rail and did not detach. These results suggest that the buckling of members oriented perpendicular to the short side of the solar panels may induce panel detachment.
- Stresses acting on frame members and joints under poor foundation conditions (Section 3.4 and Section 4):
- -
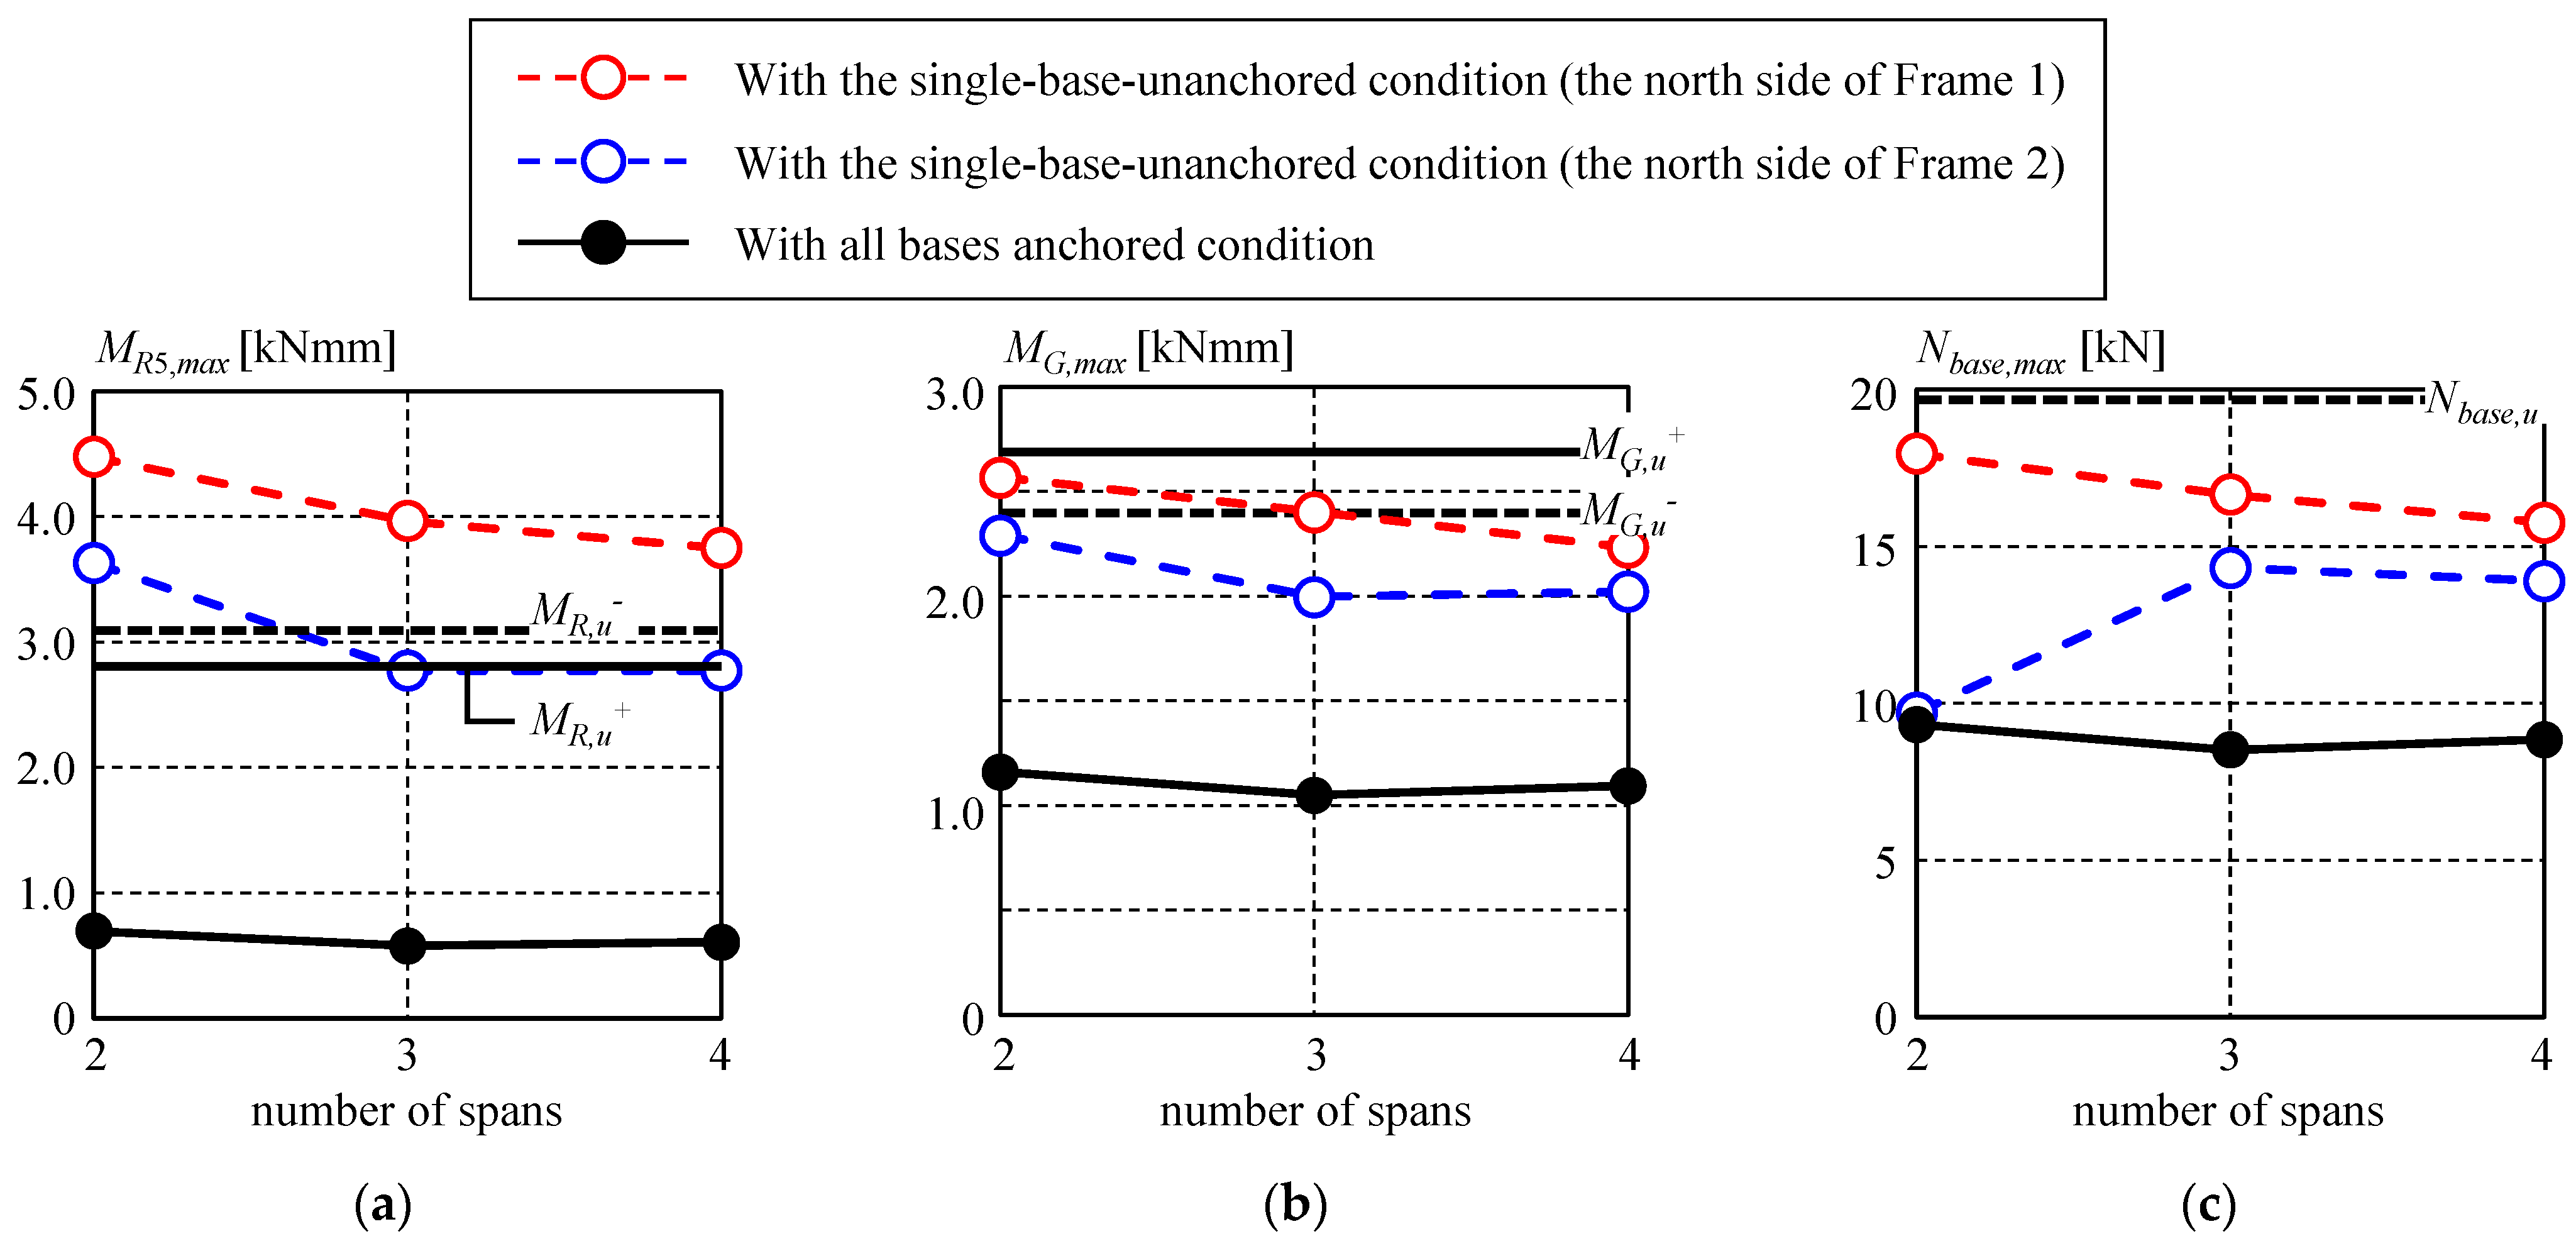
- Although the findings are based on the specific mounting frame investigated in this study, it was observed that, under the single-base-unanchored conditions, the forces acting on the rails, girders, and column bases become approximately twice as large as those under all base-anchored conditions. When foundation deficiencies are suspected, it is necessary to consider a safety factor of at least two for the column bases and foundations to prevent progressive collapse of the mounting frame.
- -
- Although increasing the number of spans can reduce the forces acting on structural members and column bases by approximately 10% under partially unanchored conditions, the improvement is not substantial enough to drastically alter the overall failure behavior. In particular, when uplift at end column bases and foundations is anticipated, the risk of panel blow-off and associated damage becomes significant. Therefore, proactive countermeasures are strongly recommended.
- Design considerations for solar panel mounting structures, considering potential foundation defects:
- Which component or joint of the mounting structure fails first is determined by the relationship between the stresses generated in the structure and the ultimate strength of each part. Based on (5), the stresses in the mounting structure under foundation defects can be estimated through numerical analysis, and by referring to (1) and (2) to evaluate the ultimate strength of the members and joints, the failure location can be predicted.
- Based on (3) to (5), when a member placed in the short-span direction of the solar panel fails due to local buckling, it is highly likely that such failure will cause the panel to be blown away, and therefore, such a failure mode should be avoided. Similarly, considering that a single foundation defect may affect adjacent column bases and pile foundations, a safety factor of approximately two should be provided for column bases and pile foundations to prevent progressive foundation failure and uplift of the entire mounting structure.
Author Contributions
Funding
Institutional Review Board Statement
Informed Consent Statement
Data Availability Statement
Acknowledgments
Conflicts of Interest
References
- Fukushima Daiichi Accident (Updated 4/29/2024). World Nuclear Association. Available online: https://world-nuclear.org/information-library/safety-and-security/safety-of-plants/fukushima-daiichi-accident (accessed on 4 April 2025).
- New Energy and Industrial Technology Development Organization (NEDO). NEDO’s Initiatives for Photovoltaic (PV) Power Generation. 2024. Available online: https://www.nedo.go.jp/content/100974453.pdf (accessed on 4 April 2025). (In Japanese).
- Internarial Energy Agency (IEA). Task 1 Strategic PV Analysis and Outreach—Snapshot of Global PV Markets 2023—(Report IEA-PVPS T1-44:2023). 2023. Available online: https://iea-pvps.org/wp-content/uploads/2023/04/IEA_PVPS_Snapshot_2023.pdf (accessed on 4 April 2025).
- Ministry of Economy, Trade and Industry. Characteristics of Accidents Involving Solar PV Systems During the Summer of 2018. 2018. Available online: https://www.meti.go.jp/shingikai/sankoshin/hoan_shohi/denryoku_anzen/newenergy_hatsuden_wg/pdf/014_01_00.pdf (accessed on 4 April 2025). (In Japanese).
- Ministry of Economy, Trade and Industry. Interim Report of the Structural Strength Working Group on Accident Response for New Energy Power Generation Facilities. 2019. Available online: https://www.meti.go.jp/shingikai/sankoshin/hoan_shohi/denryoku_anzen/newenergy_hatsuden_wg/pdf/20191119_report.pdf (accessed on 4 April 2025). (In Japanese).
- Takamori, K. Damage examples of photovoltaic mounting systems and direction of reinforcement methods. J. Jpn. Sol. Energy Society 2022, 48, 33–39. (In Japanese) [Google Scholar] [CrossRef]
- Khan, A.K.; Shah, T.R.; Khosa, A.A.; Ali, H.M. Evaluation of Wind Load Effects on Solar Panel Support Frame: A Numerical Study. Eng. Anal. Bound. Elem. 2023, 153, 88–101. [Google Scholar] [CrossRef]
- Bhalkar, A.; Wadekar, A.; Wagh, M.; Dengle, S. Issues, Challenges, and Current Lacunas in Design and Installation of Ground Mounted Solar PV Module Mounting Structure (MMS). Mater. Today Proc. 2022, 58, 128–134. [Google Scholar] [CrossRef]
- New Energy and Industrial Technology Development Organization (NEDO). Design Guidelines for Ground-Mounted Photovoltaic Power Systems. 2019. Available online: https://www.nedo.go.jp/content/100895022.pdf (accessed on 4 April 2025). (In Japanese).
- New Energy and Industrial Technology Development Organization (NEDO). Design Guidelines for Ground-Mounted Photovoltaic Power Systems. 2025. Available online: https://www.nedo.go.jp/content/800023895.pdf (accessed on 1 June 2025). (In Japanese).
- New Energy and Industrial Technology Development Organization (NEDO). Design Guidelines for Ground-Mounted Photovoltaic Power Systems -Technical Reference Document. 2019. Available online: https://www.nedo.go.jp/content/100895023.pdf (accessed on 4 April 2025). (In Japanese).
- New Energy and Industrial Technology Development Organization (NEDO). Structural Design Examples for Ground-Mounted Photovoltaic Power Systems—Steel Mounting Structure. 2019. Available online: https://www.nedo.go.jp/content/100895024.pdf (accessed on 4 April 2025). (In Japanese).
- New Energy and Industrial Technology Development Organization (NEDO). Structural Design Examples for Ground-Mounted Photovoltaic Power Systems—Aluminum Mounting Structure. 2019. Available online: https://www.nedo.go.jp/content/100895025.pdf (accessed on 4 April 2025). (In Japanese).
- Okuji, M.; Iijima, T.; Tamura, R.; Takamori, K.; Watanabe, K. Robust and Stable Mounting Structures and Foundations for Solar PV Systems; Ohmsha: Tokyo, Japan, 2021. [Google Scholar]
- New Energy and Industrial Technology Development Organization (NEDO). Design and Construction Guidelines for Solar PV Systems Installed on Sloped Terrain. 2025. Available online: https://www.nedo.go.jp/content/800023901.pdf (accessed on 1 June 2025). (In Japanese).
- Su, X.; Li, Z.; Wang, Q.; Li, J.; Xie, X.; Mao, X.; Ren, Z.; Liu, J. Comparison and Optimization of Bearing Capacity of Three Kinds of Photovoltaic Support Piles in Desert Sand and Gravel Areas. Buildings 2024, 14, 2559. [Google Scholar] [CrossRef]
- New Energy and Industrial Technology Development Organization (NEDO). Design and Construction Guidelines for Solar PV Systems Installed on Sloped Terrain—Technical Reference Document: Overview of Test Results on the Load-Bearing Capacity of Piles on Sloped Terrain. 2023. Available online: https://www.nedo.go.jp/content/100960268.pdf (accessed on 4 April 2025). (In Japanese).
- New Energy and Industrial Technology Development Organization (NEDO). Design and Construction Guidelines for Solar PV Systems Installed on Sloped Terrain—Technical Reference Document: Field Survey Results on Soil Erosion on Sloped Terrain. 2023. (In Japanese). Available online: https://www.nedo.go.jp/content/100960269.pdf (accessed on 4 April 2025). (In Japanese).
- Agarwal, A.; Irtaza, H.; Ahmad, M.J. Numerical Analysis of the Ground-Mounted Solar PV Panel Array Mounting Systems Subjected to Basic Wind for Optimum Design. Can. J. Civ. Eng. 2021, 48, 656–668. [Google Scholar] [CrossRef]
- Mathew, A.; Biju, B.; Mathews, N.; Pathapadu, V. Design and Stability Analysis of Solar Panel Supporting Structure Subjected to Wind Force. Int. J. Eng. Res. Technol. (IJERT) 2013, 2, 559–565. Available online: https://www.ijert.org/research/design-and-stability-analysis-of-solar-panel-supporting-structure-subjected-to-wind-force-IJERTV2IS120210.pdf (accessed on 1 June 2025).
- Barbón, A.; Bayón-Cueli, C.; Bayón, L.; Carreira-Fontao, V. A Methodology for an Optimal Design of Ground-Mounted Photovoltaic Power Plants. Appl. Energy 2022, 314, 118881. [Google Scholar] [CrossRef]
- JIS H 4100:2015; Aluminium and Aluminium Alloy Extruded Profiles. Japanese Standards Association: Tokyo, Japan, 2015. (In Japanese)
- JIS C 8955:2017; Load Design Guide on Structures for Photovoltaic Array. Japanese Standards Association: Tokyo, Japan, 2017. (In Japanese)
- Architectural Institute of Japan (AIJ). Structural Design Standards for Aluminum Structures in Building Construction—With Commentary; Maruzen Publishing Co., Ltd.: Tokyo, Japan, 2012. (In Japanese) [Google Scholar]
- JIS Z 2241:2011; Metallic Materials-Tensile Testing-Method of Test at Room Temperature. Japanese Standards Association: Tokyo, Japan, 2011. (In Japanese)
- Architectural Institute of Japan (AIJ). AIJ Recommendations for Stability Design for Steel Structure; Maruzen Publishing Co., Ltd.: Tokyo, Japan, 2018. (In Japanese) [Google Scholar]
- JIS G 3101:2015; Rolled Steels for General Structure. Japanese Standards Association: Tokyo, Japan, 2015. (In Japanese)
- Architectural Institute of Japan (AIJ). AIJ Standard for Allowable Stress Design of Steel Structures; Maruzen Publishing Co., Ltd.: Tokyo, Japan, 2019. (In Japanese) [Google Scholar]
- SAP 2000, Version 24.2.0; Computers and Structures, Inc.: Boulevard, CA, USA, 2023.
- Mikami, H.; Furukawa, S.; Okuji, T.; Takamori, K.; Taniguchi, T. Wind Resistance of a Solar Panel Mounting Structure with Partially Defective Pile Foundations. In Proceedings of the Third International Conference on Sustainable Civil Engineering and Architecture (ICSCEA2023), Da Nang City, Vietnam, 21–22 July 2023. [Google Scholar]
- Furukawa, S.; Mikami, H.; Okuji, T.; Takamori, K. Examination of Measurement Effect on Wind Resisting Performance of a Solar Panel Mounting Structure with Partially Defective Pile Foundations. In Proceedings of the 14th International Conference on GEOMATE 2024, Pattaya, Thailand, 13–15 November 2024. [Google Scholar]
- New Energy and Industrial Technology Development Organization (NEDO). Design and Construction Guidelines for Solar PV Systems Installed on Sloped Terrain—Technical Reference Document: Wind Resistance Test of Mounting Structures for Photovoltaic Systems (in Cases with Partially Insufficient Pile Foundation Capacity). 2024. Available online: https://www.nedo.go.jp/content/100960272.pdf (accessed on 4 April 2025). (In Japanese).


| (a) | (b) | ||||
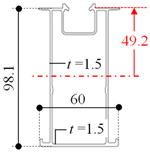 | A 1 [mm2] | 560.8 | 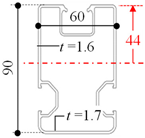 | A [mm2] | 645.3 |
| I 2 [mm4] | 757,686.70 | I [mm4] | 658,906.90 | ||
| Ztop 3 [mm3] | 15,212.20 | Ztop [mm3] | 14,857.80 | ||
| Zbottom 4 [mm3] | 15,095.70 | Zbottom [mm3] | 14,433.10 | ||
| x 5 [mm] | 49.2 | x [mm] | 44 | ||
| (c) | (d) | ||||
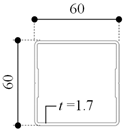 | A [mm2] | 466.7 |  | A [mm2] | 288.9 |
| I [mm4] | 243,799.90 | I [mm4] | 78,610.80 | ||
| Z [mm3] | 8126.7 | Z [mm3] | 3930.5 | ||
| Specimen | Bending Orientation 3 | Insert Length [mm] | Number of Test Specimens | |
|---|---|---|---|---|
| Rail (no extension joint) | Negative | NAN | 1 | |
| Positive | 3 2 | |||
| With extension joint | Screwed joint O (original 1) | Negative | 250 mm | 1 |
| Positive | 3 | |||
| Screwed joint | Negative | 400 mm | 1 | |
| Positive | 3 | |||
| Bolted joint | Positive | 3 | ||
| Bonded joint | Positive | 2 | ||
| Bolted and boned joint | Positive | 3 | ||
| 1 Rail extension joint used in Specimen I, as described in Section 2. 2 One out of the three specimens was excluded from further analysis due to local deformation accompanied by torsion. 3 Bending orientation is defined as follows: | ||||
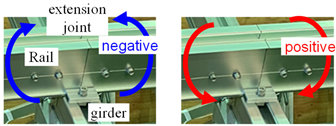 | ||||
| Young’s Modulus E [N/mm2] | Yield Stress σry [N/mm2] | Tensile Stress σru [N/mm2] | |
|---|---|---|---|
| Web | 61,700 | 238 | 268 |
| Flange | 60,300 | 235 | 262 |
| Specimen | Pressure Direction | Improvement Measure | Loading Type | Support Condition | Measurement Plan |
|---|---|---|---|---|---|
| II | uplift pressure | EW braces to resist the uplift of unanchored column bases | Elastic (up to 500 Pa) | A | Figure 7 |
| Elastic—Fracture | B | ||||
| III | Rails with improved, extended joints | Elastic (up to 500 Pa) | A | ||
| Elastic—Fracture | B | ||||
 | |||||
| Design Yield Stress σray [N/mm2] | Young’s Modulus E [N/mm2] | Yield Stress σry [N/mm2] | Tensile Stress σru [N/mm2] | ||
|---|---|---|---|---|---|
| Rail 1 | Web | 205 [24] | 61,700 | 238 | 268 |
| Flange | 60,300 | 235 | 262 | ||
| Girder 1 | Web | 65,800 | 265 | 290 | |
| Flange | 66,900 | 265 | 287 | ||
| Column 1 | 65,670 | 271 | 298 | ||
| NS brace 1 | 47,000 | 206 | 228 | ||
| EW brace 2 (Specimen II) | 205 [28] | 210,000 | 358 | - | |
| (a) | |||||
| Member | Type Of Force | Bending Orientation | Yield 2 | Ultimate 2 | Failure Mode |
| rail 1 | Bending moment MR,u+ | positive | 2.1 (1.9) | 3.2 (2.8) | Local buckling |
| Bending moment MR,u− | negative | 2.1 (1.9) | 3.4 (3.1) | ||
| girder 1 | Bending moment MG,u+ | positive | 1.9 (1.6) | 3.2 (2.7) | |
| Bending moment MG,u− | negative | 1.9 (1.6) | 2.9 (2.4) | ||
| (b) | |||||
| Joint Part | Type of Force | Bending Orientation | Ultimate | Failure Mode | |
| column base 3 | Pull-out force NBase,u | - | 19.4 | Edge tear failure of the base joint bracket | |
| rial fixing clamp 4 | Pull-out force NRC,u | - | 11.0 | Shear failure of the bottom rib | |
| rail extended joint | Original 5 (insert length of 250 mm) | Bending moment MRJo,u+ | positive | 1.3 | Bearing-induced flange splitting failure |
| Bending moment MRJo,u− | negative | 2.5 | |||
| Improved 5 (insert length of 400 mm) | Bending moment MRJi,u− | positive | 3.3 | Splitting failure of the insert | |
| Joint | Panel Fixing Clamp | Rail Fixing Clamp | Girder-Column Joint | Girder-NS Brace Joint | ||||||||||||||||||||
|---|---|---|---|---|---|---|---|---|---|---|---|---|---|---|---|---|---|---|---|---|---|---|---|---|
| Symbol | LL1 | LL2 | LL3 | LS | ||||||||||||||||||||
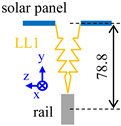 | 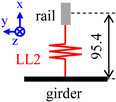 |  | 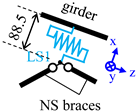 | |||||||||||||||||||||
| Local axis | x | y | z | θx | θy | θz | x | y | z | θx | θy | θz | x | y | z | θx | θy | θz | x | y | z | θx | θy | θz |
| DOF 1 | 1 | 1 | 1 | 1 | 0 | 0 | 1 | 1 | 0 | 0 | 0 | 0 | 1 | 1 | 1 | 1 | 1 | 1 | 1 | 1 | * 2 | 1 | 1 | 1 |
Disclaimer/Publisher’s Note: The statements, opinions and data contained in all publications are solely those of the individual author(s) and contributor(s) and not of MDPI and/or the editor(s). MDPI and/or the editor(s) disclaim responsibility for any injury to people or property resulting from any ideas, methods, instructions or products referred to in the content. |
© 2025 by the authors. Licensee MDPI, Basel, Switzerland. This article is an open access article distributed under the terms and conditions of the Creative Commons Attribution (CC BY) license (https://creativecommons.org/licenses/by/4.0/).
Share and Cite
Furukawa, S.; Mikami, H.; Okuji, T.; Takamori, K. Failure Behavior of Aluminum Solar Panel Mounting Structures Subjected to Uplift Pressure: Effects of Foundation Defects. Solar 2025, 5, 33. https://doi.org/10.3390/solar5030033
Furukawa S, Mikami H, Okuji T, Takamori K. Failure Behavior of Aluminum Solar Panel Mounting Structures Subjected to Uplift Pressure: Effects of Foundation Defects. Solar. 2025; 5(3):33. https://doi.org/10.3390/solar5030033
Chicago/Turabian StyleFurukawa, Sachi, Hiroki Mikami, Takehiro Okuji, and Koji Takamori. 2025. "Failure Behavior of Aluminum Solar Panel Mounting Structures Subjected to Uplift Pressure: Effects of Foundation Defects" Solar 5, no. 3: 33. https://doi.org/10.3390/solar5030033
APA StyleFurukawa, S., Mikami, H., Okuji, T., & Takamori, K. (2025). Failure Behavior of Aluminum Solar Panel Mounting Structures Subjected to Uplift Pressure: Effects of Foundation Defects. Solar, 5(3), 33. https://doi.org/10.3390/solar5030033