Article

Optical Characterization of a New Facility for Materials Testing under Concentrated Wavelength-Filtered Solar Radiation Fluxes

by
Noelia Estremera-Pedriza
,
Jesús Fernández-Reche
*,† and
Jose A. Carballo
CIEMAT–Plataforma Solar de Almería, P.O. Box 22, E-04200 Tabernas-Almería, Spain
*
Author to whom correspondence should be addressed.
These authors contributed equally to this work.
Solar 2023, 3(1), 76-86; https://doi.org/10.3390/solar3010007
Submission received: 30 November 2022 / Revised: 5 January 2023 / Accepted: 24 January 2023 / Published: 1 February 2023

Abstract

:
The materials used to manufacture solar receivers for tower power plants must withstand high fluxes of concentrated solar radiation (from 0.1 to even 1.5 MWm 2 ) and operate at high operating temperatures (>800 °C). Durability is a key aspect in these systems, which must be ensured under these demanding operating conditions, which also include daily heating–cooling cycles throughout the lifetime of these power plants. So far, to the authors’ knowledge, which wavelengths of concentrated solar radiation have the greatest influence on the mechanisms and speed of aging of materials used in solar receivers has not been analyzed. Yet, such an analysis is pertinent in order to implement strategies that delay or inhibit such phenomena, and, thus, increase the durability of central tower systems’ receivers. To perform such analyses, a new solar furnace was recently designed and installed at the Plataforma de Almería (Spain). This paper describes the components of this new solar furnace. The components are as follows: a heliostat to redirect the direct solar radiation towards a Fresnel lens that concentrates the solar radiation on the material under study, a shutter that allows varying the amount of concentrated solar radiation incident on the Fresnel lens, and reflective filters with selective reflectance that are placed between the Fresnel lens and the material. This paper also describes the procedure and the first results of the energetic and spectral characterization of this new solar furnace. The first experimental results of the characterization of this new test bed using the heliostat and the Fresnel lens showed that concentration ratios of up to 1000 suns (1 sun = 1000 Wm 2 ) could be achieved. Furthermore, the paper presents the results of the spectral characterization of the test system, using selective reflectance mirrors in the near-visible–IR wavelength range (400–1125 nm) and in the visible–IR red region (700–2500 nm).

1. Introduction

In recent years, a number of important global developments have highlighted the need for countries to increasingly reduce their energy dependence on other countries. The generation of solar thermal energy, and of any type of renewable energy, in general, avoids the importing of oil and other fossil fuels from third countries, thus reducing high energy dependence [1]. Spain currently has 50 concentrated solar power plants in operation with a total of 2300 MW of installed power capacity [2]. Quick growth of the technology is expected, supported by technical improvements, as well as benefiting from the stronger political support the decarbonization scenario of the last few years [3] has engendered.
Solar thermal power plants, and, in particular, tower, or central receiver, power plants, have great potential for generating electricity, and they have the great advantage that the heat they produce in the receiver can be easily stored, so they can generate electricity on cloudy days or at night. One of the reasons why there are not more solar thermal tower power plants is because they need to improve their efficiency to meet energy demand. This can be done in two ways: either by increasing the heat transfer fluid temperature and, therefore, by increasing solar radiation concentration, or by reducing the costs associated with the components of such installations [4]. However, the materials used in the receivers of tower solar thermal power plants, and, specifically, those made of metal tubes, reach very high temperatures (>800 °C) and endure high fluxes of concentrated solar radiation (>1000 kWm 2 ), so increasing the temperature at the solar receiver is not an easy task. The materials age quickly and last a relatively short time. Hence, it is vital to study these materials so to understand their behavior under concentrated solar radiation in the long term [5].
Improving the durability of these materials, together with increasing the efficiency in the conversion of concentrated solar radiation into heat, would contribute to making solar thermal energy more efficient and economical, as well as more durable [6].
To investigate these aspects of material behavior under concentrated solar radiation, a new testing platform at the Plataforma Solar de Almería (PSA) has been set up, which is able to both reach very high solar concentrated radiation and increase the material’s temperature beyond 800 °C. The new facility, that uses Fresnel lenses, as well as a selective reflectance mirror, contributes to the characterization of outdoor materials [7], with the particularity allowing active selection of the wavelength range of the impinging radiation on material samples [8].
Section 2 of this article includes a description of the new testing facility components, as well as a description of the methods used for the optical characterization of its components, individually and as a whole. Section 3 includes the results of the optical characterization carried out, with a complete discussion of the results. Finally, the article closes with the conclusions drawn from the present analysis, as well as planned future work at the facility.

2. Materials and Methods

A new facility is currently being commissioned at the PSA to facilitate investigation of the influence of wavelength on the characterization and aging of materials subjected to high fluxes of concentrated solar radiation [9] and high temperatures (>1 MWm 2 and >800 °C respectively), such as metallic nickel alloys like Alloy 625, SiC, etc, which are used in the manufacture of receivers in solar thermal tower power plants. Material aging is a key concern in solar tower receivers as high performance us required to increase the efficiency of the system and its durability.
The new designed and built test facility is a solar furnace composed of a 12 m 2 flat heliostat located 10 m on the north side, far away from a container divided into two areas. One area of the container is a small control room and the second area is the main test room, where there is a Fresnel lens that concentrates the solar radiation on the focal plane where a secondary mirror is placed that focuses on the focal spot located on a test table. Any material sample to be tested is positioned on the test table. The system is completed with a cooling system to control the operating conditions during the experiments. A scheme of the new solar furnace is shown in Figure 1.
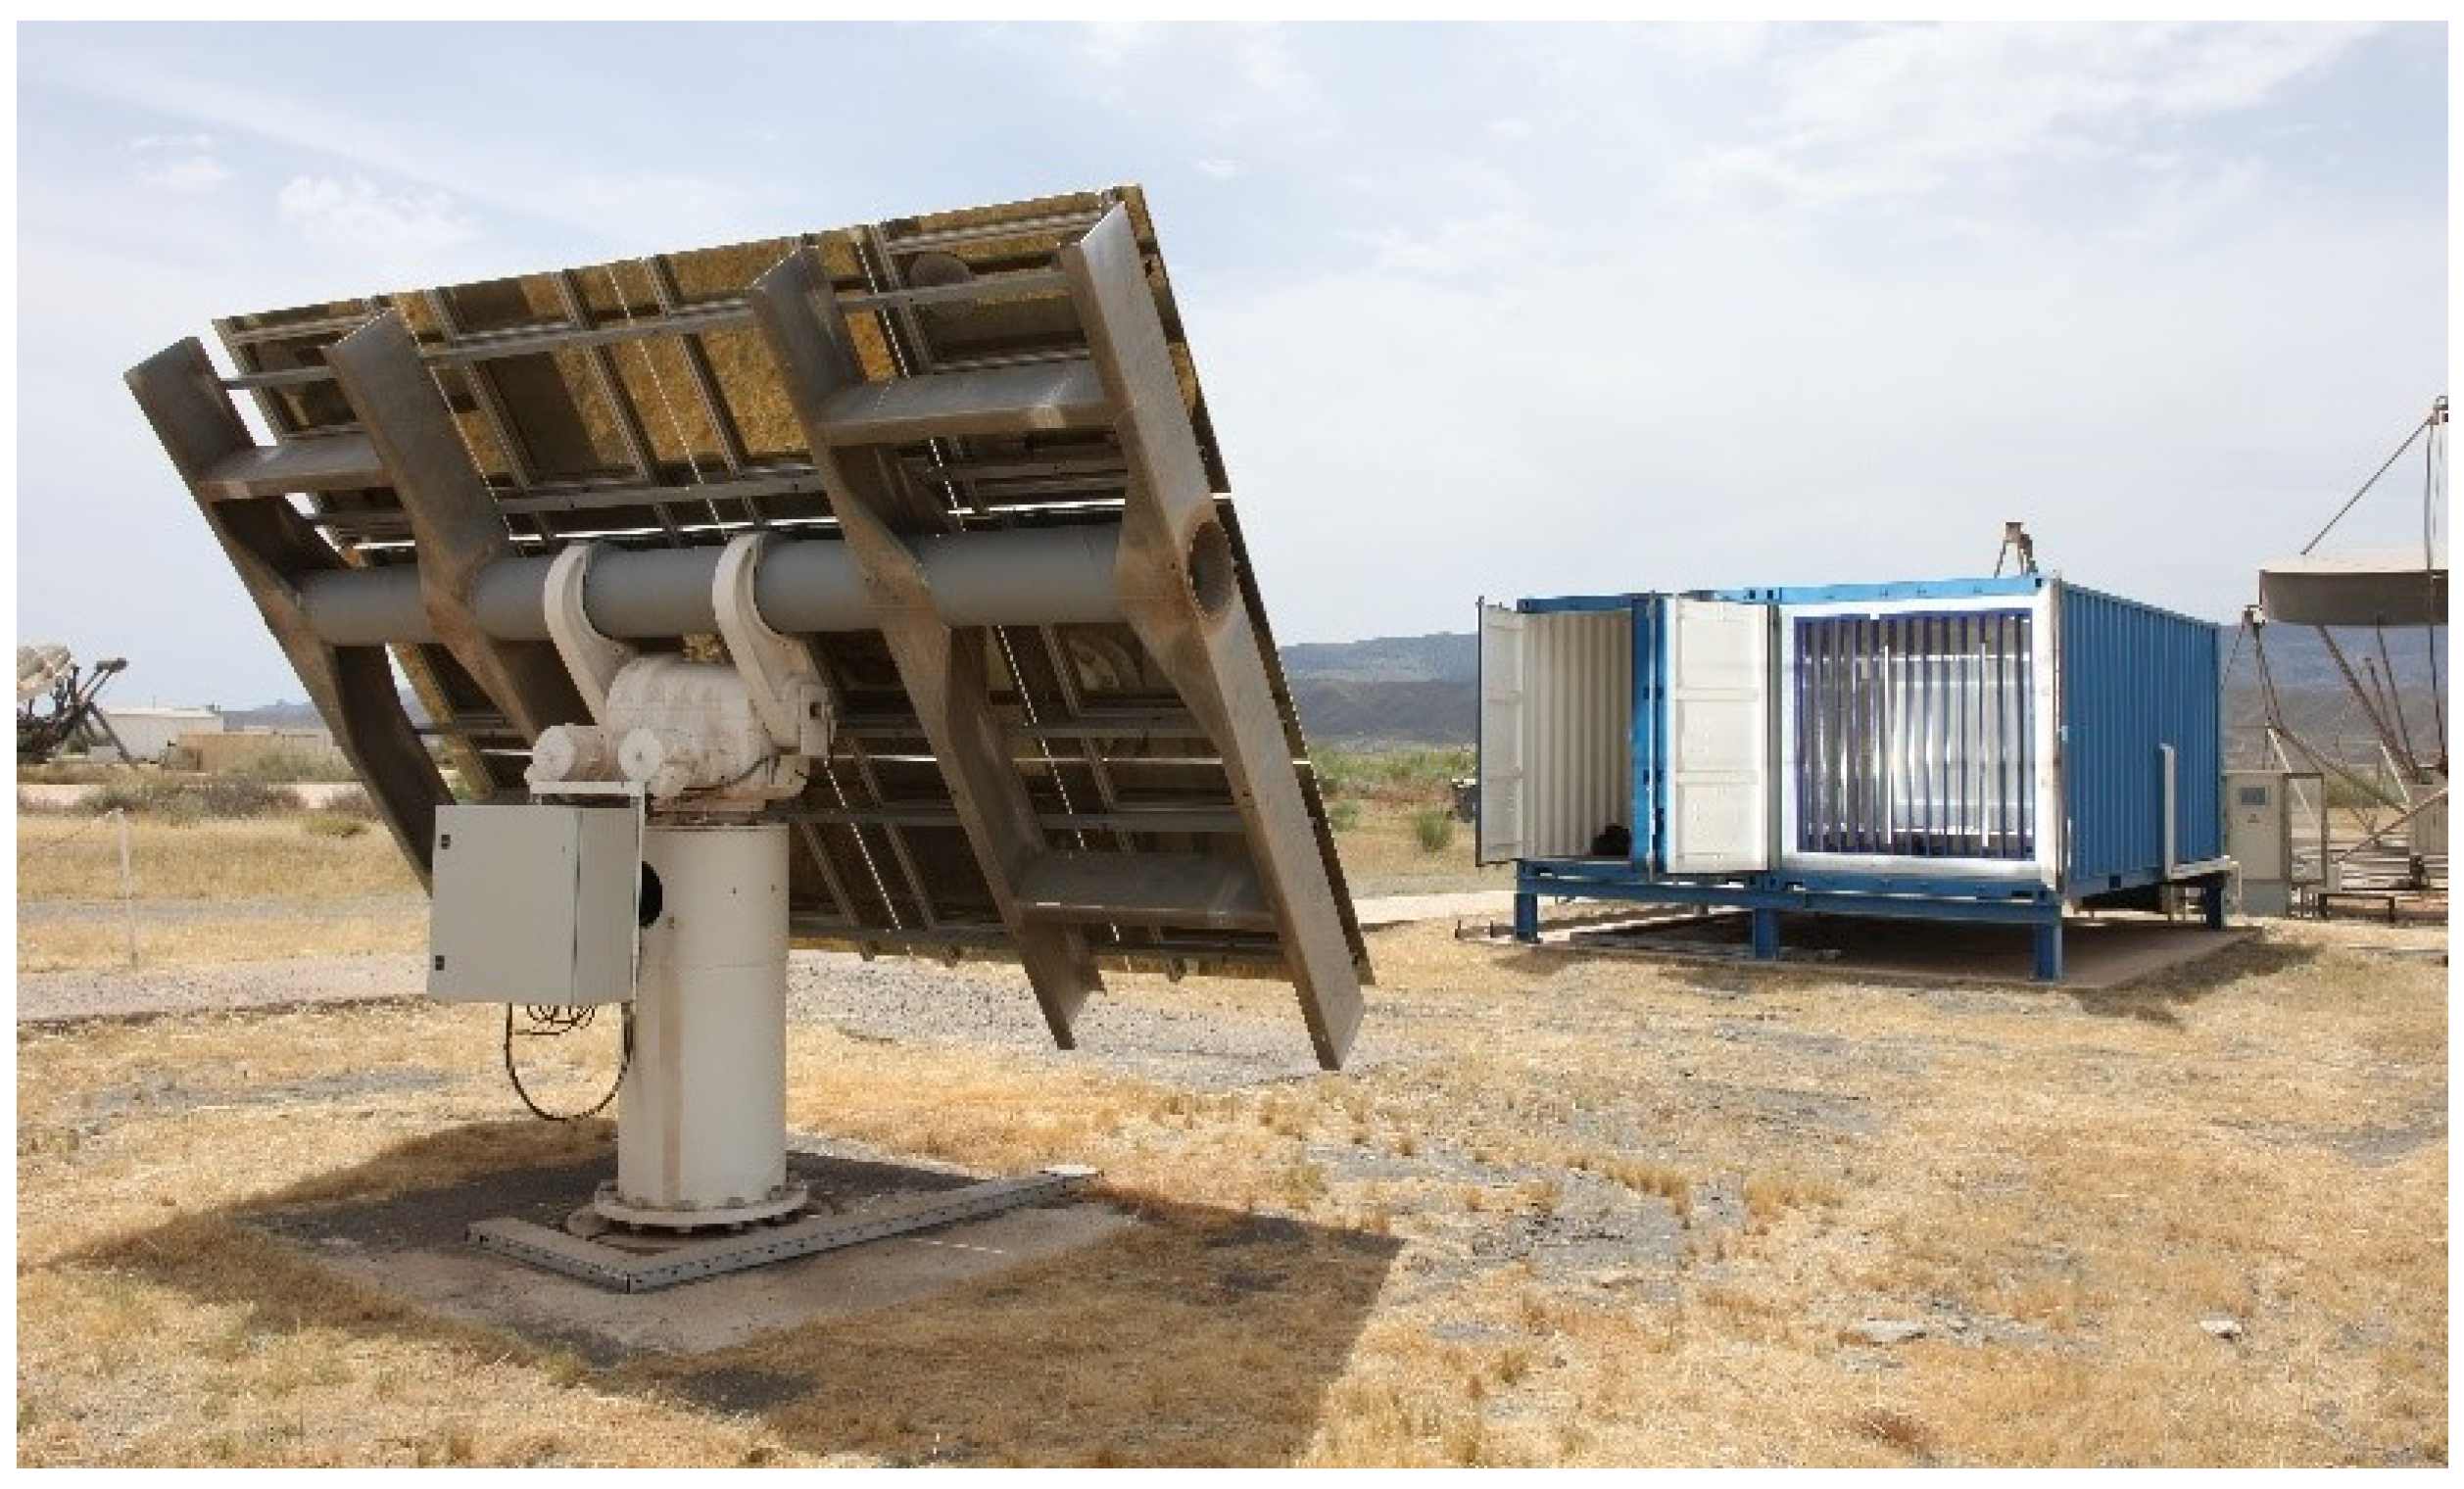
Figure 2 shows the actual deployment of the facility under operation where the heliostat is redirecting the solar radiation to the solar furnace aperture, where it passes through the completely open shutter placed on the northern wall of the test room (blue container). The rest of the components (i.e., Fresnel lens, mirrors, ) are located inside this test room, as illustrated in Figure 1).
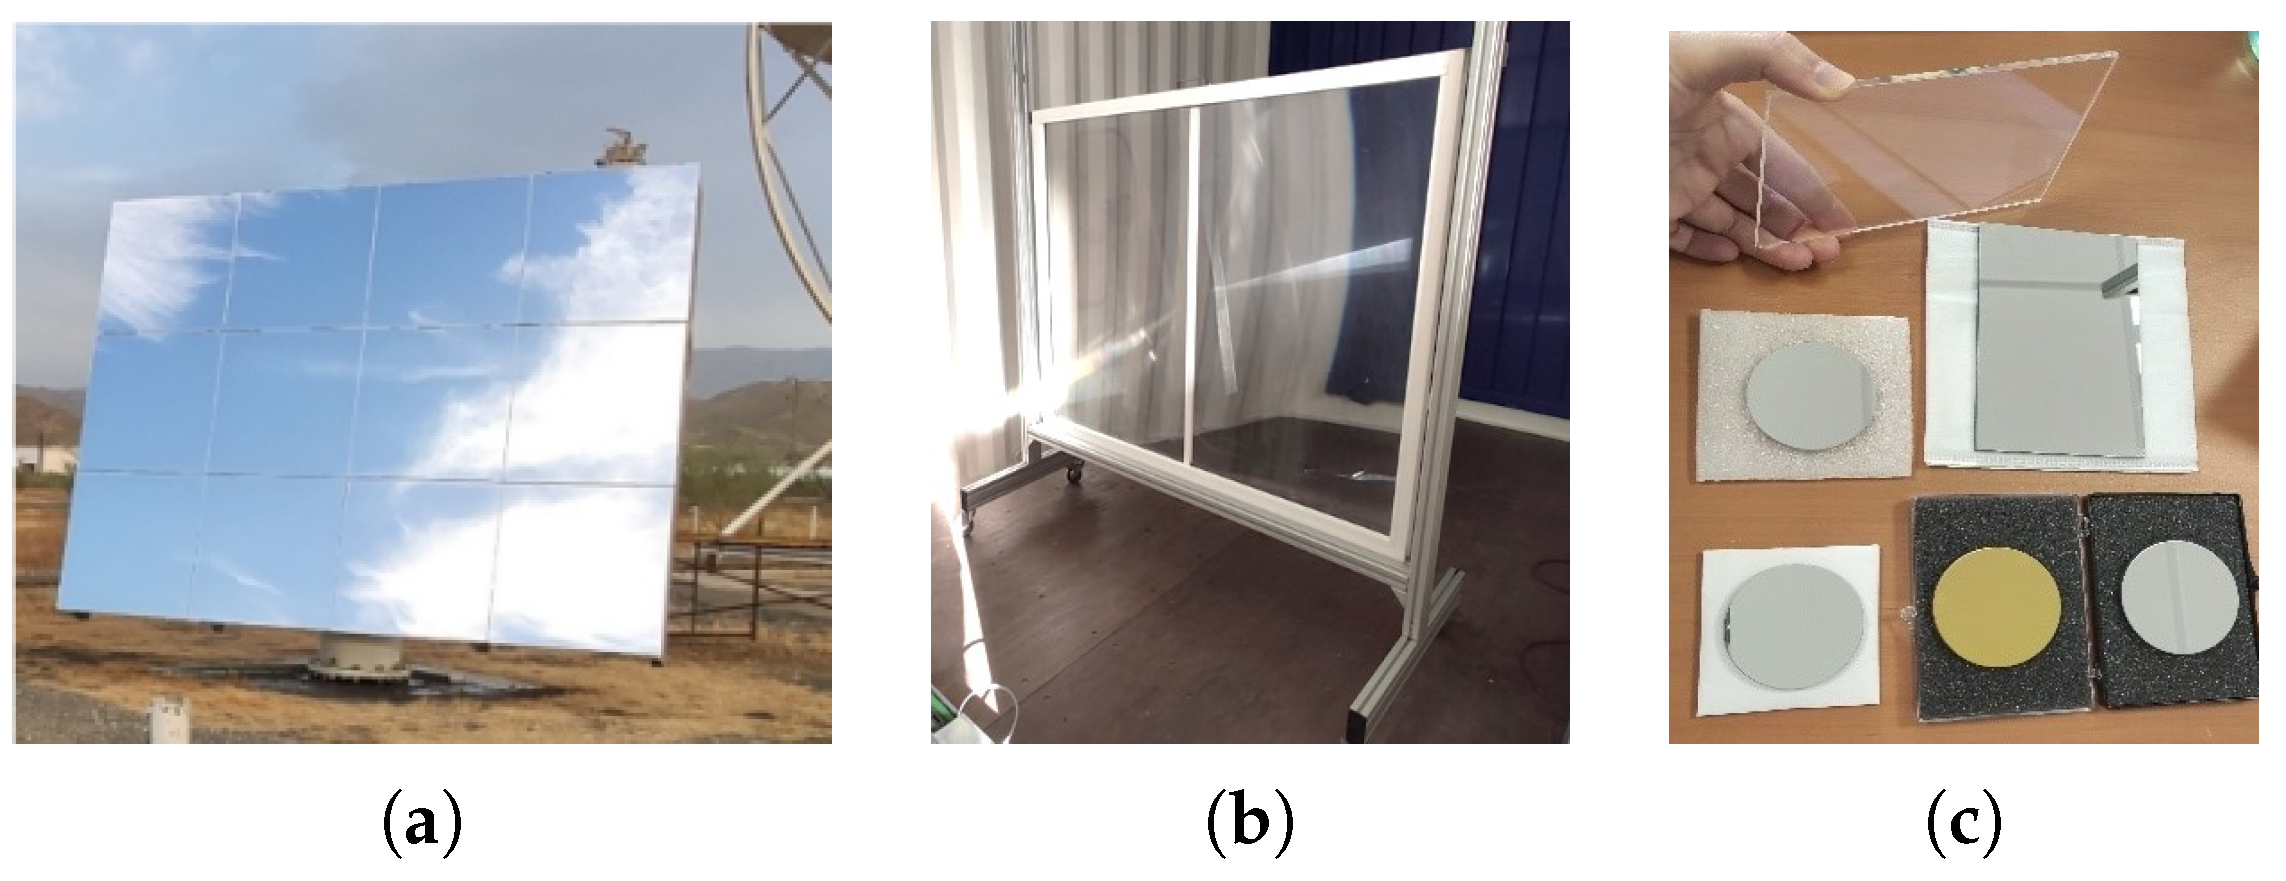
Figure 3 shows the optical components of the facility: the heliostat, which was manufactured at PSA, the Fresnel lens [10], and several selective spectral reflectance mirrors. These mirrors allow the filtering of specific wavelength bands of the solar spectrum to be incident on the material, making it possible to analyze the influence of wavelength on the aging of the material [11].
The heliostat (Figure 3a), which is responsible for following the sun throughout the day and reflecting the solar radiation to the aperture plane of the Fresnel lens (Figure 3b), located inside the test room, presents an area of 12 m 2 (3 × 4 m). It is composed of 12 flat mirror facets, manufactured by Guardian Glass, each sized 1 m 2 , with an average solar specular reflectance of 0.956. This specular reflectance was measured with a Devices & Services Portable Specular Reflectometer Model 15R–USB [12]. This specular reflectometer is able to measure the specular reflectance of a reflecting surface with an uncertainty of 1.5%.
The Fresnel lens is the optical component in this test bed, responsible for concentrating the solar radiation reflected by the heliostat on the focal plane. The Fresnel lens needs to be optically characterized for the following: the focal length of the lens, the concentration ratio and the size of the focal spot at the focal plane of the lens, defined by the radius of the circle containing 90% of the energy measured in the focal plane.
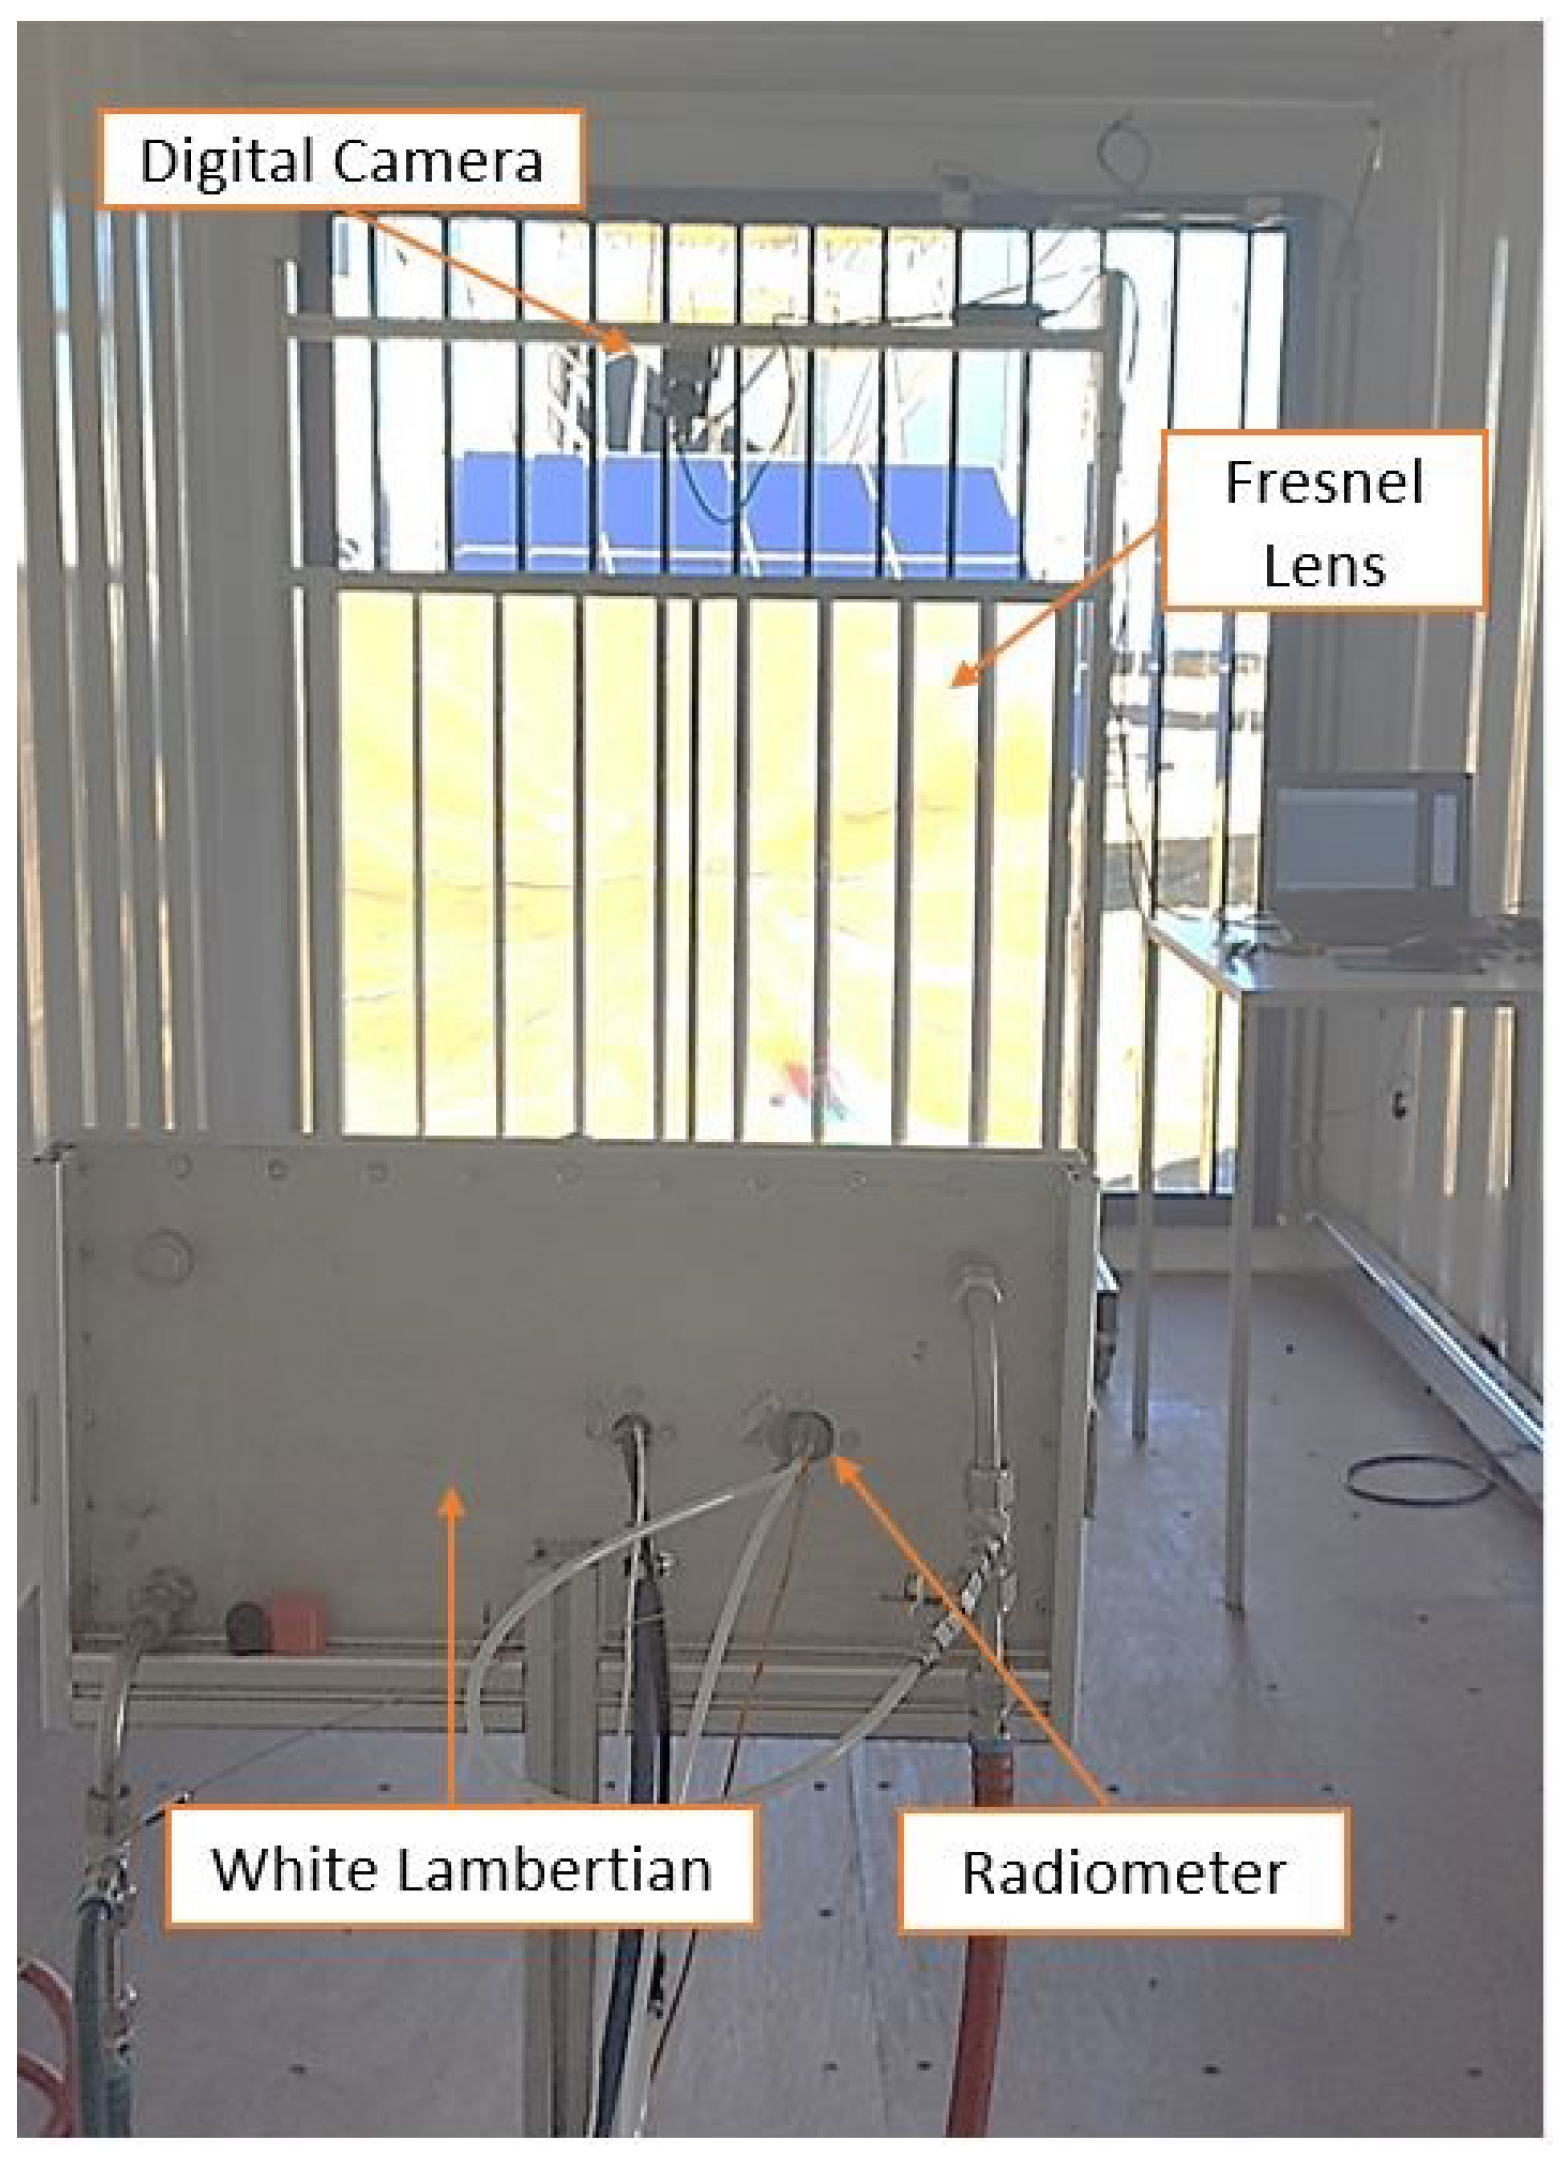
For this characterization, a Lambertian target [13], equipped with a radiometer, a CMOS camera and a data acquisition system, was used. The main characteristics of each of the components of the measurement system are described below [14]:
  • The Lambertian target consists of a flat aluminum plate coated by means of thermal sputtering with alumina ( A l 2 O 3 ), which gives it the required Lambertian properties (very high diffuse reflectance). In order to avoid excessive heating of the device, the Lambertian target is cooled by a closed water circuit and, thus, it can withstand solar fluxes above 2000 kWm 2 .
  • The digital camera used is a Hamamatsu Orca Flash 4.0. V2 16–bits Digital CMOS camera C11440–22CU. In order to prevent the images from being overexposed to excess light, an ND7 neutral optical density filter was used.
  • Radiometer. A large 1″ diameter Radiometer with zynolyte coating was installed on the Lambertian target. The radiometer is used to transform the illumination levels of the Lambertian target captured by the CMOS camera into physical power units, and, therefore, it is necessary to calibrate the camera/filter/Lambertian target assembly. The radiometer used is of the water-cooled Gardon type and its measurement is based on a copper–constantan differential thermocouple transducer (Seebeck effect). The incident power on the sensor is proportional to the voltage generated. The accuracy of the radiometer used on the measurement system equals 3.0%
  • Data acquisition system. The radiometer signals, as well as those of the cooling water temperature control thermocouples, were acquired with a SIEMENS 1231 14 bits data acquisition card.
All the constitutive components of the measurement system are shown in Figure 4.

Fresnel Lens Characterization Method

Once everything is ready in the new Fresnel solar furnace, the shutter is opened, allowing solar radiation to concentrate on the Fresnel lens and to focus on the Lambertian target. The digital camera facing the Lambertian target takes a digital image of gray levels (brightness level) and the radiometer gives a point measurement of the incident power at that point of the Lambertian target in engineering units (kWm 2 ), with a simple linear correlation between the illumination level of each of the pixels of the image taken and the reading of the radiometer, we can extend the point measurement of incident power, taken with the radiometer, to the entire surface of the Lambertian target, and, thus, have a map of incident power from which we can calculate the total energy in that target. The line of adjustment to be obtained with the linear relationship between the gray level ( G L ) and the radiometer reading (H) has the following form:
H = A · G L
The parameter A of Equation (1) converts the illumination levels of the pixels of the images taken with the CMOS camera to physical units of incident radiation power (kWm 2 ). In this way, the rest of the energy calculations for the Fresnel lens can be performed in energy and power units.
The total incident energy on the measurement plane is calculated by summing the power measured on each of the specified surface elements (pixels), then multiplying by S, so that the effective measurement area (size of the image on the Lambertian target in mm) can be presented as in Equation (2):
E = S n i H i
where n are the surface elements in which this area has been divided in the image. On the other hand, the efficiency of the Fresnel lens is calculated as follows (Equation (3)):
η g r o s s = E G · S g r o s s
where G is the direct normal solar irradiance and S g r o s s is the gross aperture of the lens (including frames). In the same way, net efficiency can be defined as follows:
η n e t = E G · S n e t
where, in this case, S n e t is restricted to the useful aperture of the concentrator, removing all the structural elements that do not transmit solar radiation, such as the metal profile that separates the two parts of the lens. The Fresnel lens is formed by two halves that, by means of their radial blades, form a focus when solar radiation falls on the lens. The net and gross surfaces of the Fresnel lens are, respectively, 1.4 m 2 and 1.62 m 2 .
The gross total efficiency takes into account the area formed by the lens, together with the frame that contains it. It is the net efficiency that is of interest, since it represents the total efficiency only taking the Fresnel lens into account, without counting its frame. This net total efficiency represents the real efficiency of the Fresnel solar lens.

3. Results and Discussion

3.1. Fresnel Lens Characterization Results

The characterization of the Fresnel lens was performed on clear sky days and for both sides of the lens, since this lens reproduces focus in both directions. In this way, the lens can have two positions inside the Fresnel solar furnace:
  • Position #1: With the rough side facing the heliostat and the smooth side in focus towards the test table (characterization A).
  • Position #2: With the rough side facing the test table and the smooth side facing the heliostat (characterization B).
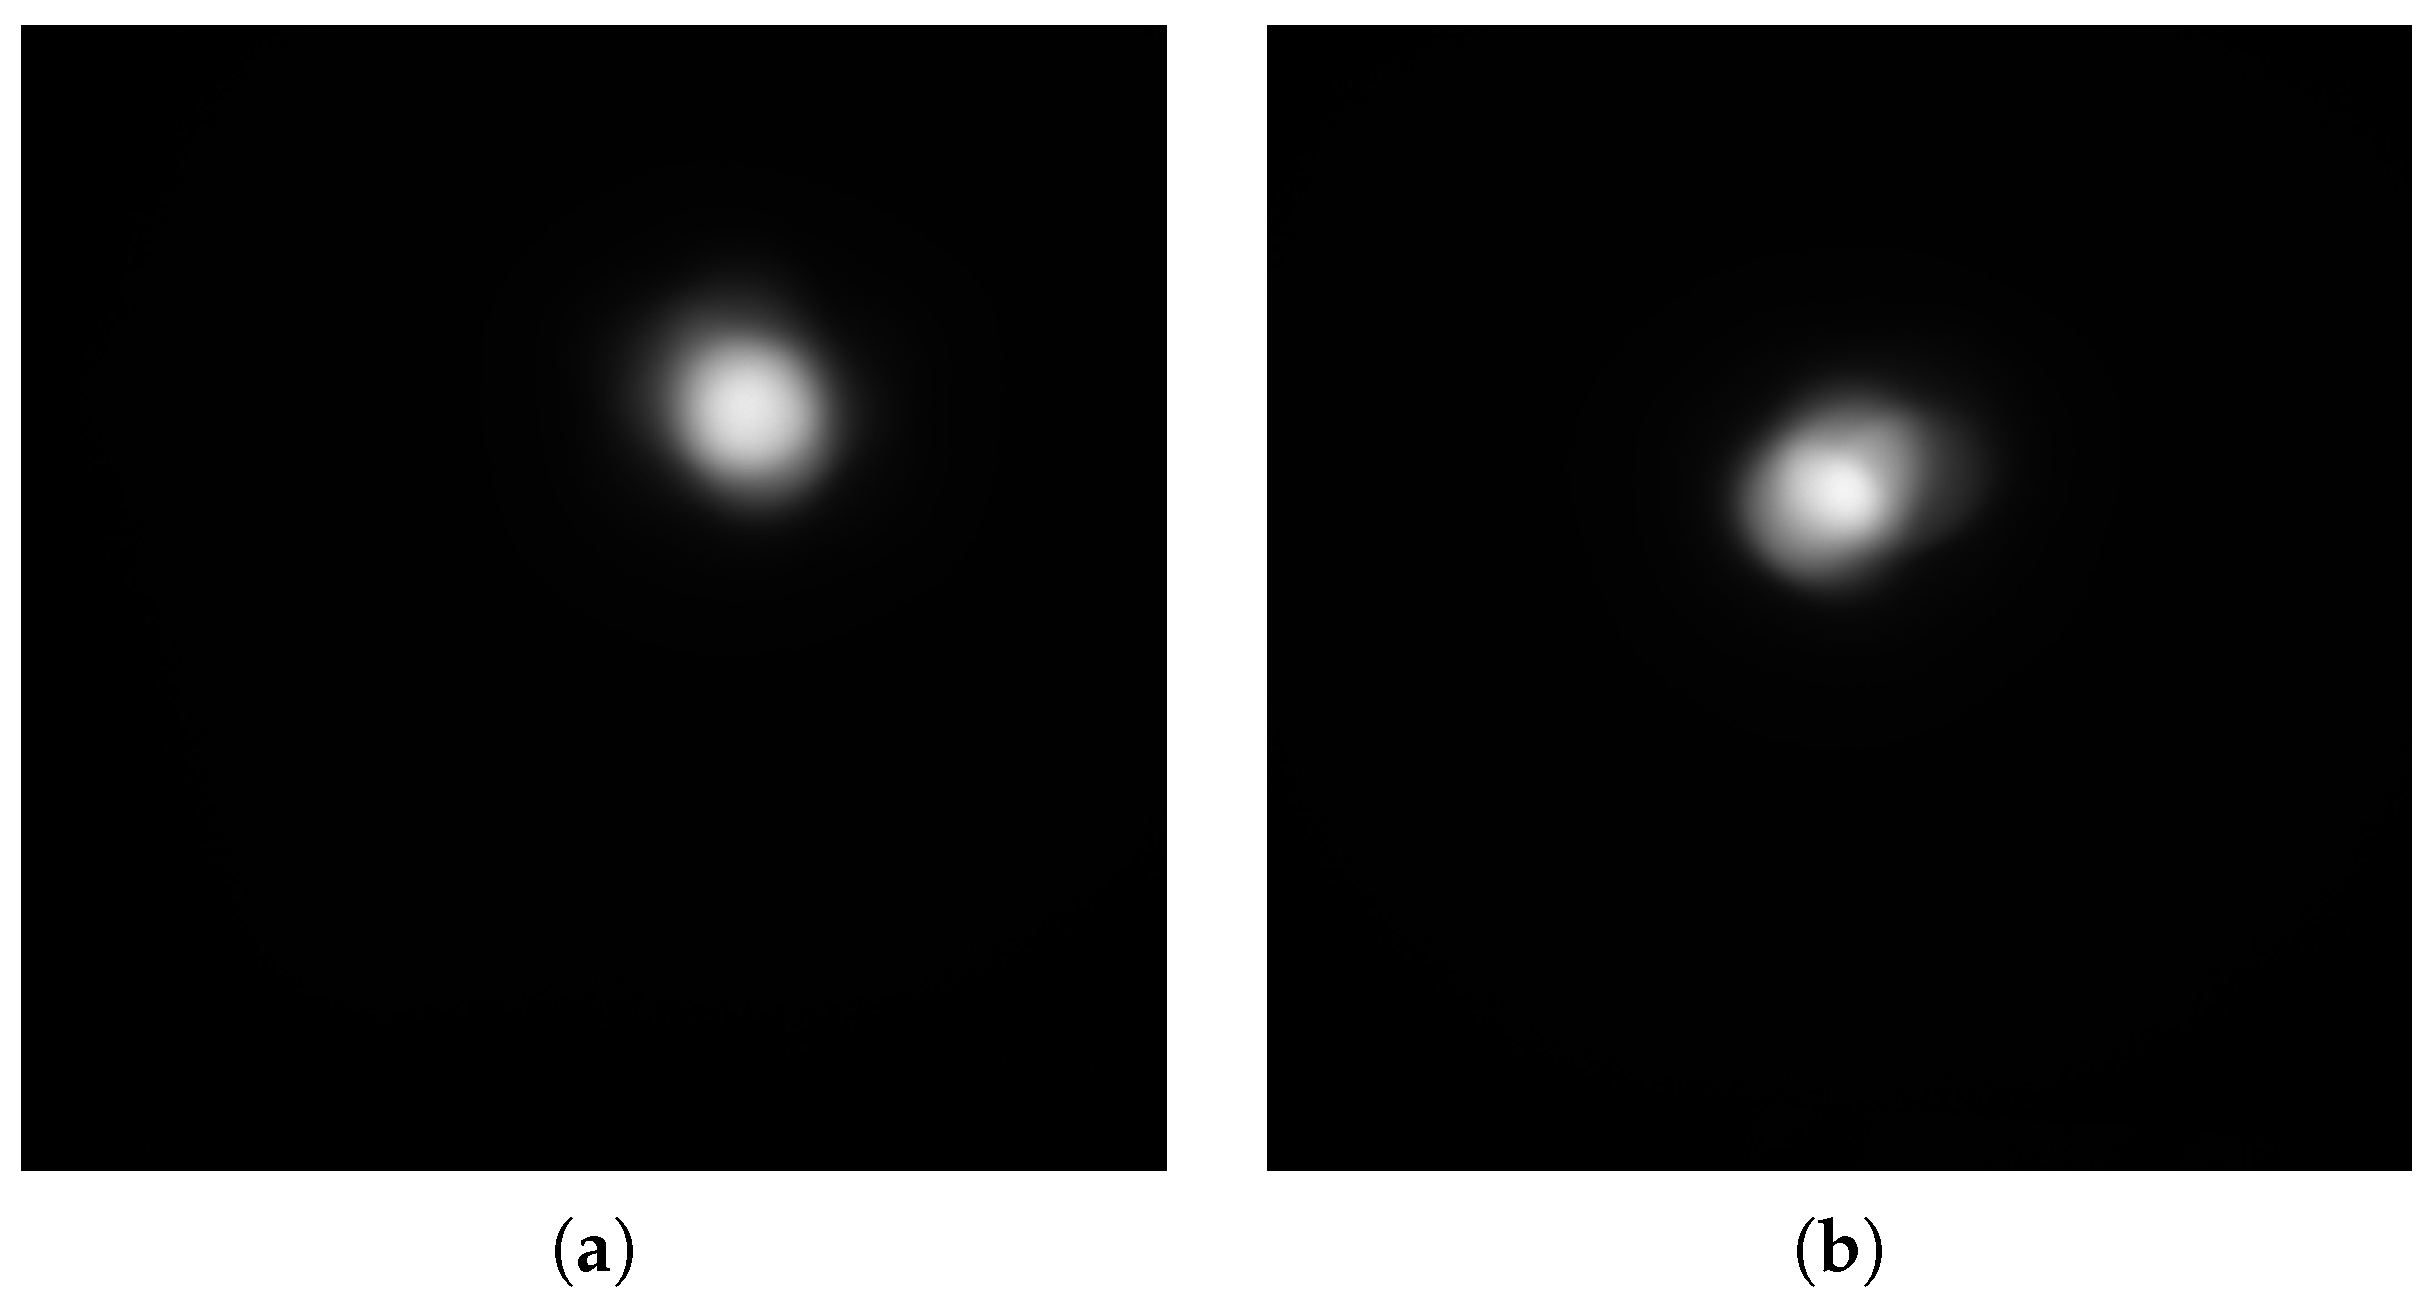
For each Fresnel lens position, so as to perform its characterization, several images were taken of the light spot on the Lambertian target at the corresponding focal distance for each position, defining different shutter apertures during the tests. Figure 5 shows two images for each one of the characterizations.
Figure 5a shows the concentrated solar radiation distribution at the focal plane that the Fresnel lens performed at position #1 (with the rough side facing the heliostat and the smooth side in focus towards the test table), with the shutter fully open. Figure 5b shows the concentrated solar radiation distribution with the Fresnel lens at position #2 (with the rough side facing the test table and the smooth side facing the heliostat), under the same testing conditions.
With these pictures, it is possible to establish a linear relation between the illumination of the images ( G L ) and incident power (H), calculating the slope of the linear fit for the experimental points obtained from the different images changing the shutter aperture of the solar furnace. Figure 6 shows the least squares fit of the experimental data for both characterizations (A and B).
With both slopes presented in Figure 6, for characterization A (red one) and characterization B (blue one), it is possible to calculate the total energy collected by the system at the focal plane, as well as the rest of the parameters that completely characterize the Fresnel lens. These results are shown in Table 1.
Figure 7 shows the calibrated figures of the incident solar flux distribution at focal plane for both characterizations.
The first thing to notice is that the optimal focal length for both characterizations was not the same. The optical focal length depended on how the Fresnel lens was arranged with respect to the heliostat and the test table. It can be seen in both cases that, although the focal spot radius containing the 90% energy was small (28.7 mm and 27.0 mm, respectively), the peak power of the full Fresnel lens was quite high for both characterizations (1086.7 kWm 2 for characterization A and 1134.9 kWm 2 for characterization B), as well as the net efficiency (0.92 and 0.94, respectively). Therefore, it could be expected that with either position #1 or #2 of the Fresnel lens, good results would be obtained by concentrating the solar radiation on the material to be tested.
However, in order to know the optimal focal length and arrangement between the two characterization positions of the Fresnel lens, and to see which was more interesting in terms of concentration ratio (C), the peak power obtained in Table 1 could be divided by the direct normal solar irradiance (G) and, thus, the energy concentration ratio of the Fresnel lens calculated. The results are included on Table 2 showing higher concentration at characterization position #2 i.e., the rough side of the Fresnel lens facing the test table and the smooth side focused towards the heliostat, with a focal distance of 3.56 m.

3.2. Characterization Results of Selective Spectral Reflectance Mirrors

For spectrally filtering the solar radiation, the facility is equipped with six mirrors with selective spectral reflectances. Table 3 shows the spectral characteristics and specifications of these selective reflectance mirrors [15].
The six mirrors were characterized in the OPAC laboratory of the PSA with a spectro–photometer to determine the solar hemispherical reflectance of each of them (Table 3). From the analysis, the mirrors that seemed most interesting, from the spectral point of view, were mirrors #3 and #6. As can be seen in Figure 8, the spectral reflectance of mirrors #3 and #6 appear, together with the irradiance of the standard solar AM 1.5 spectrum [16], to be those that modify/filter the solar spectrum in the wavelength bands below 625 nm, which are those that, according to previous studies [6], photooxidize the material the most.
Figure 9 shows the irradiance of the standard AM 1.5 solar spectrum, as well as the spectrum of the solar radiation reflected by mirrors #3 and #6, respectively, taking into account the fact that optical losses are attached to the curves, due to the heliostat mirrors ( 0.04 ), and to the transmissivity of the Fresnel lens ( 0.09 ). Thus, the spectrum curves shown in Figure 9 were those that finally affect the material to be tested.
As can be seen in Figure 9, mirror #3 (red curve) significantly reduced the ultraviolet and visible wavelengths, while keeping the infrared part of the solar spectrum unchanged. On the other hand, mirror #6 (blue curve) acted as a band-pass filter in the ultraviolet and near-infrared. Both mirrors would allow us to establish the dependence, if any, of the behavior of the materials under study on the wavelength of the solar spectrum.

4. Conclusions and Future Work

The results from the characterization process of the new solar furnace’s components showed consistent results according to the design. Two configurations of the Fresnel lens were analyzed, and one of them (characterization B), was the selected option for future experiments, as it presented a focal distance of 3.56 m and allowed a peak power of more than 1 MWm 2 with a total energy of 1.13 ± 0.03 kW (@DNI = 873.4 Wm 2 ) to be reached in the focal spot, with a net efficiency of 0.92. These values were consistent with initial specifications for the test bed.
In any case, it was also concluded that the optical characterization of the test bed should be performed any time a testing campaign is to be performed in the solar furnace, to ensure accurate results on aging tests of each specific material to be tested.
Taking into account the fact that materials suffer bigger photooxidation with short wavelengths (<625 nm) [5], it was demonstrated that mirror #3 (700–10,000 nm band) and mirror #6 (400–1125 nm band) were suitable to test and age the material samples, with the aim of analyzing their optical and thermal behaviors during their lifetimes, so as to estimate their durability. As shown in Figure 9, these mirrors significantly modified the profile of the concentrated solar radiation impinging on the material surface, which would very likely modify its microstructure.
Once all the components of the new solar furnace installed at PSA are characterized, the system is ready for testing and studying the aging mechanism of materials that are currently used, or are candidates for use, in receivers of commercial solar tower systems. Future work will begin with the analysis of samples of Nickel 625 alloy (Inconel 625), as it is one of the most used in tube receivers of solar tower systems [4].

Author Contributions

Conceptualization, J.F.-R. and N.E.-P.; methodology, J.F.-R. and N.E.-P.; software, N.E.-P., J.F.-R. and J.A.C.; validation, J.F.-R. and N.E.-P.; formal analysis, N.E.-P., J.F.-R. and J.A.C.; investigation, J.F.-R., N.E.-P. and J.A.C.; resources, J.F.-R.; data curation, N.E.-P., J.F.-R. and J.A.C.; writing—original draft preparation, N.E.-P., J.F.-R. and J.A.C.; writing—review and editing, N.E.-P., J.F.-R. and J.A.C.; visualization, J.F.-R.; supervision, J.F.-R.; project administration, J.F.-R.; funding acquisition, J.F.-R. All authors have read and agreed to the published version of the manuscript.

Funding

This research was funded by Ministerio de Ciencia e Innovación from the Spanish government, grant number ENE2017-83973-R (project SOLTERMIN).

Data Availability Statement

The data sets supporting reported results can be available upon request to the correspondence author.

Acknowledgments

The authors would like to thank the CIEMAT staff and the operation, maintenance and instrumentation teams of the PSA for their contribution to the project; in particular, Ginés García for his collaboration with the commissioning of the solar tracking system and María Gutiérrez; with the control system and components of the solar furnace, thank to Jose Liria and Jesús Valero, Jose Galindo, and other colleagues for their contribution to the construction and commissioning the Solar Fresnel Furnace. Also, to thank Tomás Jesús Reche for your help in the mirrors’ characterization.

Conflicts of Interest

The authors declare no conflict of interest.

Abbreviations

The following abbreviations are used in this manuscript:
AMAir Mass
AOIAngle Of Incidence
ASTMAmerican Society for Testing and Materials
CMOSComplementary metal-oxide semiconductor
DNIDirect Normal Irradiance
IRInfrared
NRELNational Renewable Energy Laboratory
OPACOptical Characterization and Durability Analysis of Solar Reflectors
PSAPlataforma Solar de Almería

References

  1. Perez, M.; Perez, R. Update 2022— A fundamental look at supply side energy reserves for the planet. Sol. Energy Adv. 2022, 2, 100014. [Google Scholar] [CrossRef]
  2. Protermosolar. Available online: https://www.protermosolar.com/la-energia-termosolar/el-sector-en-cifras/ (accessed on 10 July 2022).
  3. IEA. Technology Roadmap. Concentrating Solar Power. 2010. Available online: https://www.iea.org/reports/technology-roadmap-concentrating-solar-power (accessed on 10 July 2022).
  4. Kolb, G.J.; Ho, C.K.; Mancini, T.R. Power Tower Technology Roadmap and Cost Reduction Plan. Sandia Rep. 2011, 7, 1–20. [Google Scholar]
  5. Setien, E.; Fernández-Reche, J.; Álvarez-de-Lara, M.; Ariza, M.J. Experimental system for long term aging of highly irradiated tube type receivers. Sol. Energy 2014, 105, 303–313. [Google Scholar] [CrossRef]
  6. Setien, E.; Fernández-Reche, J.; Ariza, M.J.; Álvarez-de-Lara, M. Solar aging of receivers made of nickel super alloys. AIP Conf. Proc. 2018, 2033, 230012. [Google Scholar]
  7. Nijaoui, A.; Rachidi, S.; Bouzekri, H.; Raccurt, O.; Vidal, F.; Albert, R.; Le Baron, E.; Boudi, M. Survey of potential outdoor accelerated aging systems for the characterization of CSP components’ durability. In Proceedings of the 9th International Renewable Energy Congress (IREC), Hammamet, Tunisia, 20–22 March 2018; pp. 1–8. [Google Scholar]
  8. Selvaraj, P.; Baig, H.; Mallick, T.K.; Siviter, J.; Montecucco, A.; Li, W.; Paul, M.; Sweet, T.; Gao, M.; Knox, A.R.; et al. Enhancing the efficiency of transparent dye–sensitized solar cells using concentrated light. Sol. Energy Mater. Sol. Cells 2018, 1, 29–34. [Google Scholar] [CrossRef]
  9. Guerra–Rosa, L. Solar heat for materials processing: A review on recent achievements and a prospect on future trends. ChemEngineering 2019, 3, 1–19. [Google Scholar]
  10. Xie, W.T.; Dai, Y.J.; Wang, R.Z.; Sumathy, K. Concentrated solar energy applications using Fresnel lenses: A review. Renew. Sustain. Energy Rev. 2011, 15, 2588–2606. [Google Scholar] [CrossRef]
  11. Fernández-González, D.; Ruiz-Bustinza, I.; González-Gasca, C.; Piñuela-Noval, J.; Mochón-Castaños, J.; Sancho-Gorostiaga, J.; Verdeja, L.F. Concentrated solar energy applications in materials science and metallurgy. Sol. Energy 2018, 170, 520–540. [Google Scholar]
  12. Devices & Services. 2010. Available online: https://www.devicesandservices.com/15R-USB%20Spec%20Sheet.pdf (accessed on 23 November 2022).
  13. Ballestrín, J.; Carra, M.E.; Enrique, R.; Monterreal, R.; Fernández-Reche, J.; Polo, J.; Casanova, M.; Barbero, F.J.; Marzo, A. Diagnosis of a Lambertian target in solar context. Measurement 2018, 119, 265–269. [Google Scholar] [CrossRef]
  14. Lee, H.; Chai, K.; Kim, J.; Lee, S.; Yoon, H.; Yu, C.; Kang, Y. Optical performance evaluation of a solar furnace by measuring the highly concentrated solar flux. Energy 2014, 66, 63–69. [Google Scholar] [CrossRef]
  15. Edmund Optics Europe. 2020. Available online: https://www.edmundoptics.eu/c/optical-mirrors/609/# (accessed on 30 March 2022).
  16. ASTM. ASTM-E903-12; Standard Test Method for Solar Absorptance, Reflectance, and Transmittance of Materials Using Integrating Spheres. ASTM International: West Conshohocken, PA, USA, 2012.
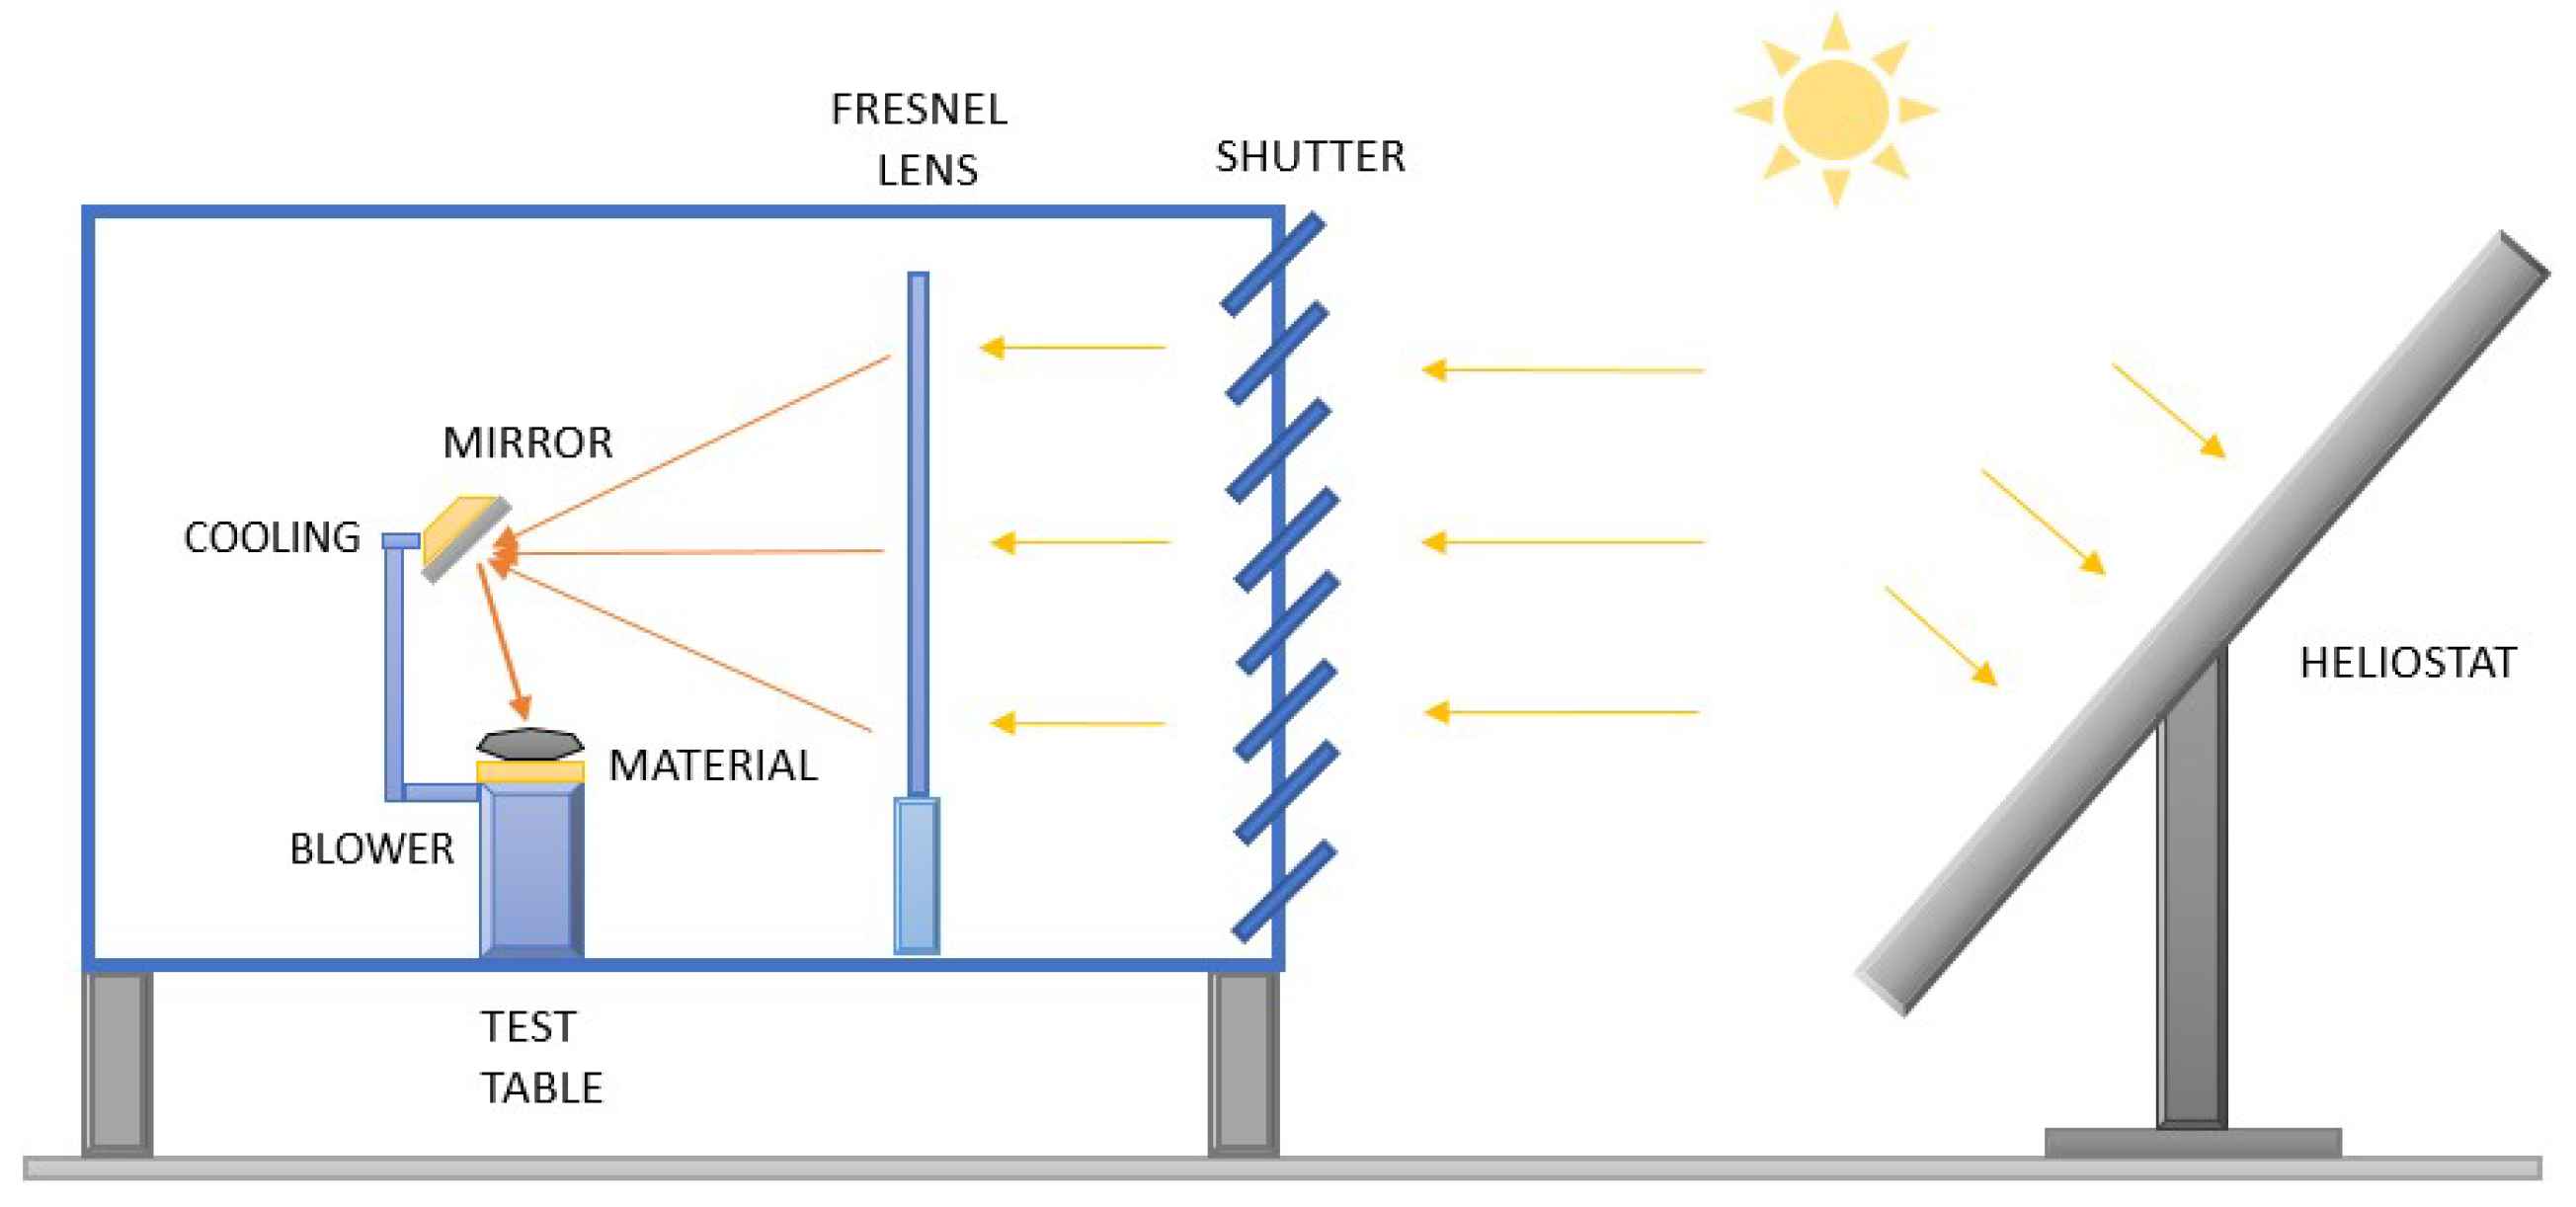
Figure 1. Simplified scheme of the new solar furnace at the PSA.
Solar 03 00007 g001
Figure 2. New PSA Fresnel lens solar furnace.
Solar 03 00007 g002
Figure 3. (a) Heliostat, (b) Fresnel lens and (c) selective reflectance mirrors used in the solar furnace.
Solar 03 00007 g003
Figure 4. Measuring elements for characterizing the Fresnel lens of the new solar furnace: CMOS camera and back view of the Lambertian target with the radiometer.
Solar 03 00007 g004
Figure 5. Base images for the energetic characterization of the Fresnel lens. (a) Focal length 3.74 m, (b) Focal length of 3.56 m.
Solar 03 00007 g005
Figure 6. Energy calibration of the Fresnel lens installed in the solar furnace: (red line) in position #1 (characterization A); and (blue line) in position #2 (characterization B).
Solar 03 00007 g006
Figure 7. Solar flux distribution at focal plane for (a) position #1 (characterization A) and (b) position #2 (characterization B).
Solar 03 00007 g007
Figure 8. Spectral reflectance of mirrors #3 and #6 together with the irradiance of the standard AM 1.5 solar spectrum.
Solar 03 00007 g008
Figure 9. Filtered solar Spectral irradiance of mirrors #3 and #6 with respect to the irradiance of the standard AM 1.5 solar spectrum.
Solar 03 00007 g009
Table 1. Results of the energy characterization for both positions (#1 and #2) of the Fresnel lens.
Characterization A
(Position #1)
Characterization B
(Position #2)
Total Energy (kW) 1.24 ± 0.03 1.13 ± 0.03
Peak Power (kWm 2 ) 1086.7 ± 0.3 1134.9 ± 0.3
90% Energy Radius (mm) 28.7 ± 0.5 27.0 ± 0.5
Flux density (kWm 2 ) 278 ± 3 265 ± 3
η g r o s s 0.81 ± 0.01 0.80 ± 0.01
η n e t 0.94 ± 0.01 0.92 ± 0.01
Table 2. Energy characterization results of the Fresnel lens for both positions, #1 and #2.
Characterization A
(Position #1)
Characterization B
(Position #2)
Peak Power (kWm 2 ) 1086.7 ± 0.3 1134.9 ± 0.3
G (Wm 2 ) 944.5 ± 0.1 873.4 ± 0.1
C 1150 ± 10 1300 ± 10
Table 3. Set of mirror for wavelength filtering of concentrated solar radiation in the solar furnace.
Mirror #Selective Band (nm)SpecificationsSolar Hemispherical Reflectance (-)
1450–10,00050 mm diameter. Silver protection 0.967 ± 0.001
2250–70050 mm diameter. UV Enhanced Aluminum 0.877 ± 0.001
3700–10,00050 mm diameter. Gold protection 0.823 ± 0.001
4450–65050 mm diameter. Enhanced Aluminum 0.913 ± 0.001
5400–70073 × 116 mm, mirror 4–6 λ 0.909 ± 0.001
6400–1125101 × 127mm, 45° AOI 0.441 ± 0.001
Disclaimer/Publisher’s Note: The statements, opinions and data contained in all publications are solely those of the individual author(s) and contributor(s) and not of MDPI and/or the editor(s). MDPI and/or the editor(s) disclaim responsibility for any injury to people or property resulting from any ideas, methods, instructions or products referred to in the content.