Article

Modeling and Energy Management of a Microgrid Based on Predictive Control Strategies

by
Alex Omar Topa Gavilema
1,
Juan D. Gil
1,
José Domingo Álvarez Hervás
1,*,
José Luis Torres Moreno
2 and
Manuel Pérez García
3
1
Department of Informatics, CIESOL—ceiA3, Ctra. Sacramento s/n, La Cañada de San Urbano, University of Almería, 04120 Almería, Spain
2
Department of Engineering, CIESOL—ceiA3, Ctra. Sacramento s/n, La Cañada de San Urbano, University of Almería, 04120 Almería, Spain
3
Department of Chemistry and Physics, CIESOL—ceiA3, Ctra. Sacramento s/n, La Cañada de San Urbano, University of Almería, 04120 Almería, Spain
*
Author to whom correspondence should be addressed.
Solar 2023, 3(1), 62-73; https://doi.org/10.3390/solar3010005
Submission received: 30 October 2022 / Revised: 29 December 2022 / Accepted: 6 January 2023 / Published: 10 January 2023

Abstract

:
This work presents the modeling and energy management of a microgrid through models developed based on physical equations for its optimal control. The microgrid’s energy management system was built with one of the most popular control algorithms in microgrid energy management systems: model predictive control. This control strategy aims to satisfy the load demand of an office located in the CIESOL bioclimatic building, which was placed in the University of Almería, using a quadratic cost function. The simulation scenarios took into account real simulation parameters provided by the microgrid of the building. For case studies of one and five days, the optimization was aimed at minimizing the input energy flows of the microgrid and the difference between the energy generated and demanded by the load, subject to a series of physical constraints for both outputs and inputs. The results of this work show how, with the correct tuning of the control strategy, the energy demand of the building is covered through the optimal management of the available energy sources, reducing the energy consumption of the public grid, regarding a wrong tuning of the controller, by 1 kWh per day for the first scenario and 7 kWh for the last.

Graphical Abstract

1. Introduction

The continuous increase in electrical energy demand, which has risen by more than 3% annually since 1980, together with an increment in the use of electric vehicles worldwide, will cause exponential growth in the emission of polluting and greenhouse gases [1]. This increase in emissions will deteriorate the environment. For this reason, in 2018, the European Union (EU) discussed and approved a series of environmental policies intending to decarbonize the EU by 2030 [2]. Within this package of policies, there are two fundamental objectives: (i) to increase energy efficiency by 32.5% compared to 2005, and (ii) to minimize greenhouse gases by 40% compared to 1990 [3,4].
One of the solutions to counteract climate change is to reduce the use of fossil energy sources (FES) while increasing the use of renewable energy sources (RES) (photovoltaic (PV), wind, solar thermal, biomass, etc.). In this context, a microgrid (MG) may be defined as an electrical energy grid that can be self-sufficient or part of a global electricity generation system. In a MG, RES, energy storage systems (ESS), and controllable and non-controllable loads are interconnected [5]. Generally, a MG is connected to the public grid, but when there are failures in said grid, or the energy demand is very low, the MG works in off-grid mode, also called island mode [5,6]. Smart grids are made up of an energy management system (EMS), which allows for a more efficient use of available RES, thereby increasing the reliability of renewable plants and ESS [7,8].
Nowadays, smart buildings have MGs to cover part of their energy demand, through RES integration. Yan et al. [9] described that 30% of CO 2 emissions are related to energy consumption from commercial and residential buildings. These buildings’ consumption currently represents 32 % of global energy. For this reason, MGs are very beneficial, since they solve various types of problems, such as: (i) forecast of the energy demand, (ii) response to demand, (iii) cost of energy optimization, (iv) reduction of the carbon footprint, and (v) energy management [10,11]. The EMS manages the energy of the RES and the ESS, which have been used in recent years in energy distribution systems with the aims of reducing emissions of CO 2 , controlling the increasing demand for energy, and obtaining socio-economic benefits for sustainable growth.
The EMS aims to optimize the available energy resources to satisfy energy demand. Thus, an EMS requires a control algorithm to manage the MG’s available energy resources. The authors of [12,13,14] presented strategies based on frequency control to manage the energy resources of an MG. On the other hand, Topa et al. [5] reviewed the most used optimization techniques in the EMS of MGs: metaheuristic methods, linear and nonlinear programming, dynamic programming, stochastic and robust programming, artificial intelligence, and model predictive control (MPC). This last technique, the MPC, is one of the most widely-used strategies today [15,16]. MPC is a control strategy used in multiple applications, which requires a system model to perform actions in the current time based on the future predictions of the system [17,18]. This optimal control strategy is based on an objective function that includes a series of restrictions present in the process. Through this, it is intended to meet a series of objectives, such as minimizing the energy bill, satisfying demand, minimizing CO 2 emissions, or any other aim that the user wishes to achieve [16,19]. Recent studies have developed several MPC formulations, which use various types of strategies. These EMS based on MPC aimed to minimize reliance on FES, minimize polluting emissions, and maximize RES production [20,21]. For example, references [22,23,24,25,26,27,28] used a strategy based on a linear MPC to manage the energy resources of a residential MG. This control strategy aimed to maximize the economic benefit of the MG, minimize ESS degradation, and respect the different operational constraints. On the other hand, the authors of [26,29,30,31,32,33], proposed EMSs of microgrids based on nonlinear predictive control strategies. The main objective was to respond to demand by getting a balance between energy production and demand while at the same time minimizing the electricity bill, polluting emissions, and degradation of the MG instrumentation.
This work deals with the development of an MPC to efficiently manage the available energy resources of an MG. This is located at the CIESOL research center located at the University of Almería; a more detailed description of the MG can be found in [34]. The case study used as a reference in this work involved an MG composed of: a PV system, a battery storage system, controllable/non-controllable loads, and power electronic devices for energy regulation and transformation; and it is connected to the public grid. The energy resources of the MG will be managed by an EMS based on an MPC algorithm, which aims to satisfy the energy demand of an office in the CIESOL building, through the optimal control of the energy flows present in the MG. The commercial prices of electricity in Spain were taken into account for a determined time [35,36,37]. Optimum energy management in this paper allows for reducing costs related to the energy bill and CO 2 emissions. Additionally, the EMS must guarantee the energy supply of the building. To achieve these objectives, two simulation scenarios have been used, which included real generation and demand data for one and five days. These simulations evidenced how, with the correct tuning of the control strategy, the energy consumption of the public grid can considerably be reduced, regarding a wrong tuning of the controller, by 1 kWh per day for the first scenario and 7 kWh for the last.
The rest of this document is organized as follows: The system modeling is found in Section 2, and the controller design can be seen in Section 3. In addition, Section 4 shows the analysis of the results, and finally, the conclusions are detailed in Section 5.

2. System Modeling

The physical modeling of the system consists of obtaining a function or grouping of mathematical functions that define the behavior of the system, which for the case study of this work is the MG to be controlled. To have a general concept of an MG and its available energy resources, Figure 1 shows a simplified diagram of the elements that the MG is composed of.
The PV system is connected through a DC/DC converter, direct current (DC), which has a maximum power point tracking (MPPT) algorithm, guaranteed to work in its proper operation point. The MPPT output is connected to the input of a DC/AC converter, which will convert the DC energy to AC required by the loads. Furthermore, the battery bank is connected to a charge regulator, which is in charge of supplying or consuming energy of the MG. Its output is connected to the DC/AC converter. These converted energy parameters are sent to the control system, which is in charge of efficiently managing the available energy resources, to decide between switching to the consumption or sale of energy from the public grid.

2.1. PV Panel Modeling

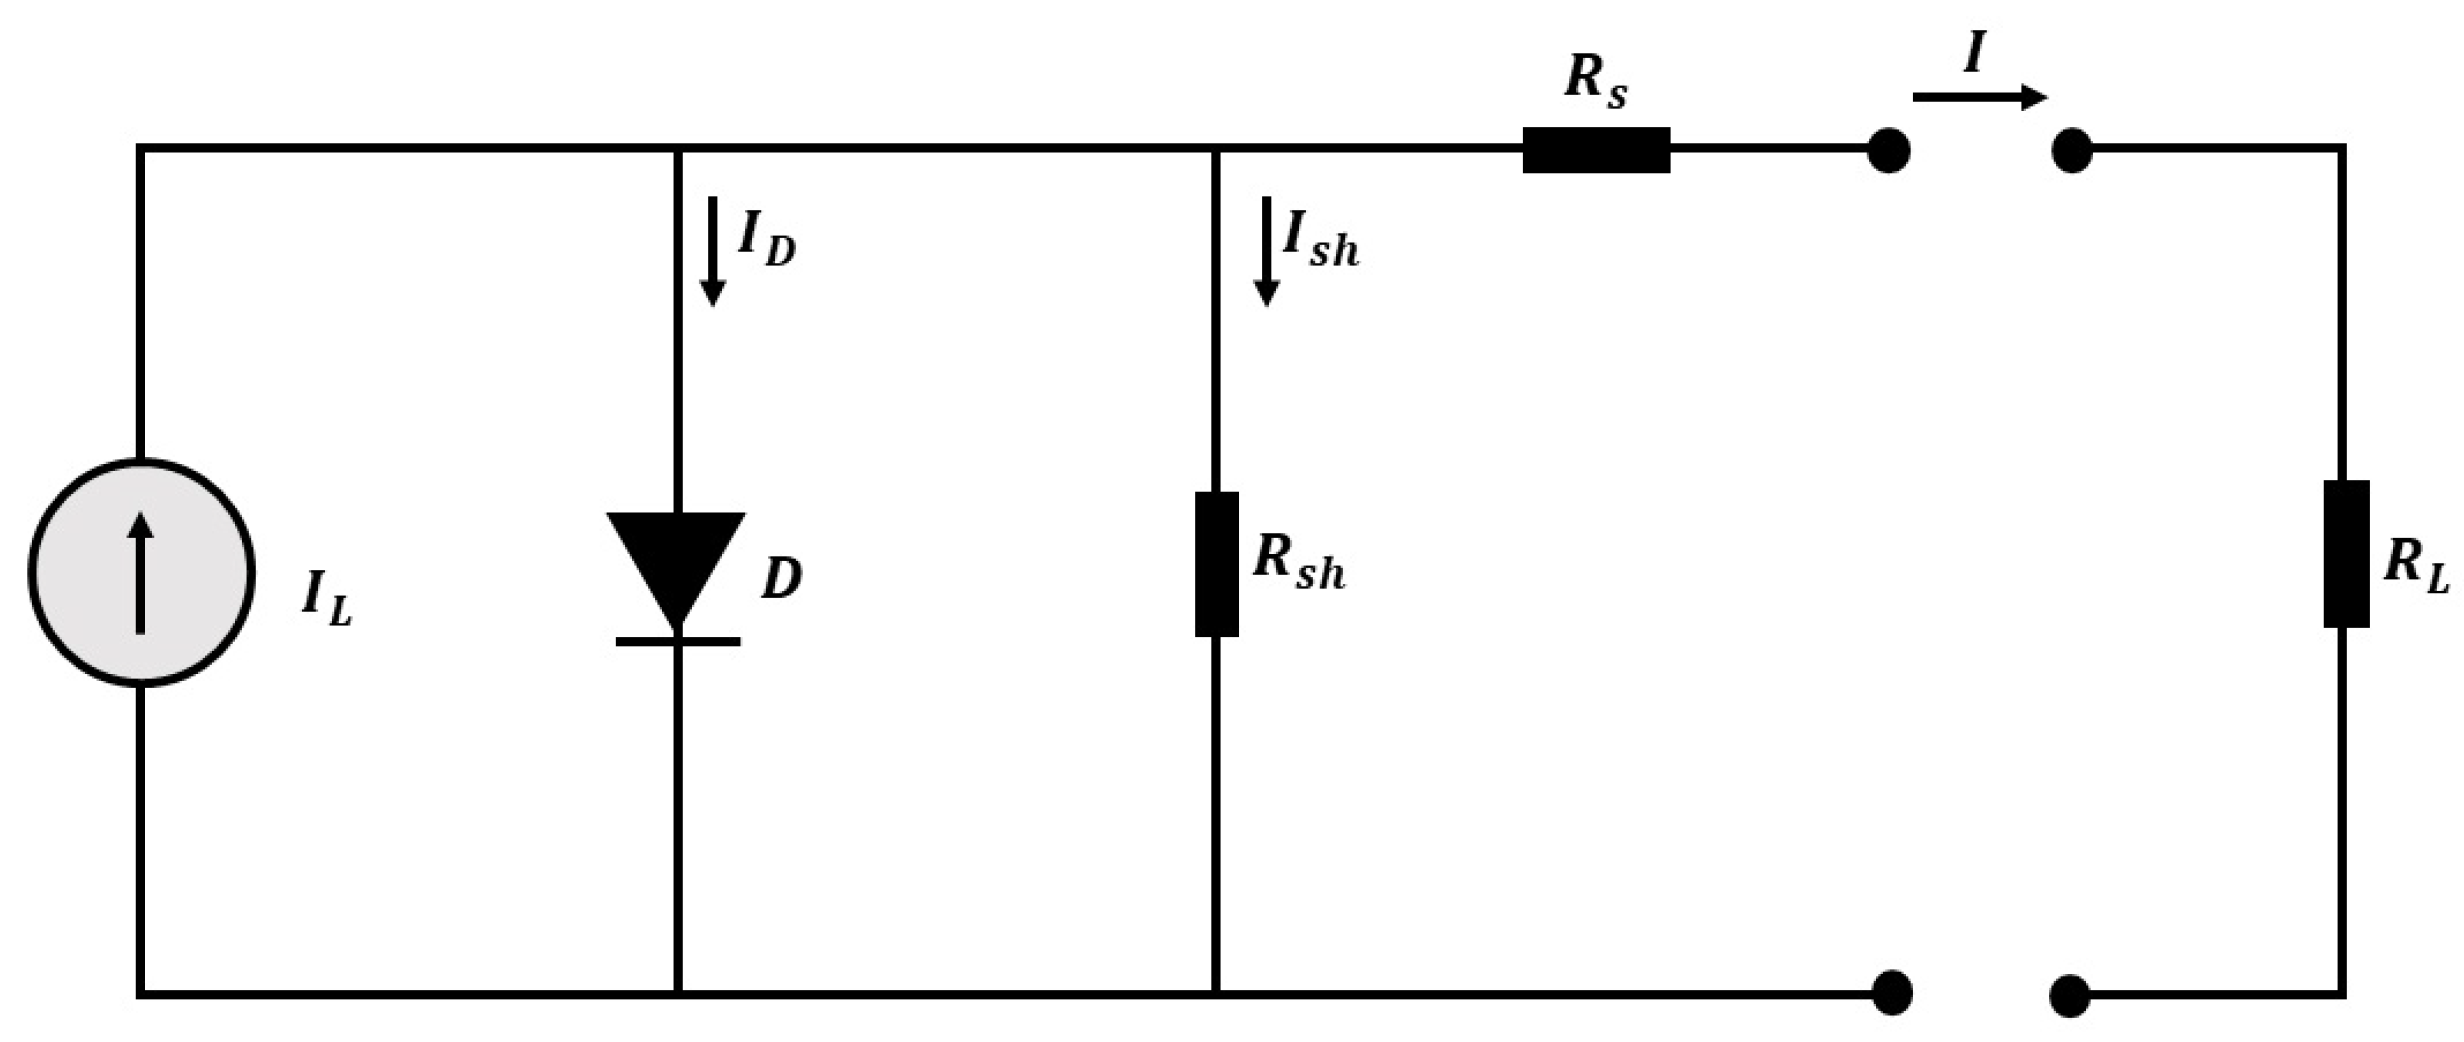
The PV system model is obtained through physical equations based on an equivalent electrical circuit [38]. Figure 2 shows the electrical circuit used in the modeling of the PV system.
In order to simplify the model, the parameters known as standard test conditions ( S T C ) are used (G S T C = 1000 W/m 2 , T S T C = 25 C). Equation (2) was obtained through the development of Equation (1)—expressing it as a function of both the current I and the output voltage V of the photovoltaic panel, where I D is equivalent to the current in a diode. This model based on an electrical circuit requires the following parameters to be known: the diode reverse saturation current I o , the light current I L , the shunt resistance R s h , the series resistance R s , and the parameter a, which is called the modified ideality factor. All these parameters in standard conditions are available in [40].
I = I L I D I s h
I = I L I o e V + I R s a 1 V + I R s R s h
Since the MG has maximum power point tracking (MPPT) equipment, the operating point of the maximum power current I m p and maximum power voltage V m p are assumed. Equation (3) is obtained by replacing the parameters I m p and V m p in Equation (2). On the other hand, to obtain Equation (6), it is important to obtain the maximum power point in operating conditions. This is obtained through the partial derivative of electrical power P m p (see Equation (4)) with respect to V m p equal to zero; see Equation (5). This operation has been described in detail in [38]. The solution of the equations must be reached through a solver of complex equations. In this study case, the Newton–Raphson method was used [41].
I m p = I L I o e V m p + I m p R s a 1 V m p + I m p R s R s h
P m p = V m p I m p
P m p V m p = 0
I m p V m p = I o a e V m p + I m p R s a + 1 R s h 1 + R s R s h + I o R s a + e V m p + I m p R s a

2.2. Battery Modeling

The percentage of energy stored by the battery is given by the battery’s state of charge ( S O C ), as shown in Equation (7).
S O C ( t + 1 ) = S O C ( t ) n b a t T s C m a x P b a t ( t )
In order to manage the different behaviors in charging and discharging, the performance of the battery n b a t was considered the same for both processes. In this simulation, it is useful to simplify the optimization problem, despite the fact that the performance of the battery for charging and discharging may be different.
The S O C ( t ) is defined as the ratio between the current capacity P b a t ( t ) and the maximum capacity of the battery, C m a x expressed in (kWh), for each sampling time Ts.

3. Controller Design

To solve the EMS, it is recommended to express the MG model in a state-space model [16]. Hence, the general representation of this model is shown by Equation (8).
x ( t + 1 ) = A x ( t ) + B u ( t ) y ( t ) = C x ( t ) + D u ( t )
where the states of the system are represented by the vector x ( t ) , whose elements are: the S O C of the battery S O C ( t ) , the renewable power P r n v ( t ) , and P g e n ( t ) , which is the total generated power available to cover the energy demand. The input vector of the system is u ( t ) and is composed of: The power of the battery P b a t ( t ) . P g r i d ( t ) , which represents the power supplied by the public grid. The renewable power destined to cover the demand, P r n v , d e m ( t ) , and the renewable power injected into the batteries, P r n v , i n y ( t ) . Finally, the output vector of the system is y ( t ) = [ S O C ( t ) P r n v ( t ) P g e n ( t ) ] T . The strategy based on the MPC algorithm has the objective of covering the energy demand of an office located in the CIESOL building. The expressions, defined by Equations (9)–(11), describe the MG model. Additionally, we consider the expression, K b a t = n b a t / C m a x , as a constant.
S O C ( t + 1 ) = S O C ( t ) K b a t T s ( P b a t ( t ) P r n v , i n y ( t ) )
P r n v ( t + 1 ) = P r n v , d e m ( t ) + P r n v , i n y ( t )
P g e n ( t + 1 ) = P b a t ( t ) + P g r i d ( t ) + P r n v , d e m ( t )
Equations (9)–(11) are expressed in state space, as shown in Equation (12). On the other hand, Equation (13) represents the outputs of the system.
S O C ( t + 1 ) P r n v ( t + 1 ) P g e n ( t + 1 ) = 1 0 0 0 0 0 0 0 0 S O C ( t ) P r n v ( t ) P g e n ( t ) + K b a t T s 0 0 K b a t T s 0 0 1 1 1 1 1 0 P b a t ( t ) P g r i d ( t ) P r n v , d e m ( t ) P r n v , i n y ( t )
y ( t ) = 1 0 0 0 1 0 0 0 1 S O C ( t ) P r n v ( t ) P g e n ( t )
x ( t ) = S O C ( t ) P r n v ( t ) P g e n ( t ) T
u ( t ) = P b a t ( t ) P g r i d ( t ) P r n v , d e m ( t ) P r n v , i n y ( t ) T
Matrices A, B, and C calculated from Equations (9)–(11) are those of the MG model represented in state space. These matrices make up the general form of the model in state space.
A = 1 0 0 0 0 0 0 0 0 B = K b a t T s 0 0 K b a t T s 0 0 1 1 1 1 1 0 C = 1 0 0 0 1 0 0 0 1
Through this, the augmented model as a function of increments is obtained. Said model is described in detail in [18]. The matrixes of both forced response G and free F are represented by Equations (17) and (18), respectively. These expressions have been built through the prediction equations, which have been developed along the prediction horizon N p with a control horizon N c . These equations are composed by the states and control increments of the MG, where F is related with MG states and G is related to control increments; see [17,18].
F = C A C A 2 C A 3 C A N p
G = C B 0 0 0 C A B C B 0 0 C A 2 B C A B C A B 0 C A N p 1 B C A N p 2 B C A N p 3 B C A N p N c B
The output equation of the system in its compact form is expressed through Equation (19), where Y is the output vector of the system; the states of the system are represented by x ( t ) ; and Δ U contains the increments of the MG input signal.
Y = F x ( t ) + G Δ U
Thus, the optimization problem can be posed as reflected in Equation (20):
J = i = 1 N p Q δ ( Y R ) 2 + i = 1 N c Q λ Δ U 2
S O C m i n S O C ( t ) S O C m a x
P b a t , m i n P b a t ( t ) P b a t , m a x
P g r i d , m i n P g r i d ( t ) P g r i d , m a x
P g e n , m i n P g e n ( t ) P g e n , m a x
P r n v , m i n P r n v ( t ) P r n v , m a x
P r n v , d e m , m i n P r n v , d e m ( t ) P r n v , d e m , m a x
P r n v , i n y , m i n P r n v , i n y ( t ) P r n v , i n y , m a x
where Q δ is the cost of covering the demand in €/kWh; Q λ contains the costs of energy production from RES, ESS, and FES in €/kWh; and R is the reference which is equivalent to the electrical energy demand of the office. As pointed out in Section 2.2, a simplified model for the battery is used in this work. Thus, the model lacks non-linearities in its formulation, and a linear optimizer can be used to solve the optimization problem. This is expressed through Equation (20), where the optimal vector Δ U contains Δ u ( k ) , Δ u ( k + 1 ) , Δ u ( k + 2 ) , , Δ u ( k + N c 1 ) . One of the MPC features is the sliding horizon control principle: only the first sample of control sequence, Δ U , is used—i.e., Δ u ( k ) , rejecting the rest of the solutions. In the next sample time, the optimization problem is solved again with new information. This feature is repeated for every single sample time, T s .

4. Analysis of Results

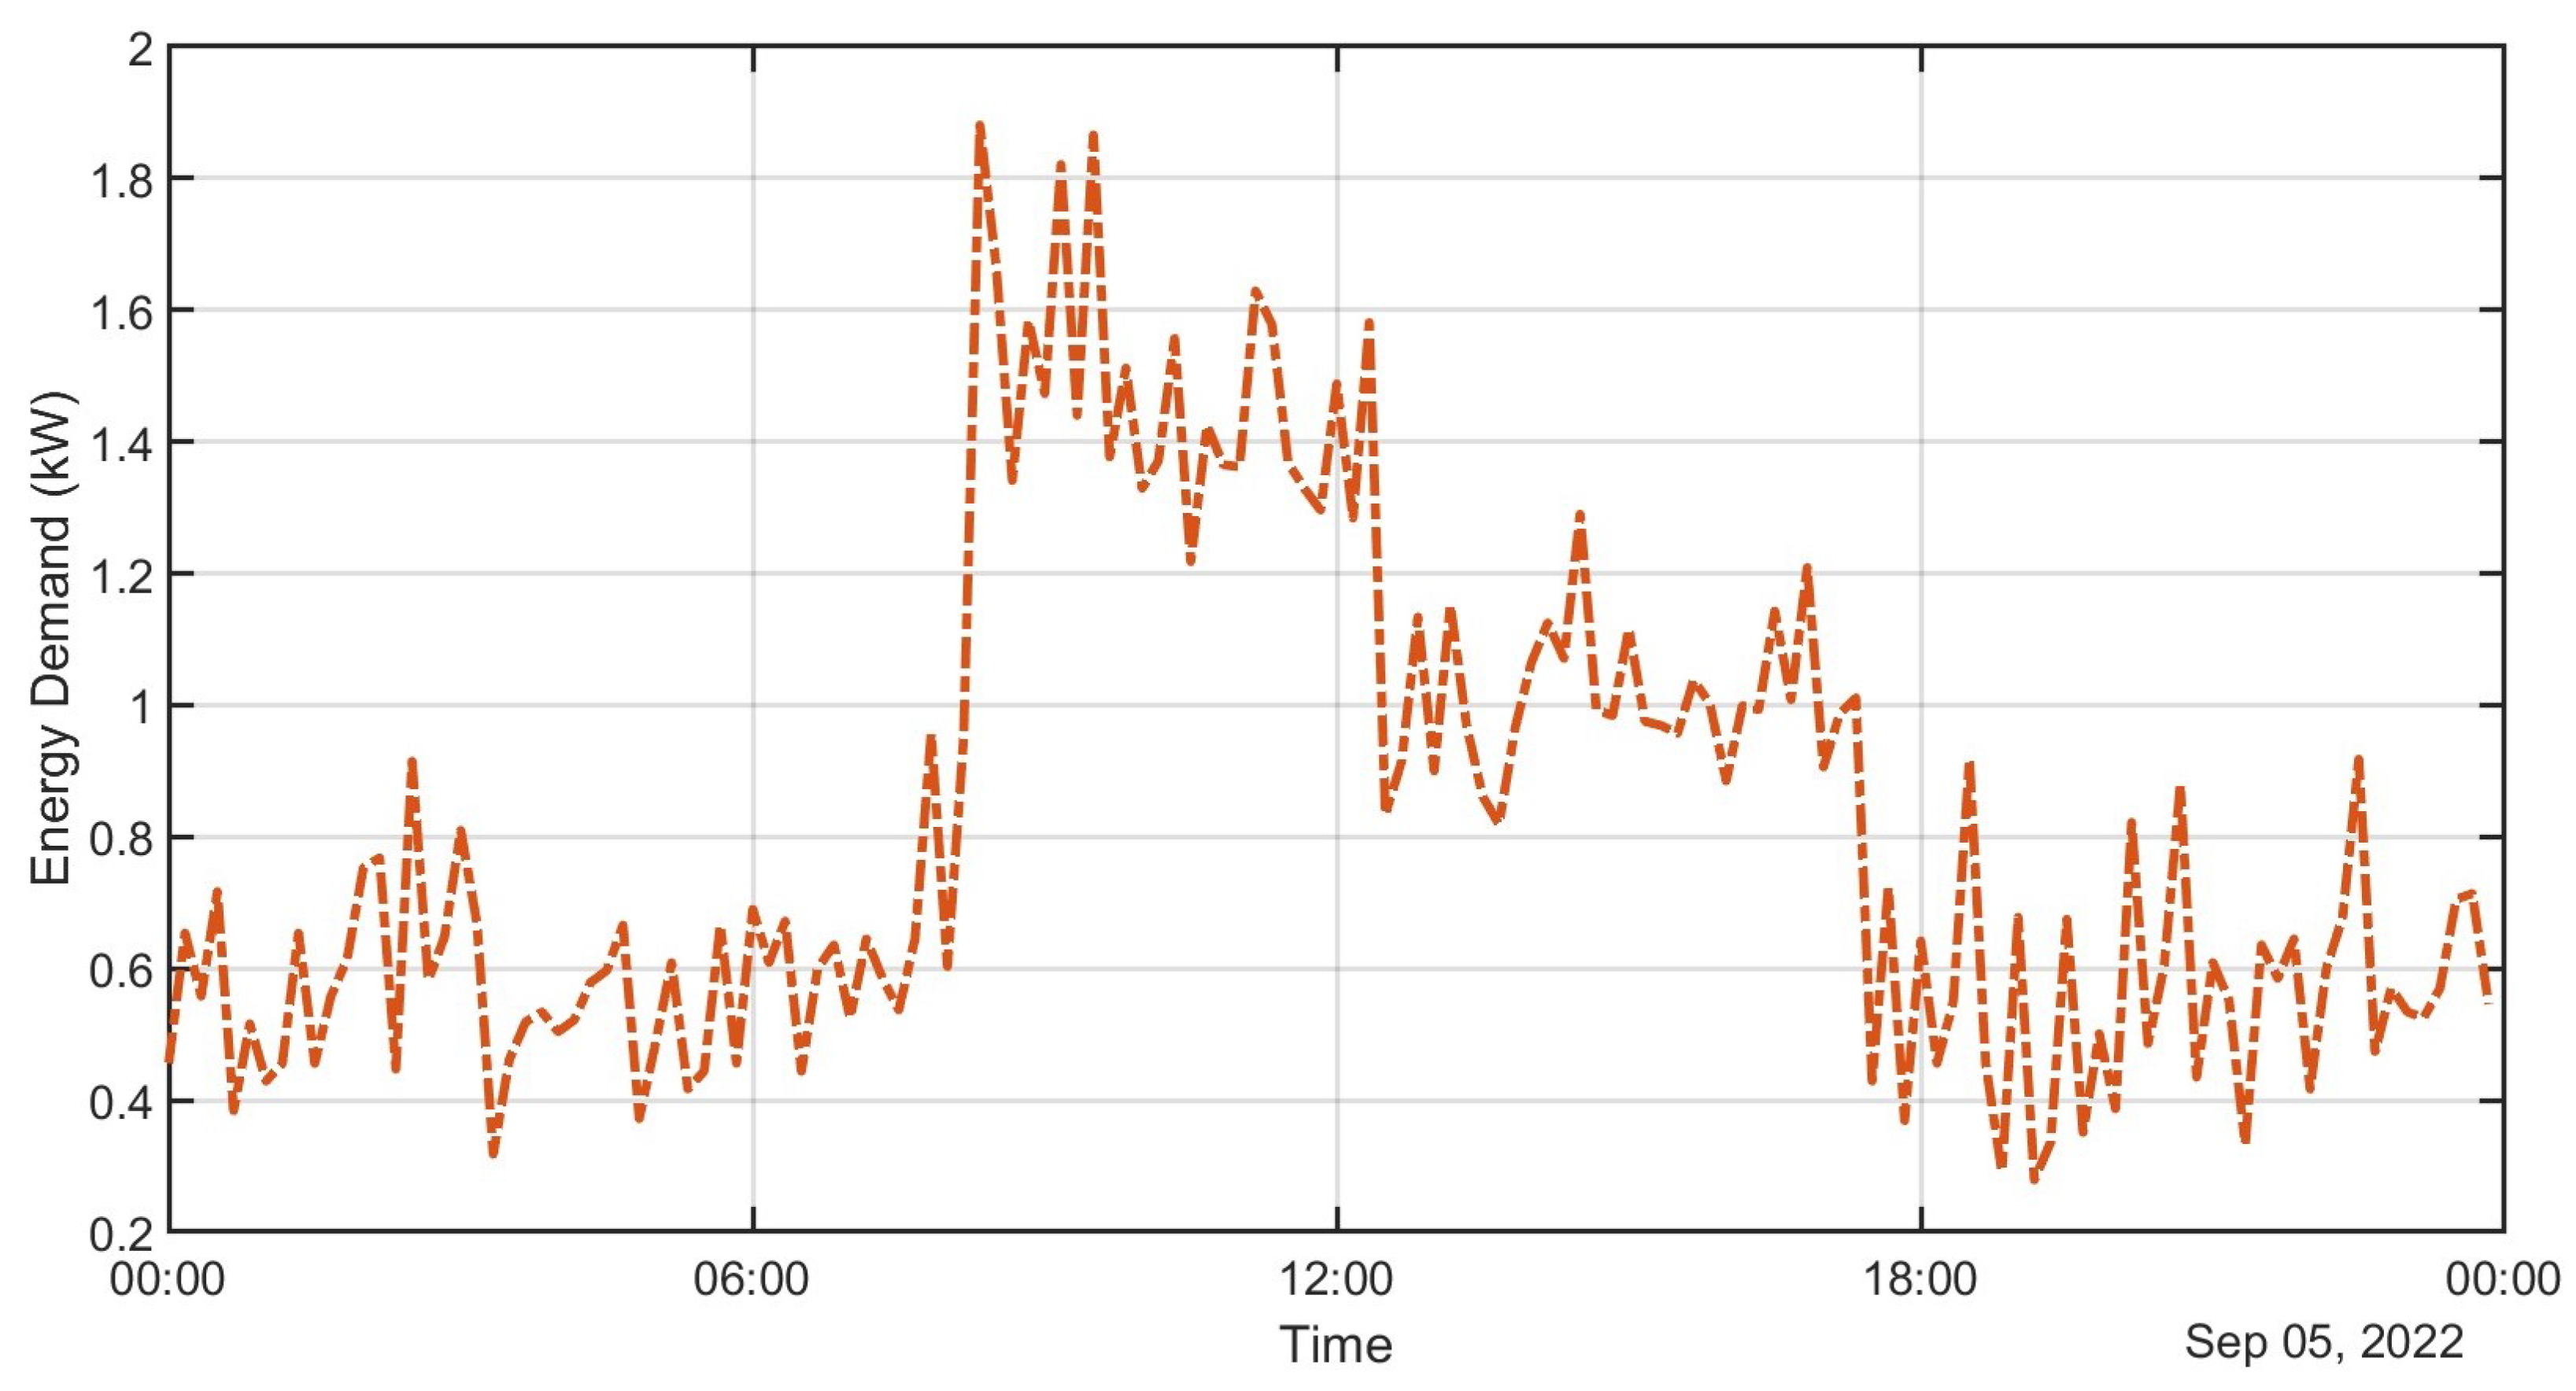
The simulation scenarios addressed in this work aimed to analyze how the tuning parameters of the MPC-based EMS affect the efficiency of the MG in terms of FES consumption. Specifically, in these scenarios, two energy demands of normal consumption in the office were used for one and five days (see Figure 3 and Figure 4), i.e., two periods that the EMS intends to cover.
In order to evaluate the MPC algorithm performance, several simulations were developed for each scenario with different N p and N c parameters; see Table 1. Based on these simulations, the MPC can be fine-tuned while trying to find a compromise between execution time T e x e and demand response. In this case, the control parameters chosen were: N p = 24 , N c = 6 , and T s = 10 min for one and five days, respectively. On the other hand, both the maximum execution time T e x e , m a x and the mean execution time T e x e , m e a n for one day were T e x e , m a x = 3.9997 seconds and T e x e , m e a n = 0.3658 seconds, and for five days were T e x e , m a x = 1.4956 seconds and T e x e , m e a n = 0.1089 seconds. This configuration has a significantly lower execution time than the sampling time of the MPC algorithm and provides the best use of available renewable energy.
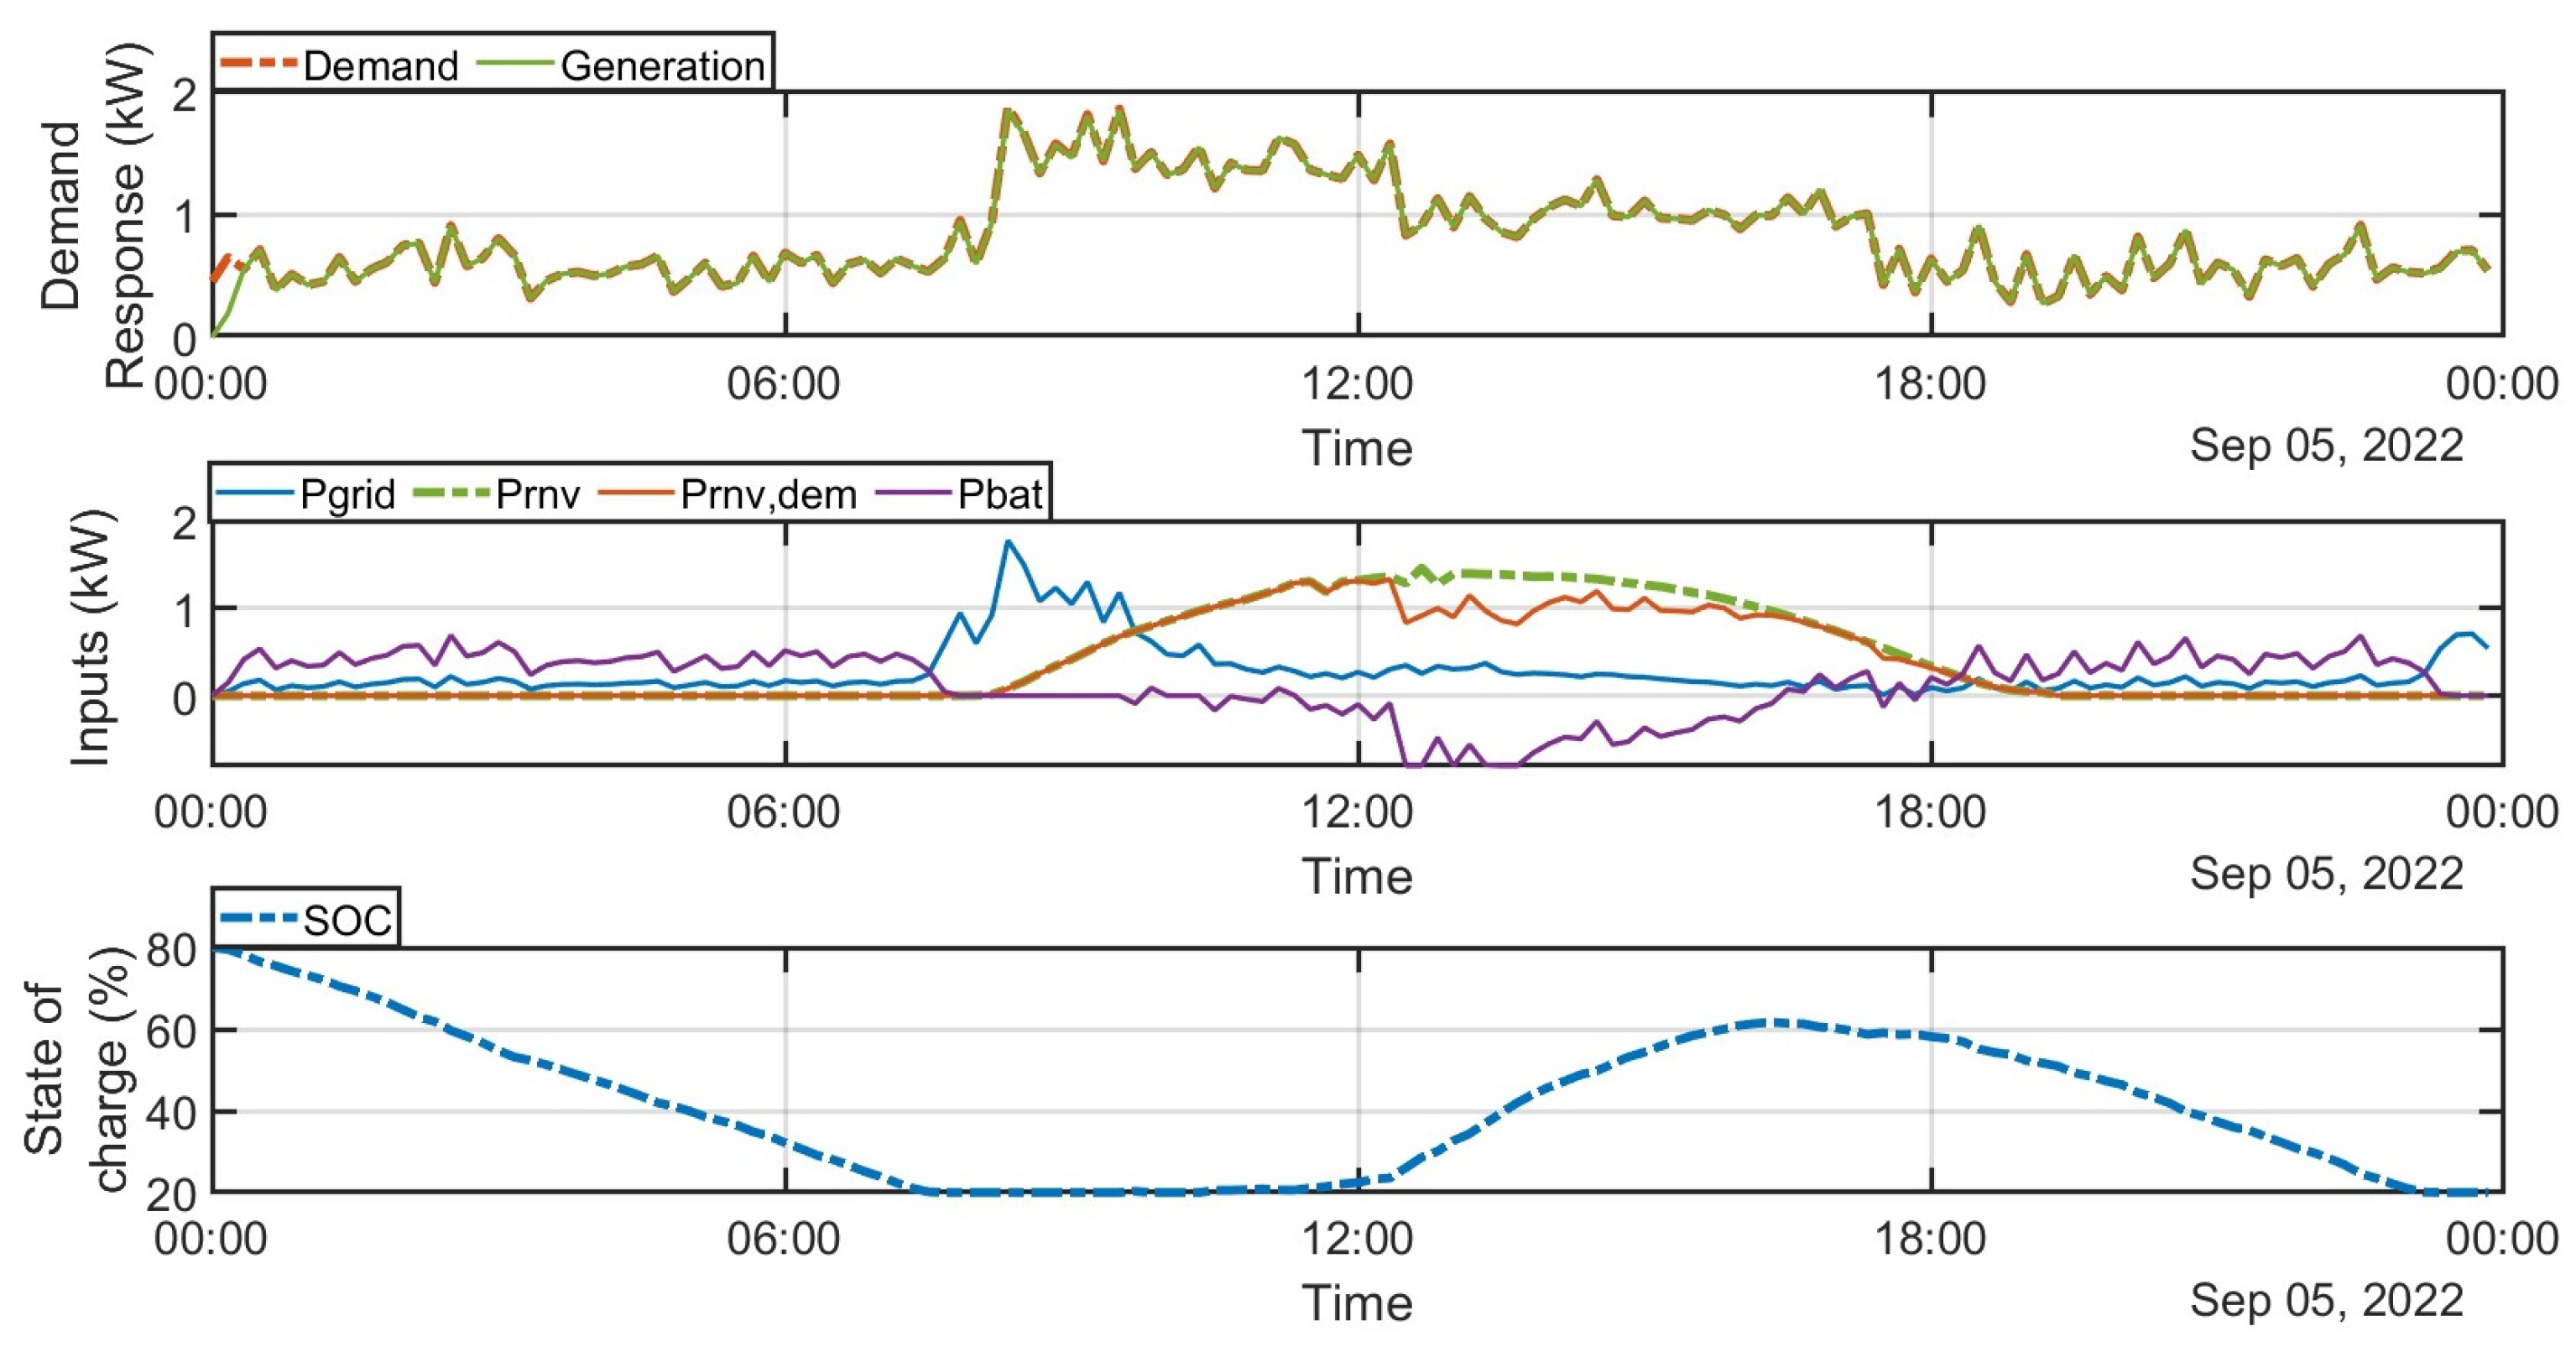
Figure 5 shows the results obtained with the proposed control strategy and the selected configuration of the tuning parameters for the first scenario. In his figure, it can be seen how the MPC controller reaches the objective of covering the energy demand of the building throughout the day. Additionally, it shows the SOC of the battery, where it can be seen how the battery remains within the limits allowed to preserve its useful life. These limits were established as a restriction within the solution of the optimization problem. The battery is always in the range of 20–80%.
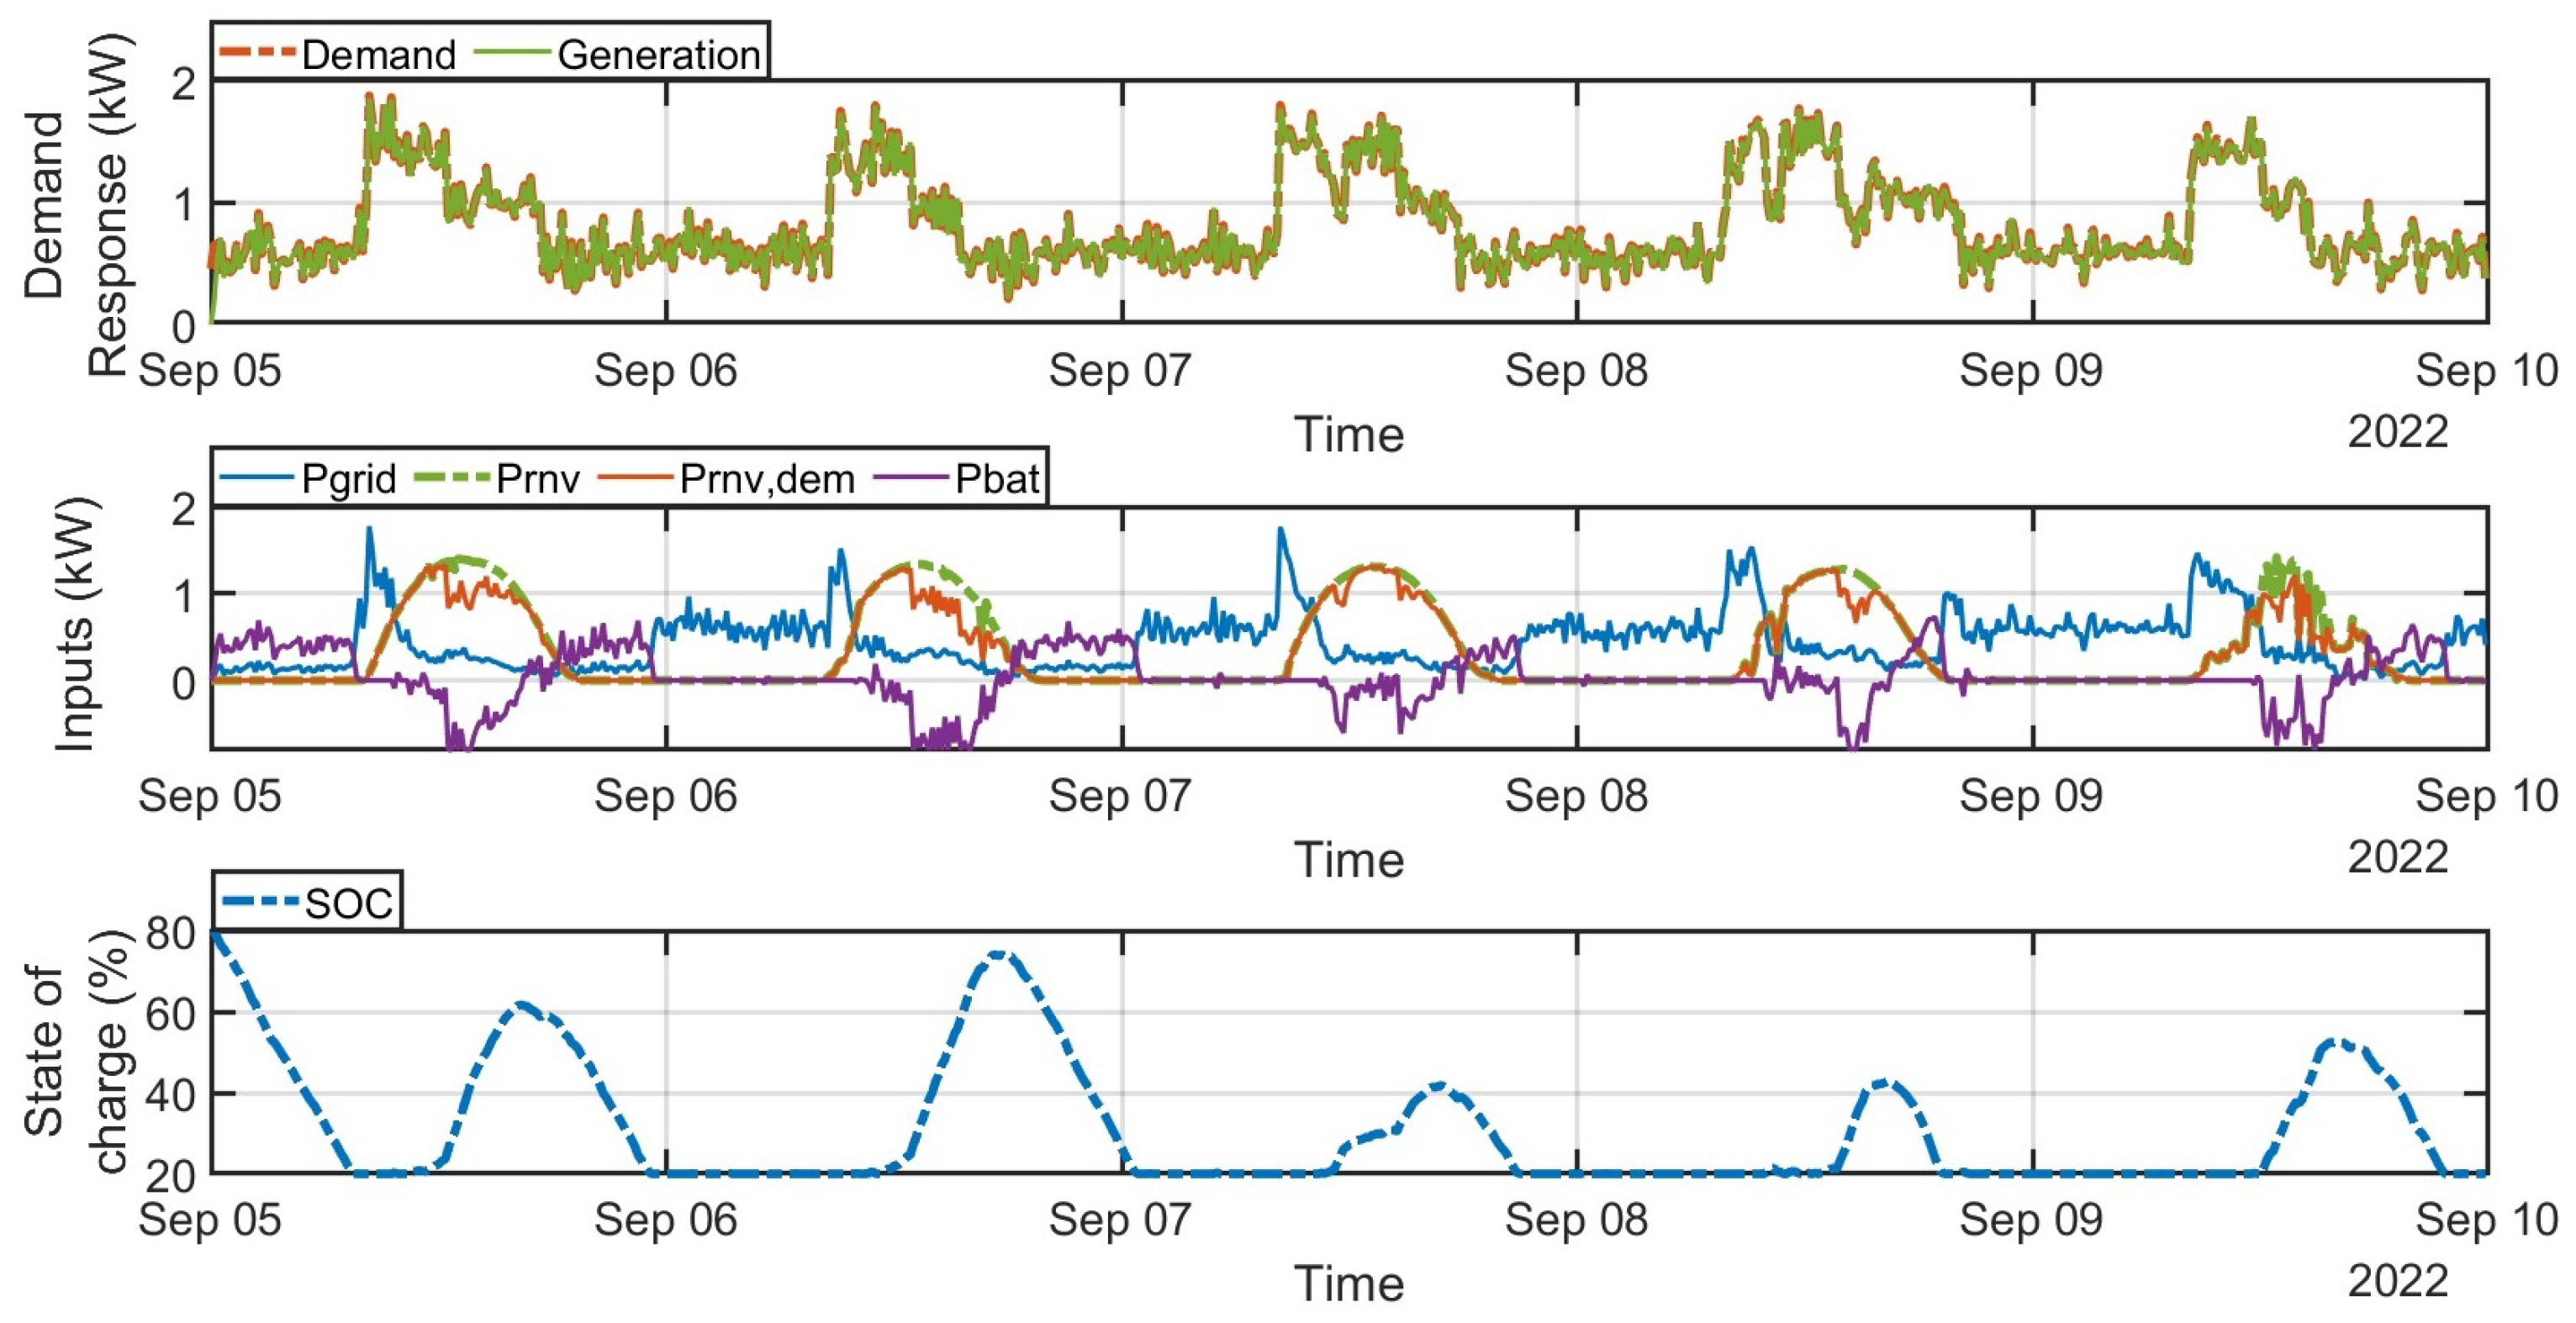
The second scenario was conducted for five days in a row, with different generations of PV energy and different energy demand profiles for each day, as can be seen in Figure 6. The main objective of the EMS is accomplished even with different generation profiles for the PV system. On the other hand, the SOC trend of the battery remains within the limits allowed by the restriction, which is 20–80%.
The results obtained through the EMS confirm that the available energy resources are optimally managed with N p = 24, N c = 6, and T s = 10 min, compared to the other cases. Hence, the energy balance between generation and demand remain stable while saving the useful life of the battery storage system. On the other hand, the initial state of the S O C can be different to S O C m a x without affecting the tuning parameters of the MPC. However, the S O C is directly proportional to the energy generation time of the ESS. In other words, less energy production will be obtained from the ESS; therefore, a greater energy supply from the public grid will be required. Lastly, with this configuration, the EMS showed a reduction in the consumption of FES of up to 1 kWh per day and up to 7 kWh over five days, both with respect to shorter N p and N c . These indicators represent a reduction in: energy consumption from the public grid, the electricity bill, and CO 2 emissions.

5. Conclusions

This work addressed the modeling and control of a microgrid located in the CIESOL building (University of Almería, Spain) through an MPC strategy. In particular, the work evaluated the efficiency of the microgrid by fine-tuning the MPC control strategy. To do that, two simulation scenarios were used as references, which worked with real demand profiles of one and five days. In these scenarios, the MPC controller took into account the cost of electric energy from the public grid, the costs resulting from equipment degradation, and the energy consumption of the building.
The results show how the correct tuning of the setting parameters of the MPC controller (i.e., correct choice of N p , N c , and T s ) results in an efficient management of energy resources from the MG, such as: PV system, public grid, and battery storage, allowing us to reduce the consumption of FES by up to 1 kWh per day and by up to 7 kWh over five days, both with respect to the lowest values N p and N c . This reduction is notable for daily operation, as it is directly reflected in a reduction in the electric bill, a reduction in the consumption of FES, and, indirectly, in a minimization of the CO 2 emissions sent into the environment.
Future works are aimed to include both electric vehicles and non-linear states that were not taken into account in this methodology. Therefore, this new EMS will have non-linear states expressed as binary variables, which will define the real behavior of the battery and the electric vehicle. The results obtained from this new methodology will be an approach to reality.

Author Contributions

Conceptualization, A.O.T.G.; methodology, A.O.T.G., J.D.G., J.D.Á.H. and J.L.T.M.; writing—original draft preparation, A.O.T.G.; writing—review and editing, J.D.Á.H., J.D.G. and J.L.T.M.; supervision, M.P.G.; funding acquisition, M.P.G. All authors read and agreed to the published version of the manuscript.

Funding

This work has been developed within the framework of the MICROPROD-SOLAR project financed by the State Research Agency (ref. PCI2019-103378), which supports the call of the CYTED program for Strategic Projects on distributed generation, renewable energies, and microgrids in Strategic Enclaves of America Latina.

Institutional Review Board Statement

Not Applicable.

Informed Consent Statement

Not Applicable.

Data Availability Statement

Not Applicable.

Conflicts of Interest

The authors declare no conflict of interest.

Abbreviations

The following abbreviations are used in this manuscript:
EMSEnergy management system
ESSEnergy storage system
EUEuropean Union
MGMicrogrid
MPCModel predictive control
MPPTMaximum power tracking
PVPhotovoltaic
RESRenewable energy source
SOCState of charge
STCStandar tested conditions.

References

  1. Moon, H.; Park, S.Y.; Jeong, C.; Lee, J. Forecasting electricity demand of electric vehicles by analyzing consumers’ charging patterns. Transp. Res. Part Transp. Environ. 2018, 62, 64–79. [Google Scholar] [CrossRef]
  2. Aune, F.R.; Golombek, R. Are Carbon Prices Redundant in the 2030 EU Climate and Energy Policy Package? Energy J. 2021, 42, 225–264. [Google Scholar] [CrossRef]
  3. Zhang, Y.; Meng, F.; Wang, R.; Zhu, W.; Zeng, X.J. A stochastic MPC based approach to integrated energy management in microgrids. Sustain. Cities Soc. 2018, 41, 349–362. [Google Scholar] [CrossRef]
  4. Gil, J.D.; Topa, A.O.; Álvarez, J.D.; Torres, J.L.; Pérez, M. A review from design to control of solar systems for supplying heat in industrial process applications. Renew. Sustain. Energy Rev. 2022, 163, 112461. [Google Scholar] [CrossRef]
  5. Topa Gavilema, Á.O.; Álvarez, J.D.; Torres Moreno, J.L.; García, M.P. Towards Optimal Management in Microgrids: An Overview. Energies 2021, 14, 5202. [Google Scholar] [CrossRef]
  6. Kroposki, B.; Lasseter, R.; Ise, T.; Morozumi, S.; Papathanassiou, S.; Hatziargyriou, N. Making microgrids work. IEEE Power Energy Mag. 2008, 6, 40–53. [Google Scholar] [CrossRef]
  7. Ali, S.; Zheng, Z.; Aillerie, M.; Sawicki, J.P.; Péra, M.C.; Hissel, D. A Review of DC Microgrid Energy Management Systems Dedicated to Residential Applications. Energies 2021, 14, 4308. [Google Scholar] [CrossRef]
  8. Jamal, S.; Tan, N.M.L.; Pasupuleti, J. A Review of Energy Management and Power Management Systems for Microgrid and Nanogrid Applications. Sustainability 2021, 13, 331. [Google Scholar] [CrossRef]
  9. Yan, Q.; Zhang, B.; Kezunovic, M. Optimized Operational Cost Reduction for an EV Charging Station Integrated With Battery Energy Storage and PV Generation. IEEE Trans. Smart Grid 2019, 10, 2096–2106. [Google Scholar] [CrossRef]
  10. Fontenot, H.; Dong, B. Modeling and control of building-integrated microgrids for optimal energy management—A review. Appl. Energy 2019, 254, 113689. [Google Scholar] [CrossRef]
  11. Farinis, G.K.; Kanellos, F.D. Integrated energy management system for Microgrids of building prosumers. Electr. Power Syst. Res. 2021, 198, 107357. [Google Scholar] [CrossRef]
  12. Boujoudar, Y.; Azeroual, M.; Moussaoui, H.E.; Lamhamdi, T. Intelligent controller based energy management for stand-alone power system using artificial neural network. Int. Trans. Electr. Energy Syst. 2020, 30, e12579. [Google Scholar] [CrossRef]
  13. Azeroual, M.; Boujoudar, Y.; Iysaouy, L.E.; Aljarbouh, A.; Fayaz, M.; Qureshi, M.S.; Rabbi, F.; Markhi, H.E. Energy management and control system for microgrid based wind-PV-battery using multi-agent systems. Wind Eng. 2022, 46, 1247–1263. [Google Scholar] [CrossRef]
  14. Córdova, S.; Cañizares, C.A.; Lorca, Á.; Olivares, D.E. Frequency-Constrained Energy Management System for Isolated Microgrids. IEEE Trans. Smart Grid 2022, 13, 3394–3407. [Google Scholar] [CrossRef]
  15. Roslan, M.; Hannan, M.; Ker, P.J.; Mannan, M.; Muttaqi, K.; Mahlia, T.I. Microgrid control methods toward achieving sustainable energy management: A bibliometric analysis for future directions. J. Clean. Prod. 2022, 348, 131340. [Google Scholar] [CrossRef]
  16. Bordons, C.; Garcia-Torres, F.; Ridao, M.A. Basic Energy Management Systems in Microgrids. In Model Predictive Control of Microgrids; Springer International Publishing: Cham, Switzerland, 2020; pp. 77–107. [Google Scholar] [CrossRef]
  17. Camacho, E.F.; Bordons, C. Model Predictive Controllers. In Model Predictive Control; Springer: London, UK, 2007; pp. 13–30. [Google Scholar] [CrossRef]
  18. Wang, L. Model Predictive Control System Design and Implementation Using MATLAB®; Springer: London, UK, 2009. [Google Scholar] [CrossRef]
  19. Negri, S.; Giani, F.; Massi Pavan, A.; Mellit, A.; Tironi, E. MPC-based control for a stand-alone LVDC microgrid for rural electrification. Sustain. Energy Grids Netw. 2022, 32, 100777. [Google Scholar] [CrossRef]
  20. Sen, S.; Kumar, M. MPC Based Energy Management System for Grid-Connected Smart Buildings with EVs. In Proceedings of the 2022 IEEE IAS Global Conference on Emerging Technologies (GlobConET), London, UK, 19–21 May 2022; pp. 146–151. [Google Scholar] [CrossRef]
  21. Ryu, K.S.; Kim, D.J.; Ko, H.; Boo, C.J.; Kim, J.; Jin, Y.G.; Kim, H.C. MPC Based Energy Management System for Hosting Capacity of PVs and Customer Load with EV in Stand-Alone Microgrids. Energies 2021, 14, 4041. [Google Scholar] [CrossRef]
  22. Freire, V.A.; De Arruda, L.V.R.; Bordons, C.; Márquez, J.J. Optimal Demand Response Management of a Residential Microgrid Using Model Predictive Control. IEEE Access 2020, 8, 228264–228276. [Google Scholar] [CrossRef]
  23. Dong, R.; Liu, S.; Liang, G.; An, X.; Xu, Y. Output Control Method of Microgrid VSI Control Network Based on Dynamic Matrix Control Algorithm. IEEE Access 2019, 7, 158459–158480. [Google Scholar] [CrossRef]
  24. Petrollese, M.; Valverde, L.; Cocco, D.; Cau, G.; Guerra, J. Real-time integration of optimal generation scheduling with MPC for the energy management of a renewable hydrogen-based microgrid. Appl. Energy 2016, 166, 96–106. [Google Scholar] [CrossRef]
  25. Parisio, A.; Wiezorek, C.; Kyntäjä, T.; Elo, J.; Johansson, K.H. An MPC-based Energy Management System for multiple residential microgrids. In Proceedings of the 2015 IEEE International Conference on Automation Science and Engineering (CASE), Gothenburg, Sweden, 24–28 August 2015; pp. 7–14. [Google Scholar] [CrossRef]
  26. Wang, X.; Atkin, J.; Bazmohammadi, N.; Bozhko, S.; Guerrero, J.M. Optimal Load and Energy Management of Aircraft Microgrids Using Multi-Objective Model Predictive Control. Sustainability 2021, 13, 13907. [Google Scholar] [CrossRef]
  27. Acevedo-Arenas, C.Y.; Correcher, A.; Sánchez-Díaz, C.; Ariza, E.; Alfonso-Solar, D.; Vargas-Salgado, C.; Petit-Suárez, J.F. MPC for optimal dispatch of an AC-linked hybrid PV/wind/biomass/H2 system incorporating demand response. Energy Convers. Manag. 2019, 186, 241–257. [Google Scholar] [CrossRef]
  28. Achour, Y.; Ouammi, A.; Zejli, D. Model Predictive Control Based Demand Response Scheme for Peak Demand Reduction in a Smart Campus Integrated Microgrid. IEEE Access 2021, 9, 162765–162778. [Google Scholar] [CrossRef]
  29. Maślak, G.; Orłowski, P. Microgrid Operation Optimization Using Hybrid System Modeling and Switched Model Predictive Control. Energies 2022, 15, 833. [Google Scholar] [CrossRef]
  30. Zhang, Y.; Meng, F.; Wang, R.; Kazemtabrizi, B.; Shi, J. Uncertainty-resistant stochastic MPC approach for optimal operation of CHP microgrid. Energy 2019, 179, 1265–1278. [Google Scholar] [CrossRef]
  31. Polimeni, S.; Meraldi, L.; Moretti, L.; Leva, S.; Manzolini, G. Development and experimental validation of hierarchical energy management system based on stochastic model predictive control for Off-grid Microgrids. Adv. Appl. Energy 2021, 2, 100028. [Google Scholar] [CrossRef]
  32. Zhang, J.; Li, J.; Wang, N.; Wu, B. An enhanced predictive hierarchical power management framework for islanded microgrids. IET Gener. Transm. Distrib. 2022, 16, 503–516. [Google Scholar] [CrossRef]
  33. Luo, Z.; Wu, Z.; Li, Z.; Cai, H.; Li, B.; Gu, W. A two-stage optimization and control for CCHP microgrid energy management. Appl. Therm. Eng. 2017, 125, 513–522. [Google Scholar] [CrossRef]
  34. Torres-Moreno, J.L.; Gimenez-Fernandez, A.; Perez-Garcia, M.; Rodriguez, F. Energy Management Strategy for Micro-Grids with PV-Battery Systems and Electric Vehicles. Energies 2018, 11, 522. [Google Scholar] [CrossRef] [Green Version]
  35. Velarde, P.; Valverde, L.; Maestre, J.; Ocampo-Martinez, C.; Bordons, C. On the comparison of stochastic model predictive control strategies applied to a hydrogen-based microgrid. J. Power Sources 2017, 343, 161–173. [Google Scholar] [CrossRef] [Green Version]
  36. Pereira, M.; Limon, D.; Muñoz de la Peña, D.; Valverde, L.; Alamo, T. Periodic Economic Control of a Nonisolated Microgrid. IEEE Trans. Ind. Electron. 2015, 62, 5247–5255. [Google Scholar] [CrossRef]
  37. Moya, F.D.; Torres-Moreno, J.L.; Álvarez, J.D. Optimal Model for Energy Management Strategy in Smart Building with Energy Storage Systems and Electric Vehicles. Energies 2020, 13, 3605. [Google Scholar] [CrossRef]
  38. Duffie, J.A.; Beckman, W.A.; Blair, N. Solar Engineering of Thermal Processes, Photovoltaics and Wind; John Wiley & Sons: Hoboken, NJ, USA, 2020. [Google Scholar]
  39. Ramos-Teodoro, J.; Rodriguez, F.; Berenguel, M. Modelado de Instalaciones Fotovoltaicas para la Gestión de un Energy hub con Recursos Heterogéneos. XVI Simposio CEA de Ingeniería de Control. 2018. Available online: http://hdl.handle.net/10835/5711 (accessed on 6 January 2023).
  40. Technosun. REC PE Peak Energy Series Solar Panels-Model REC 260PE. Technical Report, 2022.
  41. Alves, A.; Marinho, R.; Brigatto, G.; Garces, L. Multilayer Stratification Earth by Kernel Function and Quasi-Newton Method. IEEE Lat. Am. Trans. 2016, 14, 225–234. [Google Scholar] [CrossRef]
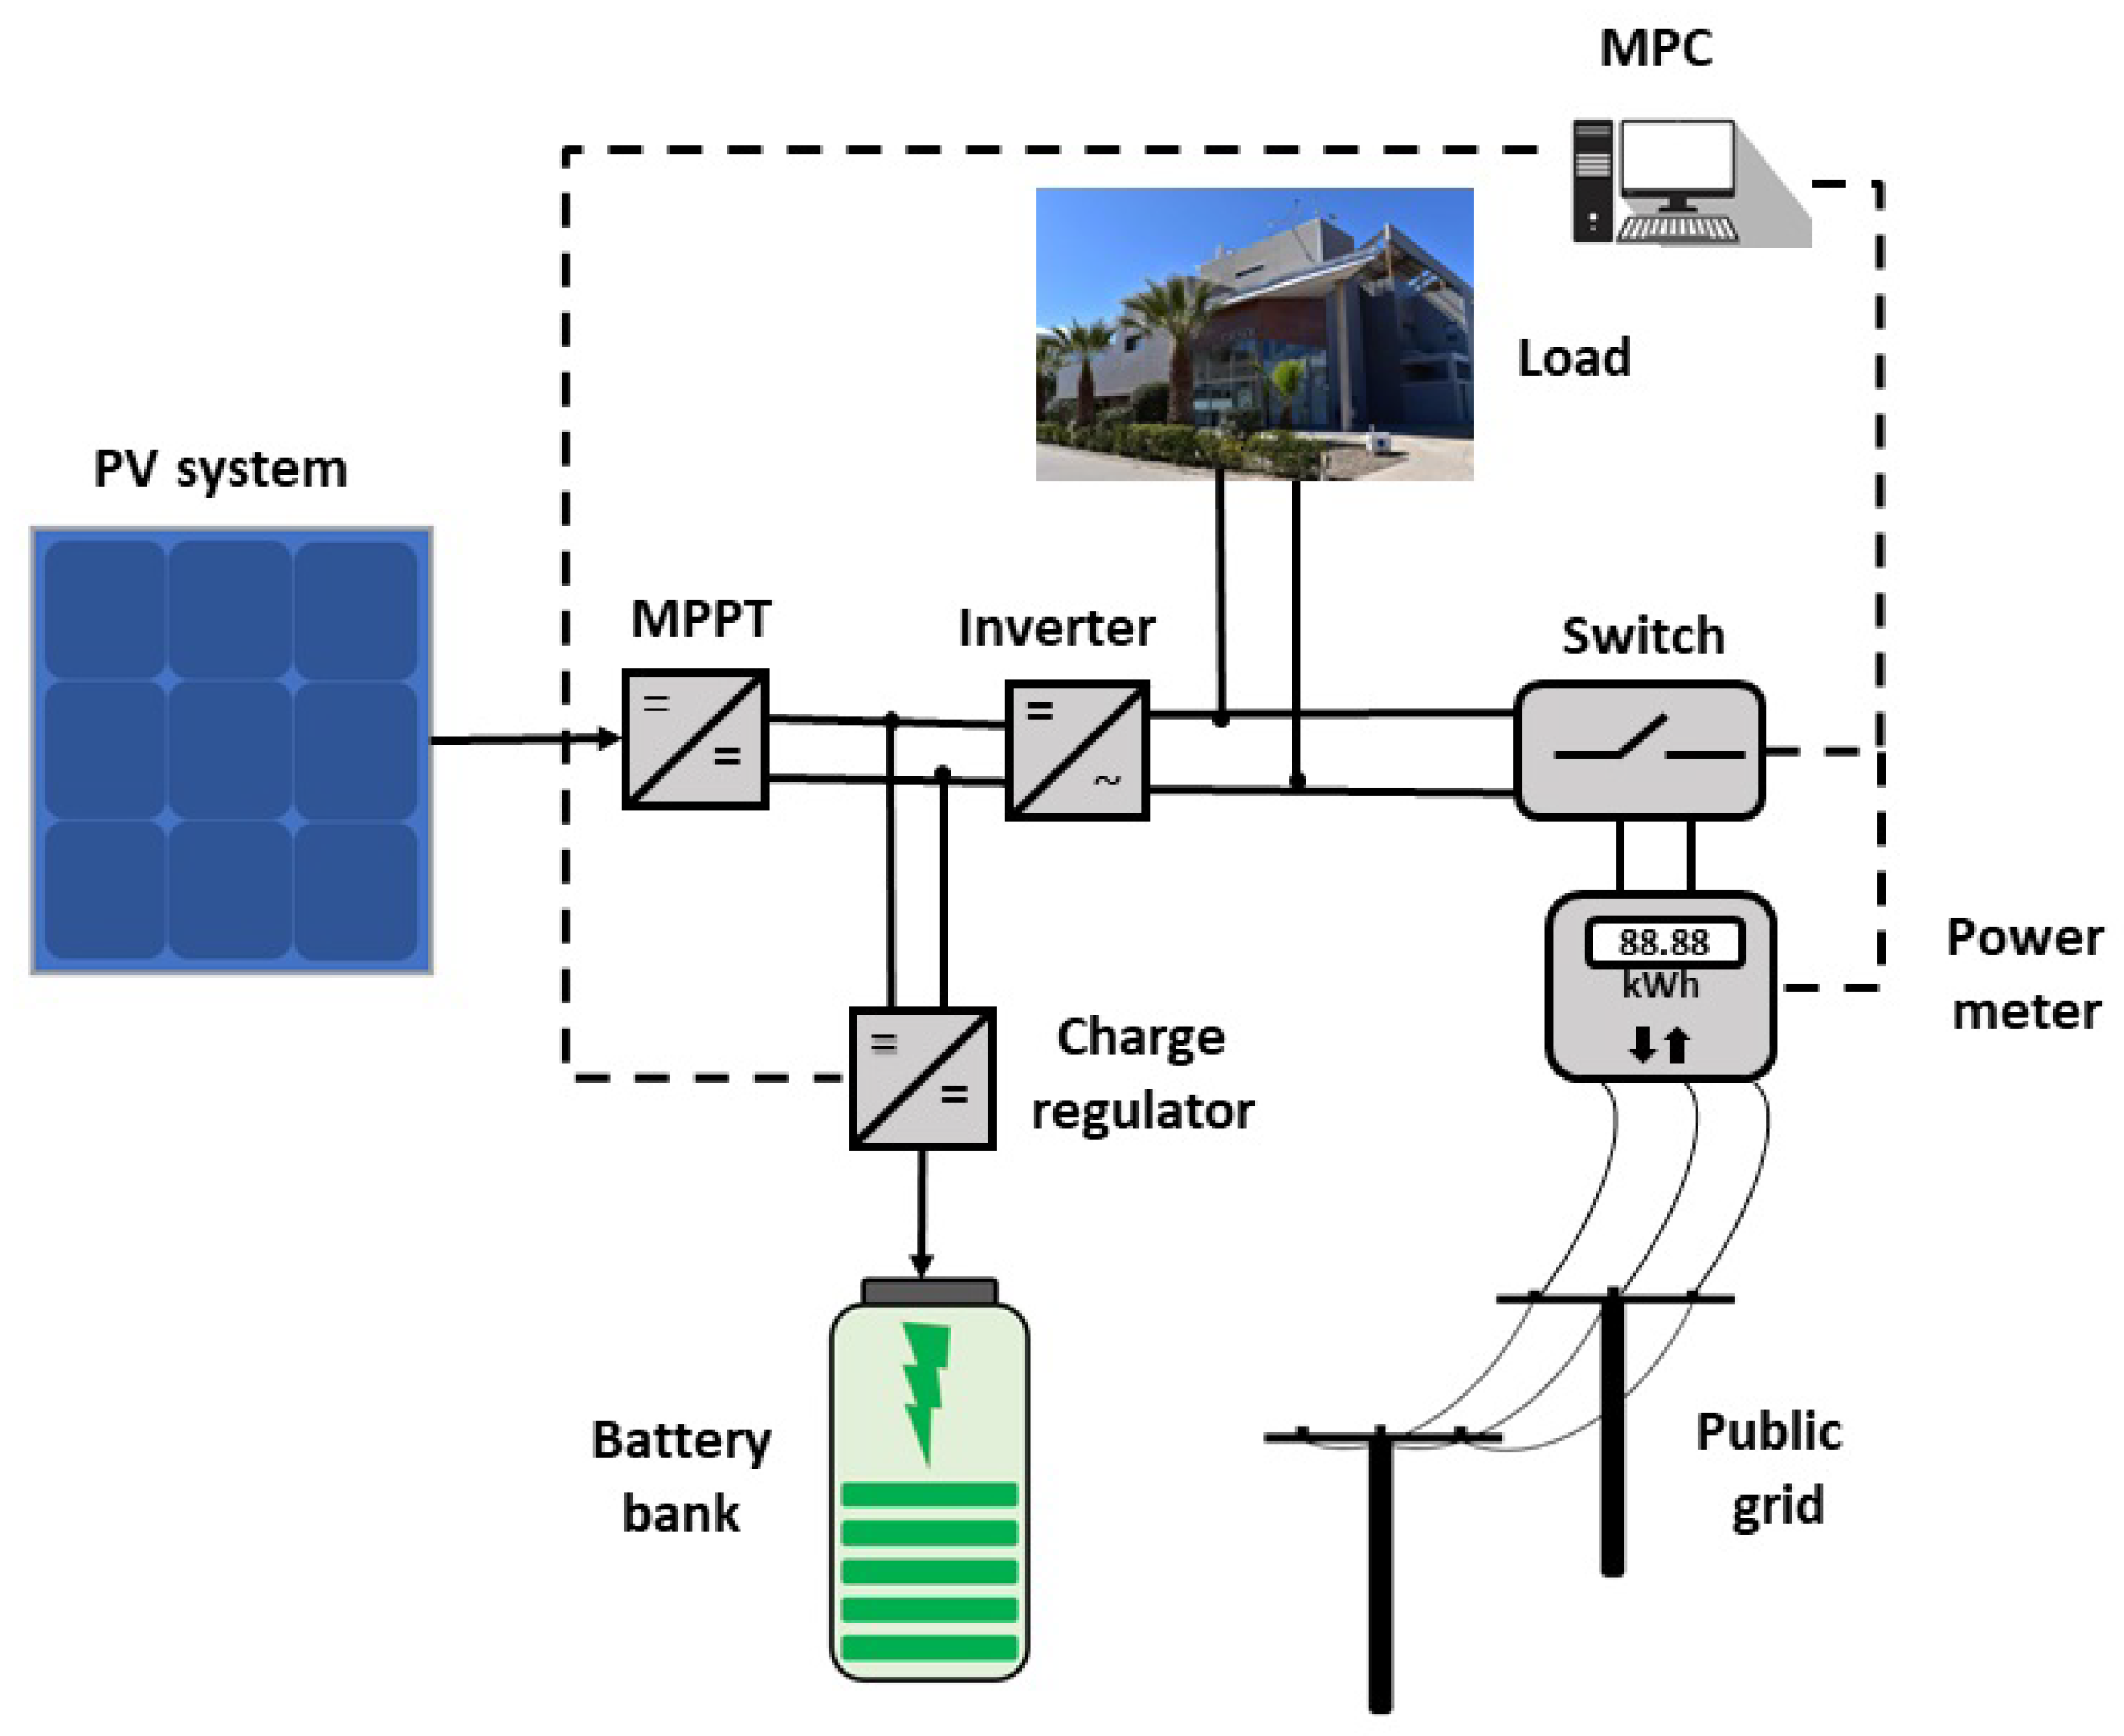
Figure 1. Simplified diagram of the MG.
Solar 03 00005 g001
Figure 2. Electrical model for a PV panel [39].
Solar 03 00005 g002
Figure 3. Representation of energy demand for one day.
Solar 03 00005 g003
Figure 4. Representation of energy demand for five days.
Solar 03 00005 g004
Figure 5. Demand response and battery SOC.
Solar 03 00005 g005
Figure 6. Demand response and battery SOC.
Solar 03 00005 g006
Table 1. Energy supplied in one and five days.
DaysHorizonsFES (kWh)RES (kWh)ESS (kWh)T exe , max (s)T exe , mean (s)
1 N p = 6 ,
N c = 2
6.43478.74144.50544.35400.3581
N p = 6 ,
N c = 3
6.36848.74124.57194.00060.3235
N p = 6 ,
N c = 6
6.15288.74074.78804.24430.3521
1 N p = 12 ,
N c = 2
6.42248.74114.51803.56710.2963
N p = 12 ,
N c = 3
6.31688.74124.62354.07830.3340
N p = 12 ,
N c = 6
5.80388.74065.13714.21330.3710
1 N p = 18 ,
N c = 2
6.41818.74114.52234.03930.3348
N p = 18 ,
N c = 3
6.27648.74114.66403.96980.3281
N p = 18 ,
N c = 6
5.60378.74055.33734.11170.3435
1 N p = 24 ,
N c = 2
6.40898.74104.53163.82420.3086
N p = 24 ,
N c = 3
6.22548.74084.71533.79050.3199
N p = 24 ,
N c = 6
5.50248.74035.43883.99970.3658
5 N p = 6 ,
N c = 2
51.275238.23019.49573.99690.2603
N p = 6 ,
N c = 3
51.002238.22939.76953.63940.2714
N p = 6 ,
N c = 6
50.176038.227510.59754.30160.3152
5 N p = 12 ,
N c = 2
49.508438.224911.26774.07060.2800
N p = 12 ,
N c = 3
49.147638.224411.62901.30300.0988
N p = 12 ,
N c = 6
45.514538.218015.26851.37260.1074
5 N p = 18 ,
N c = 2
48.493238.219112.28871.30610.0966
N p = 18 ,
N c = 3
47.624738.219213.15711.28470.0975
N p = 18 ,
N c = 6
45.514538.218015.26851.30160.1048
5 N p = 24 ,
N c = 2
48.279938.214812.50631.24550.0997
N p = 24 ,
N c = 3
46.989738.216713.79461.22920.1028
N p = 24 ,
N c = 6
44.245738.216216.53911.49560.1089
Disclaimer/Publisher’s Note: The statements, opinions and data contained in all publications are solely those of the individual author(s) and contributor(s) and not of MDPI and/or the editor(s). MDPI and/or the editor(s) disclaim responsibility for any injury to people or property resulting from any ideas, methods, instructions or products referred to in the content.