Abstract
Salmonid fishes provide an important indicator of climate change given their reliance on cold water. We evaluated temporal changes in the density of stream-dwelling brook trout (Salvelinus fontinalis) from surveys conducted over a 36-year period (1988–2023) by the Maryland Department of Natural Resources in Eastern North America. Nonparametric trend analyses revealed decreasing densities of adult fish (age 1+) in 19 sites (27%) and increases in 5 sites (7%). In contrast, juvenile fish (age 0) densities decreased in 4 sites (6%) and increased in 10 sites (14%). Declining adult brook trout trends were related to atmospheric warming rates during the study period, and this relationship was stronger than the effects of land use change or non-native brown trout. In contrast, juvenile fish trends generally increased with elevation but were not related to air temperature trends or land use change. Our analysis reveals significant changes in several brook trout populations over recent decades and implicates warming atmospheric conditions in population declines. Our findings also suggest the importance of temperature for adult survival rather than recruitment limitation in brook trout population dynamics.
1. Introduction
Native brook trout (Salvelinus fontinalis) are ecologically, culturally, and economically important in the Appalachian mountains of Eastern North America. Nonetheless, losses in brook trout abundance and occurrence have been reported across the region and attributed to land use, climate change, and biological interactions with non-native species [1,2,3]. However, the relative importance of these effects is unclear, and conservation and restoration planning could benefit from improved understanding in this regard. Here, we evaluate brook trout population trends over a 36-year period (1988–2023) in Maryland, USA, and we explore alternative environmental explanations for the observed temporal trends.
Land use practices are clearly linked to brook trout habitat suitability and losses of brook trout in Appalachia. In a regional study of Appalachian mountain streams, Hudy et al. [1] reported that “intact” brook trout watersheds (i.e., watersheds with >50% of streams supporting self-sustaining populations) were located within forested catchments, whereas watersheds with reduced or extirpated brook trout populations contained comparatively more agricultural and urban development. Likewise, Stranko et al. [2] found that brook trout almost never occurred in watersheds with more than 4% impervious surface area. Forest cover also provides a strong predictor of brook trout occupancy in regional models [4,5,6,7]. Conversely, loss of forest cover is associated with increases in stream flow variation [8], sedimentation [9], and stream temperature [10], and such environmental changes may be causing the observed declines in brook trout abundance and occurrence.
Warming stream temperatures due to climate change have also been identified as a possible cause of brook trout declines. Meisner [11] observed strong thermal controls on the distribution of native brook trout in the Southern Appalachian Mountains and concluded that atmospheric warming would reduce their distribution, which causes groundwater temperatures to exceed approximately 15 °C. Bassar et al. [12] determined that observed increases in brook trout mortality rates could be attributed to climate-driven increases in stream temperature, and this was particularly true for young age classes of trout. Childress et al. [3] detected declines in brook trout abundance in approximately 70% of the streams in Shenandoah National Park and attributed these changes to increasing water temperatures that were unassociated with land use change.
Although increasing water temperature can increase brook trout growth rates during the winter and spring [13] and are associated with increased adult body size [14], warming rates above 2 °C background levels are expected to decrease growth rates due to increased energetic demands [15]. Moreover, brook trout exhibit physiological and behavioral stress responses when exposed to temperatures above 20 °C [16,17], and lethal limits have been reported at 24 °C [18]. Given the observed warming trends in Appalachian streams and rivers [19,20,21], atmospheric warming is recognized as a likely contributor to native brook trout declines [1], and this has motivated research on the role of groundwater as thermal refugia for native trout in Appalachia [22,23,24].
Non-native brown trout (Salmo trutta) have also been recognized as a stressor for brook trout and have been associated with population declines. Experimental evidence has demonstrated that brown trout displace brook trout for optimal foraging locations in streams [25], and this competition pressure increases with water temperature [17]. Species distribution models have also revealed a negative effect of brown trout on brook trout occupancy probability [26], and field studies have demonstrated decreased brook trout growth, abundance, and occurrence probability in the presence of introduced brown trout [27,28,29,30]. Removal of brown trout from streams has resulted in increased brook trout abundance in experimental studies [31,32]. However, such effects may be context-dependent because Odenkirk and Isel [33] observed no effects of increasing brown trout abundance on brook trout biomass or abundance in an Appalachian stream.
Land use change, climate change, and introduced species can synergistically impact salmonid fishes [34,35], and an improved understanding of their relative importance and interactive effects may inform conservation planning for native trout. Our aims in this study were to (a) estimate temporal trends in adult and juvenile fish density within streams, (b) explore the relative importance of environmental covariates to explain observed trends at the watershed level, and (c) discuss the implications for conservation and restoration planning. We expected that changes in forest cover would explain brook trout population trends in the study area.
2. Materials and Methods
2.1. Fish Data
We evaluated fish abundance data collected in 70 stream sites in Maryland, USA (Figure 1; Appendix A) over a 36-year period (1988–2023). Sites included locations within the Piedmont (n = 15), Blue Ridge (n = 18), and Appalachian Plateau (n = 37) physiographic regions of Eastern North America. Sites were located within primarily forested watersheds (mean = 78%, sd = 17.5%) but also included some developed lands (mean = 8%, sd = 10.8%) and agricultural lands (mean = 12%, sd = 13.3%) based on National Land Cover Database (NLCD) records available during the study period (2001 and 2019).
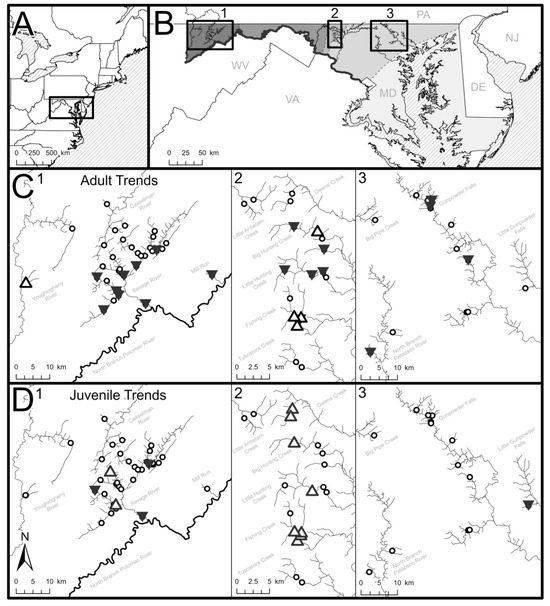
Figure 1.
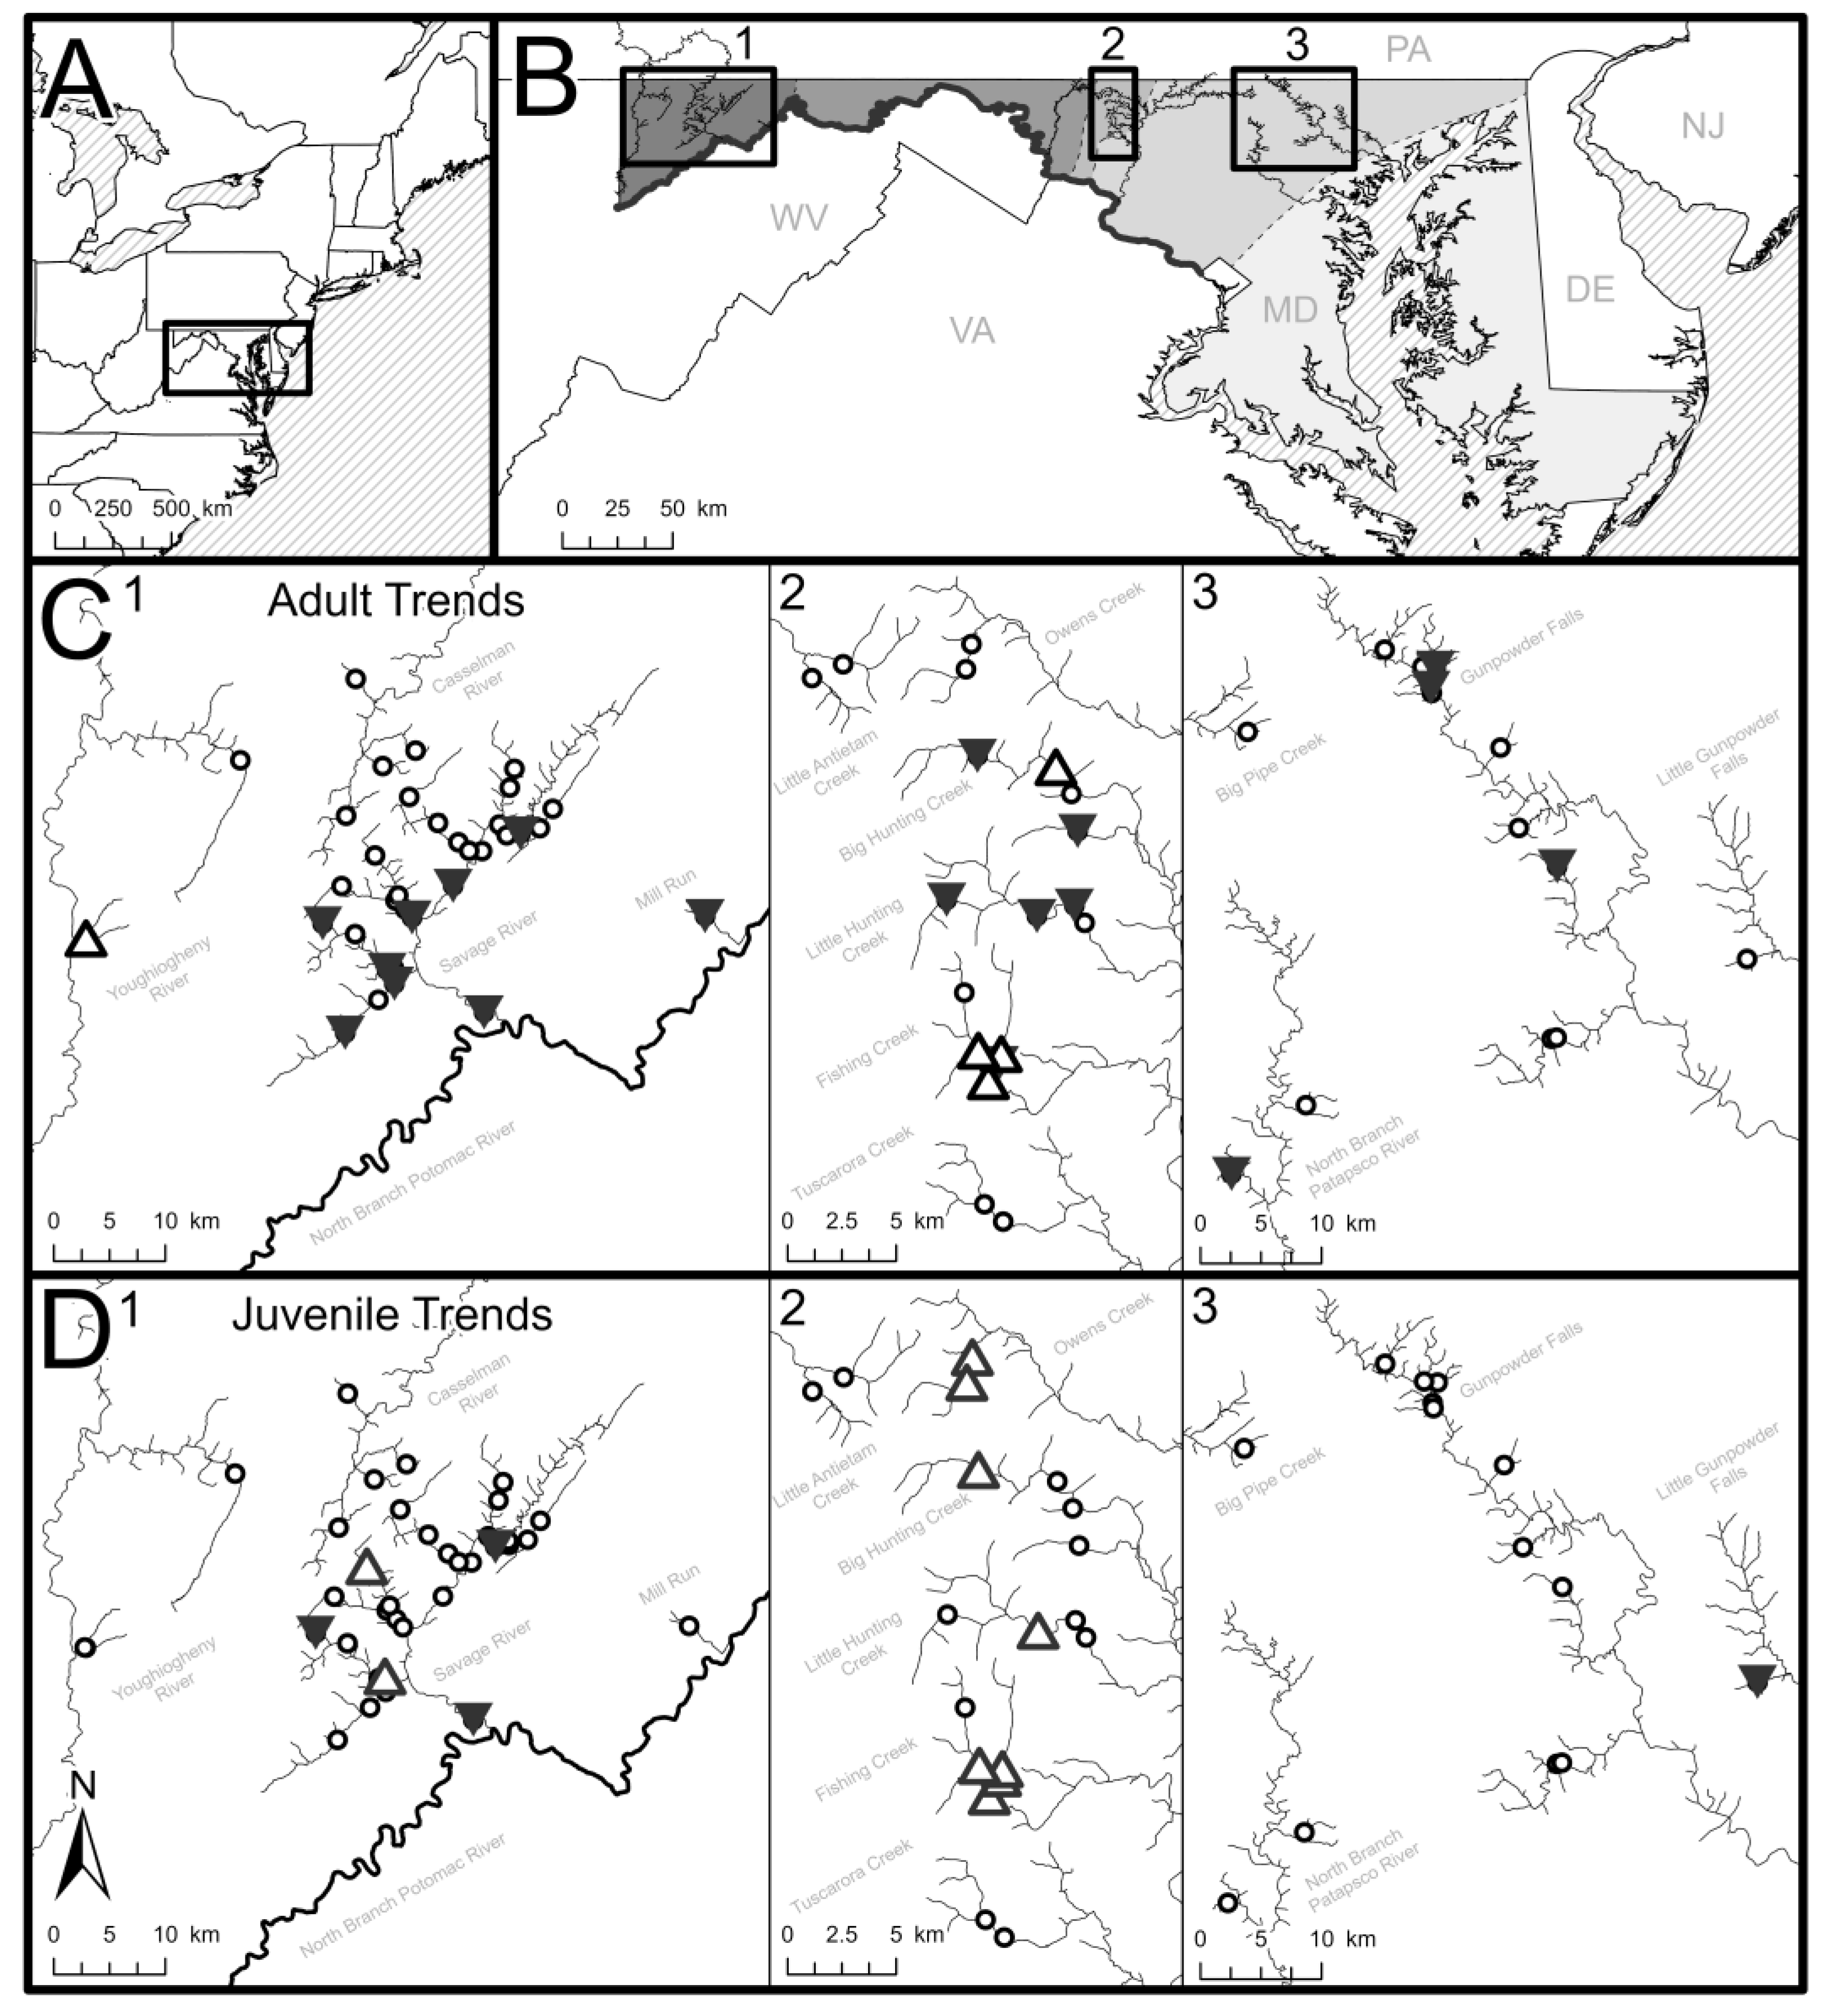
(A) The study region where brook trout density data were collected in Maryland, USA (shown as inset box). (B) Inset maps are defined for study sites within (1) Appalachian Plateau, (2) Blue Ridge, and (3) Piedmont physiographic regions (shaded in greyscale) and correspond with the (C) adult and (D) juvenile brook trout temporal trend locator maps. Significantly increasing temporal trends in fish density are shown by hollow, upward-facing arrows (increasing Sen’s slope; Mann–Kendall p < 0.01), significantly decreasing temporal trends in fish density are shown by filled, downward-facing arrows (decreasing Sen’s slope; Mann–Kendall p < 0.01), and sites lacking significant temporal trends are shown with open circles.
Sites were sampled during summer baseflow conditions by Maryland Department of Natural Resources (MDDNR) personnel using standardized electrofishing techniques. The fish dataset included 215 surveys by the Maryland Biological Streams Survey (MBSS) within the Sentinel Site network and 784 surveys by personnel with the Freshwater Fisheries and Hatcheries Division (FFHD). The dataset included a few sites in large rivers, but we limited the dataset to sites draining watersheds < 130 km2 to facilitate environmental analysis of headwater stream populations.
All observed trout were identified to species and counted in each survey, with juvenile (age-0) fish recorded separately from adult (age 1+) fish based on inspection of length-frequency histograms. Most surveys were conducted during summer months (June, July, and August; 94%), but some were conducted during fall months (September, October; 6%). The dataset included more surveys during the last half of the study period (2016–2023; 75%) than the first half (1988–2005; 25%), but sample month was randomly distributed across all sample years (Spearman rho, p = 0.4) suggesting that temporal patterns should not be confounded by season.
Fish surveys included estimates of sampled stream width and length, and we used this to estimate fish density (fish/m2) to control for differences in sample area and habitat volume across sites and surveys. MBSS surveys used two electrofishing passes within fixed 75 m stream reaches [36], whereas FFHD surveys generally encompassed longer stream reaches (mean = 98 m). Sites were sampled by either MBSS or FFHD over time, and such standardized sampling facilitates temporal trend analysis.
We evaluated non-native trout based on the observed presence or absence of brown trout in the MDDNR fish survey data. We further classified sites based on the presence of juvenile (age 0) brown trout to explore potential differences between put-and-take fisheries and wild populations supporting local reproduction. We considered non-native brown trout present for this analysis if they occurred in any survey within a given site, and we treated this as a factorial variable in analysis (present/absent). MDDNR has not stocked brook trout during the study period, and therefore, we interpret brook trout records as samples from wild populations.
2.2. Trend Analysis
We estimated temporal changes in adult and juvenile fish density using nonparametric methods commonly used for hydrological and ecological trend assessment [37,38]. First, we estimated the probability of non-random monotonic temporal trends in fish density from Mann–Kendall S [39,40]. This statistic is based on the sum of the signed ranks of all pairwise comparisons over the time series. We calculated S with a continuity correction for tied pairs, and we used an alpha level of 0.1 to interpret statistical significance of the associated temporal trends.
Second, we calculated Sen’s slope [41] for each site to estimate the magnitude of temporal trends. Like the Mann–Kendall statistic, Sen’s slope evaluates all pairwise combinations of observations in a time series, but in this case, it is calculated as the median of all pairwise slopes (rather than signed-rank sums). We used these nonparametric methods for trend analysis because they are less sensitive to outliers, heteroscedastic error distributions, and non-independence of sequential years that can boost type-I error rates in linear regression models and associated techniques [42] and because their simplicity facilitates replication of our analysis. We used functions in R package “trend” version 1.1.6 to calculate Mann–Kendall statistics and Sen’s slopes [43].
2.3. Environmental Analysis
We explored geophysical attributes, land use, non-native trout, and air temperature trends to interpret fish density trends (Table 1). Geophysical attributes included indices of stream habitat volume (upstream basin area), mean annual air temperature (elevation), groundwater contribution to stream flow (baseflow index), and mean depth to bedrock (index of shallow groundwater volume). Land use variables quantified change in the percent of watersheds classified as forest, agriculture, and urban land use between 2001 and 2019 in the NLCD, and we combined NLCD subcategories into generalized classes following Hitt et al. [44]. We also tallied the number of ponds located within 1 km upstream from fish sample sites and within a 100 m lateral buffer around streams. Geophysical and land use data were compiled from the StreamCat dataset at the watershed level [45], and pond data were compiled by Maryland DNR personnel as point locations from satellite imagery (4-band near-infrared spectral data at 15 cm spatial resolution). We included a 100 m buffer distance from streams to tally ponds based on prior research demonstrating thermal effects within this distance [46].

Table 1.
Environmental covariates for fish sample sites in the Piedmont (n = 15), Blue Ridge (n = 18), and Appalachian Plateau (n = 37) physiographic regions sampled over a 36-year period (1988–2023). Cells provide mean values with standard deviations in parentheses. Variable codes for Table 2 are given in brackets.
We also quantified air temperature change to explore atmospheric influences on fish population trends over time. We used Daymet data [47] to calculate Sen’s slopes [41] for trends in mean annual air temperature for each fish survey site across the entire study period (1988–2023). Daymet reports daily minimum and maximum air temperatures from which we estimated daily mean air temperature as half the sum of reported daily minima and maxima. We then calculated the mean annual air temperature from the daily data. We used functions in R package “daymetr” version 1.7.1 to compile Daymet data for each site and year [48]. We then evaluated the relationship between fish population trends and environmental conditions using non-parametric correlations. All analyses were performed in R version 4.3.2 [49].
3. Results
The fish dataset encompassed 24,904 adult brook trout and 15,503 juvenile brook trout across 999 surveys. Sample reach lengths ranged from 42 to 258 m (mean = 93 m), and sample reach widths ranged from 1 to 17 m (mean = 5 m). Based on the sampled area in each survey, observed densities of adult brook trout ranged from 0 to 0.69 fish/m2 (mean = 0.07 fish/m2), and observed densities of juvenile brook trout ranged from 0 to 0.64 fish/m2 (mean = 0.05 fish/m2).
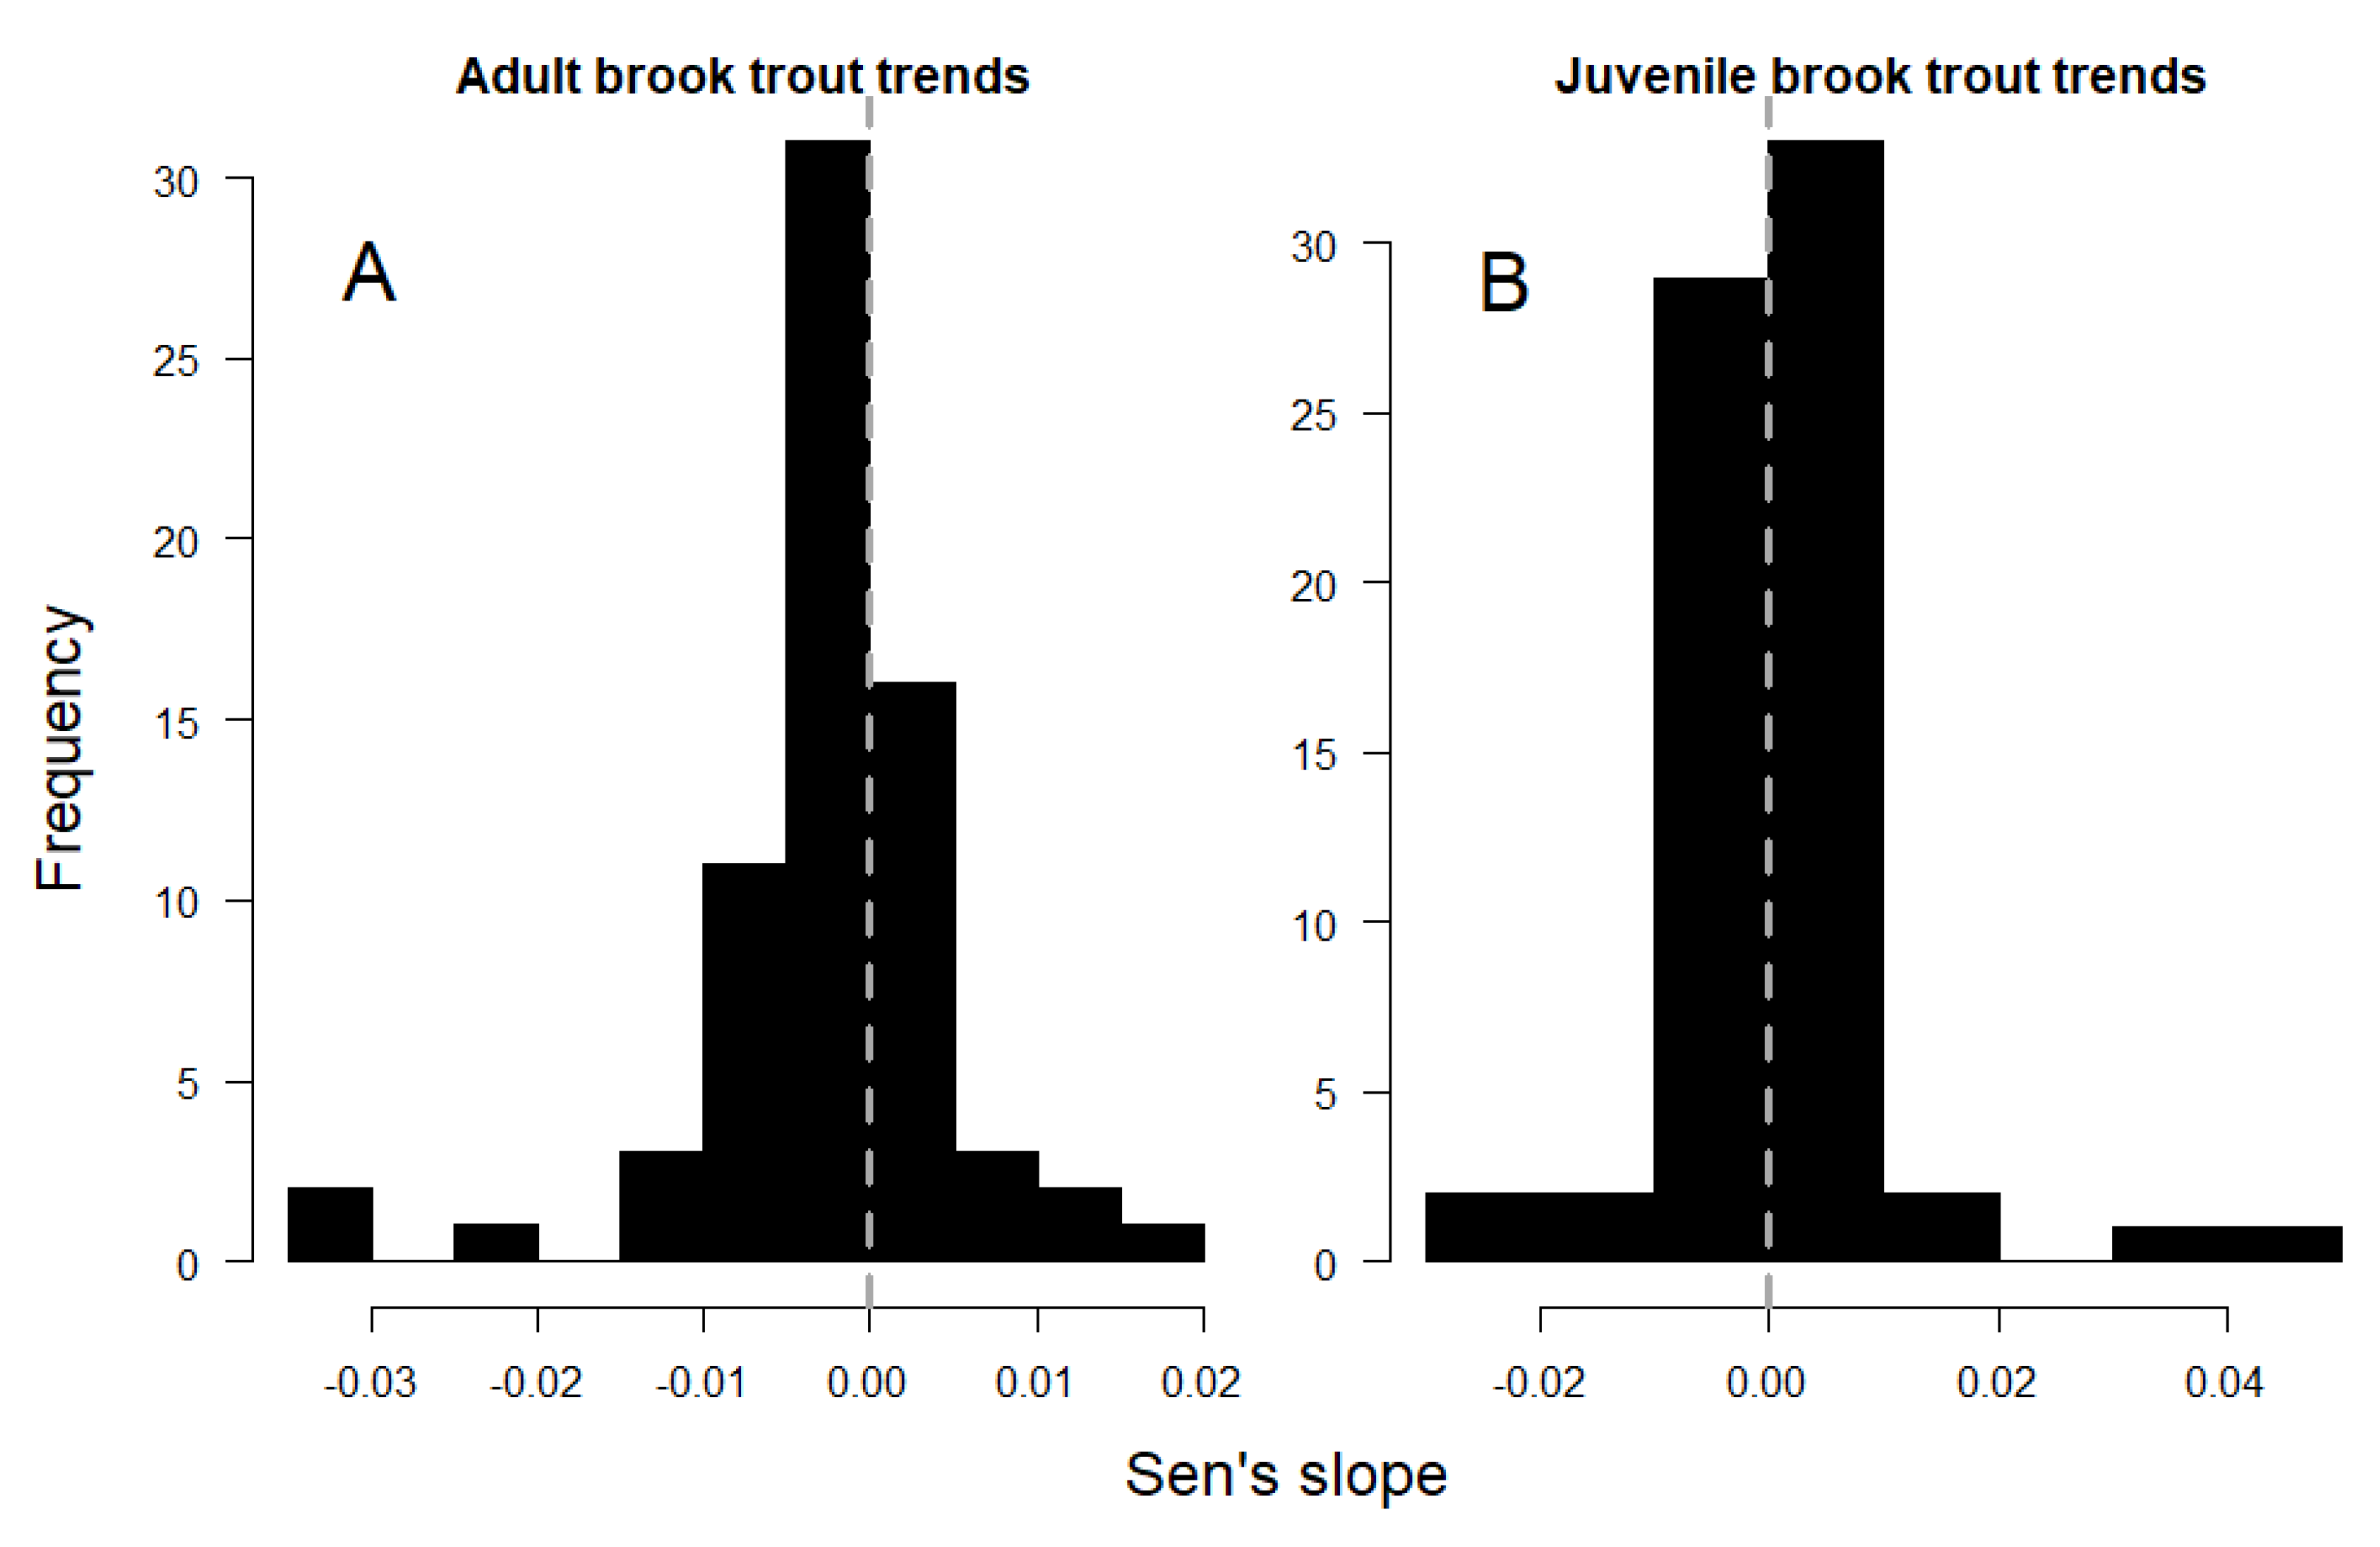
Adult trout densities exhibited a significant declining trend within the study area, as indicated by the negative and asymmetric distribution of Sen’s slope values across sites (Figure 2A; Wilcoxon p < 0.001). Decreasing densities of adult fish were detected in 19 sites (27%), and increases were detected in 5 sites (7%) (Figure 1; Mann–Kendall p < 0.1; respectively). Across all sites, adult fish density decreased by an average of 26 fish/hectare per year, with the loss rate among the 19 decreasing sites averaging 58 fish/hectare per year (mean annual Sen’s slope = −0.0026 and −0.0058 fish/m2/year, respectively).
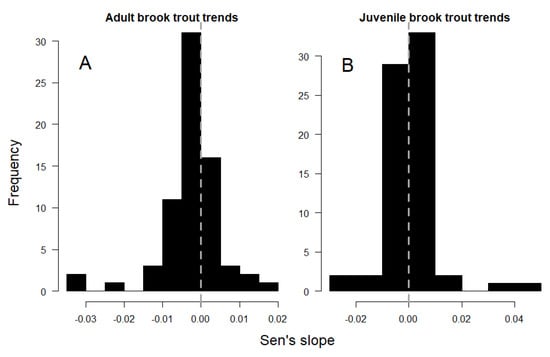
Figure 2.
Distribution of temporal trends in adult (A) and juvenile (B) brook trout density across study sites (Figure 1).
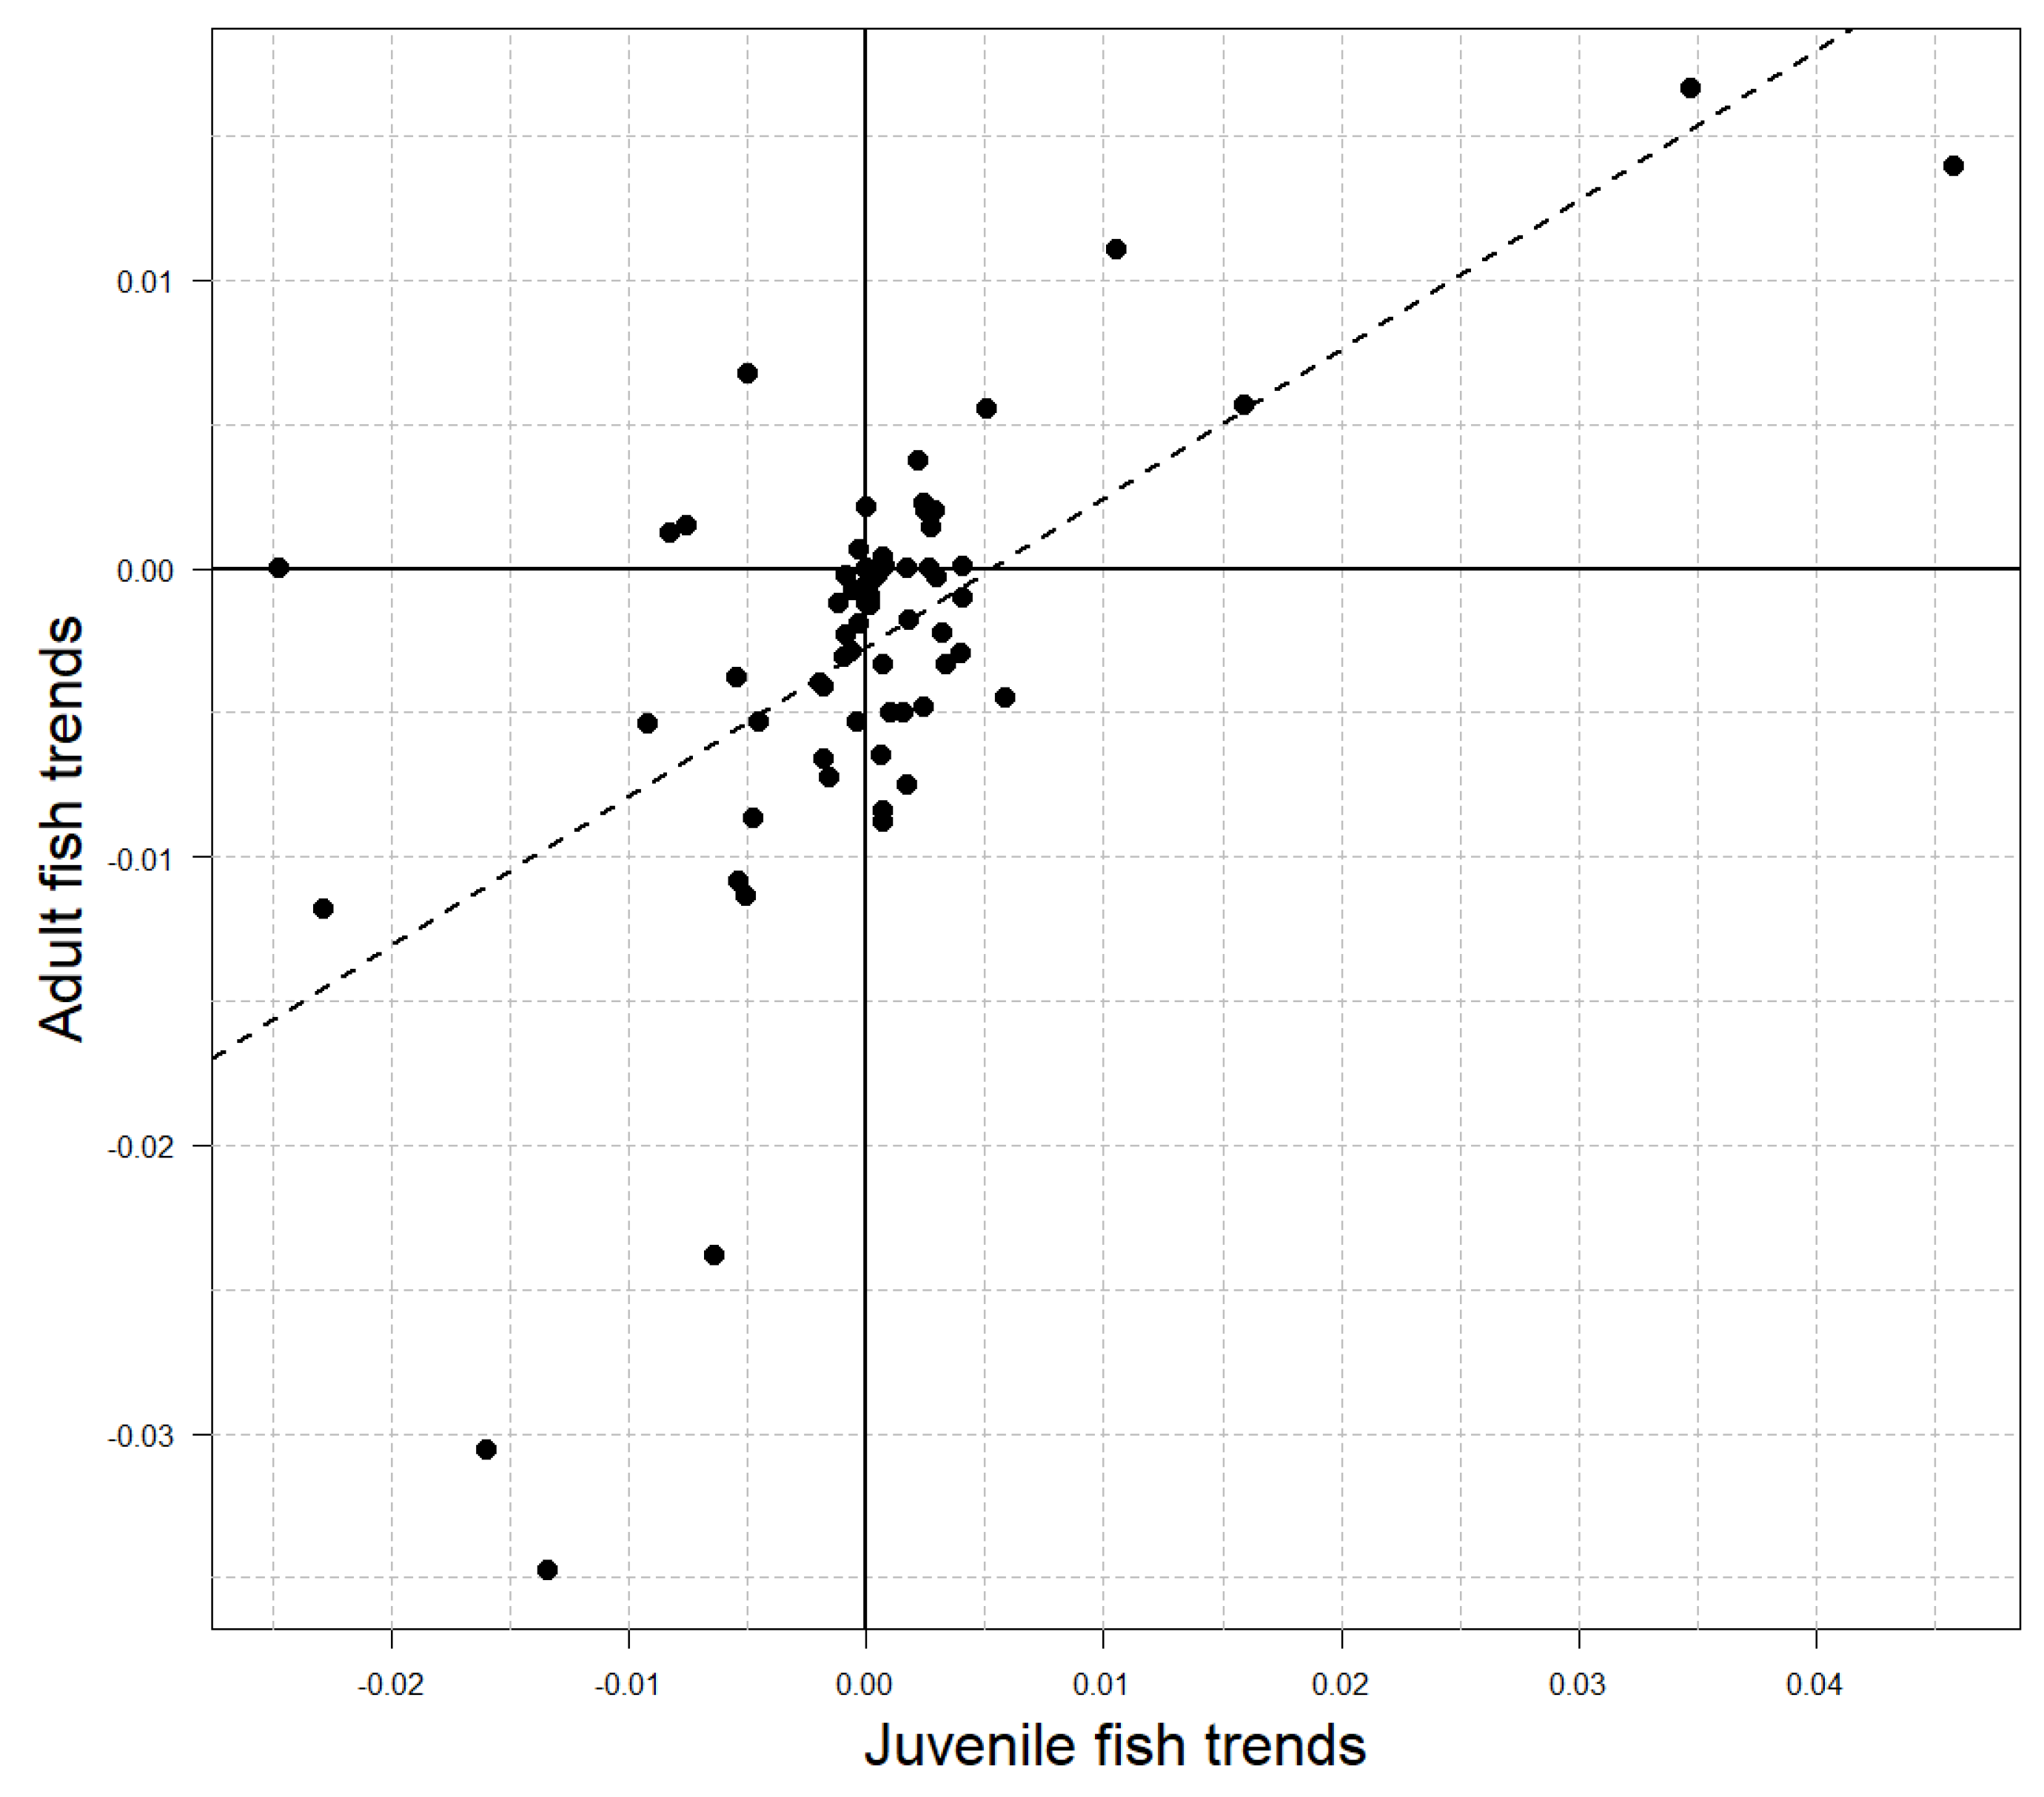
Juvenile fish densities did not exhibit a singular temporal trend within the study area, as indicated by the symmetrical distribution of Sen’s slope values about 0 (Figure 2B; Wilcoxon p = 0.8). However, 10 sites (14%) showed significant increases in juvenile fish densities over time, and 4 sites (6%) showed decreases (Figure 1; Mann–Kendall p < 0.1; respectively). Temporal trends in adult and juvenile density were positively associated across sites (Table 2), and a linear model described the relationship with a slope of 0.52 and R2 of 0.38 (Figure 3).

Table 2.
Correlation matrix for temporal trends in density of brook trout adults (ADU), juveniles (YOY), and environmental covariates across sites (n = 70). Above-diagonal cells show Spearman correlation coefficients and below-diagonal cells show associated p-values. Environmental covariate codes are given in Table 1. Correlations with p < 0.05 are shown in bold.
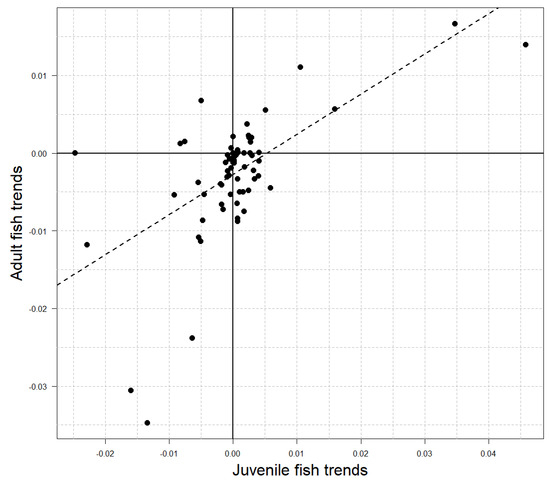
Figure 3.
Relationship between temporal trends in adult (age 1+) and juvenile (age 0) brook trout density across sites (points n = 70; Figure 1). The linear model fit (dashed line) has a slope of 0.52 and intercept of −0.003 with R2 = 0.38.
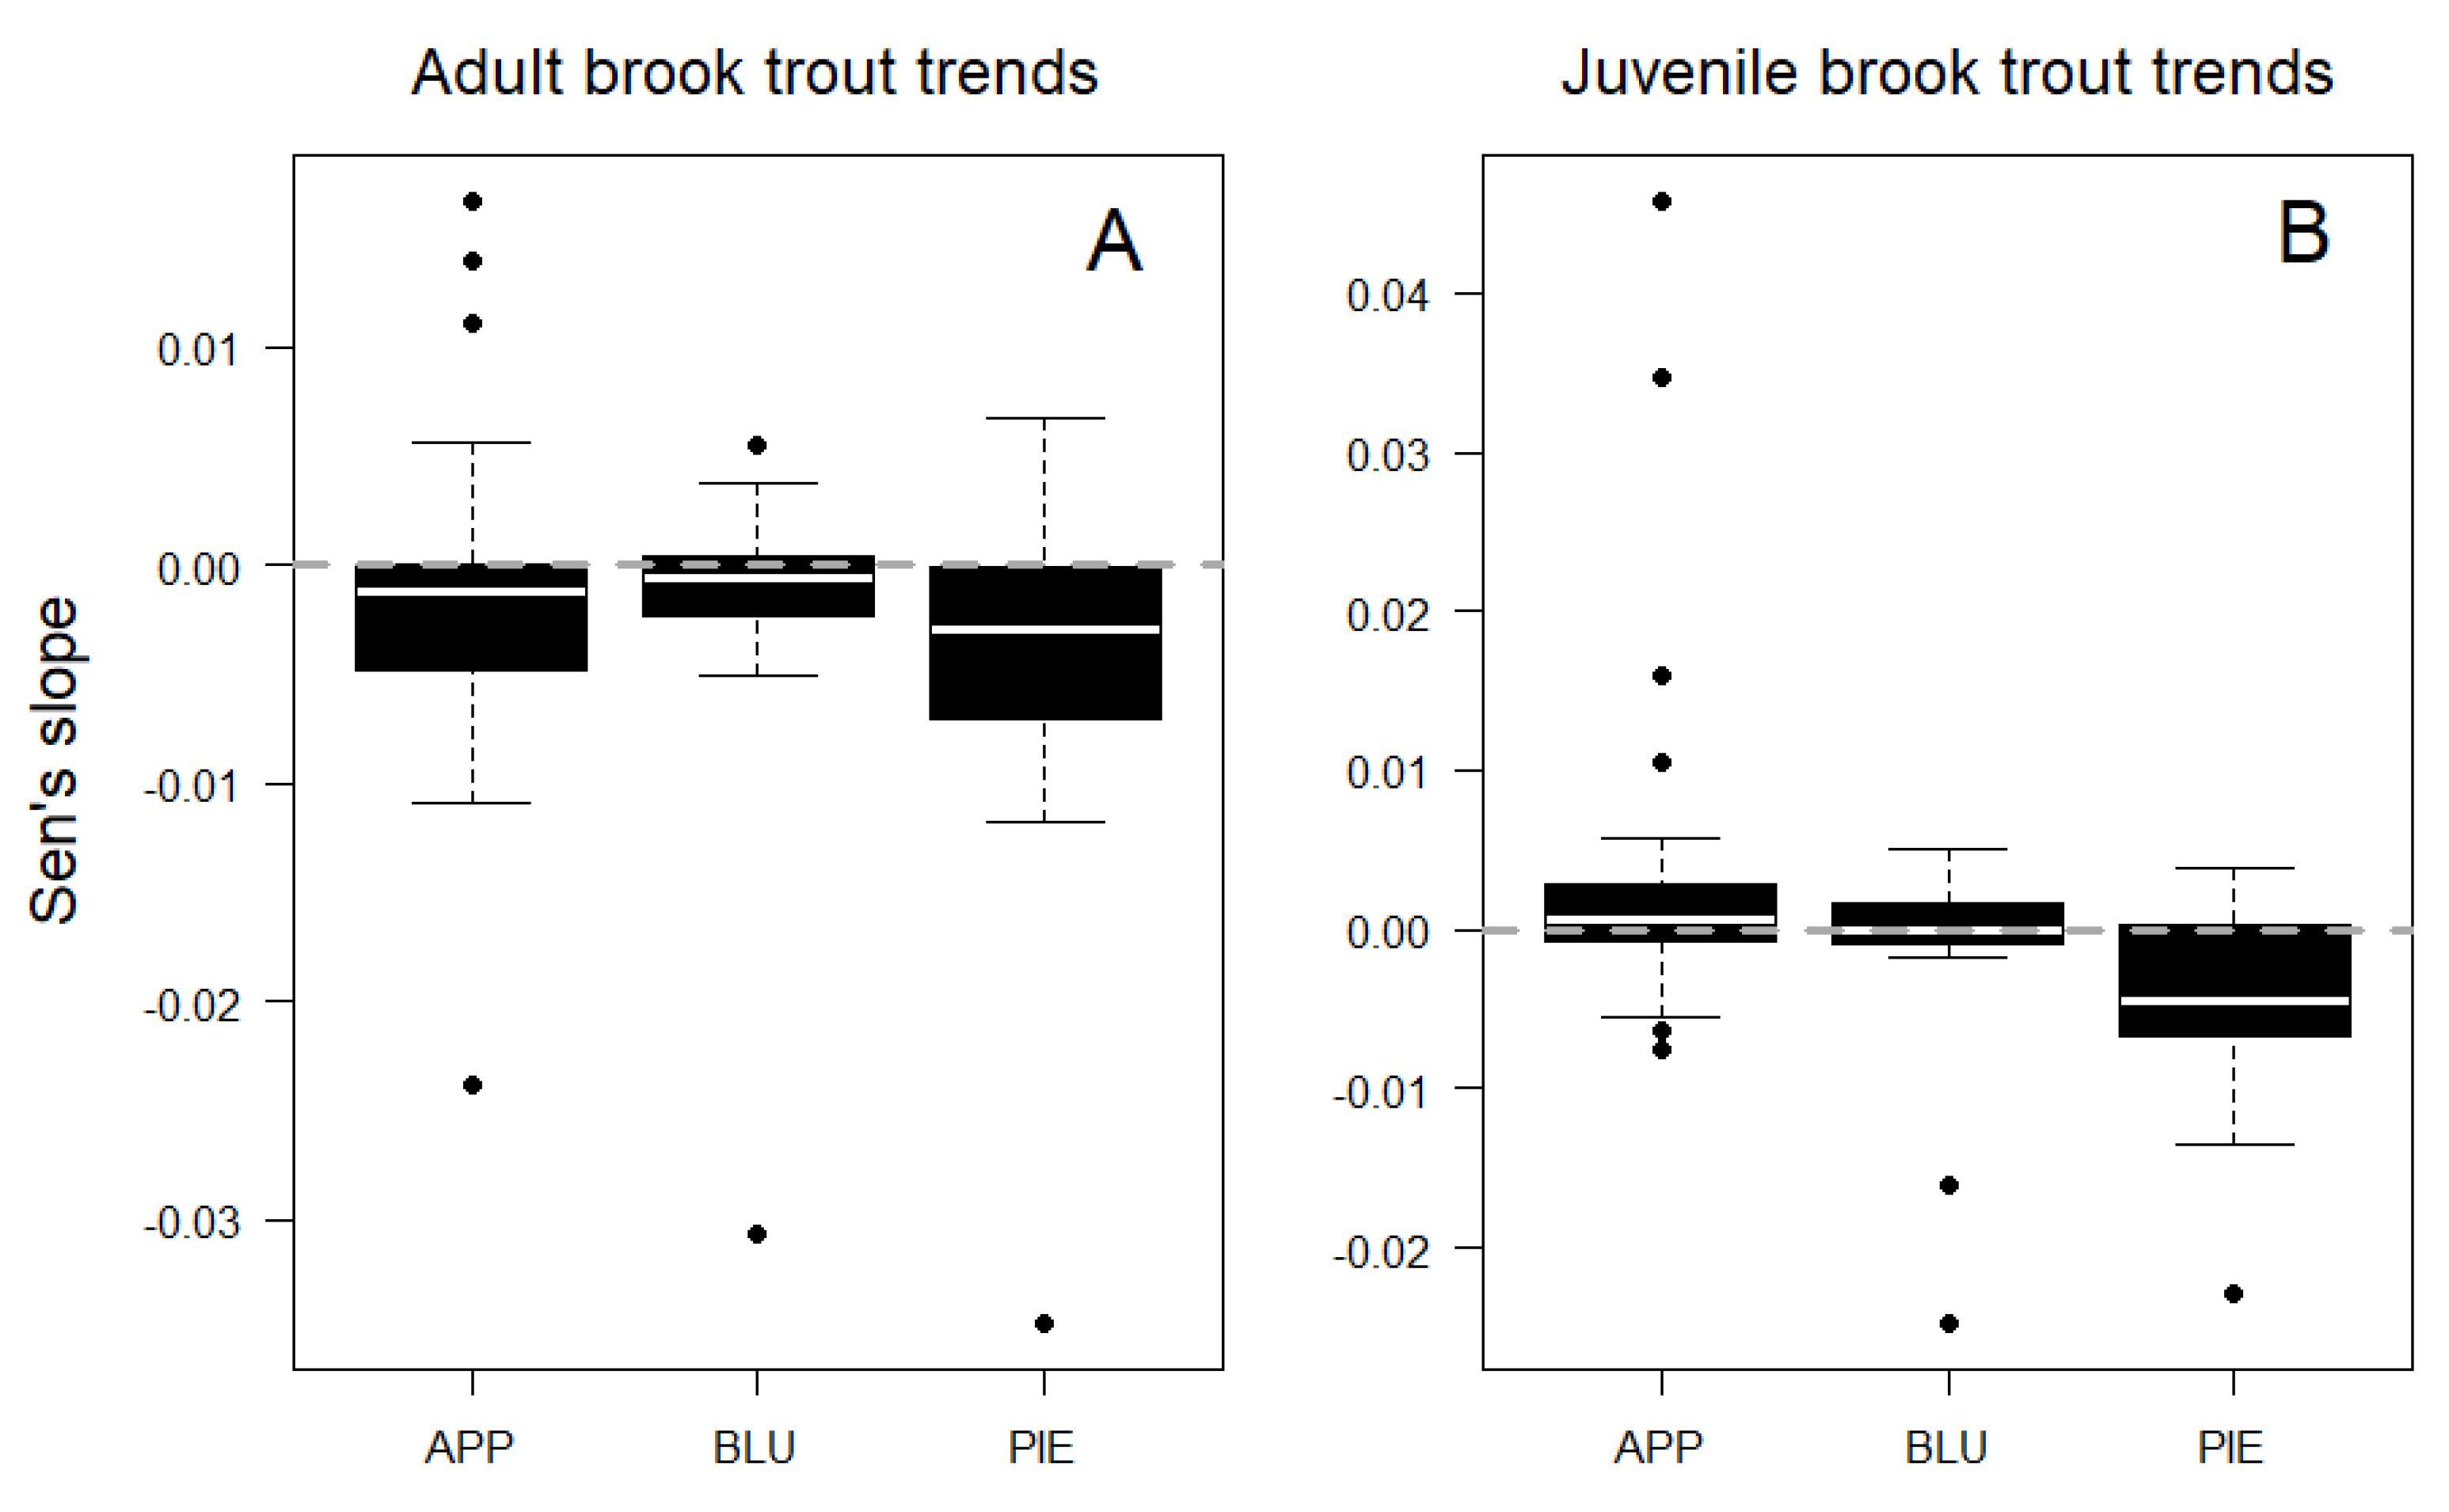
Trends in adult fish density did not vary among physiographic regions (ANOVA F = 1.2, p = 0.3), with similar rates of decline observed in the Piedmont, Blue Ridge, and Appalachian Plateau sites (Figure 4A). However, juvenile fish trends did vary among physiographic regions (ANOVA, F = 4.2, p = 0.02), with sites in the Piedmont showing greater declines than in the Appalachian Plateau (Tukey HSD, p = 0.02; Figure 4B). Mean trend rates (Sen’s slopes) were greater for juvenile fish than adult fish across sites (t = 2.0, p = 0.05), as were maximum rates of increase over time. However, the maximum loss rate for adult fish exceeded that of juvenile fish (Figure 4).
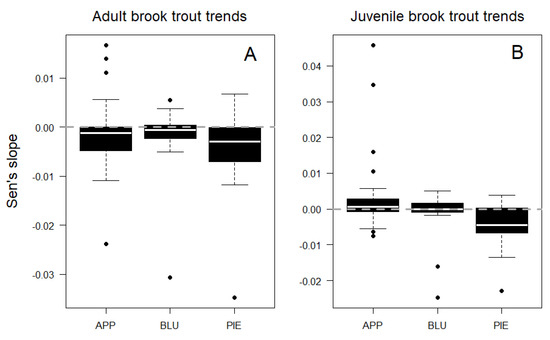
Figure 4.
Temporal trends in adult (A) and juvenile (B) brook trout density by physiographic region: Appalachian Plateau (APP), Blue Ridge (BLU), and Piedmont (PIE). Median values are shown as white lines.
The presence of non-native brown trout varied by region and life stage (Table 1): adults were observed in 37 sites (53%), and juveniles were observed in 28 sites (40%). In contrast, brown trout adults and juveniles were observed in each physiographic region (Table 1). The presence of non-native brown trout was not associated with brook trout declines. Mean juvenile brook trout trends (Sen’s slopes) did not differ in the presence or absence of adult brown trout (t = −1.0, p = 0.33) or juvenile brown trout (t = 0.09, p = 0.93). Likewise, mean adult brook trout trends were not significantly different in the presence or absence of adult brown trout (t = 1.0, p = 0.34) or juvenile brown trout (t = 1.0, p = 0.34).
Environmental covariates within study sites included a range of geophysical and anthropogenic attributes that varied by physiographic region (Table 1). Elevations ranged from 162 to 819 m above sea level (mean = 553 m) and increased from east to west across physiographic regions. Upstream basin areas ranged from 2 to 127 km2 (mean = 18 km2), with greater mean basin areas in Appalachian Plateau sites than other regions (ANOVA F = 5.9, p < 0.01; Tukey HSD p < 0.1, respectively). Mean depth to bedrock and baseflow index values increased from western to eastern regions (ANOVA p < 0.001; Tukey HSD p < 0.001, respectively).
Analysis of watershed-level NLCD data revealed some changes in land use between 2001 and 2019 (Table 1). Averaged across all sites, forest cover decreased by 0.16%, agricultural cover decreased by 0.04%, and urban land cover increased by 0.42%. Changes in forest cover and urban land use did not vary by physiographic region (ANOVA p > 0.4, respectively), but Blue Ridge sites exhibited more agricultural development than sites in other regions (ANOVA F = 4.8, p = 0.01; Tukey HSD p = 0.02, respectively). Headwater ponds within the analysis zone (1 km upstream from sites and 100 m buffer distance to streams) occurred across the study area, but their abundance varied among physiographic regions (ANOVA F = 12.9, p < 0.001) such that ponds were more common in the Piedmont than in the Blue Ridge or Appalachian Plateau (Tukey HSD p < 0.001, respectively).
Analysis of Daymet air temperature data revealed a warming trend during the study period (1988–2023): mean annual air temperatures increased by an average of 0.021 °C/year across all sites. Although all physiographic regions exhibited warming trends (i.e., all Sen’s slopes > 0), warming rates differed among regions (ANOVA F = 103, p < 0.001) such that mean increases were greater in Appalachian Plateau and Piedmont sites than Blue Ridge sites (Tukey HSD p < 0.001, respectively). Mean warming rates in Appalachian Plateau and Piedmont sites were approximately twice those of Blue Ridge sites (Table 1).
Atmospheric warming trends did not correspond closely with elevation but were positively associated with increases in forest cover over time (p = 0.02) as well as the number of headwater ponds within the analysis zone (1 km upstream from sites and 100 m from the stream, p < 0.01; Table 2). Elevation was positively correlated with basin size (i.e., larger watersheds were in western regions) and negatively correlated with the baseflow index, mean depth to bedrock, and headwater ponds (Table 2). As expected, increases in agricultural cover over time were associated with decreases in forest cover. Likewise, increases in urban cover over time were associated with decreases in agricultural cover. However, temporal changes in forest cover were not related to changes in urban land use (Table 2), suggesting that urbanization during the analysis period (2001–2019) was primarily a result of conversion from agriculture rather than forest (Table 2).
4. Discussion
Our analysis revealed decreasing densities of adult brook trout in multiple physiographic regions and indicated the primacy of air temperature over land use change or non-native trout to explain the observed declines. Although adult fish densities were stable over time in more sites than were declining (46 vs. 19, respectively), increases in air temperature were more strongly associated with fish population declines than changes in land use or other environmental variables. Our results, therefore, indicate that strategies for native trout conservation should consider atmospheric warming trends in addition to land use and stocking practices.
Our estimates of trout density were within the range reported from other Appalachian streams. For example, Wagner et al. [5] estimated a mean adult brook trout density of 0.057 fish/m2 in their study of 291 stream sites in Pennsylvania, whereas our estimate was 0.070 fish/m2. Likewise, our estimates of adult and juvenile brook trout density were also within the range reported by Utz and Hartman [50] in Appalachian Plateau streams and by Hitt et al. [51] in Blue Ridge stream pools.
We observed stronger temporal trends for adult fish than juvenile fish: 24 sites showed significant (p < 0.1) temporal change for adult age classes, whereas 14 sites were significant at this statistical threshold for juvenile fish. This result is consistent with prior work demonstrating greater interannual variation in the abundance of juvenile brook trout than adults [52], with an associated decrease in statistical power to detect trends in juvenile brook trout recruitment and abundance [53]. For example, Childress et al. [3] observed similar environmental associations for adult and juvenile brook trout trends in the Blue Ridge region, but juvenile fish models exhibited larger confidence intervals (i.e., more likely to encompass zero).
Our estimates of air temperature change are consistent with prior research. Since 1984, the estimated rate of atmospheric warming is 0.02 °C/year [54], the same mean rate we observed within our study area over a similar time period (1988–2023). However, our estimated warming rate was less than the mean rate across North America of 0.034 °C/year [54], and our sites in the Blue Ridge region showed the greatest departure from continental trends with an estimated mean warming rate of 0.013 °C/year (Table 1). Rice and Jastram [21] reported a mean rate of monthly average air temperature warming of 0.023 °C/year in the Chesapeake Bay region, similar to our observations.
The general consistency of our results with regional and continental trends may be because the DAYMET dataset draws from the same set of sites as used in the continental and global analysis (Global Historical Climatology Network daily [55]) but nonetheless is noteworthy given the smaller geographic extent of our study area. River and stream temperatures in the region have also been warming over recent decades [19,20,21], but we did not evaluate water temperature change in this study due to data availability limitations. We recognize that air–water relationships are moderated by localized groundwater dynamics and other factors [23,56,57]). For instance, carbonate bedrock formations in karst terrain may provide thermal resiliency for fish communities due to large groundwater inputs [58,59], but such buffering effects will depend on aquifer depth and volume [11,56] as well as localized groundwater flow paths (i.e., conduit or fracture flow) that regulate heat-exchange processes in stream water [57]. Ongoing efforts to repatriate brook trout to streams in karst terrain (B. Keplinger, District Fisheries Biologist, West Virginia Department of Natural Resources, personal communication, 15 July 2023) could provide new brook trout populations in thermally resilient sites with long-term benefits for native trout conservation.
Our analysis also revealed increasing juvenile brook trout trends at higher elevations, and, in contrast to adult trout, we found no significant effect of air temperature on juvenile trout trends. We also observed an unexpected effect of BFI on juvenile trout, such that low BFI scores were associated with increasing juvenile trout trends. BFI provides an index of groundwater potential in streams, and such groundwater inputs could facilitate larval and juvenile fish survival by stabilizing discharge and minimizing scouring flows [52] or moderating stream temperatures [23,60]. Nonetheless, our results demonstrated the opposite effect, which may indicate other mechanisms or effects of other unmeasured environmental covariates associated with BFI. In either case, our results suggest that recruitment limitation is not a primary cause of adult trout trends and that increasing juvenile fish was not a result of diminished predation risk due to decreasing adult trout densities over time.
We found that headwater ponds were associated with decreasing brook trout densities (Table 2), but this was secondary to the overriding effect of air temperature. Headwater ponds are associated with increases in stream temperature [46,61] due to solar incidence and discharge of epilimnetic water. Moreover, preliminary investigations by MD-DNR suggest the potential for simple stand-pipe modifications to moderate downstream warming by pulling water from greater depths. Additional research is needed to evaluate the distance of downstream cooling from pond discharge modification as well as the potential to apply the approach for trout habitat restoration across the Appalachian region. Although fish movements into localized thermal refugia may be important, regional emigration is not possible in this study area because these populations occupy the highest elevations available with sufficient stream flow, and downstream conditions are warm water mainstem habitats that exceed thermal thresholds for brook trout. Future research could investigate the availability of localized groundwater processes as possible explanations where populations were observed to be stable over time.
There are several important considerations for the interpretation of our results. First, our sample sites exhibited relatively minor changes in land use during the study period. For instance, estimated changes in land use generally constituted < 1% of the watershed area, whereas Stranko et al. [2] reported effects of impervious surface at 4% of the watershed area. This may be in part because 30 of our sites (42%) were MBSS sentinel sites, and these locations were chosen to represent relatively intact ecosystem conditions rather than areas of rapid land use change [36]. In addition, our estimates of land use change were organized at the watershed level rather than the riparian zone, and we aggregated multiple land use categories into generalized categories for analysis (forest, agriculture, urban). Prior research has demonstrated the distance-specific effects of land use on stream fish communities [62,63], and this may be a productive area for future research.
Second, most of the variation in adult brook trout trends was unexplained by air temperature trends or other environmental covariates. This suggests that unmeasured covariates may be more important to explain trout population trends. For example, angler pressure is expected to vary across the study area, and this was not included in our models. Although handling may affect brook trout survival during high temperatures [64], harvest probably accounts for a very small proportion of annual adult brook trout mortality, and brook trout harvest is currently prohibited in the Blue Ridge and Piedmont regions in Maryland. We also note that the effects of air temperature were not spatially homogenous across the study area, and site-level water temperature data are needed to explore this effect directly.
Third, we did not account for detection probability in our estimates of abundance and fish density. Prior research has estimated higher detection probabilities for adult brook trout than juvenile brook trout (0.69 vs. 0.56 [3]; 0.70 vs. 0.57 [7]) using standard electrofishing techniques in streams. Our study sites used multiple electrofishing methods (e.g., number of sampling passes and number of electrofishing backpacks used), and these differences may have introduced noise into our analysis of temporal trends. However, consistent methods were deployed through time in each site, and our preliminary analysis revealed no significant differences in temporal trends estimated with and without accounting for imperfect detection. We, therefore, chose to ignore this source of uncertainty to facilitate replication of our analysis by others. However, our results may represent conservative estimates of temporal change because we did not account for possible among-year differences in detection probability [7] that would be expected to increase observed variation in fish density and decrease statistical power for temporal trend detection [53].
Our results have implications for native trout conservation and restoration planning. Restoration of forest cover around streams is a major conservation practice for native brook trout [65], and losses of brook trout have been observed in response to the loss of forest and increase in urbanized land cover [2], but we did not observe significant effects of land use change on brook trout trends. However, our estimates of land use change focused on watershed-level conditions and did not evaluate riparian-level changes. Moreover, 43% of our sample sites consisted of the MBSS sentinel site network, which was located to enable long-term biological monitoring in the absence of rapid land use change [36]. Although our study cannot evaluate riparian-specific effects of land use change, our results suggest the primacy of atmospheric controls on brook trout population trends at the landscape scale. Our results also underscore the importance of identifying and conserving thermal refugia for cold water fish population persistence.
Author Contributions
Conceptualization, N.P.H., K.M.R. and Z.A.K.; methodology, N.P.H. and K.M.R.; analysis, N.P.H.; investigation, N.P.H., K.M.R. and Z.A.K.; data curation, K.M.R. and Z.A.K.; writing—original draft preparation, N.P.H.; writing—review and editing, N.P.H. and K.M.R.; visualization, K.M.R.; supervision, N.P.H.; project administration, N.P.H.; funding acquisition, N.P.H. All authors have read and agreed to the published version of the manuscript.
Funding
Funding was provided by the U.S. Geological Survey Chesapeake Bay studies program and the U.S. Geological Survey Eastern Ecological Science Center.
Institutional Review Board Statement
Animal use and care protocols were approved by the Maryland Department of Natural Resources.
Informed Consent Statement
Not applicable.
Data Availability Statement
Data are available by request to the Maryland Department and Natural Resources.
Acknowledgments
We thank M. Lawrence, J. Cessna, D. Goetz, A. Eshleman, M. Kashiwagi, E. Childress, A. Kiser, B. Letcher, F. Vanderbilt, T. O’Connell, and K. Hyer for assistance with this study. Any use of trade, firm, or product names is for descriptive purposes only and does not imply endorsement by the U.S. Government.
Conflicts of Interest
The authors declare no conflicts of interest. The funders had no role in the design of the study; in the collection, analyses, or interpretation of data; in the writing of the manuscript; or in the decision to publish the results.
Appendix A

Table A1.
Spatial coordinates and temporal trends in fish density (fish/m2) per year as Sen’s slope values. Coordinates are in decimal degrees.
Table A1.
Spatial coordinates and temporal trends in fish density (fish/m2) per year as Sen’s slope values. Coordinates are in decimal degrees.
| Site Code | Latitude | Longitude | Adult Brook Trout Trend | Juvenile Brook Trout Trend |
|---|---|---|---|---|
| ANTI-101-S | 39.65833 | −77.5452 | −0.0023 | −0.0009 |
| ANTM6191 | 39.66278 | −77.5322 | −0.0050 | 0.0010 |
| CSLM0001 | 39.64850 | −79.1386 | 0.0167 | 0.0347 |
| CSLM0002 | 39.63892 | −79.1651 | 0.0140 | 0.0458 |
| CSLM0004 | 39.69296 | −79.1869 | −0.0084 | 0.0007 |
| CSLM0005 | 39.60816 | −79.1945 | −0.0045 | 0.0058 |
| DOBL0025 | 39.65434 | −76.9076 | −0.0053 | −0.0045 |
| LBRR5468 | 39.40120 | −76.9194 | −0.0086 | −0.0048 |
| LGNF6439 | 39.52438 | −76.5368 | 0.0012 | −0.0083 |
| LIBE-102-S | 39.44055 | −76.8641 | 0.0000 | 0.0000 |
| LOCH-120-S | 39.47878 | −76.6818 | −0.0002 | 0.0002 |
| LRRR0008 | 39.47943 | −76.6781 | −0.0029 | 0.0039 |
| LRRR2892 | 39.59946 | −76.7063 | −0.0054 | −0.0093 |
| LRRR6263 | 39.57730 | −76.6777 | −0.0113 | −0.0051 |
| PBRR0003 | 39.69090 | −76.7679 | −0.0347 | −0.0135 |
| PBRR0013 | 39.67948 | −76.7715 | −0.0118 | −0.0229 |
| PBRR0018 | 39.67653 | −76.7708 | 0.0001 | 0.0026 |
| PBRR0048 | 39.70136 | −76.8058 | 0.0068 | −0.0050 |
| PBRR1933 | 39.64534 | −76.7198 | −0.0053 | −0.0004 |
| PBRR3834 | 39.69151 | −76.7777 | −0.0018 | 0.0018 |
| PRLN-626-S | 39.54581 | −78.9055 | −0.0040 | −0.0020 |
| SAVA-204-S | 39.50378 | −79.1556 | −0.0012 | 0.0001 |
| SAVA-225-S | 39.59930 | −79.0668 | −0.0007 | 0.0000 |
| SAVA-276-S | 39.54123 | −79.2134 | −0.0037 | −0.0055 |
| SAVG0002 | 39.48595 | −79.0834 | −0.0007 | −0.0006 |
| SAVG0010 | 39.61981 | −79.1437 | −0.0010 | 0.0040 |
| SAVG0011 | 39.60364 | −79.1206 | −0.0012 | −0.0012 |
| SAVG0012 | 39.59179 | −79.1041 | −0.0109 | −0.0054 |
| SAVG0020 | 39.56443 | −79.1982 | −0.0048 | 0.0024 |
| SAVG0021 | 39.55553 | −79.1549 | 0.0015 | −0.0076 |
| SAVG0022 | 39.55001 | −79.1470 | 0.0023 | 0.0024 |
| SAVG0030 | 39.47330 | −79.1953 | −0.0050 | 0.0015 |
| SAVG0031 | 39.49378 | −79.1685 | −0.0029 | −0.0007 |
| SAVG0040 | 39.58355 | −79.1712 | 0.0020 | 0.0029 |
| SAVG0041 | 39.55862 | −79.1525 | 0.0014 | 0.0027 |
| SAVG0042 | 39.54492 | −79.1414 | −0.0033 | 0.0007 |
| SAVG0050 | 39.53464 | −79.1873 | −0.0087 | 0.0007 |
| SAVG0051 | 39.51245 | −79.1616 | −0.0065 | 0.0006 |
| SAVG0052 | 39.51356 | −79.1562 | 0.0001 | 0.0008 |
| SAVG0060 | 39.63718 | −79.0589 | −0.0003 | 0.0029 |
| SAVG0061 | 39.62556 | −79.0627 | −0.0033 | 0.0033 |
| SAVG0062 | 39.60268 | −79.0712 | 0.0001 | 0.0040 |
| SAVG0070 | 39.61250 | −79.0281 | −0.0072 | −0.0016 |
| SAVG0071 | 39.60046 | −79.0385 | −0.0075 | 0.0017 |
| SAVG0072 | 39.59710 | −79.0541 | −0.0066 | −0.0018 |
| SAVG0080 | 39.59596 | −79.0652 | −0.0002 | −0.0009 |
| SAVG0081 | 39.58618 | −79.0849 | −0.0019 | −0.0003 |
| SAVG0082 | 39.56458 | −79.1084 | −0.0009 | 0.0000 |
| SAVG0084 | 39.59995 | −79.0547 | −0.0004 | 0.0002 |
| SAVG5004 | 39.58635 | −79.0955 | −0.0238 | −0.0064 |
| UMNC0001 | 39.58006 | −77.4320 | −0.0002 | 0.0005 |
| UMNC0002 | 39.48999 | −77.4736 | 0.0000 | −0.0248 |
| UMNC1235 | 39.55769 | −77.4820 | −0.0306 | −0.0160 |
| UMNC1333 | 39.52934 | −77.4720 | 0.0020 | 0.0025 |
| UMNC2652 | 39.58222 | −77.4518 | −0.0009 | 0.0001 |
| UMNC2897 | 39.53516 | −77.4674 | −0.0022 | 0.0032 |
| UMNC2964 | 39.62983 | −77.4439 | 0.0021 | 0.0000 |
| UMNC3372 | 39.53806 | −77.4666 | 0.0038 | 0.0022 |
| UMNC3449 | 39.62125 | −77.4375 | 0.0000 | 0.0000 |
| UMNC5720 | 39.66916 | −77.4790 | 0.0004 | 0.0006 |
| UMNC5722 | 39.66115 | −77.4813 | 0.0000 | 0.0017 |
| UMNC6096 | 39.48436 | −77.4658 | −0.0006 | −0.0001 |
| UMNC6577 | 39.58553 | −77.4363 | −0.0006 | 0.0000 |
| UMNC6836 | 39.53912 | −77.4761 | 0.0055 | 0.0051 |
| UMNC6857 | 39.63344 | −77.4765 | −0.0012 | 0.0000 |
| UMON-119-S | 39.58739 | −77.4893 | −0.0031 | −0.0009 |
| UMON-288-S | 39.60939 | −77.4349 | −0.0041 | −0.0018 |
| YOGH0009 | 39.53182 | −79.4029 | 0.0111 | 0.0105 |
| YOGH0010 | 39.53203 | −79.4040 | 0.0057 | 0.0159 |
| YOUG-432-S | 39.64264 | −79.2798 | 0.0006 | −0.0003 |
References
- Hudy, M.; Thieling, T.M.; Gillespie, N.; Smith, E.P. Distribution, status, and land use characteristics of subwatersheds within the native range of brook trout in the eastern United States. N. Am. J. Fish. Manag. 2008, 28, 1069–1085. [Google Scholar] [CrossRef]
- Stranko, S.A.; Hilderbrand, R.H.; Morgan, R.P.; Staley, M.W.; Becker, A.J.; Roseberry-Lincoln, A.; Perry, E.S.; Jacobson, P.T. Brook trout declines with land cover and temperature changes in Maryland. N. Am. J. Fish. Manag. 2008, 28, 1223–1232. [Google Scholar] [CrossRef]
- Childress, E.S.; Demarest, D.E.; Wofford, J.E.B.; Hitt, N.P.; Letcher, B.H. Strong variation in brook trout trends across geology, elevation, and stream size in Shenandoah National Park. Trans. Am. Fish. Soc. 2024, 153, 250–263. [Google Scholar] [CrossRef]
- McKenna, J.E.; Johnson, J.H. Landscape models of brook trout abundance and distribution in lotic habitat with field validation. N. Am. J. Fish. Manag. 2011, 31, 742–756. [Google Scholar] [CrossRef]
- Wagner, T.; DeWeber, J.T.; Detar, J.; Kristine, D.; Sweka, J.A. Spatial and temporal dynamics in brook trout density: Implications for population monitoring. N. Am. J. Fish. Manag. 2014, 34, 258–269. [Google Scholar] [CrossRef]
- DeWeber, J.T.; Wagner, T. Predicting brook trout occurrence in stream reaches throughout their native range in the eastern United States. Trans. Am. Fish. Soc. 2015, 144, 11–24. [Google Scholar] [CrossRef]
- Kanno, Y.; Letcher, B.H.; Rosner, A.L.; O’Neil, K.P.; Nislow, K.H. Environmental factors affecting brook trout occurrence in headwater stream segments. Trans. Am. Fish. Soc. 2015, 144, 373–382. [Google Scholar] [CrossRef]
- Jin, C.; Zha, T.; Guo, X.; Li, X.; Liu, X.; Jiang, Y.; Guo, Z.; Bourque, C.P. Forest-cover-loss control on year-round river flow dynamics in the upper Saint John River (Wolastoq) basin, Northeastern North America from 2001 to 2019. J. Hydrol. 2023, 623, 129776. [Google Scholar] [CrossRef]
- Swank, W.T.; Vose, J.M.; Elliott, K.J. Long-term hydrologic and water quality responses following commercial clearcutting of mixed hardwoods on a southern Appalachian catchment. For. Ecol. Manag. 2001, 143, 163–178. [Google Scholar] [CrossRef]
- Studinski, J.M.; Hartman, K.J.; Niles, J.M.; Keyser, P. The effects of riparian forest disturbance on stream temperature, sedimentation, and morphology. Hydrobiologia 2012, 686, 107–117. [Google Scholar] [CrossRef]
- Meisner, J.D. Effect of climatic warming on the southern margins of the native range of brook trout, Salvelinus fontinalis. Can. J. Fish. Aquat. Sci. 1990, 47, 1065–1070. [Google Scholar] [CrossRef]
- Bassar, R.D.; Letcher, B.H.; Nislow, K.H.; Whiteley, A.R. Changes in seasonal climate outpace compensatory density-dependence in eastern brook trout. Glob. Chang. Biol. 2016, 22, 577–593. [Google Scholar] [CrossRef] [PubMed]
- Xu, C.; Letcher, B.L.; Nislow, K.H. Context-specific influence of water temperature on brook trout growth rates in the field. Freshw. Biol. 2010, 55, 2253–2264. [Google Scholar] [CrossRef]
- Al-Chokhachy, R.; Letcher, B.H.; Muhlfeld, C.C.; Dunham, J.; Cline, T.; Hitt, N.P.; Roberts, J.J.; Schmetterling, D. Stream size, temperature and density explain body sizes of freshwater salmonids across a range of climate conditions. Can. J. Fish. Aquat. Sci. 2022, 79, 1729–1744. [Google Scholar] [CrossRef]
- Ries, R.D.; Perry, S.A. Potential effects of global climate warming on brook trout growth and prey consumption in central Appalachian streams, USA. Clim. Res. 1995, 5, 197–206. [Google Scholar] [CrossRef]
- Chadwick, J.G., Jr.; Nislow, K.H.; McCormick, S.D. Thermal onset of cellular and endocrine stress responses correspond to ecological limits in brook trout, an iconic cold-water fish. Conserv. Physio. 2015, 3, cov017. [Google Scholar] [CrossRef]
- Hitt, N.P.; Snook, E.; Massie, D. Brook trout use of thermal refugia and foraging habitat influenced by brown trout. Can. J. Fish. Aquat. Sci. 2017, 74, 406–418. [Google Scholar] [CrossRef]
- McCormick, J.H.; Hokanson, E.F.; Jones, B.R. Effects of temperature on growth and survival of young brook trout, Salvelinus fontinalis. J. Fish. Res. Board Can. 1972, 29, 1107–1112. [Google Scholar] [CrossRef]
- Kaushal, S.S.; Likens, G.E.; Jaworski, N.A.; Pace, M.L.; Sides, A.M.; Seekell, D.; Belt, K.T.; Secor, D.H.; Wingate, R.L. Rising stream and river temperatures in the United States. Front. Ecol. Environ. 2010, 8, 461–466. [Google Scholar] [CrossRef]
- Ding, H.; Elmore, A.J. Spatio-temporal patterns in water surface temperature from Landsat time series data in the Chesapeake Bay, U.S.A. Remote Sens. Environ. 2015, 168, 335–348. [Google Scholar] [CrossRef]
- Rice, K.C.; Jastram, J.D. Rising air and stream-water temperatures in Chesapeake Bay region, USA. Clim. Chang. 2015, 128, 127–138. [Google Scholar] [CrossRef]
- Hilderbrand, R.H.; Kashiwagi, M.T.; Prochaska, A.P. Regional and local scale modeling of stream temperatures and spatio-temporal variation in thermal sensitivities. Environ. Manag. 2014, 54, 14–22. [Google Scholar] [CrossRef] [PubMed]
- Snyder, C.D.; Hitt, N.P.; Young, J.A. Accounting for the influence of groundwater on thermal sensitivity of headwater streams to climate change. Ecol. Appl. 2015, 25, 1397–1419. [Google Scholar] [CrossRef] [PubMed]
- O’Sullivan, A.M.; Corey, E.; Cunjak, R.A.; Linnansaari, T.; Curry, R.A. Salmonid thermal habitat contraction in a hydrogeologically complex setting. Ecosphere 2021, 12, e03797. [Google Scholar] [CrossRef]
- Fausch, K.D.; White, R.J. Competition between brook trout (Salvelinus fontinalis) and brown trout (Salmo trutta) for positions in a Michigan stream. Can. J. Fish. Aquat. Sci. 1981, 38, 1220–1227. [Google Scholar] [CrossRef]
- Wagner, T.; DeWeber, J.T.; Detar, J.; Sweka, J.A. Landscape-scale evaluation of asymmetric interactions between brown trout and brook trout using two-species occupancy models. Trans. Am. Fish. Soc. 2013, 142, 353–361. [Google Scholar] [CrossRef]
- Waters, T.F. Replacement of brook trout by brown trout over 15 years in a Minnesota stream: Production and abundance. Trans. Am. Fish. Soc. 1983, 112, 137–146. [Google Scholar] [CrossRef]
- Hoxmeier, R.J.H.; Dieterman, D.J. Seasonal movement, growth and survival of brook trout in sympatry with brown trout in Midwestern US streams. Ecol. Freshw. Fish 2013, 22, 530–542. [Google Scholar] [CrossRef]
- McKenna, J.E.; Slattery, M.T.; Clifford, K.M. Broad-scale patterns of brook trout responses to introduced brown trout in New York. N. Am. J. Fish. Manag. 2013, 33, 1221–1235. [Google Scholar] [CrossRef]
- Kirk, M.A.; Rosswog, A.N.; Ressel, K.N.; Wissinger, S.A. Evaluating the trade-offs between invasion and isolation for native brook trout and nonnative brown trout in Pennsylvania streams. Trans. Am. Fish. Soc. 2018, 147, 806–817. [Google Scholar] [CrossRef]
- Hoxmeier, R.J.H.; Dieterman, D.J. Long-term population demographics of native brook trout following manipulative reduction of an invader. Biol. Invas. 2016, 18, 2911–2922. [Google Scholar] [CrossRef]
- Olson, K.W.; Pechacek, K.; Benike, H. Brook Trout population response to Brown Trout removal by electrofishing in a Wisconsin Driftless Area stream. N. Am. J. Fish. Manag. 2024, 44, 735–744. [Google Scholar] [CrossRef]
- Odenkirk, J.S.; Isel, M.W. Trends in biomass and relative weight of brook trout in response to introduction of non-native brown trout in an Appalachian mountain stream. J. Southeast. Assoc. Fish Wild. Agencies 2022, 9, 67–72. [Google Scholar]
- Murdoch, A.; Mantyka-Pringle, C.; Sharma, S. The interactive effects of climate change and land use on boreal stream fish communities. Sci. Total Environ. 2020, 700, 134518. [Google Scholar] [CrossRef] [PubMed]
- Carosi, A.; Lorenzoni, F.; Lorenzoni, M. Synergistic effects of climate change and alien fish invasions in freshwater ecosystems: A review. Fishes 2023, 8, 486. [Google Scholar] [CrossRef]
- Genovese, M.; Cessna, J.; Kilian, J.; Stranko, S. Spatial and Temporal Trends in Biological, Physical, and Chemical Data (1995–2020) Collected at 30 Stream Sites within the Maryland Sentinel Site Network; Maryland Department of Natural Resources: Annapolis, MD, USA, 2023; DNR-12-042823-354.
- Agarwal, S.; Suchithra, A.; Singh, S.P. Analysis and interpretation of rainfall trend using Mann-Kendall’s and Sen’s slope method. Indian J. Ecol. 2021, 48, 453–457. [Google Scholar]
- Frimpong, B.F.; Koranteng, A.; Molkenthin, F. Analysis of temperature variability utilising Mann–Kendall and Sen’s slope estimator tests in the Accra and Kumasi Metropolises in Ghana. Environ. Syst. Res. 2022, 11, 24. [Google Scholar] [CrossRef]
- Mann, H.B. Non-parametric tests against trend. Econometrica 1945, 13, 163–171. [Google Scholar] [CrossRef]
- Kendall, M.G. Rank Correlation Methods, 4th ed.; Charles Griffin Publishers: London, UK, 1975. [Google Scholar]
- Sen, P.K. Estimates of the regression coefficient based on Kendall’s tau. J. Am. Stat. Assoc. 1968, 63, 1379–1389. [Google Scholar] [CrossRef]
- Pickers, P.A.; Manning, A.C. Investigating bias in the application of curve fitting programs to atmospheric time series. Atmos. Meas. Tech. 2015, 8, 1469–1489. [Google Scholar] [CrossRef]
- Pohlert, T. Trend: Non-Parametric Trend Tests and Change-Point Detection. R Package Version 1.1.6. 2023. Available online: https://CRAN.R-project.org/package=trend (accessed on 1 December 2023).
- Hitt, N.P.; Floyd, M.; Compton, M.; McDonald, K. Threshold responses of blackside dace (Chrosomus cumberlandensis) and Kentucky arrow darter (Etheostoma spilotum) to stream conductivity. Southeast. Nat. 2016, 15, 41–60. [Google Scholar] [CrossRef]
- Hill, R.A.; Weber, M.H.; Leibowitz, S.G.; Olsen, A.R.; Thornbrugh, D.J. The Stream-Catchment (StreamCat) Dataset: A database of watershed metrics for the conterminous United States. J. Am. Water Res. Assoc. 2016, 52, 120–128. [Google Scholar] [CrossRef]
- Hitt, N.P.; Kessler, K.; Rogers, K.M.; Macmillan, H.; Walsh, H. Assessing Native Fish Restoration Potential in Catoctin Mountain Park; U.S. Geological Survey Open-File Report 2020-1137; U.S. Geological Survey: Reston, VA, USA, 2020.
- Thornton, P.E.; Shrestha, R.; Thornton, M.; Kao, S.C.; Wei, Y.; Wilson, B.E. Gridded daily weather data for North America with comprehensive uncertainty quantification. Sci. Data 2021, 8, 190. [Google Scholar] [CrossRef] [PubMed]
- Hufkens, K.; Basler, D.; Milliman, T.; Melaas, E.K.; Richardson, A.D. An integrated phenology modeling framework in R. Methods Ecol. Evol. 2018, 9, 1276–1285. [Google Scholar] [CrossRef]
- R Core Team. R: A Language and Environment for Statistical Computing; R Foundation for Statistical Computing: Vienna, Austria, 2023; Available online: https://www.R-project.org (accessed on 15 January 2023).
- Utz, R.; Hartman, K. Density-dependent individual growth and size dynamics of central Appalachian brook trout (Salvelinus fontinalis). Can. J. Fish. Aquat. Sci. 2009, 66, 1072–1080. [Google Scholar] [CrossRef]
- Hitt, N.P.; Rogers, K.M.; Kessler, K.G.; Briggs, M.A.; Fair, J.H.; Dolloff, C.A. Effects of episodic dewatering on brook trout spatial population structure. Freshw. Biol. 2024, 69, 1027–1041. [Google Scholar] [CrossRef]
- Kanno, Y.; Pregler, K.C.; Hitt, N.P.; Letcher, B.H.; Hocking, D.J.; Wofford, J.E.B. Seasonal temperature and precipitation regulate brook trout young-of-the-year abundance and population dynamics. Freshw. Biol. 2016, 61, 88–99. [Google Scholar] [CrossRef]
- Pregler, K.C.; Hanks, R.D.; Childress, E.S.; Hitt, N.P.; Hocking, D.J.; Letcher, B.H.; Wagner, T.; Kanno, Y. State-space analysis of power to detect regional brook trout population trends over time. Can. J. Fish. Aquat. Sci. 2019, 76, 2145–2155. [Google Scholar] [CrossRef]
- Leung, L.R.; Terando, A.; Joseph, R.; Tselioudis, G.; Bruhwiler, L.M.; Cook, B.; Deser, C.; Hall, A.; Hamlington, B.D.; Hoell, A.; et al. Earth systems processes. In Fifth National Climate Assessment; Crimmins, A.R., Avery, C.W., Easterling, D.R., Kunkel, K.E., Stewart, B.C., Maycock, T.K., Eds.; U.S. Global Change Research Program: Washington, DC, USA, 2023. [Google Scholar]
- Menne, M.J.; Durre, I.; Vose, R.S.; Gleason, B.E.; Houston, T.G. An overview of the Global Historical Climatology Network-Daily Database. J. Atmos. Ocean. Technol. 2012, 29, 897–910. [Google Scholar] [CrossRef]
- Hare, D.K.; Helton, A.M.; Johnson, Z.C.; Lane, J.W.; Briggs, M.A. Continental-scale analysis of shallow and deep groundwater contributions to streams. Nat. Commun. 2021, 12, 1450. [Google Scholar] [CrossRef]
- Johnson, Z.C.; Briggs, M.A.; Snyder, C.D.; Johnson, B.G.; Hitt, N.P. Taking heat (downstream): Simulating groundwater and thermal equilibrium controls on annual paired air-water temperature signal transport in headwater streams. J. Hydrol. 2024, 638, 131391. [Google Scholar] [CrossRef]
- Hitt, N.P.; Rogers, K.M.; Kessler, K.G.; Briggs, M.A.; Fair, J.H. Stabilising effects of karstic groundwater on stream fish communities. Ecol. Freshw. Fish 2023, 32, 538–551. [Google Scholar] [CrossRef]
- Kessler, K.; Rogers, K.M.; Marsh, C.; Hitt, N.P. Karst terrain promotes thermal resiliency in headwater streams. Proc. West Va. Acad. Sci. 2023, 95, 1–8. [Google Scholar] [CrossRef]
- Briggs, M.A.; Goodling, P.; Johnson, Z.C.; Rogers, K.M.; Hitt, N.P.; Fair, J.B.; Snyder, C.D. Bedrock depth influences spatial patterns of summer baseflow, temperature, and flow disconnection for mountainous headwater streams. Hydrol. Earth Syst. Sci. 2022, 26, 3989–4011. [Google Scholar] [CrossRef]
- Hoess, R.; Generali, K.A.; Kuhn, J.; Geist, J. Impact of fish ponds on stream hydrology and temperature regime in the context of freshwater pearl mussel conservation. Water 2022, 14, 2490. [Google Scholar] [CrossRef]
- King, R.S.; Baker, M.E.; Whigham, D.F.; Weller, D.E.; Jordan, T.E.; Kazyak, P.F.; Hurd, M.K. Spatial considerations for linking watershed land cover to ecological indicators in streams. Ecol. Appl. 2005, 15, 137–153. [Google Scholar] [CrossRef]
- Peterson, E.E.; Sheldon, F.; Darnell, R.; Bunn, S.E.; Harch, B.D. A comparison of spatially explicit landscape representation methods and their relationship to stream condition. Freshw. Biol. 2011, 56, 590–610. [Google Scholar] [CrossRef]
- Strange, R.J.; Schreck, C.B.; Golden, J.T. Corticoid stress responses to handling and temperature in salmonids. Trans. Am. Fish. Soc. 2011, 106, 213–218. [Google Scholar] [CrossRef]
- Batiuk, R.; Brownson, K.; Dennison, W.; Ehrhart, M.; Hanson, J.; Hanmer, R.; Landry, B.; Reichert-Nguyen, J.; Soueidan, J.; Tassone, S.; et al. Rising Watershed and Bay Water Temperatures: Ecological Implications and Management Responses—A STAC Workshop; STAC Publication Number 23-001; The Scientific and Technical Advisory Committee: Edgewater, MD, USA, 2023. [Google Scholar]
Disclaimer/Publisher’s Note: The statements, opinions and data contained in all publications are solely those of the individual author(s) and contributor(s) and not of MDPI and/or the editor(s). MDPI and/or the editor(s) disclaim responsibility for any injury to people or property resulting from any ideas, methods, instructions or products referred to in the content. |
© 2024 by the authors. Licensee MDPI, Basel, Switzerland. This article is an open access article distributed under the terms and conditions of the Creative Commons Attribution (CC BY) license (https://creativecommons.org/licenses/by/4.0/).

