Abstract
The Sporulation-Inspired Optimization Algorithm (SIOA) is an innovative metaheuristic optimization method inspired by the biological mechanisms of microbial sporulation and dispersal. SIOA operates on a dynamic population of solutions (“microorganisms”) and alternates between two main phases: sporulation, where new “spores” are generated through adaptive random perturbations combined with guided search towards the global best, and germination, in which these spores are evaluated and may replace the most similar and less effective individuals in the population. A distinctive feature of SIOA is its fully self-adaptive parameter control, where the dispersal radius and the probabilities of sporulation and germination are dynamically adjusted according to the progress of the search (e.g., convergence trends of the average fitness). The algorithm also integrates a special “zero-reset” mechanism, enhancing its ability to detect global optima located near the origin. SIOA further incorporates a stochastic local search phase to refine solutions and accelerate convergence. Experimental results demonstrate that SIOA achieves high-quality solutions with a reduced number of function evaluations, especially in complex, multimodal, or high-dimensional problems. Overall, SIOA provides a robust and flexible optimization framework, suitable for a wide range of challenging optimization tasks.
1. Introduction
Global optimization constitutes one of the most important areas of computational science, with applications spanning from engineering and physics to economics and artificial intelligence. Its primary objective is to identify the best possible solution in problems characterized by high complexity, nonlinearity, multiple local minima, and high dimensionality. In contrast to local optimization methods, which often become trapped in suboptimal solutions, global optimization techniques aim to systematically explore the entire search space in pursuit of the true global optimum.
To achieve this objective, numerous algorithms have been proposed, ranging from classical derivative-based approaches to modern metaheuristic techniques inspired by natural and biological processes. Within this context, it is essential to present a formal mathematical formulation of the global optimization problem, which provides the theoretical foundation for the development and evaluation of novel algorithmic approaches.
Mathematical formulation of the global optimization problem:
Let be a real-valued function of n variables, where is a compact subset. The global optimization problem is defined as the problem of finding
where the feasible set S is given by the Cartesian product
with the following conditions:
- , i.e., f is a continuous function on S ( denotes the space of continuous functions on S),
- are closed and bounded intervals for ,
- S is a compact and convex subset of the Euclidean space ,
- is the global minimizer of f over S.
Optimization represents a fundamental discipline in computational mathematics with widespread applications across scientific and industrial domains. Optimization techniques can be broadly categorized into several families. Classical gradient-based methods, such as steepest descent [1,2] and Newton’s method [3], remain effective for smooth and convex problems. Stochastic approaches, including Monte Carlo sampling [4] and simulated annealing [5], provide robustness against multimodality.
Among the most influential are the population-based metaheuristics, which have become standard in global optimization. Genetic Algorithms (GA) [6], Differential Evolution (DE) [7,8,9], and Particle Swarm Optimization (PSO) [10] are widely recognized benchmarks. Over the years, several important variants have been developed to improve performance and adaptability, such as self-adaptive Differential Evolution (SaDE) [11], a self-adaptive DE in which each individual carries and co-evolves its own control parameters F and CR (jDE) [12], and Comprehensive Learning Particle Swarm Optimization (CLPSO) [13]. The Covariance Matrix Adaptation Evolution Strategy (CMA-ES) [14] is also regarded as one of the most powerful evolutionary optimizers.
Derivative-free techniques, such as the Nelder–Mead simplex [15], are often applied when gradient information is unavailable. Finally, modern nature-inspired and hybrid strategies (e.g., ant colony optimization [16], artificial bee colony [17]) represent current research directions that integrate concepts from biology, physics, and social systems.
Within the diverse landscape of metaheuristic optimization algorithms, the Sporulation-Inspired Optimization Algorithm (SIOA) introduces an innovative, biologically motivated approach inspired by microbial sporulation and dispersion. SIOA operates with a dynamic population of solutions, conceptualized as “microorganisms” that undergo processes of sporulation and germination. In this framework, each solution can generate “spores” via adaptive random perturbations, guided by the current best solution, with the intensity of dispersal dynamically regulated through self-adaptive parameters. A key distinguishing feature of SIOA is its two-phase search mechanism, combining the generation of spores (sporulation phase) with a germination process that evaluates and selectively integrates new solutions into the population using a similarity-based (crowding) replacement scheme, where each new spore replaces its most similar population member only if it achieves superior fitness. The algorithm incorporates an additional “zero-reset” mechanism, occasionally forcing solution components to zero, which helps to accelerate convergence towards global optima near the origin. The search is further enhanced by a stochastic, optional local search phase, which promotes the exploitation of promising regions in the solution space. One of SIOA’s main strengths lies in its fully self-adaptive parameter control: not only the dispersal radius, but also the probabilities of sporulation and germination are automatically adjusted according to the algorithm’s search progress. This adaptive strategy enables SIOA to balance exploration and exploitation effectively, enhancing its performance in a wide range of complex optimization tasks. Multimodal and high-dimensional optimization problems are particularly challenging because they contain a vast number of local optima and exponentially growing search spaces as dimensionality increases. Such conditions often lead conventional algorithms to premature convergence, trapping the search in suboptimal regions and making it difficult to explore promising areas effectively. To address these difficulties, SIOA integrates diversity-preserving mechanisms such as similarity-based replacement and adaptive parameter control, which together sustain population heterogeneity and guide the search toward unexplored regions. These features equip SIOA with the ability to maintain a balance between exploration and exploitation even in very rugged or large-scale landscapes. Notably, in multimodal and high-dimensional problems, SIOA demonstrates a strong capability to avoid premature convergence and maintain population diversity, contributing to fast and robust convergence. Experimental results confirm that SIOA exhibits high efficiency and stability across a broad suite of benchmark functions, often outperforming established metaheuristics, especially in challenging optimization landscapes. The biological inspiration underpinning SIOA offers natural mechanisms for diversity maintenance and premature convergence avoidance, making it especially suitable for demanding applications where a balance between global exploration and focused exploitation is critical. This work thoroughly examines the theoretical underpinnings of SIOA, including its convergence properties, parameter sensitivity analysis, and practical implementation aspects. Furthermore, the potential for extensions and adaptations of the algorithm is explored, including constrained, multi-objective, and large-scale optimization scenarios. Overall, SIOA emerges as a powerful, modern, and flexible contribution to computational optimization methodology, with significant prospects for both research and real-world applications.
The remainder of this paper is structured as follows. Section 2 introduces the proposed SIOA and its biological motivation. Section 3 describes the experimental setup and presents the benchmark results. Specifically, Section 3.1 reports experiments with traditional methods on classical benchmark problems, while Section 3.2 extends the analysis to advanced methods and real-world applications. The balance between exploration and exploitation is investigated in Section 3.3, followed by a parameter sensitivity study in Section 3.4. Section 3.5 provides an analysis of the computational cost and complexity of the SIOA algorithm. Finally, Section 4 summarizes the main findings and outlines directions for future work.
Overall, this structure ensures a coherent presentation of both the methodological contributions and the experimental validation. The next section introduces the SIOA method in detail, highlighting its biological inspiration and algorithmic design principles.
2. The SIOA Method
The following is the pseudocode of SIOA and the related analysis.
To formalize the sporulation process, each spore is generated from its parent solution according to
where R denotes the adaptive dispersal radius, , are control coefficients, and ≡ acts as the attraction factor toward the global best solution . With probability , selected dimensions of the spore are reset to zero, which enhances the ability of the algorithm to detect global optima near the origin. The generated spore is subsequently bounded to the feasible domain by applying the clamp operator. This explicit formulation improves the mathematical clarity of the sporulation step and highlights the role of adaptive perturbations combined with global guidance.
The SIOA Algorithm 1 begins with an initialization phase, where an initial population of solutions (samples) of size is randomly generated within the specified bounds. For each solution, the fitness value is evaluated and stored in the fitness array, while the best solution () and its corresponding fitness () are also tracked. An empty list is initialized to collect spores that will be generated in each iteration.
| Algorithm 1 Pseudocode of SIOA. |
Input: - : Population size - : Maximum iterations - : Local search rate - : Search space bounds - , : Search coefficients (Self-adaptive within the loop, initialized with default values:) - , : Min/max dispersal radius - : Initial sporulation probability - : Initial germination probability Output: - : Best solution found - : Corresponding fitness value Initialization: 01: ← Problem dimension 02: Initialize population 03: Evaluate initial fitness 04: (, ) ← // Set adaptive parameters: 05: R ← 06: ← 07: ← 08: ← Main Optimization Loop: 09: for = 1 to do // Parameter self-adaptation 10: t ← 11: R ← 12: ← mean(F) 13: ← , 1 × 10⁻¹⁰ 14: if > then 15: ← clamp 16: ← clamp 17: else 18: ← clamp 19: ← clamp 20: end if 21: ← // Sporulation phase 22: S ← ⌀ 23: for each in X do 24: Create vector spore = [, …] 25: for d = 1 to do 26: ← + * + ( - + ) * //Equivalent mathematical form: //← + + · ( –) // with ≡ // Special “reset to zero” rule 27: if < 0.1 and () then 28: ← 0 29: end if 30: ← clamp(, , ) 31: end for 32: S ← 33: end for // Germination phase 34: for each in S do 35: if < then 36: ← 37: ← index of sample in X most similar to (Euclidean distance) 38: if < then 39: ← 40: ← 41: end if 42: if < then 43: ← 44: ← 45: end if 46: end if 47: end for // Local search (optional) 48: for each in X do 49: if < then 50: ← localSearch() [18] 51: if < then 52: ← 53: ← 54: if < f_ then 55: ← 56: ← 57: end if 58: end if 59: end if 60: end for 61: if termination criteria met then break: [19,20] or or function evaluations (FEs) 62: end for 63: return (, ) |
During the main iteration loop, the algorithm executes three core operations in every cycle:
In the first phase (sporulation), each solution in the population has a probability , which is self-adaptive) of generating a spore. The new spore is created by applying a combination of adaptive random perturbations and attraction towards the global best solution, with the strength of the perturbation determined by the current value of the adaptive dispersal radius (R). Additionally, with a certain probability, individual dimensions of the spore may be forcibly set to zero, especially when the best fitness value is near zero, enhancing the algorithm’s ability to locate optima at or near the origin. All generated spores are ensured to remain within the problem boundaries.
In the second phase (germination), each spore has a probability (, also self-adaptive) to germinate. If so, its fitness is evaluated. The algorithm then uses a crowding (similarity-based) replacement strategy: the spore is compared against the most similar solution in the population (measured by Euclidean distance), and it replaces that solution only if its fitness is superior. If the spore achieves a new best fitness, the and are updated.
The third phase is optional local search, where each solution in the population has a probability () of undergoing a specialized local search procedure. If the refined solution is better, it replaces the current one and updates the global best if necessary.
Throughout the process, all critical parameters including dispersal radius and the probabilities of sporulation and germination are dynamically self-adapted based on the search progress, specifically on improvements in the mean fitness of the population. This mechanism ensures that SIOA can automatically balance exploration and exploitation according to the evolving state of the search.
The use of similarity-based (crowding) replacement preserves population diversity and helps prevent premature convergence, while the special zero-reset rule increases the chance of discovering global optima at zero. In practice, the zero-reset mechanism is applied selectively to a fraction of the population when convergence is detected near the coordinate axes or the origin. This targeted reinitialization is particularly effective for benchmark problems with optima located at or close to the origin (e.g., Ackley and Discus), since it enhances the probability of sampling in the true optimum’s neighborhood. By introducing controlled diversity only under these conditions, zero-reset improves exploration without disrupting convergence dynamics, thereby increasing accuracy for this important class of optimization problems. The stochastic local search phase further enhances exploitation capability. Overall, the combination of these mechanisms creates a dynamic, self-adjusting system in which the algorithm continuously tunes its parameters and replacement strategies based on intermediate solution quality, thus maximizing its ability to efficiently explore complex, multimodal, and high-dimensional search spaces.
3. Experimental Setup and Benchmark Results
The experimental framework is structured as follows: First, the benchmark functions used for performance evaluation are introduced, then a thorough examination of the experimental results is provided. A systematic parameter sensitivity analysis is conducted to validate the algorithm’s robustness and optimization capabilities under different conditions. All experimental configurations are specified in Table 1.

Table 1.
Parameters and settings.
The computational experiments were conducted using a system equipped with an Debian Linux machine with 128 GB of RAM.The testing framework involved 30 independent runs for each benchmark function, ensuring robust statistical analysis by initializing with fresh random values in every iteration. The experiments utilized a custom-developed tool implemented in ANSI C++ within the OPTIMUS [21] platform, an open-source optimization library available at https://github.com/itsoulos/GLOBALOPTIMUS (accessed on 28 July 2025). The algorithm’s parameters, as detailed in Table 1, were carefully selected to balance exploration and exploitation effectively.
3.1. Experiments with Traditional Methods and Classical Benchmark Problems
The evaluation of SIOA was first conducted on established benchmark function sets [22,23,24], in direct comparison with widely used traditional optimization methods, in order to assess its computational efficiency, convergence capability, and result stability under standard testing scenarios (Table 2).

Table 2.
The benchmark functions used in the conducted experiments.
The results presented in Table 3 were obtained using the parameter settings described in Table 1. An important observation is the consistency of the best solution across 12 consecutive runs, which demonstrates a high degree of stability and robustness in the optimization process. This stability was achieved with minimal reliance on local optimization, as the local search procedure was applied in only 0.5% of the cases. Such performance indicates that the algorithm’s global search capabilities are sufficient to consistently identify optimal or near-optimal solutions without heavy dependence on local refinement methods.

Table 3.
Comparison of function calls of the SIOA method with others.
Figure 1, Figure 2 and Figure 3 provide a complementary visualization of the numerical data presented in Table 3. These figures highlight both the distribution of function evaluations and the relative execution times across methods, offering a clearer view of convergence dynamics and performance consistency. In this way, the graphical results reinforce the tabular evidence, allowing for a more intuitive comparison of SIOA against GA, DE, PSO, and ACO.
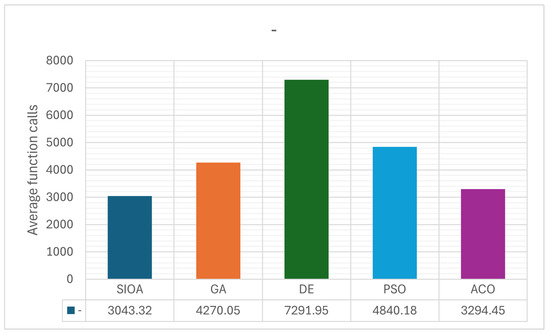
Figure 1.
Performance of SIOA and reference methods on benchmark problems: distribution of function evaluations across runs.
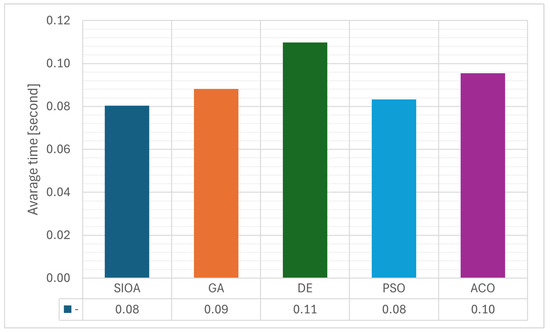
Figure 2.
Comparative analysis of SIOA versus GA, DE, PSO, and ACO: average execution times for all test functions.
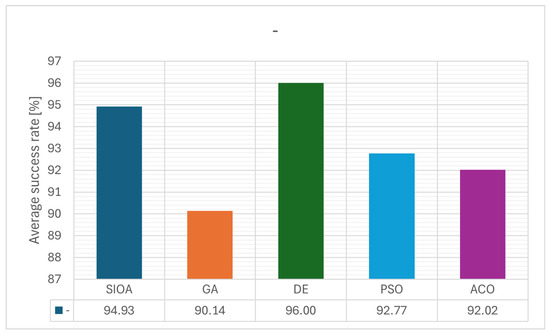
Figure 3.
Overall convergence dynamics of SIOA and competing algorithms: stability and robustness across problems.
The comparative analysis of the results of Table 3 shows that the proposed SIOA method outperforms traditional GA, DE, PSO, and ACO methods across a wide range of benchmark functions, both in terms of the number of objective function evaluations and the success rate. In the vast majority of cases, SIOA achieves the minimum or one of the lowest evaluation counts, indicating high computational efficiency and faster convergence. The differences are particularly evident in multidimensional and multimodal problems, where traditional methods such as GA and DE require significantly more evaluations, often more than double or triple those of SIOA.
The success rate, which is 100% when not shown in parentheses, also presents a positive picture for SIOA. Its overall value reaches 94.9%, surpassing the corresponding rates of GA (90.1%) and PSO (92.8%) and coming very close to the best performances of DE (96%) and ACO (92%), but with considerably lower computational cost. In several challenging cases, such as the GRIEWANK and POTENTIAL functions, SIOA combines low evaluation requirements with competitive or even maximum success rates, demonstrating an ability to maintain a balance between exploration and exploitation.
The overall picture, as reflected in the last row of the table, confirms SIOA’s general superiority, as it achieves the lowest total number of evaluations (66,953) compared to other methods, which range from about 72,478 (ACO) to 160,423 (DE). This high efficiency, combined with the stability of the results, suggests that the biologically inspired strategy of sporulation and germination, together with mechanisms for self-adaptation and diversity preservation, offers a clear advantage over classic evolutionary and swarm-based methods across a wide spectrum of optimization problems.
To enhance the numerical accuracy of the final solutions without compromising the validity of cross-method comparisons, we enabled the same lightweight, local search routine for all algorithms reported in Table 3 (SIOA, GA, DE, PSO, ACO). Concretely, at the end of each iteration, each candidate solution had an independent probability = 0.005 (0.5%) to invoke the local search procedure (see Algorithm 1, lines 48–60 and parameters summarized in Table 1). This very small activation rate yields occasional refinements near convergence while keeping the computational overhead and any potential bias negligible, importantly, no method received bespoke local search settings or a larger budget. In practice, the routine was triggered only rarely, thus improving accuracy without altering the comparative performance trends observed in Table 3.
The analysis of the results (Friedman test [28]) presented in Figure 4 shows the performance comparison of the proposed SIOA optimization method against other established techniques. The values of the critical parameter p, which indicate the levels of statistical significance, reveal that SIOA demonstrates a very extremely significant superiority over GA, DE, and PSO, with p-values lower than 0.0001. In contrast, the comparison between SIOA and ACO did not show a statistically significant difference, as the p-value is greater than 0.05, indicating that the two methods exhibit a similar level of performance according to this statistical evaluation.
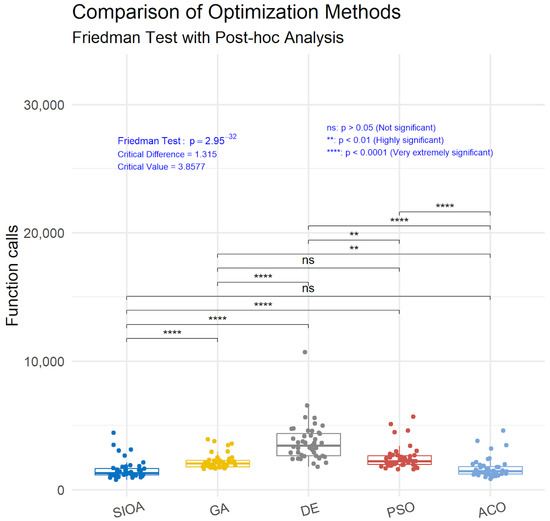
Figure 4.
Statistical comparison of SIOA against other methods.
Figure 5 visualizes, on a per-problem basis, the comparative performance of all algorithms as derived from the function-evaluation counts and success rates reported in Table 3. Across most benchmarks, SIOA attains the lowest or among the lowest number of evaluations, with particularly clear margins on multimodal or higher-dimensional families (e.g., GRIEWANK*, POTENTIAL*), while ACO is occasionally comparable, these patterns are consistent with the tabulated trends. The aggregate line of Table 3 is reflected here as well, confirming the overall evaluation load: SIOA (66,953) vs. GA (93,941), PSO (106,484), DE (160,423), and ACO (72,478), underscoring SIOA’s efficiency advantage without altering the success-rate profile.
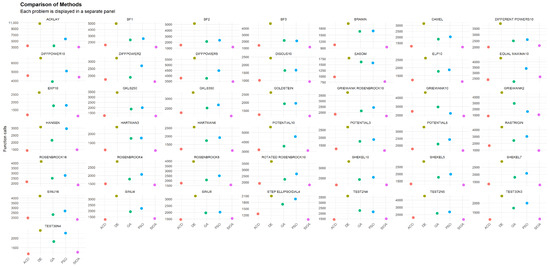
Figure 5.
Performance of all methods on each problem.
3.2. Experiments with Advanced Methods and Real-World Problems
Subsequently, SIOA was tested against more sophisticated algorithms on complex, large-scale problems derived from realistic application domains, aiming to evaluate its performance under increased complexity, constraint handling, and uncertainty. These problems are presented in Table 4.

Table 4.
Real world problems CEC2011.
The results shown in Table 5 were obtained using the parameter settings defined in Table 1. Also, a detailed ranking for the algorithms is presented in Table 6. The termination criterion was set to 150,000 function evaluations, ensuring a uniform computational budget across all test cases. No local optimization procedures were applied during the runs, meaning that the reported outcomes reflect solely the global search capabilities of the algorithm without any refinement from local search techniques. This setup allows for an unbiased assessment of the method’s performance under purely global exploration conditions.

Table 5.
Algorithm comparison based on best and mean after 1.5 × 10⁵ FEs.

Table 6.
Detailed Ranking of Algorithms Based on Best and Mean after 1.5 × 10⁵ FEs.
The comparative analysis of the optimization methods, based on both best and mean performance after 150,000 function evaluations, reveals clear distinctions in their overall effectiveness. CMA-ES achieved the highest ranking, excelling in both peak and consistent performance, followed by EO and CLPSO, which demonstrated strong competitiveness. SIOA ranked closely behind these top methods, showing notable strengths in complex, high-dimensional, and multimodal problems, where its adaptive sporulation and germination mechanisms effectively balanced exploration and exploitation. In certain cases, such as the Tersoff Potential and Static Economic Load Dispatch problems, SIOA’s results approached those of CMA-ES, highlighting its capacity to rival advanced evolutionary strategies. However, its slightly higher variance in some problem instances, particularly in less multimodal landscapes, reduced its mean performance score, preventing it from achieving the top overall rank. Despite this, SIOA emerges as a modern and competitive algorithm with strong potential for further improvement, especially through integration with specialized local search schemes aimed at enhancing stability and precision.
Also, a comparison of all algorithms and a final ranking is presented in Table 7.

Table 7.
Comparison of Algorithms and Final Ranking.
3.3. Exploration and Exploitation
In this study, the trade-off between exploration and exploitation is assessed using a specific set of quantitative indicators: Initial Population Diversity (), Final Population Diversity (), Average Exploration Ratio (), Median Exploration Ratio (), and Average Balance Index (). These metrics, although fundamentally grounded in population diversity measurements, are designed to capture both the temporal evolution of exploration by monitoring diversity changes over the course of the optimization and the degree of exploitation through the level of convergence in the final population. While these indicators provide a structured way to examine algorithmic behavior, further investigation employing more direct analysis tools, such as attraction basin mapping or tracking the clustering of solutions around local or global optima, could yield deeper insights into the search dynamics. Such approaches are considered a promising avenue for extending the current work.
The metrics reported in Table 8 quantify and track the interplay between exploration and exploitation throughout the execution of the SIOA algorithm. Their computation relies on diversity measurements at different stages of the optimization process and on how these values evolve over iterations.

Table 8.
Balance between exploration and exploitation of the SIOA method in each benchmark function after 1.5 × 10⁵ FEs.
The quantifies the diversity present at the very start of the optimization and is obtained by computing the mean Euclidean distance between all pairs of individuals in the initial population:
where is the Euclidean distance between solutions and , and denotes the population size.
The is computed using the same formulation but applied to the final set of solutions after the algorithm is completed.
The reflects the average level of exploration across all iterations and is defined as:
where is the total number of iterations, represents the diversity at iteration g, and is the initial diversity value.
The is the median value of the exploration ratios recorded over all generations:
The serves as a composite measure of the exploration–exploitation balance. It is typically calculated as a weighted function of and (or other exploitation-related indicators):
where is a small constant introduced to avoid division by zero. An value close to 0.5 generally indicates a well-balanced interplay between exploration and exploitation.
3.4. Parameters Sensitivity
By adopting the parameter sensitivity examination framework proposed by Lee et al. [29], this study provides a solid foundation for understanding how optimization algorithms react to changes in their configuration and sustain their reliability across varying conditions.
In the Potential problem (Table 9 and Figure 6), the mean best value improves as decreases: the mean best moves from −13.93 ( = 0.9) toward −16.36 ( = 0.1), with a main effect range of 2.43. This indicates that for this high-dimensional, strongly multimodal potential, excessive stochastic dispersion (high ) “blurs” exploitation of promising areas, whereas mild dispersion supports steady improvement. The impact of is stronger (range 3.04) and non-monotonic: moderate values around 0.3 yield the best mean performance (−16.10), while very low or very high values degrade results. Therefore, in Potential, a clear preference emerges for a “moderate” pull toward the best solution ( ≈ 0.3) combined with a low stochastic perturbation (small ).

Table 9.
Sensitivity analysis of the method parameters for the potential problem (Dimension 10).
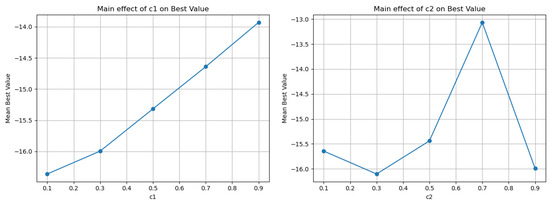
Figure 6.
Graphical representation of c1 and c2 for the potential problem.
In the Rastrigin problem (Table 10 and Figure 7), the behavior differs: has a relatively small main effect (0.88), and the best mean value occurs around = 0.7 (Mean Best ≈ 1.25), with similar performance at = 0.3. In contrast, is more decisive (range 2.44), with the optimal zone around 0.5 (Mean Best ≈ 0.82). The Rastrigin function, with its pronounced symmetric multimodality, benefits from a stronger attraction mechanism toward the best (moderate ), which helps “lock in” low-value basins, while a moderate maintains enough exploration without destabilizing convergence. It is notable that the minima are often 0.00, indicating that all combinations can reach the global minimum, but mean values differentiate reliability and stability.

Table 10.
Sensitivity analysis of the method parameters for the Rastrigin (Dimension 4).
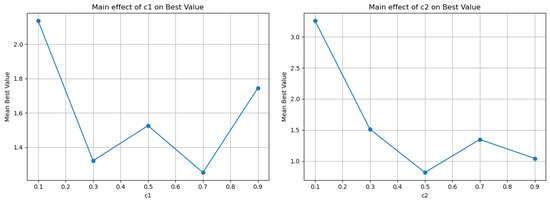
Figure 7.
Graphical representation of c1 and c2 for the Rastrigin problem.
In the Test2n problem (Table 11 and Figure 8), the picture is even clearer in favor of low : the main effect of is very high (8.94), and the best mean performance appears at = 0.1 (Mean Best ≈ −152.41). Increasing toward 0.7–0.9 significantly worsens mean performance, although the minima remain near −156.664 for all settings. This shows that excessive attraction toward the best induces premature convergence into local basins and increases performance variability. has a moderate impact (2.82), with a trend suggesting that larger values (e.g., 0.9) may slightly improve mean performance, likely by helping to escape narrow polynomial valleys. Overall, in Test2n4, the guidance is clear: keep low and allow to be medium-to-high to maintain consistent solution quality.

Table 11.
Sensitivity analysis of the method parameters for the Test2n problem (Dimension 4).
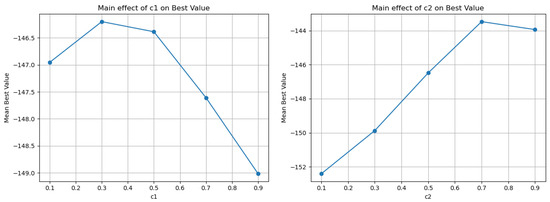
Figure 8.
Graphical representation of c1 and c2 for the Test2n problem.
In the Rosenbrock4 problem (Table 12 and Figure 9), has the largest overall effect across all cases (range 30.29), with a dramatic improvement in mean performance as it increases from 0.1 to 0.9 (Mean Best from ~35.11 to ~4.82). The Rosenbrock function’s narrow curved valley and anisotropy explain why stronger stochastic perturbation helps maintain mobility along the valley and avoid “dead zones” in step progression. shows a U-shaped trend: the best mean performance occurs at 0.3 (Mean Best ≈ 4.43), while very low or very high increases the risk of large outliers, as seen in maximum values that can spike dramatically. Thus, in [rosenbrock4], a high is recommended to keep search activity within the valley, and a moderate ≈ 0.3 helps avoid both over-pulling, which can distort the valley geometry, and overly loose guidance, which delays convergence.

Table 12.
Sensitivity analysis of the method parameters for the Rosenbrock problem (Dimension 4).
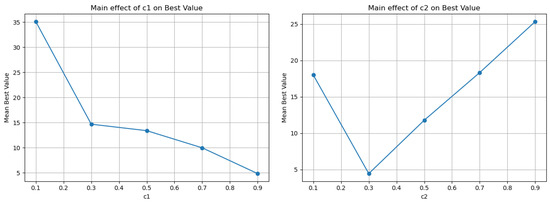
Figure 9.
Graphical representation of c1 and c2 for the Rosenbrock problem.
Synthesizing these findings, a consistent tuning pattern emerges: in highly multimodal landscapes with many symmetric basins such as Rastrigin, a moderate around 0.5 and a moderate around 0.3–0.7 minimize mean values and stabilize convergence. In “parabolic” or polynomial landscapes like Test2n, a low and medium-to-high improve stability and mean performance, preventing premature convergence. In narrow-valley problems like Rosenbrock, strong and moderate ≈ 0.3 appear to be the most robust choice. Finally, for dense multimodal potentials like Potential, the optimal zone tends toward low and moderate ≈ 0.3, balancing small, targeted jumps with steady, controlled attraction toward the best.
In practical terms, the ranges that reappear as “safe defaults” are in the moderate range of 0.3–0.5, and adapted to landscape morphology: low for Potential-type landscapes, moderate for Rastrigin, high for Rosenbrock, and medium-to-high for polynomial Test2n landscapes. The min/max values per setting highlight the tendency for extreme deviations when is too high or too low especially in Rosenbrock reinforcing that the “high —moderate ” combination is often the most resilient operating point when the goal is high mean performance rather than isolated best cases.
3.5. Analysis of Computational Cost and Complexity of the SIOA Algorithm
Figure 10 illustrates the complexity of the proposed method, showing the number of objective function calls and the execution time (in seconds) for problem dimensions ranging from 20 to 260. The experimental settings follow the parameter values specified in Table 1, with the termination criterion based on the homogeneity of the best value. In addition, a limited local optimization procedure is applied at a rate of only 0.5%, enhancing the exploitation of promising regions in the search space without significantly affecting the overall global exploration strategy.

Figure 10.
Computational performance (Calls and Time) of the proposed method on ELLIPSOIDAL and ROSENBROCK across dimensions 20–260.
More specifically, in the ELLIPSOIDAL problem, the execution time increases gradually from 0.111 s at dimension 20 to 41.714 s at dimension 260, while the corresponding objective function calls range from 1398 to 6457. Similarly, for the ROSENBROCK problem, the execution time rises from 0.144 s at dimension 20 to 40.873 seconds at dimension 260, with the number of calls increasing from 2830 to 9200. The results indicate that both execution time and the number of calls grow as the problem dimensionality increases, with ROSENBROCK generally requiring greater computational effort in higher dimensions compared to ELLIPSOIDAL. This observation highlights the sensitivity of the method’s complexity to the nature of the problem, while also confirming its ability to scale efficiently across a wide range of search space sizes.
4. Conclusions
Based on the experiments conducted, SIOA proves to be a mature, competitive, and efficient metaheuristic. In classical benchmark problems, it consistently outperforms GA, DE, PSO, and ACO in terms of required objective function calls while maintaining a high success rate; the overall evaluation footprint is significantly lower than that of traditional methods, translating into faster convergence for a given computational budget. This performance profile supports the view that the biologically inspired “sporulation–germination” mechanism, combined with self-adaptive parameter control and similarity-based replacement, provides a tangible advantage across a wide range of problem types.
The method also demonstrates notable stability: with the parameter settings of Table 1, the best result was reproduced uniformly in 12 consecutive runs, while local optimization was used minimally (only 0.5%), indicating that SIOA’s global search is sufficient to locate optimal or near-optimal solutions without relying heavily on exploitation. The algorithm’s core components—stochastic perturbation around an adaptive radius, attraction toward the global best, the “zero-reset” rule when the optimum lies near the origin, and replacement through crowding—collectively explain both the maintenance of diversity and the ability to avoid premature convergence.
In more demanding, realistic scenarios with a uniform budget of 150,000 function evaluations and no local optimization, SIOA remains highly competitive against advanced techniques. Although CMA-ES achieved the top overall rank, SIOA came very close, with results in certain cases (e.g., Tersoff Potential and Static Economic Load Dispatch) approaching the best of the leading competitors. A slightly higher variance in some less multimodal landscapes limited the mean performance, highlighting a margin for improvement in stability without undermining the overall strength of the method.
The scalability analysis shows that both runtime and function evaluations increase with problem dimension and landscape ruggedness, with problems such as Rosenbrock generally requiring more computational effort than smoother ellipsoidal forms—an observation consistent with the expected behavior of metaheuristics in difficult, poorly scaled valleys. In all cases, SIOA maintains an economical evaluation profile compared to competing approaches, a feature of direct value in costly simulations.
Overall, the method is realistically ready for application: fast in terms of evaluations, stable without relying on intensive local search, and sufficiently flexible to dynamically adapt critical parameters as the search progresses. At the same time, clear opportunities for further improvement remain. Realistic next steps include integrating more specialized, problem-sensitive local optimizers to reduce variance and improve final accuracy, as well as extending SIOA to constrained, multi-objective, and large-scale problems, where the combination of self-adaptation, crowding, and “zero-reset” may yield even greater benefits. Equally promising are explorations of hybrid versions augmented with surrogate modeling for expensive problems, further parallelization and GPU/multi-threaded implementations, the use of restart strategies and dynamic similarity thresholds, and the development of fully parameter-free versions with stronger theoretical convergence guarantees. The indicated extensions to constrained, multi-objective, and large-scale applications, along with reinforcement via dedicated local search schemes, underscore SIOA’s realistic potential as a modern foundation for further research and practical deployment.
Author Contributions
Conceptualization, I.G.T. and V.C.; methodology, V.C.; software, V.C.; validation, I.G.T., D.T. and A.M.G.; formal analysis, D.T.; in-vestigation, I.G.T.; resources, D.T.; data curation, A.M.G.; writing—original draft preparation, V.C.; writing—review and editing, I.G.T.; visualization, V.C.; supervision, I.G.T.; project administration, I.G.T.; funding acquisition, I.G.T. All authors have read and agreed to the published version of the manuscript.
Funding
This research has been financed by the European Union: Next Generation EU through the Program Greece 2.0 National Recovery and Resilience Plan, under the call RESEARCH–CREATE–INNOVATE, project name “iCREW: Intelligent small craft simulator for advanced crew training using Virtual Reality techniques” (project code: TAEDK-06195).
Institutional Review Board Statement
Not applicable.
Informed Consent Statement
Not applicable.
Data Availability Statement
The original contributions presented in this study are included in the article. Further inquiries can be directed to the corresponding author.
Conflicts of Interest
The authors declare no conflicts of interest.
References
- Cauchy, A.-L. Méthode générale pour la résolution des systèmes d’équations simultanées. Compte Rendus Hebd. SéAnces L’AcadéMie Sci. 1847, 25, 536–538. [Google Scholar]
- Nocedal, J.; Wright, S.J. Numerical Optimization, 2nd ed.; Springer: Berlin/Heidelberg, Germany, 2006. [Google Scholar]
- Newton, I. Method of Fluxions; Colson, J., Translator; Henry Woodfall: London, UK, 1736; Original work written in 1671. [Google Scholar]
- Metropolis, N.; Ulam, S. The Monte Carlo method. J. Am. Stat. Assoc. 1949, 44, 335–341. [Google Scholar] [CrossRef] [PubMed]
- Kirkpatrick, S.; Gelatt, C.D.; Vecchi, M.P. Optimization by simulated annealing. Science 1983, 220, 671–680. [Google Scholar] [CrossRef] [PubMed]
- Holland, J.H. Adaptation in Natural and Artificial Systems; University of Michigan Press: Ann Arbor, MI, USA, 1975. [Google Scholar]
- Storn, R.; Price, K. Differential evolution—A simple and efficient heuristic for global optimization over continuous spaces. J. Glob. Optim. 1997, 11, 341–359. [Google Scholar] [CrossRef]
- Charilogis, V.; Tsoulos, I.G.; Tzallas, A.; Karvounis, E. Modifications for the Differential Evolution Algorithm. Symmetry 2022, 14, 447. [Google Scholar] [CrossRef]
- Charilogis, V.; Tsoulos, I.G. A Parallel Implementation of the Differential Evolution Method. Analytics 2023, 2, 17–30. [Google Scholar] [CrossRef]
- Kennedy, J.; Eberhart, R. Particle swarm optimization. In Proceedings of the ICNN’95—International Conference on Neural Networks 1995, Perth, Australia, 27 November–1 December 1995; IEEE: New York, NY, USA, 1995; Volume 4, pp. 1942–1948. [Google Scholar] [CrossRef]
- Qin, A.K.; Huang, V.L.; Suganthan, P.N. Differential evolution algorithm with strategy adaptation for global numerical optimization. IEEE Trans. Evol. 2009, 13, 398–417. [Google Scholar] [CrossRef]
- Brest, J.; Greiner, S.; Boskovic, B.; Mernik, M.; Zumer, V. Self-adapting control parameters in differential evolution: A comparative study on numerical benchmark problems. IEEE Trans. Evol. Comput. 2006, 10, 646–657. [Google Scholar] [CrossRef]
- Liang, J.J.; Qin, A.K.; Suganthan, P.N.; Baskar, S. Comprehensive learning particle swarm optimizer for global optimization of multimodal functions. IEEE Trans. Evol. Comput. 2006, 10, 281–295. [Google Scholar] [CrossRef]
- Hansen, N.; Ostermeier, A. Completely derandomized self-adaptation in evolution strategies. Evol. Comput. 2001, 9, 159–195. [Google Scholar] [CrossRef] [PubMed]
- Nelder, J.A.; Mead, R. A simplex method for function minimization. Comput. J. 1965, 7, 308–313. [Google Scholar] [CrossRef]
- Dorigo, M. Optimization, Learning and Natural Algorithms. Ph.D. Thesis, Politecnico di Milano, Milano, Italy, 1992. [Google Scholar]
- Karaboga, D. An Idea Based on Honey Bee Swarm for Numerical Optimization (Technical Report TR06); Erciyes University, Engineering Faculty, Computer Engineering Department: Kayseri, Turkey, 2005. [Google Scholar]
- Lam, A. BFGS in a Nutshell: An Introduction to Quasi-Newton Methods Demystifying the Inner Workings of BFGS Optimization; Towards Data Science: San Francisco, CA, USA, 2020. [Google Scholar]
- Charilogis, V.; Tsoulos, I.G. Toward an Ideal Particle Swarm Optimizer for Multidimensional Functions. Information 2022, 13, 217. [Google Scholar] [CrossRef]
- Gianni, A.M.; Tsoulos, I.G.; Charilogis, V.; Kyrou, G. Enhancing Differential Evolution: A Dual Mutation Strategy with Majority Dimension Voting and New Stopping Criteria. Symmetry 2025, 17, 844. [Google Scholar] [CrossRef]
- Tsoulos, I.G.; Charilogis, V.; Kyrou, G.; Stavrou, V.N.; Tzallas, A. OPTIMUS: A Multidimensional Global Optimization Package. J. Open Source Softw. 2025, 10, 7584. [Google Scholar] [CrossRef]
- Siarry, P.; Berthiau, G.; Durdin, F.; Haussy, J. Enhanced simulated annealing for globally minimizing functions of many-continuous variables. ACM Trans. Math. Softw. (TOMS) 1997, 23, 209–228. [Google Scholar] [CrossRef]
- Koyuncu, H.; Ceylan, R. A PSO based approach: Scout particle swarm algorithm for continuous global optimization problems. J. Comput. Des. Eng. 2019, 6, 129–142. [Google Scholar] [CrossRef]
- LaTorre, A.; Molina, D.; Osaba, E.; Poyatos, J.; Del Ser, J.; Herrera, F. A prescription of methodological guidelines for comparing bio-inspired optimization algorithms. Swarm And Evol. Comput. 2021, 67, 100973. [Google Scholar] [CrossRef]
- Gaviano, M.; Kvasov, D.E.; Lera, D.; Sergeyev, Y.D. Algorithm 829: Software for generation of classes of test functions with known local and global minima for global optimization. ACM Trans. Math. Softw. (TOMS) 2003, 29, 469–480. [Google Scholar] [CrossRef]
- Jones, J.E. On the determination of molecular fields.—II. From the equation of state of a gas. Proc. R. Soc. London Ser. Contain. Pap. Math. Phys. Character 1924, 106, 463–477. [Google Scholar]
- Zabinsky, Z.B.; Graesser, D.L.; Tuttle, M.E.; Kim, G.I. Global optimization of composite laminates using improving hit and run. In Recent Advances in Global Optimization; Princeton University Press: Princeton, NJ, USA, 1992; pp. 343–368. [Google Scholar]
- Friedman, M. The use of ranks to avoid the assumption of normality implicit in the analysis of variance. J. Am. Stat. Assoc. 1937, 32, 675–701. [Google Scholar] [CrossRef]
- Lee, Y.; Filliben, J.; Micheals, R.; Phillips, J. Sensitivity Analysis for Biometric Systems: A Methodology Based on Orthogonal Experiment Designs; National Institute of Standards and Technology Gaithersburg (NISTIR): Gaithersburg, MD, USA, 2012; p. 20899. [Google Scholar] [CrossRef]
Disclaimer/Publisher’s Note: The statements, opinions and data contained in all publications are solely those of the individual author(s) and contributor(s) and not of MDPI and/or the editor(s). MDPI and/or the editor(s) disclaim responsibility for any injury to people or property resulting from any ideas, methods, instructions or products referred to in the content. |
© 2025 by the authors. Licensee MDPI, Basel, Switzerland. This article is an open access article distributed under the terms and conditions of the Creative Commons Attribution (CC BY) license (https://creativecommons.org/licenses/by/4.0/).