Review

Stock Market Prediction Using Machine Learning and Deep Learning Techniques: A Review

by
Mohammadreza Saberironaghi
,
Jing Ren
and
Alireza Saberironaghi
*
Department of Electrical, Computer and Software Engineering, Ontario Tech University, Oshawa, ON L1G 0C5, Canada
*
Author to whom correspondence should be addressed.
AppliedMath 2025, 5(3), 76; https://doi.org/10.3390/appliedmath5030076
Submission received: 21 March 2025 / Revised: 12 May 2025 / Accepted: 20 May 2025 / Published: 24 June 2025
(This article belongs to the Special Issue Optimization and Machine Learning)

Abstract

The rapid advancement of machine learning and deep learning techniques has revolutionized stock market prediction, providing innovative methods to analyze financial trends and market behavior. This review paper presents a comprehensive analysis of various machine learning and deep learning approaches utilized in stock market prediction, focusing on their methodologies, evaluation metrics, and datasets. Popular models such as LSTM, CNN, and SVM are examined, highlighting their strengths and limitations in predicting stock prices, volatility, and trends. Additionally, we address persistent challenges, including data quality and model interpretability, and explore emerging research directions to overcome these obstacles. This study aims to summarize the current state of research, provide insights into the effectiveness of predictive models.

1. Introduction

In recent years, stock market prediction has gained significant attention due to the rapid advancements in machine learning and deep learning technologies. These techniques have transformed traditional forecasting methods by providing more sophisticated, data-driven approaches that can analyze vast amounts of financial data [1]. Stock market prediction aims to forecast stock prices, market trends, and volatility by leveraging historical data, economic indicators, and sentiment analysis, among other factors. Accurate predictions can be highly beneficial for traders, investors, and financial institutions, influencing investment strategies, risk management, and decision-making processes [2].
Historically, stock market analysis relied on statistical methods and human expertise, which face several limitations:
  • Human biases and emotional factors can lead to incorrect predictions and suboptimal trading decisions.
  • Traditional methods often struggle to handle the complexities and non-linear patterns of financial data [3].
  • Real-time analysis and response to dynamic market changes are challenging to achieve with purely manual approaches.
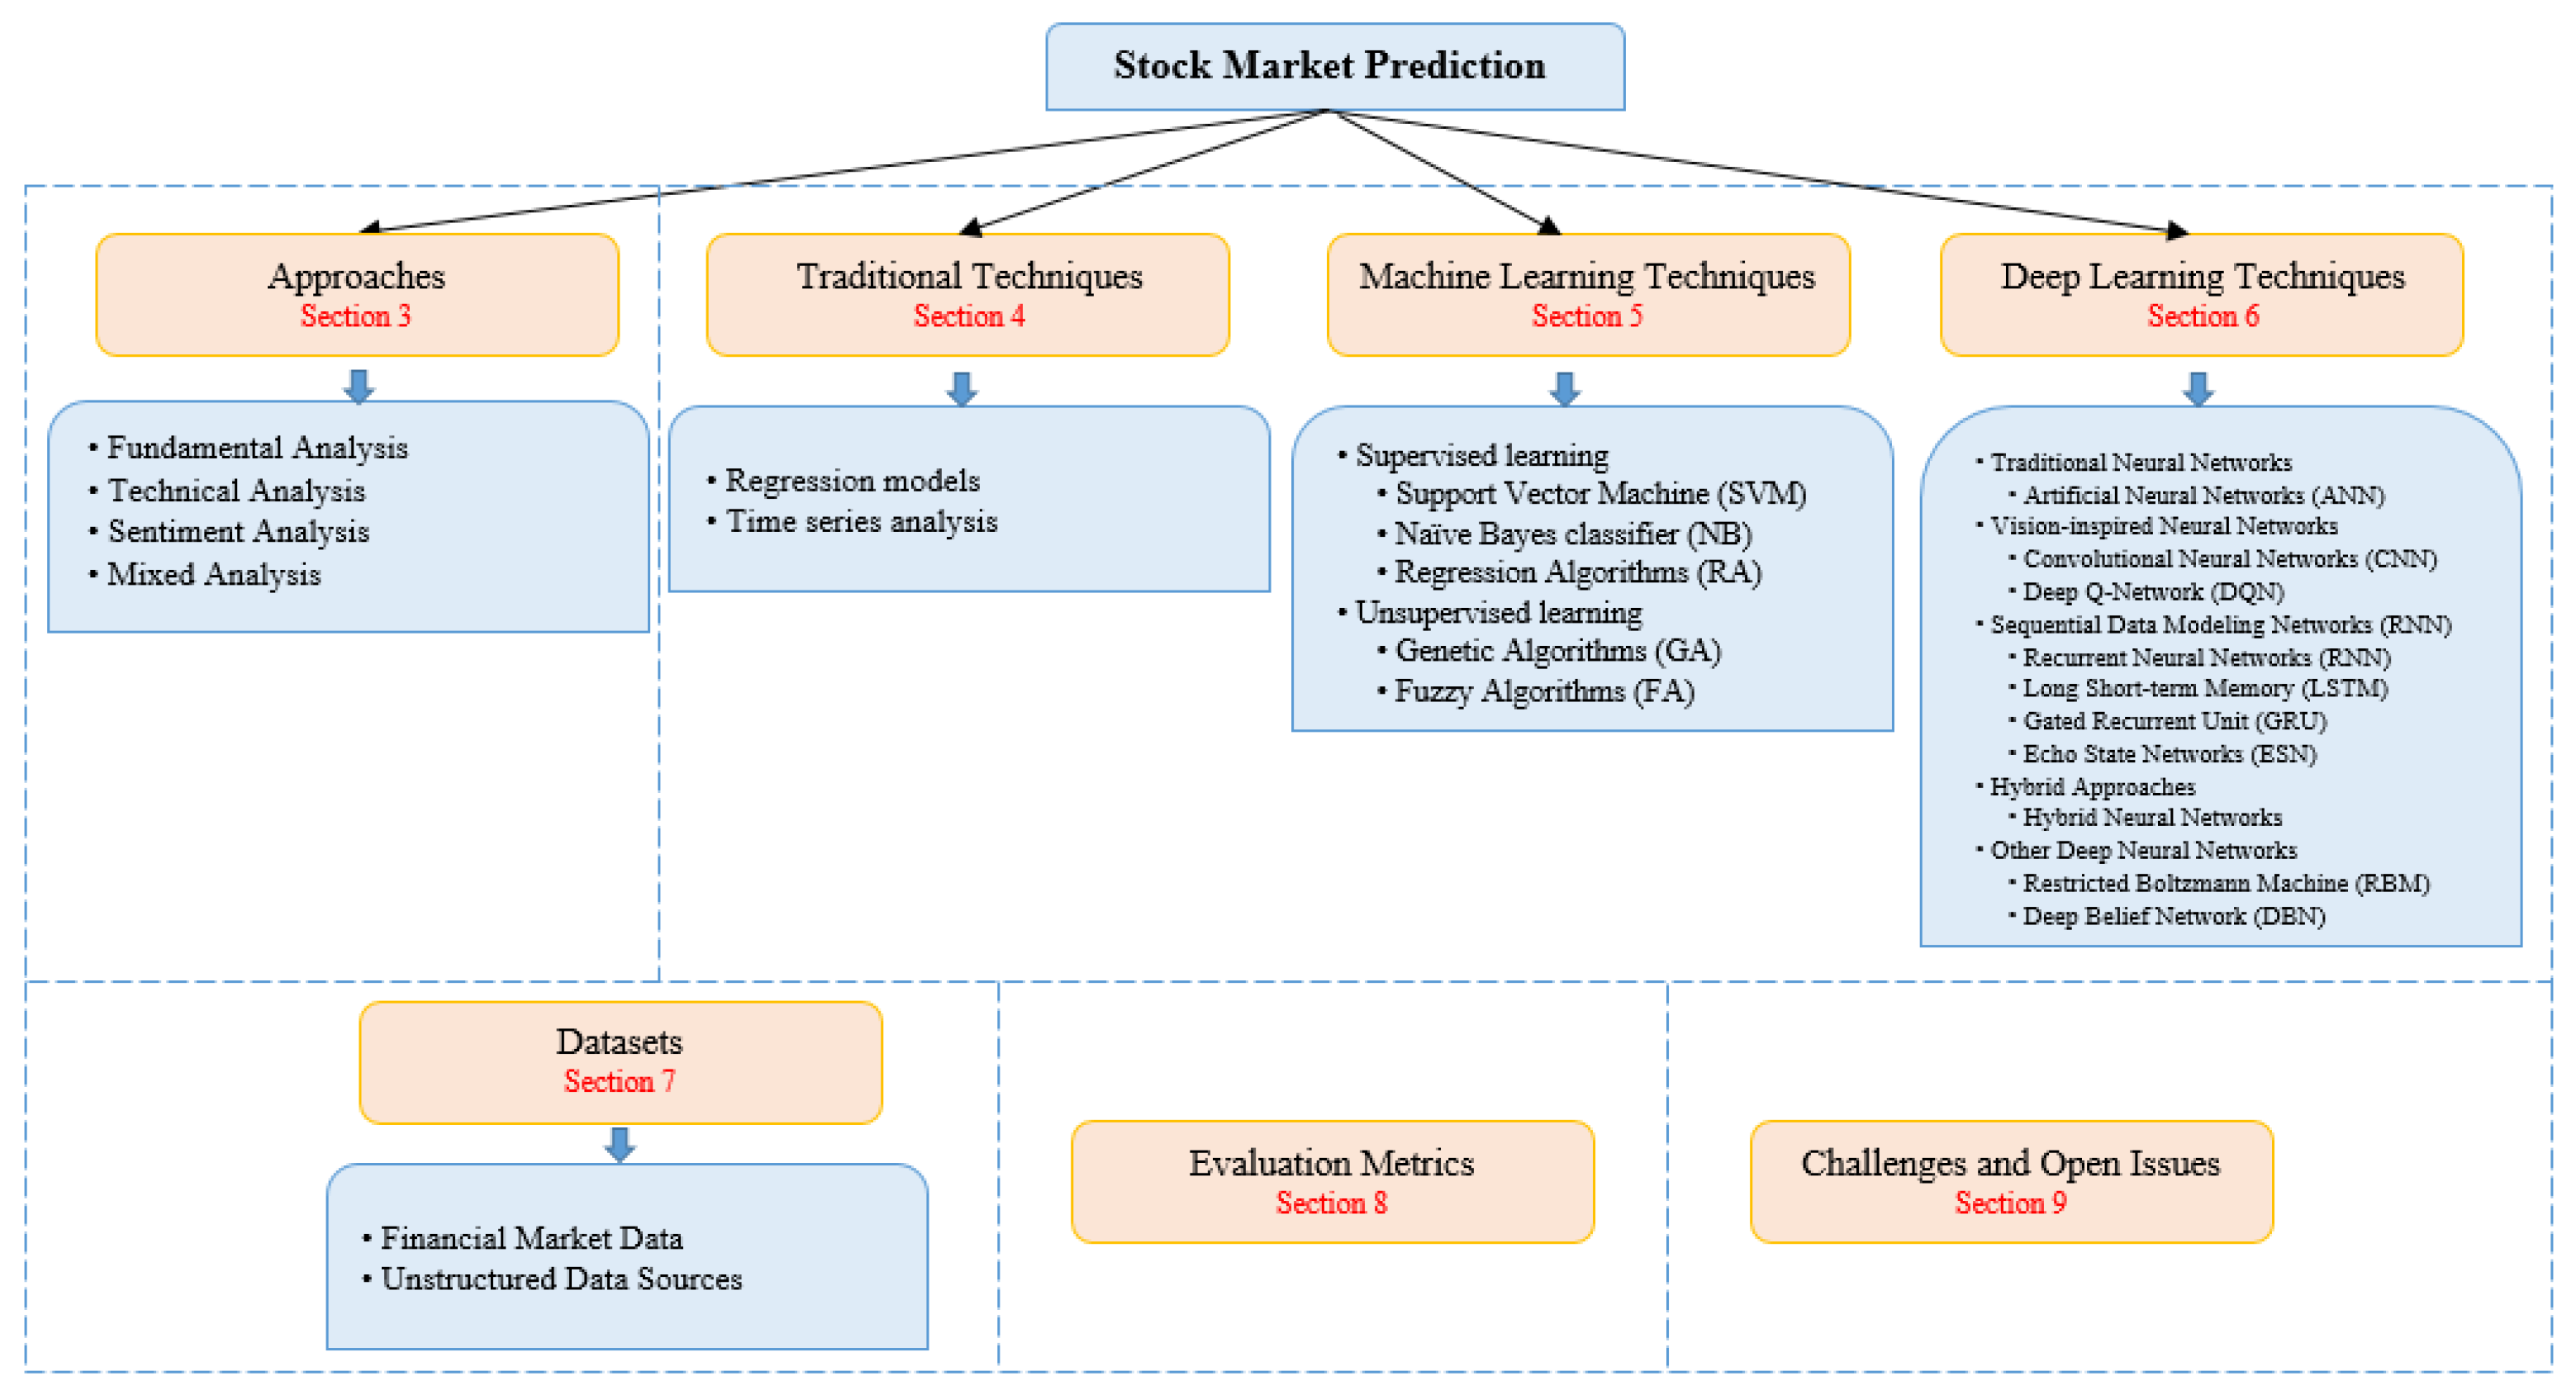
This review provides a comprehensive survey of ML and DL approaches in stock market prediction and distinguishes itself from previous studies ([4,5,6]) through several key contributions. First, it covers a broader range of financial datasets (18 in total), offering a more holistic view of model performance across diverse data sources. Second, it evaluates models using an expanded set of 12 different metrics, enabling a more nuanced performance comparison. Third, it systematically categorizes ML and DL models based on their learning strategies, data dependencies, and market application contexts—offering a novel taxonomy to aid future research.
Furthermore, unlike earlier surveys that tend to focus solely on either ML or DL models, this review jointly analyzes both types under consistent evaluation criteria. It also discusses critical challenges in the field, such as data quality, model interpretability, and the difficulty of real-time market adaptation—thereby offering practical insights alongside theoretical analysis.
Table 1 highlights the comparative advantages of our work relative to related surveys.
Table 1. Comparison of related surveys and our approach for stock market prediction (SMP).
Content[4][5][6]Ours
Deep learning models🗸🗴🗸🗸
Machine learning models🗴🗸🗴🗸
Datasets Used in SMP🗴🗴🗴18
Evaluation Metrics🗴🗴1112

2. Contributions

The main contributions of this survey can be summarized as follows:
  • Comprehensive Review of ML and DL Models: We provide an in-depth review of machine learning and deep learning models used for stock market prediction, considering various algorithmic designs, including recurrent neural networks, convolutional models, and ensemble methods, along with different learning strategies (supervised, unsupervised, and hybrid).
  • Analysis of Real-World Applicability: This survey offers a detailed evaluation of the models’ performance under different market conditions, timeframes, and datasets, bridging the gap between academic research and real-world financial applications. The analysis considers diverse financial datasets and evaluation metrics to provide a practical perspective on model effectiveness.
  • Identification of Key Challenges and Future Directions: We summarize the main challenges and potential limitations faced by ML and DL models in stock market prediction, such as data quality, model interpretability, and real-time prediction. Additionally, we outline future research directions that could enhance the real-time adaptability, robustness, and generalization of prediction models in financial markets.
  • Broad Dataset and Metric Utilization: We employ a wider range of financial datasets and performance metrics than previous reviews, offering a more extensive analysis of predictive accuracy, volatility forecasting, and trend identification, with a focus on both short-term and long-term forecasting capabilities.
The rest of this paper is depicted in Figure 1 and structured as follows: Section 2 introduces the foundational concepts and a general overview of advancements in stock market prediction. Section 3 examines various approaches, including fundamental, technical, sentiment, and mixed analysis, highlighting their theoretical and practical implications. Section 4 focuses on traditional techniques such as regression models and time-series analysis, discussing their applications and limitations. Section 5 delves into machine learning techniques, categorized into supervised and unsupervised learning strategies, such as Support Vector Machines, Naïve Bayes classifiers, and Genetic Algorithms. Section 6 provides an extensive review of deep learning techniques, including Artificial Neural Networks, Recurrent Neural Networks, and hybrid architectures, emphasizing their role in enhancing prediction accuracy and scalability. Section 7 reviews datasets used in stock market prediction, including financial market data and unstructured data sources, and highlights their relevance and challenges. Section 8 outlines evaluation metrics, such as accuracy, precision, and financial-specific metrics like ROI and the Sharpe ratio, providing a framework for assessing prediction performance. Finally, Section 9 discusses the challenges and open issues, proposing future research directions to address existing limitations and improve the reliability and robustness of stock market prediction systems.

3. Approaches to Stock Price Prediction

Predicting stock prices is widely regarded as a complex and demanding task, attracting significant interest from both researchers and market participants. To anticipate fluctuations in stock prices, four primary methodologies are commonly employed: sentiment analysis, technical analysis, fundamental analysis, and hybrid approaches that combine these techniques. This paper provides a detailed review of existing studies on stock price prediction, analyzing various strategies and evaluating their effectiveness. Table 2 summarizes the key features, notable studies, and challenges associated with these methodologies, offering a concise overview of the primary approaches to stock price prediction.

3.1. Fundamental Analysis

Fundamental analysis seeks to determine a company’s intrinsic value by evaluating factors at the economic, industry-specific, and company levels. As outlined by [7], this approach encompasses three main components. First, macroeconomic analysis examines indicators like GDP and CPI to gauge how broader economic conditions influence a company’s future performance. Second, industry analysis situates the company’s value within its specific sector, taking into account market trends and competitive dynamics. Lastly, company analysis delves into the organization’s internal operations and financial health to estimate its true worth. Together, these elements provide a comprehensive framework for understanding a company’s fundamental value. Fundamental analysis involves employing various valuation techniques to assess stocks. One such method is the average growth approximation technique, which focuses on comparing stocks within the same category by analyzing the Price-to-Earnings ratio. For example, stocks with similar growth rates are often compared based on their P/E ratios, with a lower P/E generally being more desirable [8]. Another widely used approach is Gordon’s growth model [9], which assumes dividends grow at a constant rate indefinitely, provided this growth rate remains below the discount rate. Fundamental analysis also incorporates broader economic indicators such as interest rates, inflation, and market capitalization. These factors are combined with financial metrics like Return on Equity and Earnings Per Share to forecast a company’s performance and identify investment opportunities. Studies such as [10,11] have explored the integration of macroeconomic indicators to enhance prediction accuracy, emphasizing the analytical power of this approach. Research has highlighted the effectiveness of fundamental analysis. For example, ref. [12] demonstrated how financial ratios could distinguish high-performing stocks from underperformers. Their study achieved a 74.6% accuracy rate in one-year returns compared to benchmarks like Nifty, emphasizing the utility of company-specific metrics for investment decision-making. With advancements in machine learning and artificial intelligence, their application in fundamental analysis has become increasingly important. For example, ref. [13] utilized a Genetic Algorithm to optimise feature selection in combination with an LSTM-based neural network to forecast stock prices. Their study focused on data from China Construction Bank and the CSI 300 index. The GA-LSTM model demonstrated superior performance compared to traditional approaches, effectively addressing the nonlinear characteristics of stock market data. Other advancements include hybrid approaches combining traditional methods with machine learning techniques. Ref. [14] developed a portfolio construction method for the Shanghai Stock Exchange by integrating the MV model with XGBoost. The hybrid framework addressed both stock prediction and portfolio selection, resulting in improved decision-making. Similarly, ref. [15] proposed a model using data from Yahoo! Finance, public sentiment, and political events. They incorporated features extracted from the data into ten machine learning algorithms, achieving higher prediction accuracy than existing models. While fundamental analysis is a powerful tool, it is not without limitations. One drawback is the lack of explicit knowledge about the rules governing market systems, which can lead to inaccuracies in predictions. Furthermore, the non-linearity inherent in financial systems poses challenges to traditional methods [16]. Despite these limitations, fundamental analysis remains a cornerstone of stock price prediction due to its ability to provide deep insights into financial health and market dynamics.

3.2. Technical Analysis

Technical analysis is a widely utilized approach for predicting stock prices by utilizing historical data on prices and volumes to uncover significant patterns and trends. By studying past market behavior, this method aims to forecast future price movements. A systematic review by [17] highlighted the effectiveness of technical analysis in predicting stock market trends, emphasizing its potential for high accuracy in forecasting price movements. Recent advancements in AI have significantly enhanced technical analysis by automating trend identification and improving prediction accuracy. For instance, ref. [18] introduced a hybrid deep learning model that integrates CNNs and GRUs to address challenges such as temporal dependencies, market volatility, and complex relationships inherent in stock price forecasting. Similarly, ref. [19] utilized BI-LSTM and LSTM models to capture intricate temporal patterns in stock data. Ref. [20] introduced a deep learning-based method for predicting stock market liquidity in the Vietnamese market. Their model, tested with MLP, MDL, and LR, achieved the MSE using MDL. However, its applicability was limited to the Vietnamese stock market, showcasing the challenge of adapting technical analysis models across different markets. In another development, ref. [21] proposed an ensemble model combining deep learning techniques with traditional technical analysis methods. This model effectively captured both short-term and long-term stock price trends. It utilized CNNs for identifying short-term signals, LSTMs for analyzing long-term trends, and an Attention Mechanism to highlight key features in extensive stock price datasets. This approach demonstrated significant improvements in forecasting accuracy.
Technical analysis employs price charts, mathematical formulas, and pattern recognition to predict stock prices, often focusing on short-term investment strategies. Analysts examine key price points—such as daily, weekly, or monthly highs, lows, opens, and closes—along with broader market trends. Dow Theory forms the cornerstone of technical analysis, emphasizing three key principles: market prices incorporate all available information, prices follow discernible trends, and historical patterns are likely to recur [22].

3.3. Sentiment Analysis

Sentiment analysis, a multidisciplinary field, evaluates emotions and attitudes expressed by individuals toward specific entities, such as products, services, or companies. It determines whether sentiments are positive, negative, or neutral, and often quantifies their intensity. This process involves collecting large volumes of textual data, often in real-time, from diverse sources like social media platforms, news articles, and blogs. NLP techniques are then applied to analyze and interpret this data. In the financial domain, sentiment analysis is employed to capture market sentiment by interpreting investor opinions and news, which can influence stock price movements. For instance, ref. [23] proposed a hybrid model combining deep learning and sentiment analysis to predict stock prices more accurately. This model integrates stock market technical indicators with sentiment data derived from a major stock forum. A CNN processes textual data to classify hidden investor sentiments, while a LSTM neural network analyzes the combined sentiment and technical indicators. Applied to 30 stocks from six different industries listed on the Shanghai Stock Exchange, the model showed superior predictive accuracy compared to methods that did not incorporate sentiment analysis. Ref. [24] proposed a hybrid model combining sentiment analysis with machine learning classifiers and deep learning techniques, utilizing news, social media, and historical stock data. The approach demonstrated the influence of news sentiment polarity on stock price trends and highlighted the potential for improved prediction accuracy using updated data and advanced methodologies. Ref. [25] explored sentiment analysis in the context of the Chinese stock market. They collected sentiment data from official news outlets and the Sina Weibo blogging platform during the COVID-19 pandemic, from 17 December 2019, to 13 March 2020. Their study evaluated stock returns and turnover rates, revealing significant correlations between sentiments and market performance during this period. In another innovative approach, ref. [26] applied the dimensional valence-arousal concept to stock market prediction using sentiment data. They developed a deep learning model called HAHTKN, which outperformed both SDVA-specific and hierarchical attention network (HAN)-based models. This highlights the value of advanced sentiment analysis techniques in understanding market dynamics and improving forecasting accuracy.
Sentiment analysis, by incorporating unstructured data from various sources, provides a unique perspective on market behavior. Although challenges like data noise, misinformation, and variability in sentiment intensity persist, integrating sentiment analysis with machine learning and deep learning techniques has proven to significantly enhance stock market predictions.

3.4. Mixed Approach

The mixed approach combines various prediction techniques, including technical analysis, fundamental analysis, and sentiment analysis, to improve the accuracy of stock price predictions. This approach aims to harness the advantages of each method while addressing their individual shortcomings. In 2021, ref. [27] designed an integrated framework for accurate stock price prediction by leveraging data from news articles, social media, and technical company information. Their approach utilized advanced contextual feature engineering alongside various machine learning estimators, achieving an impressive average mean absolute percentage error of 0.93, marking a notable enhancement in predictive accuracy. Ref. [28] introduced another significant mixed approach by analyzing stock index data and investors’ comments related to the Hang Seng Index from January 2002 to December 2020. Their research employed a hybrid model combining sentiment analysis, a denoising autoencoder, and Long Short-Term Memory. This model not only surpassed other methods in prediction accuracy but also excelled in evaluating returns and risks, providing valuable insights for investors aiming to make informed, data-driven decisions. Ref. [29] introduced GAN-HPA, a generative adversarial network-based hybrid predictive algorithm, for stock price forecasting. Their approach achieved superior results compared to Stock-GAN and MM-HPA, demonstrating the potential of GANs in stock market predictions. Feature engineering and selection methods have been integrated into hybrid models to improve prediction accuracy. For instance, ref. [30] developed a model that combined Genetic Algorithm (GA) with XGBoost to forecast the next-day price movements of the Korea Composite Stock Price Index 200. By incorporating feature selection alongside machine learning techniques, the model achieved enhanced predictive performance. In 2021, ref. [31] proposed a hybrid model designed to generate trading signals. Their approach integrated technical indicators, including MACD and TEMA with machine learning classifiers such as Linear Models, Support Vector Regression, and Random Forest. This combination resulted in improved accuracy for stock price predictions. The mixed approach effectively addresses the complexities of stock market forecasting by combining diverse data sources and analytical techniques. By leveraging the strengths of multiple methods, these hybrid models demonstrate significant improvements in prediction accuracy and offer practical insights for market participants.
Table 2. Summary of stock price prediction approaches.
MethodologyKey FeaturesNotable StudiesChallenges
Fundamental Analysis
-
Evaluates intrinsic value based on macroeconomic, industry-specific, and company-level factors.
-
Uses financial metrics like ROE and EPS.
-
Integration of Genetic Algorithm (GA) with LSTM [13].
-
Hybrid frameworks like XGBoost for portfolio construction [14].
-
Analysis incorporating public sentiment and political events [15].
-
Lack of explicit market system rules.
-
Struggles with nonlinear financial systems [16].
Technical Analysis
-
Uses historical price and volume data to predict future trends.
-
Employs Dow Theory principles and mathematical models.
-
CNN-GRU hybrid models for addressing temporal dependencies [18].
-
BI-LSTM for capturing intricate temporal patterns [19].
-
Ensemble models combining CNNs, LSTMs, and Attention Mechanisms for improved accuracy [21].
-
Limited generalizability across markets.
-
Sensitive to data noise and external market shocks.
Sentiment Analysis
-
Analyzes unstructured textual data from social media, news, and blogs.
-
Captures emotions and market sentiment to predict price movements.
-
Hybrid models integrating sentiment with technical indicators [23].
-
Use of public sentiment during events like COVID-19 [25].
-
Deep learning advancements like HAHTKN model for dimensional valence-arousal analysis [26].
-
Data noise and misinformation.
-
Difficulty quantifying variability in sentiment intensity.
Mixed Approach
-
Combines techniques from fundamental, technical, and sentiment analysis.
-
Leverages diverse data sources and machine learning methods for holistic predictions.
-
GAN-HPA hybrid models for superior accuracy [29].
-
Integration of technical indicators (e.g., MACD, TEMA) with machine learning classifiers (e.g., SVR, RF) for trading signals [31].
-
Complexity in integrating heterogeneous data.
-
Computationally intensive models may lack real-time usability.

4. Statistical and Traditional Techniques

Statistical and traditional techniques play a vital role in stock market prediction by leveraging historical data and identifying patterns. Two prominent approaches under this category are Regression Models and Time Series Analysis. A detailed comparison of these techniques, including their key features, advancements, and limitations, is provided in Table 3.

4.1. Regression Models

Regression models are widely used in stock market prediction due to their simplicity and effectiveness in identifying relationships between variables. They analyze historical data and use independent variables to forecast stock prices or classify stocks into performance categories. Ref. [32] explored multiple regression techniques to forecast the stock price of Tata Consultancy Services, leveraging features like open, high, low, close prices, and trading volume. They evaluated linear, polynomial, and Radial Basis Function regression models, concluding that the linear regression model delivered the best performance with a confidence value of 0.97. This study emphasized the effectiveness of linear regression in identifying relationships within financial datasets. In 2019, ref. [33] proposed a hybrid model combining a Wavelet Adaptive Neuro-Fuzzy Inference System and Discrete Wavelet Transform to predict stock closing prices. The financial time series data were decomposed into approximation and detail coefficients using DWT, which were then used as inputs for the ANFIS model. The WANFIS approach showed higher prediction accuracy compared to traditional models, highlighting the benefits of integrating regression with advanced preprocessing techniques.
Regression models remain an essential tool in stock market prediction, offering straightforward yet effective methodologies for understanding market dynamics. Their versatility and ability to integrate with other approaches make them a valuable asset for financial forecasting.

4.2. Time Series Analysis

Time series analysis is a crucial approach in stock market prediction, leveraging historical data to identify trends and forecast future stock prices. Pattern recognition techniques play a significant role by matching historical patterns to predict upcoming market behaviors. Ref. [34] conducted an in-depth exploration of ARIMA models for stock price prediction. They identified optimal models by considering criteria such as standard error, adjusted R-square, and Bayesian Information Criterion. Their study concluded that ARIMA models performed competitively for short-term stock price prediction, as demonstrated with Nokia and Zenith Bank stocks. The research reinforced the relevance of ARIMA models even amidst emerging forecasting technologies. Ref. [35] tackled specific challenges in stock analysis, including dimensionality reduction and catering to the needs of novice investors. They utilized historical data from four Indian midcap companies to train an ARIMA model and evaluated its accuracy using the Akaike Information Criterion test. Their results indicated that broader indices, such as the Nifty 50, offered lower volatility and greater reliability, making them a better choice for inexperienced investors. Ref. [36] introduced a novel approach for detecting patterns in time series data by utilizing Perceptually Important Points. Unlike conventional template matching techniques, the PIP method focuses on reducing data dimensionality, allowing for the earlier identification of trends. This is accomplished through a subsequence pattern matching technique that segments time series data using a sliding window mechanism. Experimental results showed that this approach significantly improves both the efficiency and accuracy of trend detection. In 2020, ref. [37] introduced a novel method for predicting stock price trends using feature selection algorithms combined with machine learning models. Their study utilized eight years of data from the Chinese A-share market. The data were processed using time-sliding window cross-validation, a technique that ensures robust training and testing across time-series datasets. Feature selection and trend prediction were performed using the Random Forest algorithm, which effectively identified key variables influencing stock prices. The proposed model showed promise not only in predicting stock price trends but also in constructing and validating optimal investment portfolios.
Time series analysis, with its ability to model temporal dependencies, continues to be a fundamental approach in stock market forecasting. Techniques like PIP and machine learning integrations enhance its capability to detect complex patterns, making it a valuable tool for investors and analysts.
While regression and time series models are foundational and easy to implement, their predictive power is often limited by assumptions of linearity and stationarity. Regression models perform well in stable market conditions but may fail to capture complex, nonlinear relationships without hybridization. Time series models like ARIMA are effective for short-term forecasting but are sensitive to parameter tuning and may not adapt well to sudden market changes or outlier events. Integrating these traditional methods with feature selection or preprocessing techniques can improve robustness, but their effectiveness is still largely dependent on data quality and the specific financial context.
Table 3. Summary of Statistical and Traditional Techniques in Stock Market Prediction.
TechniqueKey FeaturesNotable StudiesChallenges
Regression Models
-
Identifies relationships between variables using historical data.
-
Commonly used for forecasting prices and classifying performance.
-
Linear regression for TCS stock price prediction with 0.97 confidence [32].
-
Regression combined with candlestick patterns for “Buy/Sell”
-
WANFIS hybrid model integrating DWT for enhanced prediction accuracy [33].
-
Limited effectiveness for nonlinear data.
-
Performance may degrade with high-dimensional or noisy datasets.
Time Series Analysis
-
Models temporal dependencies in stock prices.
-
Focuses on pattern recognition and trend forecasting.
-
ARIMA models for Nokia and Zenith Bank, optimized using Bayesian Information Criterion [34].
-
ARIMA with dimensionality reduction for midcap stocks, highlighting benefits for novice investors [35].
-
PIP method for efficient trend detection using sliding window [36].
-
Requires accurate parameter tuning for ARIMA models.
-
Time-series techniques may struggle with sudden market shocks or rare events.

5. Machine Learning Techniques

Machine learning techniques are crucial for stock market prediction, leveraging advanced algorithms to handle complex data and improve accuracy. Supervised methods like SVM, Naïve Bayes, and regression algorithms use labeled data for prediction and are often combined in hybrid models for better performance. Unsupervised techniques like Genetic and Fuzzy Algorithms focus on optimizing parameters and managing uncertainty, excelling when integrated with other models. A detailed comparison of these techniques is provided in Table 4.

5.1. Supervised Learning

5.1.1. Support Vector Machine (SVM)

SVM are highly adaptable algorithms commonly employed for both classification and regression tasks. Their core strength lies in identifying the optimal hyperplane that maximizes the margin between two classes of data. Utilizing the kernel trick, SVM can effectively handle higher-dimensional feature spaces, allowing it to separate non-linear data. With minimal reliance on parameters and consistently robust performance, SVM is a popular choice, frequently rivaling or surpassing more complex algorithms across a range of applications. In 2019, ref. [38] presented a multi-level classifier model that integrated machine learning techniques, including logistic regression, decision trees, SVM, and recurrent neural networks. This model was designed to enhance the accuracy of stock price predictions by leveraging the complementary strengths of these methods. Their evaluation revealed a 10–12% improvement in performance over existing models, highlighting the effectiveness of SVM when utilized as part of a combined approach. Another study by [39] developed daily and monthly stock market prediction models focusing on the banking, mining, and oil sectors. Using historical prices from Yahoo Finance along with sentiment data from news and tweets, the authors employed Principal Component Analysis to address data sparsity. They compared SVM with Decision-Boosted Trees and Logistic Regression. While Decision-Boosted Trees outperformed other models, SVM demonstrated lower accuracy levels. The study highlighted that incorporating intra-day price movements could significantly improve prediction accuracy. Ref. [40] examined stock market prediction using ML algorithms, focusing on technical and fundamental analyses. Linear regression showed low error in predicting closing prices, while SVM achieved 76% accuracy for sentiment analysis. Despite these results, the models lack precision for long-term investments or reliable decision-making. Hybrid approaches combining both analyses show potential for improved accuracy, offering a promising area for future research. In 2021, ref. [41] introduced a comprehensive stock market prediction model consisting of three main phases: feature extraction, optimal feature selection, and prediction. Using data from the Saudi stock market, the model extracted statistical and technical indicator-based features. Recursive Differential Adaptive Weighted Algorithm was applied to select the most relevant features. For prediction, the model utilized an ensemble of classifiers, including SVM, Random Forest (RF1 and RF2), and an optimized neural network. The results showed minimal prediction errors, demonstrating the robustness of SVM when combined with advanced techniques.
SVM remains a powerful and efficient tool for stock market prediction. Although its standalone performance can be limited in complex scenarios, combining it with other algorithms and techniques enhances its effectiveness, making it a key component in hybrid predictive models.

5.1.2. Naïve Bayes (NB)

NB is a probabilistic classification algorithm based on Bayes’ Theorem. It operates under the assumption of independence between features, which simplifies computations and allows it to scale efficiently across large datasets. Due to its speed and simplicity, NB has been widely adopted for stock market prediction tasks, especially in scenarios involving textual or sentiment data [42,43,44]. In [45], the Naïve Bayes algorithm was utilized for sentiment analysis based on textual data from multiple sources. The study examined the effects of traditional media and social media on stock price prediction across various companies. By exploring the relationships between these data sources, the authors highlighted the algorithm’s effectiveness in uncovering the impact of sentiment on stock market trends.
Naïve Bayes remains a practical choice for SMP, particularly when working with large-scale textual datasets. Its efficiency and effectiveness in handling classification tasks make it a valuable tool for analyzing sentiment and other qualitative data relevant to market prediction.

5.1.3. Regression Algorithms (RA)

RA are widely used in predictive modeling to establish and quantify relationships between a dependent variable and one or more independent variables [46]. In stock market prediction, regression approaches enable the analysis of complex financial datasets and the forecasting of stock prices based on historical trends and various influencing factors. A range of regression techniques has been applied in previous research, ref. [47] investigated stock market prediction by comparing Linear Regression and Support Vector Machines. Using Coca-Cola stock data from January 2017 to January 2018, the study plotted closing prices and applied a linear model to observe trends. Evaluation metrics such as MSE, MAE, MAPE, and R indicated that while LR provides a basic trend analysis, SVM offers higher accuracy and predictability. This comparison highlights the potential of advanced ML techniques in improving forecasting models. Ref. [48] developed a stock market prediction model using multiple regression with three variables, achieving 89% accuracy, surpassing linear regression. The study highlights the potential of neural networks to further improve prediction accuracy in future research. Ref. [49] explored stock market prediction using a C5.0 decision tree model based on high-frequency SPIF data, including price, volume, and open interest. The study achieved 70% accuracy, highlighting the greater significance of moving average price over volume and interest for short-term predictions. The authors emphasized the need for further research with improved variables to refine prediction accuracy. Ref. [50] proposed a stock price prediction model combining windowing functions with a (SVR) algorithm. Using rectangular and flatten window operators, the model demonstrated acceptable error rates (MAPE) for 1, 5, and 22-day predictions. The authors suggest future work could involve testing additional windowing functions and datasets to enhance performance and compare results with other data mining techniques.
Regression algorithms provide a flexible and powerful framework for stock price prediction, capable of handling both linear and nonlinear relationships. By integrating them with advanced techniques and additional data sources, researchers can significantly improve the accuracy and reliability of stock market predictions.

5.2. Unsupervised Learning

5.2.1. Genetic Algorithms (GA)

GA are inspired by the principles of natural evolution and are designed to find optimal solutions to complex problems. These algorithms iteratively combine, mutate, and alter candidate solutions, selecting the best-performing solutions for subsequent iterations. By simulating the process of natural selection, GAs aim to maximize model accuracy and optimize performance. Starting with a randomly generated population, the algorithm evolves toward an optimal solution by applying fitness or objective functions to evaluate and refine the solutions. In 2020, ref. [51] introduced MM-HPA with SMPPF, a hybrid model for precise stock market price prediction. This approach combined GA with linear and nonlinear models. Linear regression was used to model straightforward relationships, while a recurrent neural network captured nonlinear data patterns. GA was employed to optimally tune the parameters within this hybrid framework, effectively addressing the challenges of detecting complex, nonlinear patterns in stock data. GAs are extensively utilized in stock market prediction for fine-tuning parameters and generating optimal trading rules. For example, ref. [52] proposed an intelligent decision support system combining rough sets and GA to analyze nonlinear and complex stock data. This system identified key features for generating effective buy and sell strategies, showcasing the ability of GAs to enhance trading decisions. Ref. [53] proposed a stock market prediction model incorporating Technical Indicators, feature engineering, and prediction modules. A novel DWT-CSO component was introduced, combining Discrete Wavelet Transform for data decomposition and Chicken Swarm Optimization for optimal feature selection. Applied to Indian and US stock indices, the model improved prediction accuracy by up to 19.59% (S&P500), with statistical validation using the Wilcoxon rank-sum test.
Genetic Algorithms provide a powerful heuristic approach for solving stock market prediction problems. Their ability to adaptively optimize parameters and identify patterns in complex datasets makes them invaluable for enhancing predictive models. By integrating GAs with other techniques, researchers have achieved significant improvements in stock trading strategies and market forecasting accuracy.

5.2.2. Fuzzy Algorithms (FA)

Fuzzy algorithms leverage fuzzy logic, which aims to replicate human reasoning by accommodating the intermediate values between binary extremes (0 and 1). Unlike traditional methods, fuzzy logic employs flexible “if-then” rules using linguistic categories rather than fixed numerical thresholds, making it particularly useful in scenarios where uncertainty and ambiguity are prevalent. The Adaptive Neuro-Fuzzy Inference System is one of the most commonly used fuzzy algorithms, combining neural networks and fuzzy logic to learn and apply rules derived from data. This approach is widely applied in fields such as system control and prediction tasks, including stock market forecasting. In 2020, ref. [54] introduced a novel Fuzzy Twin Support Vector Machine to predict stock market trends using emotional data extracted from news articles. This model demonstrated robust performance in handling outliers and provided improved insights with higher confidence levels, showcasing its ability to process sentiment-laden data effectively. Fuzzy logic’s versatility has been widely adopted in stock market prediction. Studies such as [55] have used fuzzy logic to analyze sentiments from social media platforms for predictive purposes. Fuzzy algorithms are particularly valuable when combined with other techniques to form hybrid approaches. For example, ref. [56] proposed a hybrid model combining Artificial Bee Colony, SVM, and ANFIS. Using data from 50 U.S. companies (2008–2018) and incorporating 20 technical indicators, the model demonstrated superior forecasting accuracy and performance quality compared to standalone methods. Another innovative hybrid approach, proposed by [57], introduced a Fuzzy-Based Local Metric Learning model that integrates fuzzy clustering with Support Vector Machines. The hybrid FuzzyML-SVM model outperformed traditional SVM, illustrating the potential of combining fuzzy logic with machine learning techniques to enhance prediction accuracy. Fuzzy logic remains a powerful tool in stock market prediction due to its ability to handle uncertainties and mimic human decision-making. By combining it with other algorithms like SVM and ANFIS, researchers have demonstrated significant improvements in accuracy and robustness, making fuzzy algorithms an integral part of modern predictive models.
While each machine learning technique has its strengths, their effectiveness varies depending on factors such as data complexity, market volatility, and the prediction horizon. For example, SVM offers high accuracy for structured data but is computationally intensive and less interpretable. Naïve Bayes excels in sentiment analysis due to its simplicity but may struggle with feature dependencies. Regression models are useful for identifying trends but require careful feature selection. In contrast, Genetic and Fuzzy Algorithms handle uncertainty and non-linearity well, though they often demand high computational resources. These trade-offs highlight the need to select models based on specific prediction goals, data characteristics, and resource constraints.
Table 4. Summary of Machine Learning Techniques in Stock Market Prediction.
LevelTechniqueKey FeaturesNotable StudiesChallenges
SupervisedSupport Vector Machine (SVM)
-
Identifies optimal hyperplane for classification and regression tasks.
-
Kernel trick enables handling non-linear data.
-
Robust performance across domains.
-
Multi-level classifier combining SVM, RNN, and others improved accuracy by 10–12% [38].
-
PCA for dimensionality reduction combined with sentiment data to improve accuracy [39].
-
Used in hybrid models with statistical and technical indicators [41].
-
Limited accuracy in complex, multi-dimensional datasets without hybrid approaches.
-
Computationally intensive.
Naïve Bayes (NB)
-
Probabilistic classifier based on Bayes’ Theorem.
-
Assumes independence between features.
-
Fast and scalable for large datasets.
-
Applied for sentiment analysis across textual data from traditional and social media sources, uncovering sentiment’s impact on market trends [45].
-
Simplistic assumptions may not capture complex relationships between features.
-
Performance may degrade with sparse data.
Regression Algorithms (RA)
-
Analyzes relationships between dependent and independent variables.
-
Used for both linear and non-linear data.
-
Multiple regression with three variables achieved 89% accuracy, outperforming linear regression [48].
-
Hybrid models like SVR with windowing functions enhanced multi-day predictions [50].
-
Limited in capturing non-linear relationships without enhancements.
-
Accuracy depends on selecting relevant features.
UnsupervisedGenetic Algorithms (GA)
-
Optimizes parameters using principles of natural selection.
-
Generates adaptive trading rules.
-
Handles complex, non-linear data effectively.
-
Hybrid GA models combined with RNN improved prediction accuracy [51].
-
GA integrated with technical indicators increased S&P500 accuracy by 19.59% [53].
-
Requires significant computational resources.
-
Risk of converging to local optima in complex problems.
Fuzzy Algorithms (FA)
-
Leverages fuzzy logic to handle uncertainty and mimic human reasoning.
-
Uses linguistic rules instead of numerical thresholds.
-
Suitable for ambiguous data.
-
FTSVM model combined with sentiment data demonstrated robustness and improved confidence levels [54].
-
Hybrid models combining ANFIS, SVM, and fuzzy logic improved accuracy for predictive tasks [56].
-
Fuzzy logic models can become complex with increasing variables.
-
Highly dependent on rule-based configurations.

6. Deep Learning Techniques

Deep learning techniques, such as ANN, CNN, RNN, LSTM, and GRU, have significantly advanced stock market prediction by modeling complex relationships and capturing temporal dependencies. Hybrid models further enhance accuracy by combining multiple methods. A detailed overview of these techniques is provided in Table 5.

6.1. Artificial Neural Networks (ANN)

ANN are a cornerstone in stock market prediction due to their ability to model complex nonlinear relationships. These networks mimic the structure of the human brain, processing data through layers of interconnected neurons to uncover patterns and trends in financial datasets. In 2020, ref. [58] combined Random Forest and ANN to predict the next day’s stock closing price. Using financial data such as open, high, low, and close prices, they generated new variables to enhance prediction accuracy. The model demonstrated improved performance, showcasing the synergy between machine learning techniques and ANNs. In [59], the authors utilized ANNs to predict daily trends of the S&P 500 index. To optimize datasets, they incorporated dimensionality reduction techniques, including Fuzzy Robust PCA, Kernel-based PCA, and PCA. The study demonstrated that integrating ANNs with PCA enhanced prediction efficiency, with the choice of kernel function significantly influencing the performance of KPCA. Ref. [60] utilized Generalized Feed Forward and Multi-Layer Perceptron models to forecast the Istanbul Stock Exchange index. The study found that varying the number of hidden layers significantly impacted accuracy, with the optimal results obtained using a single hidden layer. Predictions were assessed using the coefficient of determination. In [61], the authors employed a Radial Basis Function neural network to forecast the Shanghai and NASDAQ indices. They improved feature selection by utilizing a refined version of Locality Preserving Projection, known as two-dimensional LPP, which substantially enhanced the model’s predictive accuracy for both indices. Ref. [62] proposed a hybrid model combining PCA with a Deep Neural Network for predicting Google stock prices. Compared to the Radial Basis Function Neural Network, their model demonstrated a 4.8% improvement in accuracy, emphasizing the advantage of integrating dimensionality reduction with deep learning techniques. Ref. [63] compared a Feed-forward Neural Network and a CNN for stock market prediction. While the ANN achieved 97.66% accuracy but required extensive training, the CNN utilized 2D histograms for time-series data, reaching 98.92% accuracy with less training time. Both models show potential for accurate stock market forecasting. Ref. [64] focused on predicting stock price movements using financial disclosures. Their model, trained on a corpus of 139 million words, demonstrated superior performance compared to traditional techniques, further showcasing the power of deep learning in financial analysis.
ANNs continue to play a vital role in stock market prediction, offering flexibility and precision in handling complex, nonlinear financial data. By integrating advanced preprocessing techniques and hybrid models, ANNs provide a robust framework for improving forecasting accuracy and market insight.

6.2. Vision-Inspired Neural Networks

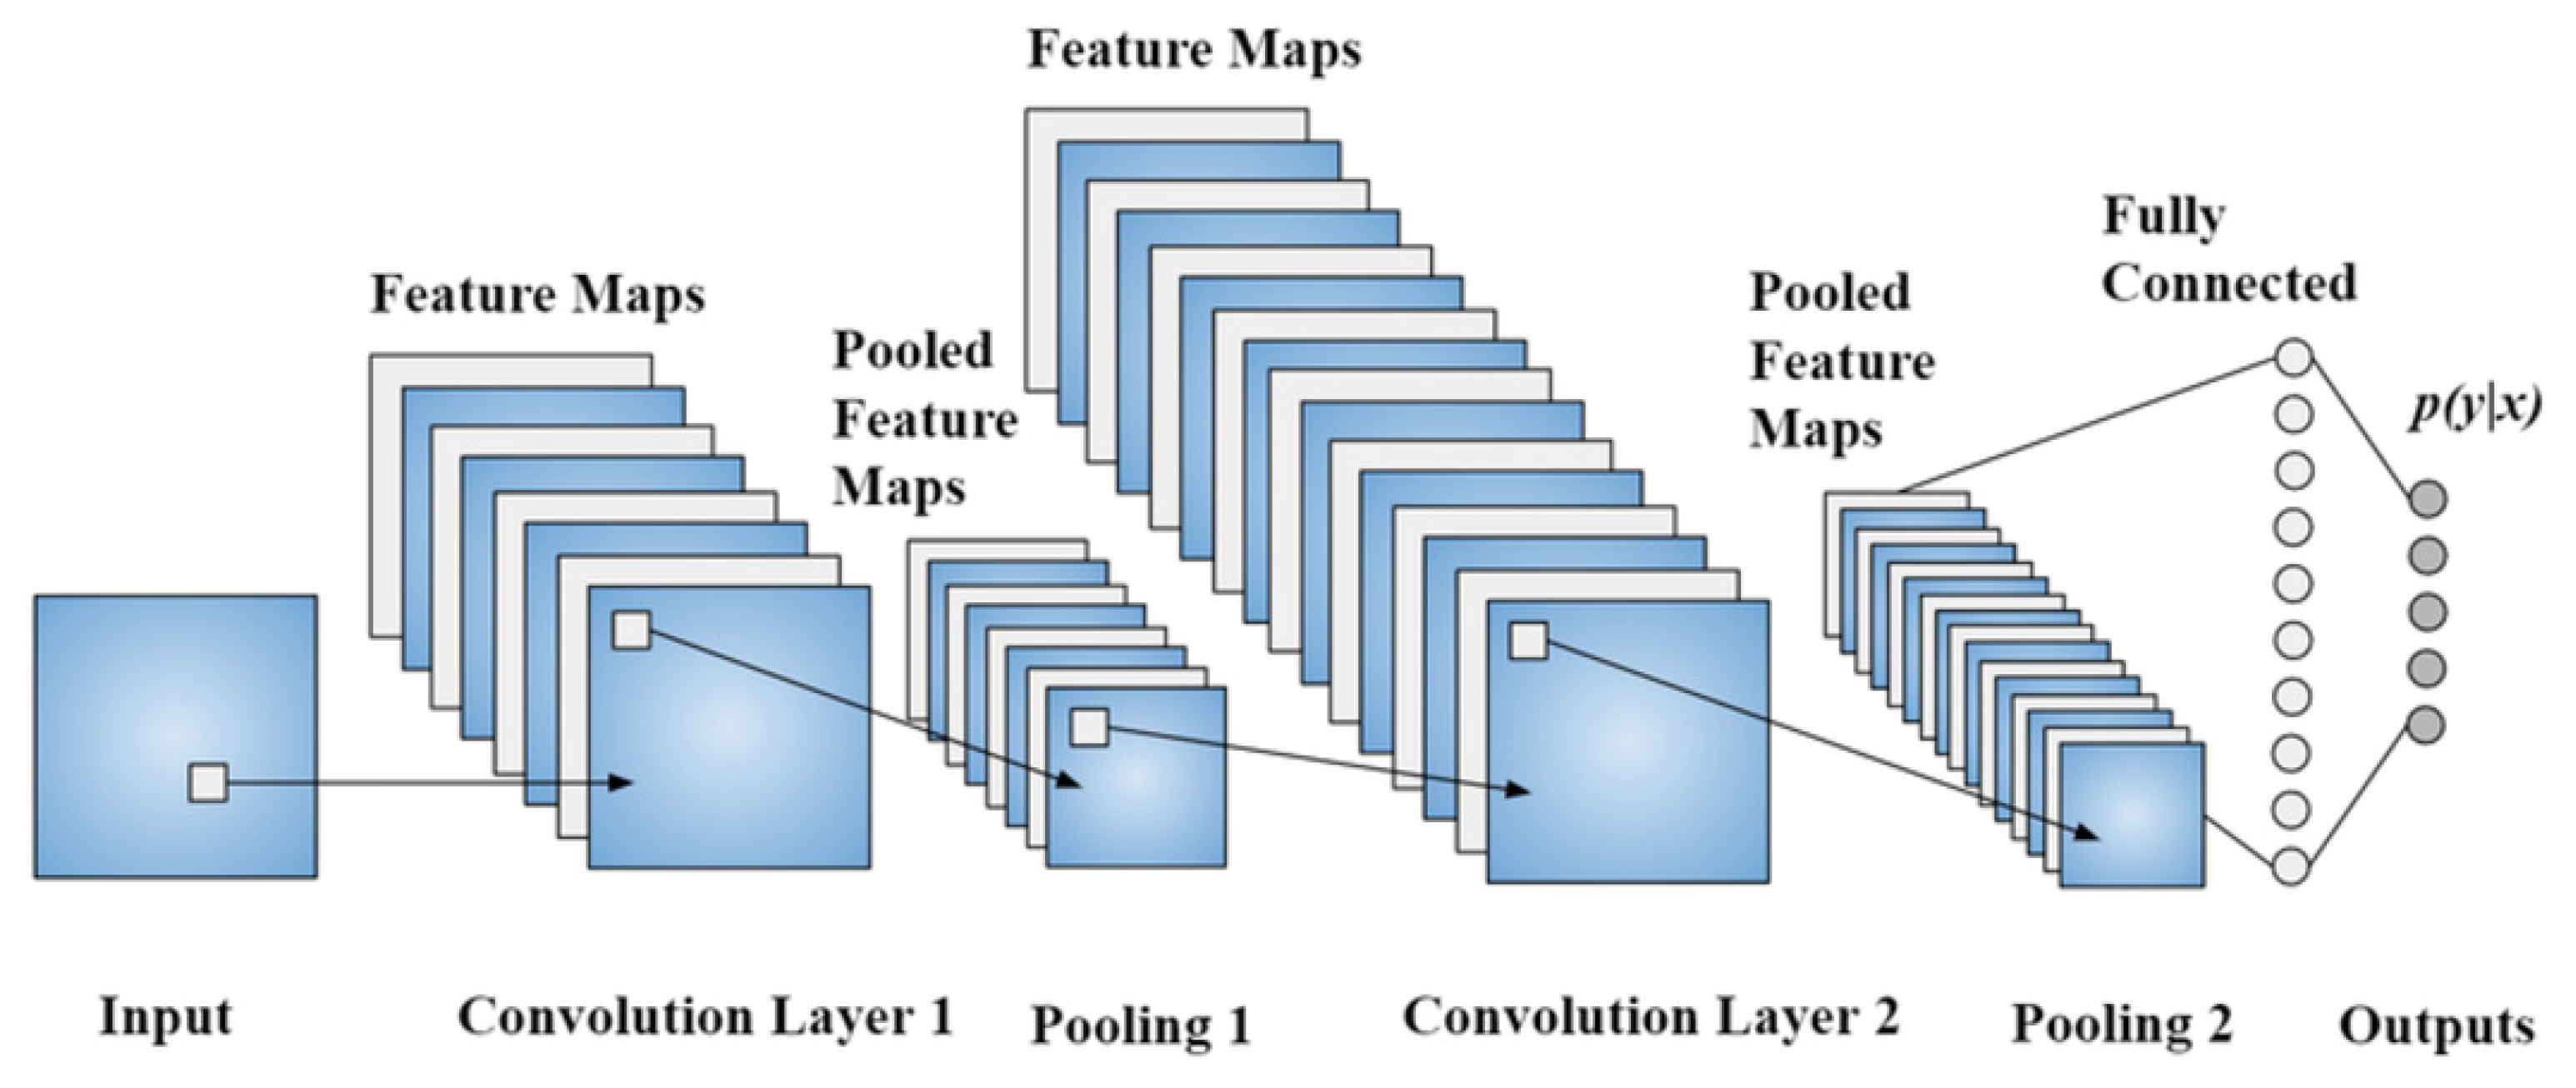
6.2.1. Convolutional Neural Networks (CNN)

DNNs offer the significant advantage of automatic feature selection, reducing the limitations associated with manual methods. Successful feature selection relies on understanding the target environment and the relevance of features, as these factors greatly impact the network’s performance. For specific data types, such as time-series or grid-like image data, convolutional neural networks are designed to enhance feature extraction, providing optimized results. A typical CNN architecture is shown in Figure 2. Ref. [65] designed a hybrid deep learning framework combining CNN and bidirectional LSTM units. The model outperformed traditional algorithms, achieving a 9% improvement over a single-pipeline deep learning model and demonstrating significantly better results compared to an SVM regressor when tested on the S&P 500 dataset. A generalized CNN structure typically consists of an input layer, multiple hidden layers (such as convolutional, pooling, and fully connected layers), and an output layer. As illustrated by [66], CNN neurons are organized in three dimensions: width, height, and depth. The core mathematical operation, convolution, combines the input and kernel to create a feature map, making CNNs highly effective for capturing complex patterns in non-linear stock market data. The three primary characteristics of CNNs—sparse interactions, parameter sharing, and equivariant representations—enhance their performance in tasks like stock price prediction. Their ability to automatically identify relevant features from vast, complex datasets has led to the development of various CNN-based models tailored for financial market forecasting. Ref. [67] proposed two advanced CNN architectures: 2D-CNN and 3D-CNN. By leveraging 82 technical indicators, these models achieved a 3–11% improvement in predictive accuracy over baseline algorithms. Their approach highlighted the potential of multi-dimensional CNN structures in processing extensive financial data for improved forecasting. In 2021, ref. [68] introduced a hybrid framework named IKN-ConvLSTM, which combined CNN and LSTM architectures. The feature selection process involved CNNs and a random search algorithm, while a stacked LSTM was utilized for prediction. The proposed model achieved an impressive accuracy of 98.31%, showcasing its effectiveness in stock price prediction. Ref. [69] introduced a convolutional neural network model that combined stock price data with sentiment analysis as input. The model was benchmarked against traditional methods like linear regression and support vector machines (SVMs). Their findings indicated that while global significant events do not consistently influence stock market predictions, localized events may significantly impact algorithmic performance in forecasting stock trends. Limit order data, a critical aspect of financial markets, was also analyzed using CNNs. Ref. [70] utilized this data to predict mid-price movements of future stocks, demonstrating CNN’s suitability for handling complex financial metrics like limit orders. Ref. [71] developed an innovative approach by integrating graph theory with CNN to capture spatiotemporal relationships between stocks. This model represented the stock market as a complex network, utilizing stock indicators and financial news as inputs. The proposed method demonstrated the effectiveness of modeling stock interactions to enhance prediction capabilities. Ref. [72] further enhanced CNN’s application by proposing the DeepLOB model. This model combined an inception module, a standard convolutional layer, and an LSTM layer to analyze the historical data of limit order books (LOBs) along with price and volume features. By employing max-pooling layers, leaky ReLU activation, and temporal dependencies captured by LSTM units, the model dynamically predicted short-term price movements across multiple time scales. The refined architecture, termed DeepLOB5, utilized data from five levels on each side of the LOBs, resulting in improved performance in forecasting short-term price changes. Ref. [73]. introduced a unique Wavelet Denoised-ResNet CNN model for Forex exchange rate prediction. The approach began by transforming technical indicators into image matrices, which were then denoised using the wavelet method. The processed data was fed into a ResNet CNN, and LightGBM replaced the traditional softmax layer for prediction output. This innovative technique demonstrated promising accuracy, showcasing the adaptability of CNNs in financial forecasting.
These applications demonstrate the adaptability and power of CNNs in tackling the complexities of stock market prediction, offering robust tools for extracting meaningful insights from highly dynamic and intricate datasets.

6.2.2. Deep Q-Network (DQN)

RL aims to build software agents capable of maximizing cumulative rewards by taking optimal actions. Q-learning, a model-free RL algorithm, achieves this by learning a policy that guides the agent to take appropriate actions under given circumstances. The agent iteratively updates its action-value estimates using stochastic transitions and rewards. However, when dealing with non-linear function approximators, such approaches can become unstable or even diverge. To address this, DQN integrate CNNs with Q-learning, enabling the handling of high-dimensional and complex data while mitigating instability issues caused by non-linearities. DQN has shown promising results in stock market predictions. In a study by [74], DQN was combined with CNNs, using stock chart images as states. The CNN mapped these states to actions, producing decisions based on input matrices representing W days of stock data. Rewards were calculated for the actions taken, and techniques like experience replay and parameter freezing were employed to address instability by reducing correlations and temporarily freezing target parameters during training. The method demonstrated profitability by generating portfolios with positive percentage returns, proving its effectiveness in predicting global stock market trends. Ref. [75] expanded on these ideas by developing an ensemble of reinforcement learning techniques aimed at improving the return function of stock prices over time. Their approach involved training Q-learning agents repeatedly with the same dataset to enhance prediction accuracy. Evaluations in intraday trading scenarios showed that this method outperformed the conventional Buy-and-Hold strategy, offering a more dynamic approach to stock trading. Ref. [76] proposed another advancement in the form of a deep reinforcement learning model for training an intelligent automated trader. The model incorporated both historical stock prices and market sentiment data for training, demonstrating its applicability to Dow Jones companies. The evaluation results highlighted its robustness and superior performance compared to baseline models, solidifying its utility for stock market predictions.
These applications underscore the potential of DQN and reinforcement learning frameworks in addressing the complexities of stock market forecasting. By effectively combining RL principles with deep learning architectures, these models provide scalable and adaptable solutions for financial market analysis.

6.3. Sequential Data Modeling Networks

6.3.1. Recurrent Neural Networks (RNN)

RNNs have become highly regarded for their ability to process temporal data and recognize time-series patterns, making them a preferred method for stock market forecasting. One notable model is the dual-stage attention-based RNN proposed by [77]. This model uses an encoder-decoder architecture enhanced with input and temporal attention mechanisms, which prioritize relevant driving series and encoder hidden states to boost prediction accuracy. The training process incorporates mini-batch stochastic gradient descent and the ADAM optimizer, showcasing the model’s efficiency in forecasting stock market trends. Ref. [78] proposed an ARNN model for stock market prediction. The model employed wavelet-denoised input data and combined ARNN predictions with forecasts generated by the ARIMA method. This fusion of models demonstrated the potential to improve prediction performance by integrating attention mechanisms with statistical forecasting techniques.
Drawing inspiration from the discrete Fourier transform, ref. [79] introduced the state-frequency memory RNN, designed to address both short- and long-term forecasting needs. In this model, the states correspond to distinct trading patterns, with prediction frequencies adjusted accordingly—short-term forecasts are driven by high-frequency patterns, while long-term predictions rely on low-frequency trends. By incorporating frequency domain analysis into the RNN architecture, this approach enhances the model’s flexibility and effectiveness across different prediction horizons. Ref. [80] proposed a multi-task recurrent neural network model combined with Markov Random Fields. This approach utilized a multi-layer perceptron to automatically extract diverse and complementary features from stock price sequences, eliminating the need for traditional technical indicators. These extracted features were then integrated with a binary MRF, leveraging a weighted linear envelope energy function to maintain higher-order consistency between stocks. The core advantage of RNNs lies in their ability to incorporate internal memory, allowing them to process sequential data effectively. These architectures can model temporal dependencies using a directed graph representation, supporting either finite impulse (cyclic) or infinite impulse (acyclic) behaviors. Enhancements such as LSTM networks and GRU provide controlled memory mechanisms, making them more robust for handling long-term dependencies. Variations of RNNs include fully recurrent networks, Elman networks [81], Jordan networks [82], and Echo State Networks [83]. Ref. [84] demonstrated an example of RNN application by using Echo State Networks to predict S&P 500 stock prices. The model utilized features such as price, moving averages, and trading volume. It outperformed the Kalman Filter, achieving an impressively low test error of 0.0027. Additional validation across 50 other stocks further highlighted its robustness compared to other state-of-the-art methods. Ref. [85] developed the RNN-Boost model, which incorporated technical indicators, sentiment analysis features, and Latent Dirichlet Allocation features for stock price prediction. This ensemble model outperformed the single RNN framework, highlighting the advantages of combining diverse data inputs to enhance prediction accuracy. Ref. [86] investigated the performance of three RNN variants—basic RNN, LSTM, and GRU—using Google stock price data. Their findings showed that LSTM achieved the highest accuracy (72%) for a five-day prediction horizon, offering valuable insights into the inner workings of RNN architectures. Ref. [87] introduced a hybrid CRNN model designed for predicting the prices of nine Forex currency pairs. The evaluation revealed that the CRNN significantly outperformed standalone CNN and LSTM models, demonstrating its effectiveness in capturing sequential and spatial patterns for Forex forecasting.
These studies illustrate the versatility and effectiveness of RNN-based models in capturing the complexities of stock market data, making them a cornerstone in modern predictive analytics.

6.3.2. Long Short-Term Memory (LSTM)

LSTM networks, a specialized type of recurrent neural network, have been widely utilized for stock market prediction due to their ability to capture temporal dependencies and long-term patterns. In 2021, ref. [88] integrated the Kalman filter with LSTM for stock market forecasting. Data from Yahoo Finance and Twitter was preprocessed to reduce errors using the Kalman filter. The Adaptive Gradient LSTM model showed significant improvement in prediction accuracy when combined with this filtering technique. Ref. [89] compared LSTM and SVM models for analyzing stocks with different levels of volatility. Their LSTM model consisted of a single input layer, two LSTM layers with sigmoid activation functions, dropout layers for regularization, and a dense output layer utilizing a softmax function. The study found that LSTM outperformed SVM with a radial basis function kernel, particularly for low-volatility stocks. Ref. [90] developed an improved attention-based LSTM model called MI-LSTM, which excelled in filtering noise and extracting key information from input data. By assigning dynamic weights to different input sequences, the model maintained the relevance of dominant features while effectively utilizing auxiliary information. The MI-LSTM outperformed traditional LSTM models in terms of accuracy and robustness. In another approach, ref. [91] utilized natural language processing techniques to conceptualize stock vectors. They proposed an Embedded LSTM model with an embedded layer that transformed high-dimensional data into low-dimensional representations. A three-layer LSTM architecture then extracted features to predict stock values. Backpropagation was used to update the parameters, resulting in improved prediction accuracy. Ref. [92] applied LSTM networks to forecast stock prices for major technology companies (AAPL, GOOG, MSFT, and AMZN) using historical data from Yahoo Finance. The LSTM model, featuring two LSTM layers and dense layers, was trained with the Adam optimizer and evaluated using RMSE. Results highlight the capability of LSTM models to capture complex stock price patterns and deliver accurate predictions. Ref. [93] proposed an attention-enhanced LSTM model that improved the standard LSTM’s ability to predict stock movements. The study found that finance-related tweets posted during non-market hours (from market closure to the next day’s market open) had higher predictive power. Furthermore, using weighted sentiment data from StockTwits, particularly from influential users, significantly boosted the model’s performance. Ref. [94] used tree-based models and neural networks (ANN, RNN, and LSTM) to forecast the values of four stock market groups as a regression problem. Among these, LSTM achieved the best performance with the lowest error rates (MAPE: 0.60–1.52), though it required significant runtime. Both tree-based and deep learning models demonstrated strong potential, with future work suggested on other stock markets or hyperparameter tuning. Ref. [95] introduced the cross-reference exchange-based stock trend prediction method, which utilized the listing of a company on multiple exchanges. By examining discrepancies in stock opening prices between exchanges within the same country, they successfully predicted one-day-ahead stock prices. This approach was later expanded to international exchanges through iCREST [96], incorporating currency conversion to analyze historical stock data. Using LSTM, iCREST demonstrated effective one-day-ahead trend prediction. For both intraday and interday stock predictions, ref. [97] proposed an RNN-based model utilizing character-level sequence modeling. Their design, which incorporated leaky ReLU activation and LSTM layers, achieved performance comparable to other established models. Similarly, ref. [98] applied an LSTM model to predict the high and low prices of soybean futures. They emphasized that the reduced noise in futures derivatives facilitated the development of more effective trading strategies, achieving high trend prediction accuracy. Ref. [99] introduced an LSTM model that incorporated external financial indicators, such as crude oil prices, gold prices, and moving averages, as inputs. The inclusion of these variables improved the model’s prediction accuracy compared to both a standalone LSTM and an SVM model. The study also underscored the influence of commodity prices on stock market trends. Ref. [100] developed a prototype trading platform that combined Deep Neural Networks (DNNs) with LSTM to predict futures market movements. The model incorporated data from four futures in the energy and metal sectors, utilizing both bar and tick data from Interactive Brokers. Backtesting and paper trading evaluations revealed performance improvements in the platform’s predictions. Ref. [101] evaluated the performance of a LSTM model for predicting closing prices of iShares MSCI United Kingdom. The study compared LSTM with other models, including ANN, SVR, and RF. The results demonstrated that LSTM outperformed all the benchmark models, highlighting its superior ability to capture temporal dependencies in stock price prediction. Ref. [102] explored the effectiveness of various activation functions and optimization algorithms for LSTM in stock market prediction. Their findings revealed that the combination of the tanh activation function and the Adam optimizer yielded the highest accuracy, reaching 98.49%. This result highlights the importance of fine-tuning hyperparameters in enhancing predictive performance.
These studies highlight the adaptability and effectiveness of LSTM-based approaches in addressing the complexities of stock market prediction. By capturing both short-term fluctuations and long-term trends, LSTM models continue to offer robust solutions for forecasting financial data.

6.3.3. Gated Recurrent Unit (GRU)

Gated Recurrent Units (GRUs), a variant of RNNs, have shown promising results in stock market prediction due to their ability to capture dependencies in sequential data while simplifying the computational complexity compared to LSTMs. One notable approach, GRU-2ATT, introduced enhancements to GRU models by leveraging attention mechanisms to improve prediction performance. Building on this, ref. [103] proposed a bidirectional GRU model for predicting stock price movements using a combination of online financial news and historical stock data. The influence of financial news and public sentiment has also been explored to enhance stock market forecasting. News articles often report on significant events, and the public’s reactions to these articles can reflect broader market sentiments. Ref. [104] analyzed the moods conveyed in posts from 100 verified accounts to ensure authenticity and assessed the overall impact of daily news on the stock market. Their proposed two-layer RNN-GRU model outperformed traditional methods like linear regression and support vector regression by achieving smaller prediction errors.
These findings underscore the effectiveness of GRU-based models in processing both financial news and historical stock data, capturing intricate patterns and sentiments that influence stock price movements. By integrating techniques such as bidirectional processing and sentiment analysis, GRU-based methods continue to advance the accuracy and reliability of stock market predictions.

6.3.4. Echo State Networks (ESN)

ESNs, a type of RNN, have been explored for stock market prediction due to their efficiency in processing temporal data. Unlike traditional RNNs, ESNs rely on a fixed, sparsely connected reservoir of neurons, which reduces computational complexity. Researchers have combined ESNs with various techniques to enhance prediction accuracy and address challenges like overfitting and high-dimensional data. Ref. [105] studied trading rules derived from technical analysis, which often depend on individual experience. Using GA, they optimized trading rules and combined them with ESNs for further refinement. Experiments demonstrated that this approach significantly improved average profits in both bull and bear markets compared to the Buy and Hold strategy. Ref. [106] tackled the challenge of high dimensionality in Echo State Network training by introducing phase space reconstruction combined with an autocorrelation function to generate inter-irrelevant model samples. They employed principal component analysis for dimensionality reduction before training the ESN. This method enabled the model to effectively identify and analyze stock price trends, focusing on aspects such as strength, direction, momentum, and duration. The approach demonstrated enhanced training efficiency and improved predictive performance. Ref. [107] proposed a Multiobjective Diversified ESN to enhance generalization and minimize overfitting. The key innovation was introducing a diversity metric that encouraged neurons to encode distinct information. Genetic Algorithms were employed to optimize the network’s diversity and prediction accuracy. Experimental results showed that MODESN achieved superior performance in terms of both diversity and predictive precision.
These studies highlight the adaptability of ESNs for stock market prediction. By integrating advanced techniques like phase space reconstruction, PCA, and diversity metrics, ESN-based models have demonstrated their potential to overcome challenges in high-dimensional data and achieve reliable predictions in dynamic financial markets.

6.4. Hybrid Approaches

Hybrid Neural Networks

Hybrid stock prediction models combine the strengths of different architectures to address the limitations of standalone methods, resulting in enhanced accuracy and performance. These models often integrate diverse techniques like RNN variants, wavelet transformations, or optimization algorithms to improve stock market forecasting. Ref. [108] developed a hybrid model using data from the Colombo Stock Exchange for three selected companies. The model used close, high, and low price data from the previous two days to predict the next day’s closing price. They compared several architectures, including LSTM, GRU, feed-forward MLP, and SRNN, with six input neurons and varying numbers of hidden neurons. Performance was assessed using metrics such as MAD and MAPE, identifying the most effective architecture for each company. Ref. [109] introduced a hybrid RNN approach that employed Haar wavelet transformations to preprocess time-series data by reducing noise. The denoised data was then used to generate input features for the RNN, enhancing the accuracy of stock market predictions. In another study, ref. [110] optimized RNN weights and biases using the Artificial Bee Colony algorithm. The ABC algorithm’s efficiency in finding optimal solutions with moderate computational resources made it a suitable choice for improving RNN performance [111]. This study [112] introduced a stacking ensemble approach for stock market prediction, combining news headlines, multivariate time-series data, and multiple base models. By integrating diverse data sources and predictors, the model outperformed traditional baselines in next-day trend prediction. Portfolio analysis further demonstrated its potential for achieving gains and preserving capital in trading decisions.
These hybrid models demonstrate the potential of integrating complementary techniques to enhance stock prediction accuracy. By leveraging the strengths of various architectures and preprocessing methods, hybrid approaches provide robust solutions for tackling the complexities of financial market forecasting.

6.5. Other Deep Neural Networks

DNNs comprise input and output layers with multiple hidden layers in between, enabling them to learn both linear and non-linear data relationships. Given the complexity of stock market data, DNNs have demonstrated their effectiveness in uncovering patterns and predicting trends. Variants of DNNs, such as CNNs and RNNs, have shown exceptional results in individual stock forecasting tasks. Challenges like overfitting and high computational costs associated with DNNs can often be addressed through parameter tuning and optimization techniques. A generalized DNN structure typically consists of an input layer, several dense hidden layers, and an output layer. Ref. [113] examined the impact of unsupervised feature extraction methods, including principal component analysis, auto-encoders, and restricted Boltzmann machines, on DNN performance. Results indicated that DNNs could effectively extract meaningful insights from auto-regressive residuals, thereby enhancing market behavior predictions. However, applying auto-regression directly to the network’s residuals yielded less significant improvements. Ref. [114] explored seven trading strategies for classifying stock fluctuations. The study utilized a deep feed-forward neural network with a sliding window approach to predict rises or falls in the Shanghai Composite Index, providing insights into effective strategies for fluctuation classification. Ref. [115] developed a deep factor model alongside a shallow model, both based on DNN architectures. The deep factor model demonstrated the nonlinear nature of relationships between stock returns and influencing factors, outperforming linear models and other machine learning approaches such as SVR and RF. While the shallow model showed higher prediction accuracy, the deep model proved to be more profitable, highlighting the trade-offs between accuracy and profitability. Ref. [116] This study introduced a hybrid prediction model combining unsupervised learning and reinforcement learning to address stock market complexity. Using the Growing Neural Gas algorithm, it captures stock trends and constructs market states, while a redesigned reward function provides timely trading feedback. The Triple Q-learning agent executes trading actions and improves predictions, outperforming comparative models in experiments on stock datasets. Ref. [117] proposed a DNN model that utilized the Boruta feature selection method to identify the most relevant technical indicators for stock market prediction. By addressing the challenge of selecting appropriate features, the model achieved superior performance compared to ANN and SVM models, underscoring the effectiveness of feature selection in enhancing predictive capabilities. DNNs also facilitate the identification of influential factors that affect stock market dynamics, such as news, events, or circumstances that drive market movements. Incorporating these aspects into predictive models enhances their accuracy. Ref. [118] proposed a tensor-based predictive model that integrated event-specific news articles, financial discussion forums, and firm-specific datasets. This framework was designed to analyze motives and sentiments associated with influential factors, offering a structured approach for stock movement prediction. Ref. [119] introduced a DNN model equipped with 715 novel input features derived from technical analysis. To enhance prediction accuracy, a plunge filtering technique was employed to group stocks with similar characteristics. This approach not only improved the model’s training process but also demonstrated high profitability, emphasizing its potential for financial applications. Ref. [120] compared deep neural networks with shallow neural networks and other machine learning models, finding that DNNs consistently outperformed their shallower counterparts. The study reinforced the notion that deeper architectures can capture complex patterns in financial data, making them a valuable tool for stock market forecasting.
These studies illustrate the versatility of DNNs in handling complex stock market data. By leveraging advanced architectures and incorporating diverse datasets, DNNs continue to provide robust solutions for understanding and predicting financial market trends.

6.5.1. Restricted Boltzmann Machine (RBM)

RBMs are probabilistic generative models that rely on stochastic processes. They are trained to maximize the product of probabilities for the given dataset, making them effective for feature generation in predictive tasks. Ref. [121] applied RBMs to stock trend prediction by generating features from financial data. The authors collected data from Yahoo Finance, comprising two aggregate stock indices and one individual stock index, alongside eleven technical indicators. These indicators were converted into binary values to be used as input for the Restricted Boltzmann Machine. The model was trained using k-step Contrastive Divergence, a commonly employed technique for optimizing RBMs. To evaluate the predictive capability of the generated features, the study employed three classifiers: SVM with a RBF kernel, RF, and Logistic Regression. Comparative results demonstrated that the Bernoulli RBM achieved higher directional accuracy in predicting stock trends, highlighting its effectiveness in capturing meaningful features from financial data. Ref. [122] proposed Stock-GAN, a GAN-based architecture combining CNNs and LSTM for stock market prediction, enhanced with Bayesian optimization and reinforcement learning to address hyperparameter challenges. A new hybrid model, MMGAN-HPA, was developed by merging MM-HPA and GAN-HPA, achieving superior performance over its parent models in stock price prediction.
This approach underscores the utility of RBMs in stock market prediction by leveraging their probabilistic and feature extraction capabilities, particularly when combined with robust classifiers. The study contributes to improving accuracy in forecasting stock trends, making RBMs a valuable tool in financial analytics.

6.5.2. Deep Belief Network (DBN)

DBNs are constructed by stacking multiple Restricted Boltzmann Machines, where the output of one RBM serves as the input for the next. This layered structure allows DBNs to extract hierarchical features from data, making them well-suited for stock market prediction. Ref. [123] demonstrated the use of DBNs by combining two RBMs to extract features from 20 technical indicators. The bottom RBM generated outputs that were passed to the top RBM for further feature extraction. The extracted features were then used to predict the next day’s closing price with a SVM. This approach showed promise in utilizing DBNs for financial forecasting. Ref. [124] introduced a CDBN integrated with fuzzy granulation for financial applications. The model was evaluated using Euro/US Dollar and British Pound/US Dollar exchange rate datasets. By incorporating the stop-loss concept—a widely used financial strategy to minimize potential losses—the model effectively predicted fluctuation ranges. This fusion of CDBN and FG demonstrated improved profitability in forecasting strategies. In a subsequent study, ref. [125] introduced another CDBN-based approach for exchange rate prediction, incorporating a conjugate gradient optimization method. The model was evaluated on datasets for Indian Rupee/US Dollar, Brazilian Real/US Dollar, and British Pound/US Dollar exchange rates. Compared to traditional feed-forward neural networks, the CDBN method demonstrated superior performance in forecasting exchange rate fluctuations. Ref. [126] presented a sentiment-based stock prediction framework combining stock data and news sentiment analysis. Technical indicators like MACD and RSI were extracted from stock data, while news sentiments were processed through keyword extraction, holoentropy-based feature extraction, and classification using a deep neural network trained with a self-improved whale optimization algorithm. An optimized Deep Belief Network, fine-tuned with SIWOA, integrated stock and sentiment features for final predictions, enhancing accuracy.
These studies highlight the potential of DBNs in financial forecasting tasks. By leveraging the hierarchical feature extraction capabilities of stacked RBMs and integrating advanced techniques like fuzzy granulation and optimization methods, DBNs provide a robust framework for predicting complex financial trends.
While deep learning techniques such as ANN, CNN, RNN, LSTM, and GRU have shown strong predictive performance, each model comes with trade-offs. For example, LSTM models excel at capturing long-term dependencies but often require more training time and computational power than GRU, which is faster but may be less effective on longer sequences. CNNs perform well in extracting features from structured inputs like 2D financial matrices but need to be combined with sequential models to capture temporal patterns. Echo State Networks offer faster training but are sensitive to reservoir configuration. These differences highlight the importance of selecting models based on prediction goals, data types, and computational constraints.
Table 5. Summary of Deep Learning Techniques in Stock Market Prediction.
TechniqueKey FeaturesNotable StudiesChallenges
Artificial Neural Networks (ANN)
-
Models complex nonlinear relationships.
-
Processes data through interconnected neurons to identify patterns.
-
Flexible and widely applicable.
-
Combined with Random Forest for next-day closing price prediction, showing improved accuracy [58].
-
Integrated with PCA and kernel-based methods for efficient trend prediction [59].
-
Generalized Feed Forward and MLP models optimized for hidden layers [60].
-
Requires careful tuning of hyperparameters.
-
Computationally intensive for large datasets.
Convolutional Neural Networks (CNN)
-
Effective for time-series and grid-like data.
-
Captures complex patterns through sparse interactions and parameter sharing.
-
Automates feature selection.
-
Developed 2D-CNN and 3D-CNN models with multi-dimensional data, improving accuracy by 3–11% [67].
-
Hybrid CNN-LSTM models achieved 98.31% accuracy in stock price prediction [68].
-
Integrated graph theory for spatiotemporal relationships [71].
-
Sensitive to data preprocessing.
-
Limited in handling temporal dependencies without integration with RNNs.
Recurrent Neural Networks (RNN)
-
Processes sequential data effectively.
-
Models short- and long-term dependencies.
-
Enhanced with LSTM and GRU for robust memory mechanisms.
-
Dual-stage attention-based RNN improved accuracy for stock trends [77].
-
SFM-RNN utilized frequency domain analysis for short- and long-term forecasts [79].
-
Multi-task RNN combined with MRF for complementary feature extraction [80].
-
Prone to vanishing gradients in basic forms.
-
High computational demand for long sequences.
Long Short-Term Memory (LSTM)
-
Specialized RNN for capturing long-term dependencies.
-
Effective in reducing vanishing gradient issues.
-
Highly accurate for time-series data.
-
Integrated with Kalman filters for improved stock prediction accuracy [88].
-
Applied to major tech stocks, achieving strong predictive performance [92].
-
Enhanced with attention mechanisms to prioritize key features [93].
-
Computationally intensive with longer training times.
-
Requires significant tuning for optimal performance.
Gated Recurrent Unit (GRU)
-
Simplified RNN variant.
-
Captures temporal patterns with fewer parameters compared to LSTM.
-
Faster training and efficient memory utilization.
-
Bidirectional GRU (BGRU) models effectively combined financial news and historical data [103].
-
Integrated sentiment analysis for improved predictions [104].
-
Less robust for capturing long-term dependencies compared to LSTM.
-
Performance dependent on input features.
Echo State Networks (ESN)
-
RNN variant with fixed, sparsely connected reservoirs.
-
Reduces computational complexity.
-
Suitable for temporal data.
-
Combined with Genetic Algorithms for trading rules, improving profits [105].
-
Enhanced with phase space reconstruction and PCA for trend analysis [106].
-
Sensitive to reservoir size and connectivity.
-
May struggle with non-stationary data.
Hybrid Neural Networks
-
Combines strengths of different architectures for improved performance.
-
Leverages diverse preprocessing and optimization techniques.
-
Addresses standalone model limitations.
-
Haar wavelet transformations preprocessed data for denoised RNN input [109].
-
Optimized RNNs using Artificial Bee Colony algorithms for better prediction accuracy [111].
-
Stacking ensemble models integrated news headlines and time-series data for robust predictions [112].
-
Increased complexity and computational requirements.
-
Requires expertise in combining and tuning multiple models.
Deep Neural Networks (DNN)
-
Handles linear and nonlinear data relationships.
-
Uses multiple hidden layers for hierarchical learning.
-
Effective in processing complex datasets.
-
Deep factor models outperformed traditional linear models for stock return predictions [115].
-
Boruta feature selection improved prediction with technical indicators [117].
-
Integrated tensor-based event analysis for motive-specific predictions [118].
-
Prone to overfitting without proper regularization.
-
Requires substantial computational resources.

7. Datasets

Stock Market Prediction systems rely on different types of data as inputs, which can significantly influence their prediction capabilities. Traditionally, most studies have utilized financial market data, while recent research has also incorporated textual data from online sources. In this section, studies are categorized based on the type of data used for predictions. A comparative summary of data sources, input types, and prediction durations is presented in Table 6.

7.1. Financial Market Data

Market data refers to historical numerical records, such as stock prices and indices, extensively analyzed by traders and researchers to understand market trends. Freely available on various platforms, these datasets are integral to predictive modeling in two primary domains. The first is index forecasting, which predicts major indices like the Nifty [127], NASDAQ [128], Dow Jones Industrial Average (DJIA) [129], DAX [130], and S&P 500 [131], often examining multiple indices together. The second is stock-specific forecasting, focusing on individual companies like Google or Apple or groups of stocks. These studies span diverse timeframes, including intraday, daily, weekly, and monthly, often employing categorical predictions, such as identifying trends as positive or negative [132]. Several datasets contribute significantly to stock market prediction research, each offering distinct advantages depending on the focus of analysis. For structured market data, the Columbia Stock Market dataset integrates market data with technical indicators, enabling diverse prediction durations and improving forecasting accuracy [133]. Similarly, the Taiwan Stock Exchange CWI dataset supports high-frequency trading, catering to rapid and precise forecasting needs [134]. Other datasets, such as those from BSE and Tech Mahindra, focus on daily and weekly prediction durations, providing flexibility for analyzing market fluctuations [5]. The DAX 30 dataset enriches intraday predictions by including RSS market feeds, broker house newsletters, and stock exchange data, offering valuable insights for short-term forecasting [130]. Additionally, the BSE and NSE stocks dataset merges market data with technical indicators and Twitter data, facilitating intraday analysis of stock movements. Technical indicators are vital in stock market prediction as they distill complex time-series data into interpretable patterns. These indicators are grouped into categories such as trend-based measures like moving averages, momentum tools such as the Relative Strength Index, volatility metrics like Bollinger Bands, and volume-based indicators such as On-Balance Volume. Studies consistently show that combining multiple indicators enhances predictive performance. Macroeconomic variables are equally significant, offering insights into broader economic conditions. Indicators such as Gross Domestic Product and Consumer Price Index are particularly impactful, as they often align with stock market trends. For example, a GDP increase may indicate market strength, while a falling CPI suggests reduced inflation, reinforcing market patterns. Fundamental data, encompassing quarterly metrics like assets and liabilities, sheds light on a company’s financial standing. However, challenges such as irregular updates and inconsistent reporting schedules hinder its application in deep learning models, as they can unintentionally introduce future information into predictions. Analytics data, comprising insights and evaluations from investment banks and research firms, provides a nuanced understanding of company strategies and competitive positioning. However, its high cost and limited availability restrict its broader application in SMP models. The diversity of these datasets underscores the vast array of information sources available for financial forecasting. Integrating multiple data types allows researchers to tackle the complexities of the dynamic stock market, improving prediction accuracy and model reliability.

7.2. Unstructured Data Sources

Unstructured data, particularly textual information, offers valuable insights into how sentiments shape stock market movements. Public sentiment, often expressed in text, has a proven influence on market dynamics, but transforming this data into numerical formats suitable for predictive models poses significant challenges. Additionally, the wide range of sources and varying formats complicate data extraction and processing. Unstructured text data also plays a critical role in stock market predictions. The Enron Corpus provides sentiment-rich textual data, allowing researchers to model sentiment trends and their market impacts [135]. Corporate announcements, such as those from DGAP and Euro-Adhoc, offer real-time insights into market movements, with daily predictions proving particularly useful for event-driven analyses [136]. Broader datasets, including those from KSE, LSE, Nasdaq, and NYSE, leverage information from Twitter, Yahoo Finance, and Wikipedia to analyze weekly trends and sector-wide impacts [15]. Meanwhile, financial news datasets like Google Finance Noodle and Reuters are utilized for intraday predictions, focusing on short-term sentiment and trend analysis [44]. These unstructured datasets expand the scope of stock market forecasting by incorporating nuanced sentiment and event-driven dynamics, complementing the insights provided by structured market data. Textual data in stock market prediction often comes from platforms like Twitter, message boards [137], financial news sites such as Bloomberg [138], Reuters [139], and Yahoo Finance [140], as well as general news outlets [141]. While social media sources are rich in volume, they require advanced processing due to non-standard language, abbreviations, and emoticons. In contrast, financial news platforms offer higher data quality with reduced noise. Studies have analyzed datasets from millions of tweets [142] to hundreds of thousands [143], highlighting the computational intensity involved. Sentiment analysis typically classifies emotions as positive or negative [129], with some research focusing on nuanced mood variations [144]. Relational data, such as knowledge graphs, adds another layer of unstructured data analysis. By mapping relationships between entities like companies and industries, these graphs help identify sector-wide impacts of specific events. Advances in graph neural networks have enabled better utilization of knowledge graphs, sourced from platforms like FreeBase [145] and Wikidata, to enhance prediction accuracy by contextualizing relational data. Visual data, including candlestick charts, has also been applied in stock market prediction, leveraging the success of Convolutional Neural Networks in image processing. While promising, the use of alternative image data, such as satellite imagery or CCTV footage, remains rare due to high costs and privacy concerns [145]. The integration of unstructured data—textual, relational, and visual—broadens the scope of stock market analysis. Despite obstacles like standardization, computational complexity, and ethical considerations, advancements in machine learning and neural networks continue to unlock the potential of these data sources, paving the way for more comprehensive market insights.
Table 6. Overview of Data Sources, Inputs, and Prediction Horizons for Stock Market Forecasting.
CitationData SourceType of InputPrediction Timeline
[135]Enron CorpusSentiment analysis, financial metricsDaily or Weekly
[39]Yahoo FinanceSocial media activity, market updatesMonthly and Daily
[146]NASDAQ, DJIA, AppleMarket data, news reports, technical inputsForecast: Next Day
[140]Yahoo FinanceStock-related newsWithin the Same Day
[133]Columbia MarketTrends and technical dataForecast for Next Day
[142]Microsoft CorporationInsights from TwitterDay-by-Day
[86]Google SharesStock movement statisticsFive-Day Horizon
[5]BSE, Tech MahindraTwitter trends, trading dataWeekly and Daily
[147]Apple and Yahoo FinanceTechnical signals, stock performance60-Day to 90-Day Range
[129]DJIAMarket signals via social platformsDaily Updates
[15]Global Stock MarketsNews, finance platforms, WikipediaWeekly Predictions
[33]Apple StockFundamental stock dataDaily Forecast
[148]Google StockTrading insightsDay-by-Day
[130]DAX 30 IndexNewsletters, RSS feeds, trading dataShort-Term (Intraday)
[131]S&P 500Real-time market analysisIntraday Forecasting
[144]Yahoo Finance (18 Stocks)Message boards, market dataPer-Day Analytics
[57]S&P, NYSE, DJIAInsights from social media, indicatorsWeekly or Daily
[128]NASDAQ StocksStock trend analysisPrediction: Few Days

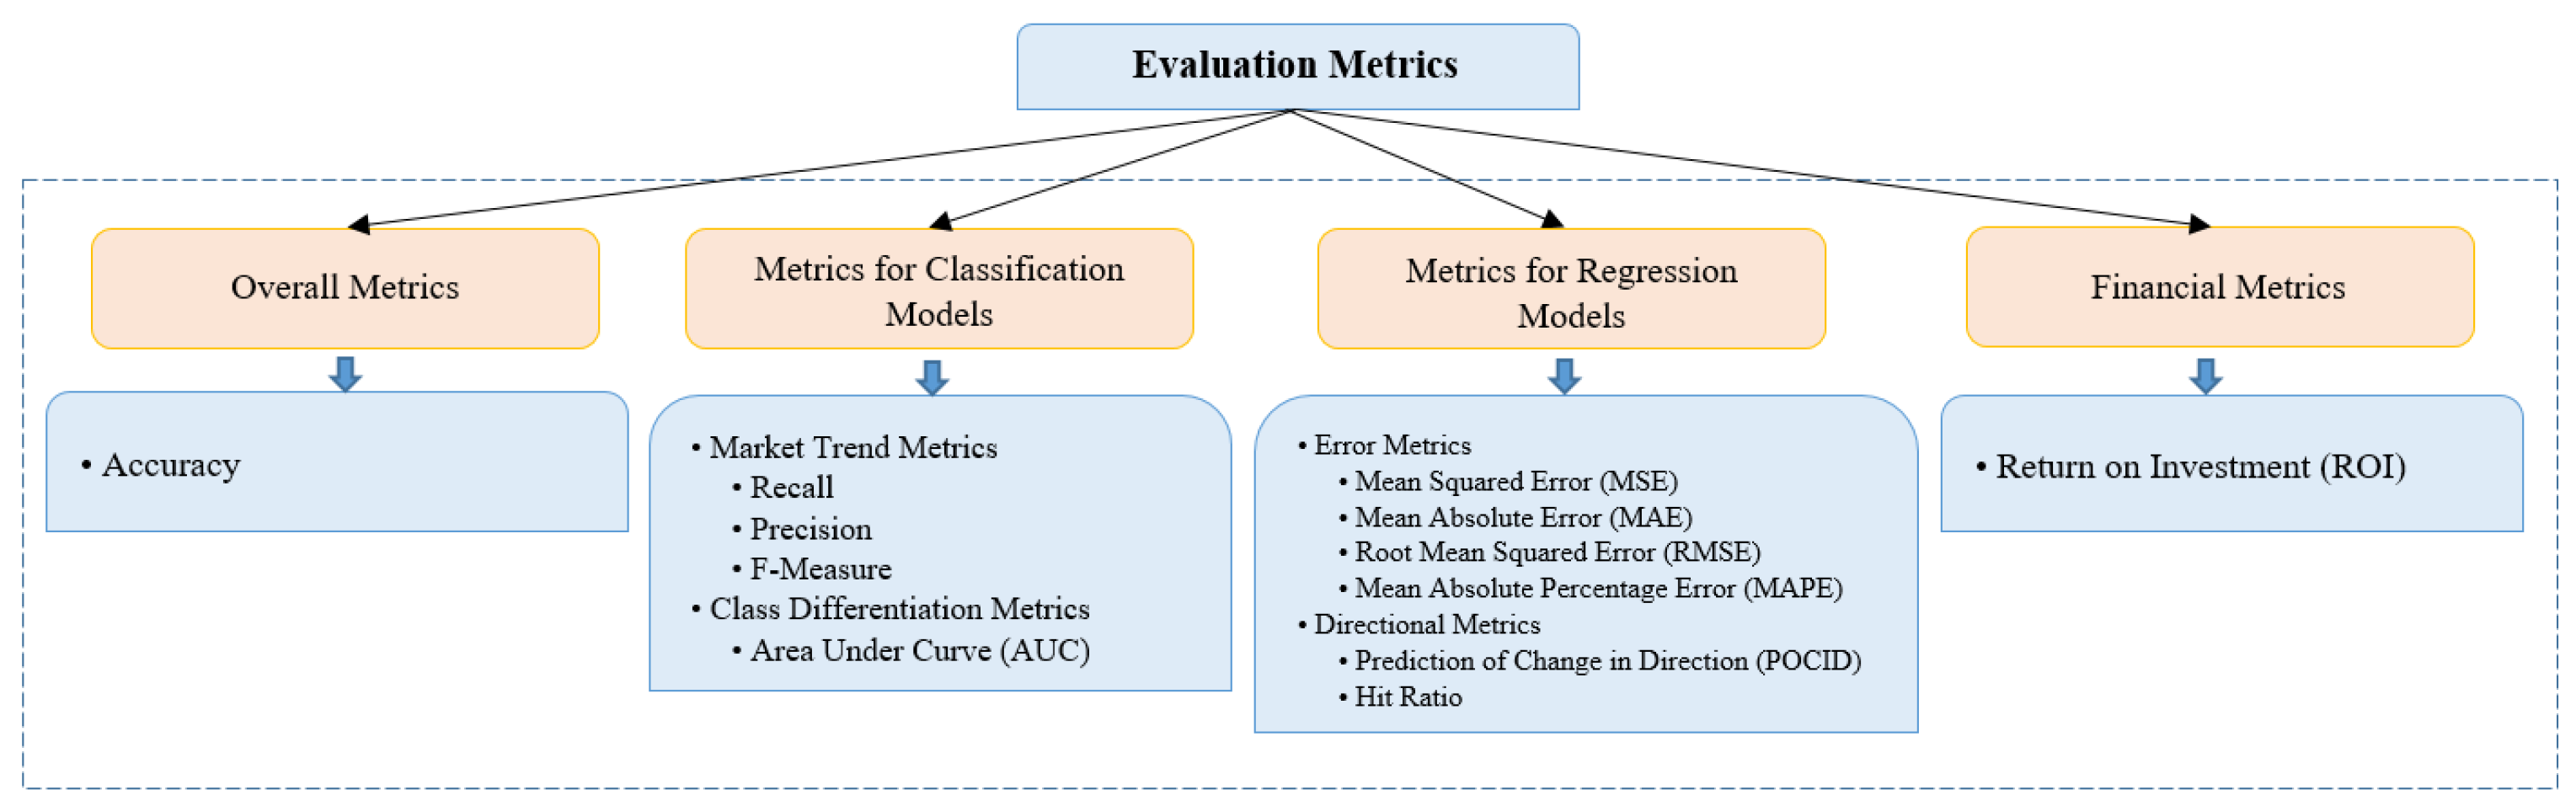
8. Evaluation Metrics

Stock market prediction is typically approached through classification and regression methodologies, each serving distinct purposes. Classification seeks to categorize market movements, such as predicting whether the market will trend “Up” or “Down”, while regression provides precise numerical estimates for price fluctuations, capturing the magnitude of changes. The performance of these methods is assessed using various metrics, as extensively discussed in existing literature and presented through illustrative tables and figures. A summary of commonly used evaluation metrics is provided in Table 7. For instance, a categorization of the evaluation metrics utilized in contemporary studies is depicted in Figure 3. Accuracy, one of the most prevalent metrics, represents the proportion of correct predictions to total test cases [149]. Its popularity stems from its simplicity and computational efficiency. Nevertheless, its effectiveness is limited in datasets with imbalanced class distributions, as it fails to differentiate between the significance of Type 1 and Type 2 errors [150]. Similarly, MSE, a prominent metric in regression tasks, quantifies the average squared discrepancies between predicted and actual values, offering insights into the model’s precision. For classification challenges, the AUC serves as a critical measure, highlighting the model’s capability to distinguish between classes, with higher AUC values signifying superior performance [151]. Studies focused on classification frequently rely on metrics like Precision, Recall, and the F-measure. Precision is defined as the ratio of accurately predicted positive cases to the total predicted positives [146], while Recall assesses the ratio of correctly predicted positives to all actual positive instances [15]. The F-measure harmonizes Precision and Recall, emphasizing a balanced consideration of false positives and false negatives [44,146]. In regression-based analyses, R-squared remains a fundamental metric, measuring the proportion of variance in the dependent variable that is predictable from the independent variables [152]. Additional metrics such as MAE and MAPE are widely used. MAE calculates the average magnitude of absolute errors, while MAPE assesses the average percentage error between predictions and actual values [128,153]. These metrics collectively provide a nuanced understanding of a regression model’s reliability and precision. Beyond traditional metrics, some research incorporates profitability-oriented measures to evaluate real-world applicability. Metrics such as Return on Investment and Trading Returns have gained traction in studies targeting practical effectiveness [59,140]. Others include the Prediction of Change in Direction, which evaluates directional accuracy, and Hit Ratios, which measure the frequency of correct predictions in a trading context [154]. Ultimately, the selection of evaluation metrics is guided by the specific objectives of the study and the prediction approach utilized. This ensures alignment between the strengths of the model and its intended application, fostering robust and contextually relevant evaluations.
Table 7. Evaluation Metrics for Stock Market Prediction.
CategoryReferencesMetricCommon Use
Overall Metrics[149,150]AccuracySuitable for balanced datasets.
[151]Area Under the Curve (AUC)Classification tasks with imbalanced datasets.
Classification Metrics[146]PrecisionEvaluates relevance of positive predictions.
[15]RecallMeasures sensitivity.
[41,144]F-MeasureBalances false positives and false negatives.
Regression Metrics[152]Mean Squared Error (MSE)Indicates model precision.
[125,151]Mean Absolute Error (MAE)Regression tasks requiring simpler measures.
[125,151]Mean Absolute Percentage Error (MAPE)Measures proportional errors.
[152]R-squared (R2)Evaluates explained variance.
[154]Prediction of Change in Direction (POCID)Regression and market trend evaluations.
[154]Hit RatioPractical directional accuracy assessments.
Profitability Metrics[56,138]Return on Investment (ROI)Measures financial impact.

9. Challenges and Open Issues

Stock market prediction remains a complex and intriguing problem due to its inherent non-linear dynamics, volatility, and the influence of diverse factors. Despite significant advancements in machine learning and deep learning techniques, several challenges and open issues persist, which require further exploration. The quality and nature of financial data present a significant hurdle. Financial datasets are often noisy and unstructured, making feature extraction and preprocessing challenging. While historical stock data provides valuable trends, it is influenced by economic, psychological, and social factors that are difficult to quantify. Moreover, incorporating temporal dependencies in time-series data demands specialized validation techniques, as conventional random cross-validation may undermine performance. Block-based cross-validation is suggested as a better alternative to address this issue. Many prediction models demonstrate promising results in controlled environments but falter in real-world, live-testing scenarios. The dynamic nature of stock prices, coupled with unforeseen events and market noise, significantly impacts the effectiveness of these models. Incidents such as the Knight Capital Tragedy highlight the risks associated with untested algorithms in live trading environments. Market volatility, driven by factors like inflation, political events, and algorithmic trading, poses another critical challenge. While algorithmic trading enhances efficiency, it often triggers overreactions, such as panic selling, which complicates the evaluation of market behavior. The rapid introduction of new trading algorithms further exacerbates this issue, as comparing their efficacy and accuracy becomes increasingly difficult. Additionally, the proprietary nature of successful algorithms limits transparency and reproducibility, creating a self-defeating cycle for research. Sentiment analysis, particularly using social media and news data, has emerged as a popular approach for stock prediction. However, the reliability of this data is questionable due to the prevalence of fake news and bot-generated content. Events like the Syrian Electronic Army’s Twitter hack in 2013 illustrate the potential for misinformation to cause sudden market disruptions. Quarterly and annual corporate filings, such as 10-Q and 10-K reports, are proposed as alternative resources for sentiment analysis, providing more structured insights into a company’s performance. Developing robust prediction models involves selecting appropriate datasets, features, and hyperparameters. The rationale behind these choices is often underexplored, impacting the generalizability of models across different datasets. Furthermore, the optimization of neural network architectures, including hyperparameters and activation functions, remains an open area of research. Hybrid approaches combining ML and DL techniques are increasingly being investigated to overcome individual model limitations, such as the vanishing gradient problem in recurrent neural networks. Most research focuses on short-term stock predictions, while long-term predictions receive comparatively less attention. Techniques like ARIMA and advanced architectures such as LSTM and RNN show potential in modeling long-term dependencies but require further exploration. Additionally, behavioral aspects, such as investor psychology and personal aspirations, play a critical role in stock market dynamics. Integrating these factors into computational models could improve prediction accuracy and customization.
Several promising avenues for future research exist:
  • Contextual integration of external events such as political changes and global occurrences into prediction models can enhance their robustness.
  • Developing models that adapt to real-time market conditions while addressing noise and unanticipated events remains a critical goal.
  • Increasing the interpretability of prediction models could provide deeper insights into market behavior and build trust among investors.
  • Leveraging metaheuristic algorithms to optimize NN weights and architectures is another potential research area.
  • Expanding the scope of analysis to derivatives-based markets and hybrid approaches could yield significant advancements.
In conclusion, stock market prediction is an ever-evolving field that requires addressing diverse challenges ranging from data quality and real-time implementation to behavioral and external influences. Bridging these gaps through innovative techniques and interdisciplinary approaches will be key to achieving reliable and actionable insights in this domain.

10. Conclusions

Stock market prediction, a field of immense practical significance, has seen remarkable advancements driven by machine learning and deep learning techniques. This review has highlighted the strengths and limitations of popular models such as LSTM, CNN, and SVM, while also addressing key challenges such as data quality, model interpretability, and the dynamic nature of financial markets. Despite the progress made, persistent hurdles—including noisy datasets, limited generalizability, and the lack of robust models for real-world scenarios—underscore the need for continued innovation. Emerging research avenues, including hybrid model development, metaheuristic optimization, and the integration of behavioral and external factors, hold great promise. Additionally, the focus on enhancing model interpretability and real-time adaptability is crucial for fostering trust and reliability in predictive systems. By addressing these challenges and leveraging interdisciplinary approaches, researchers can pave the way for more accurate, robust, and actionable stock market prediction methodologies. As the financial landscape evolves, the synergy between advanced computational techniques and domain-specific insights will play a pivotal role in shaping the future of this dynamic field.

Author Contributions

Conceptualization, M.S. and J.R.; methodology, J.R. and M.S.; funding acquisition, J.R.; investigation, A.S., J.R. and A.S.; writing original draft preparation, M.S. and A.S.; writing—review and editing, M.S., J.R. and A.S.; supervision, J.R. All authors have read and agreed to the published version of the manuscript.

Funding

This research received no external funding.

Institutional Review Board Statement

Not applicable.

Informed Consent Statement

Not applicable.

Data Availability Statement

In the manuscript, you will find a list of the corresponding websites.

Conflicts of Interest

There are no conflicts of interest between the authors.

Terminology

Stock Market Prediction (SMP): a process of forecasting stock price movements and market trends using data analysis and predictive modeling techniques. Machine Learning (ML): a field of artificial intelligence that enables computers to learn and make decisions from data without explicit programming. Deep Learning (DL): a subset of machine learning that uses neural networks with many layers to model complex patterns in data. Recurrent Neural Network (RNN): a type of neural network designed to process sequential data by maintaining a memory of previous inputs. Convolutional Neural Network (CNN): a neural network architecture widely used for processing grid-like data, such as images and time-series data. Long Short-Term Memory (LSTM): a specialized RNN designed to capture long-term dependencies in sequential data while avoiding the vanishing gradient problem. Gated Recurrent Unit (GRU): a simplified variant of LSTM that processes sequential data while reducing computational complexity. Support Vector Machine (SVM): an algorithm used in supervised learning for classification and regression tasks by identifying the optimal hyperplane for separation. Naïve Bayes (NB): a probabilistic classification algorithm based on Bayes’ theorem, assuming feature independence for scalability and efficiency. Radial Basis Function (RBF): a kernel function used in machine learning algorithms, especially in SVM, to handle non-linear data. Kernel-based Principal Component Analysis (KPCA): a dimensionality reduction technique that uses kernel functions to project data into higher-dimensional spaces for better separability. Principal Component Analysis (PCA): a statistical method for reducing the dimensionality of datasets by transforming them into a set of uncorrelated variables called principal components. On-Balance Volume (OBV): a technical indicator used in stock market analysis to measure buying and selling pressure based on volume changes. Relative Strength Index (RSI): a momentum indicator in technical analysis that evaluates the speed and change of price movements to identify overbought or oversold conditions. Gross Domestic Product (GDP): an economic metric that measures the total value of goods and services produced within a country. Consumer Price Index (CPI): an economic indicator that measures the average change over time in the prices paid by consumers for goods and services. Return on Investment (ROI): a financial metric that calculates the profitability of an investment relative to its cost. Mean Absolute Error (MAE): a regression metric that measures the average magnitude of errors in predictions, ignoring their direction. Mean Squared Error (MSE): a regression metric that quantifies the average squared difference between predicted and actual values. Mean Absolute Percentage Error (MAPE): a regression metric that expresses prediction errors as a percentage of the actual values. Area Under the Curve (AUC): a performance metric for classification models, measuring the ability to distinguish between classes. Autoregressive Integrated Moving Average (ARIMA): a statistical time-series modeling technique used for forecasting based on lagged data points. Prediction of Change in Direction (POCID): a metric used in stock market prediction to evaluate the directional accuracy of a model’s forecasts. Dow Jones Industrial Average (DJIA): a stock market index that represents 30 prominent companies listed on stock exchanges in the United States. Deutscher Aktienindex (DAX): a stock market index that tracks 30 major German companies trading on the Frankfurt Stock Exchange. Standard and Poor’s 500 Index (S&P 500): a stock market index that measures the performance of 500 leading publicly traded companies in the United States. Bombay Stock Exchange (BSE): one of India’s largest and oldest stock exchanges, providing market data and trading services. National Stock Exchange of India (NSE): a leading stock exchange in India that facilitates trading in equities, derivatives, and other financial instruments.

References

  1. Ingle, V.; Deshmukh, S. Ensemble deep learning framework for stock market data prediction (EDLF-DP). Glob. Transit. Proc. 2021, 2, 47–66. [Google Scholar] [CrossRef]
  2. Upadhyay, A.; Bandyopadhyay, G.; Dutta, A. Forecasting Stock Performance in Indian Market using Multinomial Logistic Regression. J. Bus. Stud. Q. 2012, 3, 16–39. [Google Scholar]
  3. Ferreira, F.G.D.C.; Gandomi, A.H.; Cardoso, R.T.N. Artificial Intelligence Applied to Stock Market Trading: A Review. IEEE Access 2021, 9, 30898–30917. [Google Scholar] [CrossRef]
  4. Hu, Z.; Zhao, Y.; Khushi, M. A Survey of Forex and Stock Price Prediction Using Deep Learning. Appl. Syst. Innov. 2021, 4, 9. [Google Scholar] [CrossRef]
  5. Shah, D.; Isah, H.; Zulkernine, F. Stock Market Analysis: A Review and Taxonomy of Prediction Techniques. Int. J. Financ. Stud. 2019, 7, 26. [Google Scholar] [CrossRef]
  6. Al-Alawi, A.I.; Alshakhoori, N. Stock Price Prediction Using Artificial Intelligence: A Literature Review. In Proceedings of the 2024 ASU International Conference in Emerging Technologies for Sustainability and Intelligent Systems (ICETSIS), Manama, Bahrain, 28–29 January 2024; pp. 1–6. [Google Scholar] [CrossRef]
  7. Hu, Y.; Liu, K.; Zhang, X.; Su, L.; Ngai, E.; Liu, M. Application of evolutionary computation for rule discovery in stock algorithmic trading: A literature review. Appl. Soft Comput. 2015, 36, 534–551. [Google Scholar] [CrossRef]
  8. Imam, S.; Barker, R.; Clubb, C. The Use of Valuation Models by UK Investment Analysts. Eur. Account. Rev. 2008, 17, 503–535. [Google Scholar] [CrossRef]
  9. Gordon, M.J. Dividends, Earnings, and Stock Prices. Rev. Econ. Stat. 1959, 41, 99–105. [Google Scholar] [CrossRef]
  10. Md, A.Q.; Kapoor, S.; Chris Junni, A.V.; Sivaraman, A.K.; Tee, K.F.; Sabireen, H.; Janakiraman, N. Novel optimization approach for stock price forecasting using multi-layered sequential LSTM. Appl. Soft Comput. 2023, 134, 109830. [Google Scholar] [CrossRef]
  11. Lee, T.-W.; Teisseyre, P.; Lee, J. Effective Exploitation of Macroeconomic Indicators for Stock Direction Classification Using the Multimodal Fusion Transformer. IEEE Access 2023, 11, 10275–10287. [Google Scholar] [CrossRef]
  12. Dutta, A.; Bandopadhyay, G.A.; Sengupta, S. Prediction of Stock Performance in the Indian Stock Market Using Logistic Regression. Int. J. Bus. Inf. 2012, 7, 105. [Google Scholar]
  13. Chen, S.; Zhou, C. Stock Prediction Based on Genetic Algorithm Feature Selection and Long Short-Term Memory Neural Network. IEEE Access 2020, 9, 9066–9072. [Google Scholar] [CrossRef]
  14. Chen, W.; Zhang, H.; Mehlawat, M.K.; Jia, L. Mean–variance portfolio optimization using machine learning-based stock price prediction. Appl. Soft Comput. 2021, 100, 106943. [Google Scholar] [CrossRef]
  15. Khan, W.; Malik, U.; Ghazanfar, M.A.; Azam, M.A.; Alyoubi, K.H.; Alfakeeh, A.S. Predicting stock market trends using machine learning algorithms via public sentiment and political situation analysis. Soft Comput. 2019, 24, 11019–11043. [Google Scholar] [CrossRef]
  16. Trading on the Edge: Neural, Genetic, and Fuzzy Systems for Chaotic Financial Markets|Wiley. Wiley.com. Available online: https://www.wiley.com/en-us/Trading+on+the+Edge%3A+Neural%2C+Genetic%2C+and+Fuzzy+Systems+for+Chaotic+Financial+Markets-p-9780471311003 (accessed on 8 December 2024).
  17. Moghar, A.; Hamiche, M. Stock Market Prediction Using LSTM Recurrent Neural Network. Procedia Comput. Sci. 2020, 170, 1168–1173. [Google Scholar] [CrossRef]
  18. Wang, Y.; Guo, Y. Forecasting method of stock market volatility in time series data based on mixed model of ARIMA and XGBoost. China Commun. 2020, 17, 205–221. [Google Scholar] [CrossRef]
  19. Sunny, A.I.; Maswood, M.M.S.; Alharbi, A.G. Deep Learning-Based Stock Price Prediction Using LSTM and Bi-Directional LSTM Model. In Proceedings of the 2020 2nd Novel Intelligent and Leading Emerging Sciences Conference (NILES), Giza, Egypt, 24–26 October 2020; pp. 87–92. [Google Scholar] [CrossRef]
  20. Khang, P.Q.; Hernes, M.; Kuziak, K.; Rot, A.; Gryncewicz, W. Liquidity prediction on Vietnamese stock market using deep learning. Procedia Comput. Sci. 2020, 176, 2050–2058. [Google Scholar] [CrossRef]
  21. Kamara, A.F.; Chen, E.; Pan, Z. An ensemble of a boosted hybrid of deep learning models and technical analysis for forecasting stock prices. Inf. Sci. 2022, 594, 1–19. [Google Scholar] [CrossRef]
  22. Hulbert, M. VIEWPOINT; More Proof for the Dow Theory. The New York Times, 6 September 1998. Available online: https://www.nytimes.com/1998/09/06/business/viewpoint-more-proof-for-the-dow-theory.html (accessed on 8 December 2024).
  23. Jing, N.; Wu, Z.; Wang, H. A hybrid model integrating deep learning with investor sentiment analysis for stock price prediction. Expert Syst. Appl. 2021, 178, 115019. [Google Scholar] [CrossRef]
  24. Mehta, P.; Pandya, S.; Kotecha, K. Harvesting social media sentiment analysis to enhance stock market prediction using deep learning. PeerJ Comput. Sci. 2021, 7, e476. [Google Scholar] [CrossRef]
  25. COVID-19 Sentiment and the Chinese Stock Market: Evidence from the Official News Media and Sina Weibo—ScienceDirect. Available online: https://www.sciencedirect.com/science/article/pii/S0275531921000532 (accessed on 8 December 2024).
  26. Wu, J.-L.; Huang, M.-T.; Yang, C.-S.; Liu, K.-H. Sentiment analysis of stock markets using a novel dimensional valence–arousal approach. Soft Comput. 2021, 25, 4433–4450. [Google Scholar] [CrossRef]
  27. Tuarob, S.; Wettayakorn, P.; Phetchai, P.; Traivijitkhun, S.; Lim, S.; Noraset, T.; Thaipisutikul, T. DAViS: A unified solution for data collection, analyzation, and visualization in real-time stock market prediction. Financ. Innov. 2021, 7, 56. [Google Scholar] [CrossRef]
  28. Zhao, Y.; Yang, G. Deep Learning-based Integrated Framework for stock price movement prediction. Appl. Soft Comput. 2023, 133, 109921. [Google Scholar] [CrossRef]
  29. Multi-Model Generative Adversarial Network Hybrid Prediction Algorithm (MMGAN-HPA) for Stock Market Prices Prediction—ScienceDirect. Available online: https://www.sciencedirect.com/science/article/pii/S1319157821001683 (accessed on 8 December 2024).
  30. Yun, K.K.; Yoon, S.W.; Won, D. Prediction of stock price direction using a hybrid GA-XGBoost algorithm with a three-stage feature engineering process. Expert Syst. Appl. 2021, 186, 115716. [Google Scholar] [CrossRef]
  31. Ayala, J.; García-Torres, M.; Noguera, J.L.V.; Gómez-Vela, F.; Divina, F. Technical analysis strategy optimization using a machine learning approach in stock market indices. Knowl.-Based Syst. 2021, 225, 107119. [Google Scholar] [CrossRef]
  32. Bhuriya, D.; Kaushal, G.; Sharma, A.; Singh, U. Stock market predication using a linear regression. In Proceedings of the 2017 International Conference of Electronics, Communication and Aerospace Technology (ICECA), Coimbatore, India, 20–22 April 2017; pp. 510–513. [Google Scholar] [CrossRef]
  33. Chandar, S.K. Fusion model of wavelet transform and adaptive neuro fuzzy inference system for stock market prediction. J. Ambient. Intell. Humaniz. Comput. 2019. [Google Scholar] [CrossRef]
  34. Ariyo, A.A.; Adewumi, A.O.; Ayo, C.K. Stock Price Prediction Using the ARIMA Model. In Proceedings of the 2014 UKSim-AMSS 16th International Conference on Computer Modelling and Simulation, Cambridge, UK, 26–28 March 2014; pp. 106–112. [Google Scholar] [CrossRef]
  35. Devi, B.U.; Sundar, D.; Alli, P. An Effective Time Series Analysis for Stock Trend Prediction Using ARIMA Model for Nifty Midcap-50. Int. J. Data Min. Knowl. Manag. Process. 2013, 3, 65–78. [Google Scholar] [CrossRef]
  36. Fu, T.-C.; Chung, F.-L.; Luk, R.; Ng, C.-M. Preventing Meaningless Stock Time Series Pattern Discovery by Changing Perceptually Important Point Detection. In Fuzzy Systems and Knowledge Discovery; Wang, L., Jin, Y., Eds.; Springer: Berlin/Heidelberg, Germany, 2005; pp. 1171–1174. [Google Scholar] [CrossRef]
  37. Yuan, X.; Yuan, J.; Jiang, T.; Ain, Q.U. Integrated Long-Term Stock Selection Models Based on Feature Selection and Machine Learning Algorithms for China Stock Market. IEEE Access 2020, 8, 22672–22685. [Google Scholar] [CrossRef]
  38. Ayyappa, Y.; Kumar, A.S. A Compact Literature Review on Stock Market Prediction. In Proceedings of the 2022 4th International Conference on Inventive Research in Computing Applications (ICIRCA), Coimbatore, India, 21–23 September 2022; pp. 1336–1347. [Google Scholar] [CrossRef]
  39. Nayak, A.; Pai, M.M.M.; Pai, R.M. Prediction Models for Indian Stock Market. Procedia Comput. Sci. 2016, 89, 441–449. [Google Scholar] [CrossRef]
  40. Mokhtari, S.; Yen, K.K.; Liu, J. Effectiveness of Artificial Intelligence in Stock Market Prediction based on Machine Learning. Int. J. Comput. Appl. 2021, 183, 1–8. [Google Scholar] [CrossRef]
  41. Alotaibi, S.S. Ensemble Technique with Optimal Feature Selection for Saudi Stock Market Prediction: A Novel Hybrid Red Deer-Grey Algorithm. IEEE Access 2021, 9, 64929–64944. [Google Scholar] [CrossRef]
  42. Xianya, J.; Mo, H.; Haifeng, L. Stock Classification Prediction Based on Spark. Procedia Comput. Sci. 2019, 162, 243–250. [Google Scholar] [CrossRef]
  43. Milosevic, N. Equity forecast: Predicting long term stock price movement using machine learning. arXiv 2016, arXiv:1603.00751. [Google Scholar] [CrossRef]
  44. Ihlayyel, H.A.; Sharef, N.M.; Nazri, M.Z.A.; Abu Bakar, A. An enhanced feature representation based on linear regression model for stock market prediction. Intell. Data Anal. 2018, 22, 45–76. [Google Scholar] [CrossRef]
  45. Yu, Y.; Duan, W.; Cao, Q. The impact of social and conventional media on firm equity value: A sentiment analysis approach. Decis. Support Syst. 2013, 55, 919–926. [Google Scholar] [CrossRef]
  46. Zhang, L.; Zhang, L.; Teng, W.; Chen, Y. Based on Information Fusion Technique with Data Mining in the Application of Finance Early-Warning. Procedia Comput. Sci. 2013, 17, 695–703. [Google Scholar] [CrossRef]
  47. Gururaj, V. Stock Market Prediction using Linear Regression and Support Vector Machines. Int. J. Appl. Eng. Res. 2019, 14, 1931–1934. [Google Scholar]
  48. Kamley, S.; Jaloree, S.; Thakur, R.S. Multiple regression: A data mining approach for predicting the stock market trends based on open, close and high price of the month. Future 2013, 2, 6. [Google Scholar]
  49. Yuan, J.; Luo, Y. Test on the Validity of Futures Market’s High Frequency Volume and Price on Forecast. In Proceedings of the 2014 International Conference on Management of e-Commerce and e-Government (ICMeCG), Shanghai, China, 31 October–2 November 2014; pp. 28–32. [Google Scholar] [CrossRef]
  50. Meesad, P.; Rasel, R.I. Predicting stock market price using support vector regression. In Proceedings of the 2013 2nd International Conference on Informatics, Electronics and Vision (ICIEV), Dhaka, Bangladesh, 17–18 May 2013; pp. 1–6. [Google Scholar] [CrossRef]
  51. Polamuri, S.R.; Srinivas, K.; Mohan, A.K. Multi model-Based Hybrid Prediction Algorithm (MM-HPA) for Stock Market Prices Prediction Framework (SMPPF). Arab. J. Sci. Eng. 2020, 45, 10493–10509. [Google Scholar] [CrossRef]
  52. Kim, Y.; Ahn, W.; Oh, K.J.; Enke, D. An intelligent hybrid trading system for discovering trading rules for the futures market using rough sets and genetic algorithms. Appl. Soft Comput. 2017, 55, 127–140. [Google Scholar] [CrossRef]
  53. Verma, S.; Sahu, S.P.; Sahu, T.P. Discrete Wavelet Transform-based feature engineering for stock market prediction. Int. J. Inf. Technol. 2023, 15, 1179–1188. [Google Scholar] [CrossRef]
  54. Hao, P.-Y.; Kung, C.-F.; Chang, C.-Y.; Ou, J.-B. Predicting stock price trends based on financial news articles and using a novel twin support vector machine with fuzzy hyperplane. Appl. Soft Comput. 2021, 98, 106806. [Google Scholar] [CrossRef]
  55. Howells, K.; Ertugan, A. Applying fuzzy logic for sentiment analysis of social media network data in marketing. Procedia Comput. Sci. 2017, 120, 664–670. [Google Scholar] [CrossRef]
  56. Sedighi, M.; Jahangirnia, H.; Gharakhani, M.; Fard, S.F. A Novel Hybrid Model for Stock Price Forecasting Based on Metaheuristics and Support Vector Machine. Data 2019, 4, 75. [Google Scholar] [CrossRef]
  57. Ghanavati, M.; Wong, R.K.; Chen, F.; Wang, Y.; Fong, S. A Generic Service Framework for Stock Market Prediction. In Proceedings of the 2016 IEEE International Conference on Services Computing (SCC), San Francisco, CA, USA, 27 June–2 July 2016; pp. 283–290. [Google Scholar] [CrossRef]
  58. Vijh, M.; Chandola, D.; Tikkiwal, V.A.; Kumar, A. Stock Closing Price Prediction using Machine Learning Techniques. Procedia Comput. Sci. 2020, 167, 599–606. [Google Scholar] [CrossRef]
  59. Zhong, X.; Enke, D. Forecasting daily stock market return using dimensionality reduction. Expert Syst. Appl. 2017, 67, 126–139. [Google Scholar] [CrossRef]
  60. Bing, Y.; Hao, J.K.; Zhang, S.C. Stock Market Prediction Using Artificial Neural Networks. Adv. Eng. Forum 2012, 6–7, 1055–1060. [Google Scholar] [CrossRef]
  61. Classification of Tennis Shots with a Neural Network Approach. Available online: https://www.mdpi.com/1424-8220/21/17/5703 (accessed on 8 December 2024).
  62. Singh, R.; Srivastava, S. Stock prediction using deep learning. Multimed. Tools Appl. 2017, 76, 18569–18584. [Google Scholar] [CrossRef]
  63. Mukherjee, S.; Sadhukhan, B.; Sarkar, N.; Roy, D.; De, S. Stock market prediction using deep learning algorithms. CAAI Trans. Intell. Technol. 2023, 8, 82–94. [Google Scholar] [CrossRef]
  64. Kraus, M.; Feuerriegel, S. Decision support from financial disclosures with deep neural networks and transfer learning. Decis. Support Syst. 2017, 104, 38–48. [Google Scholar] [CrossRef]
  65. Eapen, J.; Bein, D.; Verma, A. Novel Deep Learning Model with CNN and Bi-Directional LSTM for Improved Stock Market Index Prediction. In Proceedings of the 2019 IEEE 9th Annual Computing and Communication Workshop and Conference (CCWC), Las Vegas, NV, USA, 7–9 January 2019; pp. 264–270. [Google Scholar] [CrossRef]
  66. Liu, W.; Wang, Z.; Liu, X.; Zeng, N.; Liu, Y.; Alsaadi, F.E. A survey of deep neural network architectures and their applications. Neurocomputing 2017, 234, 11–26. [Google Scholar] [CrossRef]
  67. Hoseinzade, E.; Haratizadeh, S. CNNpred: CNN-based stock market prediction using a diverse set of variables. Expert Syst. Appl. 2019, 129, 273–285. [Google Scholar] [CrossRef]
  68. Nti, I.K.; Adekoya, A.F.; Weyori, B.A. A novel multi-source information-fusion predictive framework based on deep neural networks for accuracy enhancement in stock market prediction. J. Big Data 2021, 8, 17. [Google Scholar] [CrossRef]
  69. Maqsood, H.; Mehmood, I.; Maqsood, M.; Yasir, M.; Afzal, S.; Aadil, F.; Selim, M.M.; Muhammad, K. A local and global event sentiment based efficient stock exchange forecasting using deep learning. Int. J. Knowl. Manag. 2020, 50, 432–451. [Google Scholar] [CrossRef]
  70. Tsantekidis, A.; Passalis, N.; Tefas, A.; Kanniainen, J.; Gabbouj, M.; Iosifidis, A. Forecasting Stock Prices from the Limit Order Book Using Convolutional Neural Networks. In Proceedings of the 2017 IEEE 19th Conference on Business Informatics (CBI), Thessaloniki, Greece, 24–27 July 2017; Volume 1, pp. 7–12. [Google Scholar] [CrossRef]
  71. Patil, P.; Wu, C.-S.M.; Potika, K.; Orang, M. Stock Market Prediction Using Ensemble of Graph Theory, Machine Learning and Deep Learning Models. In Proceedings of the ICSIM ’20: The 3rd International Conference on Software Engineering and Information Management, ICSIM ’20, Sydney, NSW, Australia, 12–15 January 2020; Association for Computing Machinery: New York, NY, USA, 2020; pp. 85–92. [Google Scholar] [CrossRef]
  72. Zhang, X.; Zhang, Y.; Wang, S.; Yao, Y.; Fang, B.; Yu, P.S. Improving stock market prediction via heterogeneous information fusion. Knowl.-Based Syst. 2018, 143, 236–247. [Google Scholar] [CrossRef]
  73. Zhao, Y.; Khushi, M. Wavelet Denoised-ResNet CNN and LightGBM Method to Predict Forex Rate of Change. In Proceedings of the 2020 International Conference on Data Mining Workshops (ICDMW), Sorrento, Italy, 17–20 November 2020; pp. 385–391. [Google Scholar] [CrossRef]
  74. Lee, J.; Kim, R.; Koh, Y.; Kang, J. Global Stock Market Prediction Based on Stock Chart Images Using Deep Q-Network. IEEE Access 2019, 7, 167260–167277. [Google Scholar] [CrossRef]
  75. Carta, S.; Ferreira, A.; Podda, A.S.; Recupero, D.R.; Sanna, A. Multi-DQN: An ensemble of Deep Q-learning agents for stock market forecasting. Expert Syst. Appl. 2021, 164, 113820. [Google Scholar] [CrossRef]
  76. Koratamaddi, P.; Wadhwani, K.; Gupta, M.; Sanjeevi, S.G. Market sentiment-aware deep reinforcement learning approach for stock portfolio allocation. Eng. Sci. Technol. Int. J. 2021, 24, 848–859. [Google Scholar] [CrossRef]
  77. Qin, Y.; Song, D.; Chen, H.; Cheng, W.; Jiang, G.; Cottrell, G.W. A Dual-Stage Attention-Based Recurrent Neural Network for Time Series Prediction. arXiv 2017, arXiv:1704.02971. [Google Scholar] [CrossRef]
  78. Zeng, Z.; Khushi, M. Wavelet Denoising and Attention-based RNN-ARIMA Model to Predict Forex Price. In Proceedings of the 2020 International Joint Conference on Neural Networks (IJCNN), Glasgow, UK, 19–24 July 2020; pp. 1–7. [Google Scholar] [CrossRef]
  79. Zhang, L.; Aggarwal, C.; Qi, G.-J. Stock Price Prediction via Discovering Multi-Frequency Trading Patterns. In Proceedings of the KDD ’17: The 23rd ACM SIGKDD International Conference on Knowledge Discovery and Data Mining, KDD ’17, Halifax, NS, Canada, 13–17 August 2017; Association for Computing Machinery: New York, NY, USA, 2017; pp. 2141–2149. [Google Scholar] [CrossRef]
  80. Li, C.; Song, D.; Tao, D. Multi-task Recurrent Neural Networks and Higher-order Markov Random Fields for Stock Price Movement Prediction: Multi-task RNN and Higer-order MRFs for Stock Price Classification. In Proceedings of the 25th ACM SIGKDD International Conference on Knowledge Discovery & Data Mining, in KDD ’19, Anchorage, AK, USA, 4–8 August 2019; Association for Computing Machinery: New York, NY, USA, 2019; pp. 1141–1151. [Google Scholar] [CrossRef]
  81. Elman, J. Finding structure in time. Cogn. Sci. 1990, 14, 179–211. [Google Scholar] [CrossRef]
  82. Jordan, M.I. Chapter 25—Serial Order: A Parallel Distributed Processing Approach. Adv. Psychol. 1997, 121, 471–495. [Google Scholar] [CrossRef]
  83. Jaeger, H.; Haas, H. Harnessing Nonlinearity: Predicting Chaotic Systems and Saving Energy in Wireless Communication. Science 2004, 304, 78–80. [Google Scholar] [CrossRef] [PubMed]
  84. Bernal, A.; Fok, S.; Pidaparthi, R. Financial Market Time Series Prediction with Recurrent Neural Networks; Citeseer: State College, PA, USA, 2012. [Google Scholar]
  85. Chen, W.; Yeo, C.K.; Lau, C.T.; Lee, B.S. Leveraging social media news to predict stock index movement using RNN-boost. Data Knowl. Eng. 2018, 118, 14–24. [Google Scholar] [CrossRef]
  86. Di Persio, L.; Honchar, O. Recurrent Neural Networks Approach to the Financial Forecast of Google Assets. 2017. Available online: https://iris.univr.it/handle/11562/959057 (accessed on 8 December 2024).
  87. Ni, L.; Li, Y.; Wang, X.; Zhang, J.; Yu, J.; Qi, C. Forecasting of Forex Time Series Data Based on Deep Learning. Procedia Comput. Sci. 2019, 147, 647–652. [Google Scholar] [CrossRef]
  88. Deepika, N.; Bhat, M.N. An Efficient Stock Market Prediction Method Based on Kalman Filter. J. Inst. Eng. India Ser. B 2021, 102, 629–644. [Google Scholar] [CrossRef]
  89. Li, Z.; Tam, V. A comparative study of a recurrent neural network and support vector machine for predicting price movements of stocks of different volatilites. In Proceedings of the 2017 IEEE Symposium Series on Computational Intelligence (SSCI), Honolulu, HI, USA, 27 November–1 December 2017; pp. 1–8. [Google Scholar] [CrossRef]
  90. Li, H.; Shen, Y.; Zhu, Y. Stock Price Prediction Using Attention-based Multi-Input LSTM. In Proceedings of the 10th Asian Conference on Machine Learning, PMLR, Beijing, China, 14–16 November 2018; pp. 454–469. Available online: https://proceedings.mlr.press/v95/li18c.html (accessed on 8 December 2024).
  91. Pang, X.; Zhou, Y.; Wang, P.; Lin, W.; Chang, V. Stock Market Prediction Based on Deep Long Short Term Memory Neural Network. In Proceedings of the 3rd International Conference on Complexity, Future Information Systems and Risk—COMPLEXIS; SciTePress: Setúbal, Portugal, 2024; pp. 102–108. Available online: https://www.scitepress.org/Link.aspx?doi=10.5220/0006749901020108 (accessed on 8 December 2024).
  92. Li, Z.; Yu, H.; Xu, J.; Liu, J.; Mo, Y. Stock Market Analysis and Prediction Using LSTM: A Case Study on Technology Stocks. Innov. Appl. Eng. Technol. 2023, 2, 1–6. [Google Scholar] [CrossRef]
  93. Xu, Y.; Keselj, V. Stock prediction using deep learning and sentiment analysis. In Proceedings of the IEEE International Conference on Big Data, Los Angeles, CA, USA, 9–12 December 2019; pp. 5573–5580. [Google Scholar] [CrossRef]
  94. Nabipour, M.; Nayyeri, P.; Jabani, H.; Mosavi, A.; Salwana, E. Deep Learning for Stock Market Prediction. Entropy 2020, 22, 840. [Google Scholar] [CrossRef]
  95. Thakkar, A.; Chaudhari, K. CREST: Cross-Reference to Exchange-based Stock Trend Prediction using Long Short-Term Memory. Procedia Comput. Sci. 2020, 167, 616–625. [Google Scholar] [CrossRef]
  96. Thakkar, A.; Chaudhari, K. Fusion in stock market prediction: A decade survey on the necessity, recent developments, and potential future directions. Inf. Fusion 2021, 65, 95–107. [Google Scholar] [CrossRef]
  97. Pinheiro, L.D.S.; Dras, M. Stock Market Prediction with Deep Learning: A Character-based Neural Language Model for Event-based Trading. In Proceedings of the Australasian Language Technology Association Workshop 2017, Brisbane, Australia, 6–8 December 2017; Wong, J.S.-M., Haffari, G., Eds.; pp. 6–15. Available online: https://aclanthology.org/U17-1001 (accessed on 8 December 2024).
  98. Wang, C.; Gao, Q. High and Low Prices Prediction of Soybean Futures with LSTM Neural Network. In Proceedings of the 2018 IEEE 9th International Conference on Software Engineering and Service Science (ICSESS), Beijing, China, 23–25 November 2018; pp. 140–143. [Google Scholar] [CrossRef]
  99. Lakshminarayanan, S.K.; McCrae, J. A Comparative Study of SVM and LSTM Deep Learning Algorithms for Stock Market Prediction. Available online: https://ceur-ws.org/Vol-2563/aics_41.pdf (accessed on 8 December 2024).
  100. Sun, T.; Wang, J.; Ni, J.; Cao, Y.; Liu, B. Predicting Futures Market Movement using Deep Neural Networks. In Proceedings of the 2019 18th IEEE International Conference on Machine Learning and Applications (ICMLA), Boca Raton, FL, USA, 16–19 December 2019; pp. 118–125. [Google Scholar] [CrossRef]
  101. Nikou, M.; Mansourfar, G.; Bagherzadeh, J. Stock price prediction using DEEP learning algorithm and its comparison with machine learning algorithms. Intell. Syst. Account. Financ. Manag. 2019, 26, 164–174. [Google Scholar] [CrossRef]
  102. Rana, M.; Uddin, M.; Hoque, M. Effects of Activation Functions and Optimizers on Stock Price Prediction using LSTM Recurrent Networks. In Proceedings of the CSAI2019: 2019 3rd International Conference on Computer Science and Artificial Intelligence, CSAI ’19, Normal, IL, USA, 6–8 December 2019; Association for Computing Machinery: New York, NY, USA, 2020; pp. 354–358. [Google Scholar] [CrossRef]
  103. Huynh, H.D.; Dang, L.M.; Duong, D. A New Model for Stock Price Movements Prediction Using Deep Neural Network. In Proceedings of the SoICT 2017: The Eighth International Symposium on Information and Communication Technology, SoICT ’17, Nha Trang City, Vietnam, 7–8 December 2017; Association for Computing Machinery: New York, NY, USA, 2017; pp. 57–62. [Google Scholar] [CrossRef]
  104. Chen, W.; Zhang, Y.; Yeo, C.K.; Lau, C.T.; Lee, B.S. Stock market prediction using neural network through news on online social networks. In Proceedings of the 2017 International Smart Cities Conference (ISC2), Wuxi, China, 14–17 September 2017; pp. 1–6. [Google Scholar] [CrossRef]
  105. Lin, X.; Yang, Z.; Song, Y. Intelligent stock trading system based on improved technical analysis and Echo State Network. Expert Syst. Appl. 2011, 38, 11347–11354. [Google Scholar] [CrossRef]
  106. Zhang, H.; Liang, J.; Chai, Z. Stock Prediction Based on Phase Space Reconstruction and Echo State Networks. J. Algorithms Comput. Technol. 2013, 7, 87–100. [Google Scholar] [CrossRef]
  107. Liu, Z.; Liu, Z.; Song, Y.; Gong, Z.; Chen, H. Predicting stock trend using multi-objective diversified Echo State Network. In Proceedings of the 2017 Seventh International Conference on Information Science and Technology (ICIST), Da Nang, Vietnam, 16–19 April 2017; pp. 181–186. [Google Scholar] [CrossRef]
  108. Samarawickrama, A.; Fernando, T. A recurrent neural network approach in predicting daily stock prices an application to the Sri Lankan stock market. In Proceedings of the 2017 IEEE International Conference on Industrial and Information Systems (ICIIS), Peradeniya, Sri Lanka, 15–16 December 2017; pp. 1–6. [Google Scholar] [CrossRef]
  109. Hsieh, T.-J.; Hsiao, H.-F.; Yeh, W.-C. Forecasting stock markets using wavelet transforms and recurrent neural networks: An integrated system based on artificial bee colony algorithm. Appl. Soft Comput. 2011, 11, 2510–2525. [Google Scholar] [CrossRef]
  110. Karaboga, D.; Basturk, B. A powerful and efficient algorithm for numerical function optimization: Artificial bee colony (ABC) algorithm. J. Glob. Optim. 2007, 39, 459–471. [Google Scholar] [CrossRef]
  111. Chaudhari, K.; Thakkar, A. Travelling Salesman Problem: An Empirical Comparison Between ACO, PSO, ABC, FA and GA. In Emerging Research in Computing, Information, Communication and Applications—ERCICA 2018; Shetty, N.R., Patnaik, L.M., Nagaraj, H.C., Hamsavath, P.N., Nalini, N., Eds.; Springer: Singapore, 2019; pp. 397–405. [Google Scholar] [CrossRef]
  112. Corizzo, R.; Rosen, J. Stock market prediction with time series data and news headlines: A stacking ensemble approach. J. Intell. Inf. Syst. 2024, 62, 27–56. [Google Scholar] [CrossRef]
  113. Chong, E.; Han, C.; Park, F.C. Deep learning networks for stock market analysis and prediction: Methodology, data representations, and case studies. Expert Syst. Appl. 2017, 83, 187–205. [Google Scholar] [CrossRef]
  114. Ma, Y.; Han, R. Research on Stock Trading Strategy Based on Deep Neural Network. In Proceedings of the 2018 18th International Conference on Control, Automation and Systems (ICCAS), PyeongChang, Republic of Korea, 17–20 October 2018; pp. 92–96. Available online: https://ieeexplore.ieee.org/abstract/document/8571531 (accessed on 8 December 2024).
  115. Nakagawa, K.; Uchida, T.; Aoshima, T. Deep Factor Model. In Proceedings of the ECML PKDD 2018 Workshops, Dublin, Ireland, 10–14 September 2018; Alzate, C., Monreale, A., Bioglio, L., Bitetta, V., Bordino, I., Caldarelli, G., Ferretti, A., Guidotti, R., Gullo, F., Pascolutti, S., et al., Eds.; Springer International Publishing: Cham, Switzerland, 2019; pp. 37–50. [Google Scholar] [CrossRef]
  116. Wu, Y.; Fu, Z.; Liu, X.; Bing, Y. A hybrid stock market prediction model based on GNG and reinforcement learning. Expert Syst. Appl. 2023, 228, 120474. [Google Scholar] [CrossRef]
  117. Naik, N.; Mohan, B.R. Stock Price Movements Classification Using Machine and Deep Learning Techniques—The Case Study of Indian Stock Market. In Engineering Applications of Neural Networks; Macintyre, J., Iliadis, L., Maglogiannis, I., Jayne, C., Eds.; Springer International Publishing: Cham, Switzerland, 2019; pp. 445–452. [Google Scholar] [CrossRef]
  118. Li, Q.; Chen, Y.; Jiang, L.L.; Li, P.; Chen, H. A Tensor-Based Information Framework for Predicting the Stock Market. ACM Trans. Inf. Syst. 2016, 34, 11:1–11:30. [Google Scholar] [CrossRef]
  119. Song, Y.; Lee, J.W.; Lee, J. A study on novel filtering and relationship between input-features and target-vectors in a deep learning model for stock price prediction. Appl. Intell. 2019, 49, 897–911. [Google Scholar] [CrossRef]
  120. Abe, M.; Nakayama, H. Deep Learning for Forecasting Stock Returns in the Cross-section. In Advances in Knowledge Discovery and Data Mining; Phung, D., Tseng, V.S., Webb, G.I., Ho, B., Ganji, M., Rashidi, L., Eds.; Springer International Publishing: Cham, Switzerland, 2018; pp. 273–284. [Google Scholar] [CrossRef]
  121. Liang, Q.; Rong, W.; Zhang, J.; Liu, J.; Xiong, Z. Restricted Boltzmann machine based stock market trend prediction. In Proceedings of the 2017 International Joint Conference on Neural Networks (IJCNN), Anchorage, AK, USA, 14–19 May 2017; pp. 1380–1387. [Google Scholar] [CrossRef]
  122. Vullam, N.; Yakubreddy, K.; Vellela, S.S.; Sk, K.B.; B., V.R.; Priya, S.S. Prediction and Analysis Using a Hybrid Model for Stock Market. In Proceedings of the 2023 3rd International Conference on Intelligent Technologies (CONIT), Hubli, India, 23–25 June 2023; pp. 1–5. [Google Scholar] [CrossRef]
  123. Cai, X.; Hu, S.; Lin, X. Feature extraction using Restricted Boltzmann Machine for stock price prediction. In Proceedings of the 2012 IEEE International Conference on Computer Science and Automation Engineering (CSAE), Zhangjiajie, China, 25–27 May 2012; pp. 80–83. [Google Scholar] [CrossRef]
  124. Zhang, R.; Shen, F.; Zhao, J. A model with Fuzzy Granulation and Deep Belief Networks for exchange rate forecasting. In Proceedings of the 2014 International Joint Conference on Neural Networks (IJCNN), Beijing, China, 6–11 July 2014; pp. 366–373. [Google Scholar] [CrossRef]
  125. Shen, F.; Chao, J.; Zhao, J. Forecasting exchange rate using deep belief networks and conjugate gradient method. Neurocomputing 2015, 167, 243–253. [Google Scholar] [CrossRef]
  126. Shilpa, B.L.; Shambhavi, B.R. Combined deep learning classifiers for stock market prediction: Integrating stock price and news sentiments. Kybernetes 2021, 52, 748–773. [Google Scholar] [CrossRef]
  127. Bhardwaj, A.; Narayan, Y.; Vanraj; Pawan; Dutta, M. Sentiment Analysis for Indian Stock Market Prediction Using Sensex and Nifty. Procedia Comput. Sci. 2015, 70, 85–91. [Google Scholar] [CrossRef]
  128. Guresen, E.; Kayakutlu, G.; Daim, T.U. Using artificial neural network models in stock market index prediction. Expert Syst. Appl. 2011, 38, 10389–10397. [Google Scholar] [CrossRef]
  129. Ranco, G.; Aleksovski, D.; Caldarelli, G.; Grčar, M.; Mozetič, I. The Effects of Twitter Sentiment on Stock Price Returns. PLoS ONE 2015, 10, e0138441. [Google Scholar] [CrossRef]
  130. Lugmayr, A.; Gossen, G. Evaluation of methods and techniques for language based sentiment analysis for dax 30 stock exchange—A first concept of a ‘LUGO’ sentiment indicator. In Proceedings of the 5th International Workshop on Semantic Ambient Media Experience, SAME 2012, in Conjunction with Pervasive 2012, Newcastle, UK, 18 June 2012; pp. 69–76. [Google Scholar]
  131. Zhang, Y.; Wu, L. Stock market prediction of S&P 500 via combination of improved BCO approach and BP neural network. Expert Syst. Appl. 2009, 36, 8849–8854. [Google Scholar] [CrossRef]
  132. Makrehchi, M.; Shah, S.; Liao, W. Stock Prediction Using Event-Based Sentiment Analysis. In Proceedings of the 2013 IEEE/WIC/ACM International Joint Conferences on Web Intelligence (WI) and Intelligent Agent Technologies (IAT), Atlanta, GA, USA, 17–20 November 2013; pp. 337–342. [Google Scholar] [CrossRef]
  133. Bustos, O.; Pomares, A.; Gonzalez, E. A comparison between SVM and multilayer perceptron in predicting an emerging financial market: Colombian stock market. In Proceedings of the 2017 Congreso Internacional de Innovacion y Tendencias en Ingenieria (CONIITI), Bogota, Colombia, 4–6 October 2017; pp. 1–6. [Google Scholar] [CrossRef]
  134. Huang, C.-F.; Li, H.-C. An Evolutionary Method for Financial Forecasting in Microscopic High-Speed Trading Environment. Comput. Intell. Neurosci. 2017, 2017, 9580815. [Google Scholar] [CrossRef]
  135. Zhou, P.-Y.; Chan, K.C.C.; Ou, C.X. Corporate Communication Network and Stock Price Movements: Insights from Data Mining. IEEE Trans. Comput. Soc. Syst. 2018, 5, 391–402. [Google Scholar] [CrossRef]
  136. Hagenau, M.; Liebmann, M.; Hedwig, M.; Neumann, D. Automated News Reading: Stock Price Prediction Based on Financial News Using Context-Specific Features. In Proceedings of the 2012 45th Hawaii International Conference on System Sciences, Maui, HI, USA, 4–7 January 2012; pp. 1040–1049. [Google Scholar] [CrossRef]
  137. Stock Market Prediction Using Machine Learning Techniques: A Decade Survey on Methodologies, Recent Developments, and Future Directions. Available online: https://www.mdpi.com/2079-9292/10/21/2717 (accessed on 8 December 2024).
  138. Rahman, A.S.A.; Abdul-Rahman, S.; Mutalib, S. Mining Textual Terms for Stock Market Prediction Analysis Using Financial News. In Soft Computing in Data Science; Mohamed, A., Berry, M.W., Yap, B.W., Eds.; Springer: Singapore, 2017; pp. 293–305. [Google Scholar] [CrossRef]
  139. Ding, X.; Zhang, Y.; Liu, T.; Duan, J. Knowledge-Driven Event Embedding for Stock Prediction. In Proceedings of the COLING 2016, the 26th International Conference on Computational Linguistics: Technical Papers; Matsumoto, Y., Prasad, R., Eds.; The COLING 2016 Organizing Committee: Osaka, Japan, 2016; pp. 2133–2142. Available online: https://aclanthology.org/C16-1201 (accessed on 8 December 2024).
  140. Evaluating Sentiment in Financial News Articles—ScienceDirect. Available online: https://www.sciencedirect.com/science/article/abs/pii/S0167923612000875?via%3Dihub (accessed on 8 December 2024).
  141. Huang, C.-J.; Liao, J.-J.; Yang, D.-X.; Chang, T.-Y.; Luo, Y.-C. Realization of a news dissemination agent based on weighted association rules and text mining techniques. Expert Syst. Appl. 2010, 37, 6409–6413. [Google Scholar] [CrossRef]
  142. Sentiment Analysis of Twitter Data for Predicting Stock Market Movements|IEEE Conference Publication|IEEE Xplore. Available online: https://ieeexplore.ieee.org/abstract/document/7955659 (accessed on 8 December 2024).
  143. Pandarachalil, R.; Sendhilkumar, S.; Mahalakshmi, G.S. Twitter Sentiment Analysis for Large-Scale Data: An Unsupervised Approach. Cogn. Comput. 2015, 7, 254–262. [Google Scholar] [CrossRef]
  144. Nguyen, T.H.; Shirai, K.; Velcin, J. Sentiment analysis on social media for stock movement prediction. Expert Syst. Appl. 2015, 42, 9603–9611. [Google Scholar] [CrossRef]
  145. Bollacker, K.; Evans, C.; Paritosh, P.; Sturge, T.; Taylor, J. Freebase: A collaboratively created graph database for structuring human knowledge. In Proceedings of the 2008 ACM SIGMOD international conference on Management of data, in SIGMOD ’08, Vancouver, BC, Canada, 9–12 June 2008; Association for Computing Machinery: New York, NY, USA, 2008; pp. 1247–1250. [Google Scholar] [CrossRef]
  146. Weng, B.; Ahmed, M.A.; Megahed, F.M. Stock market one-day ahead movement prediction using disparate data sources. Expert Syst. Appl. 2017, 79, 153–163. [Google Scholar] [CrossRef]
  147. Forecasting to Classification: Predicting the Direction of Stock Market Price Using Xtreme Gradient Boosting. ResearchGate. Available online: https://www.researchgate.net/publication/309492895_Forecasting_to_Classification_Predicting_the_direction_of_stock_market_price_using_Xtreme_Gradient_Boosting (accessed on 12 December 2024).
  148. Google Stock Prices Prediction Using Deep Learning|IEEE Conference Publication|IEEE Xplore. Available online: https://ieeexplore.ieee.org/abstract/document/9265146 (accessed on 12 December 2024).
  149. IASC|Enhancing the Classification Accuracy in Sentiment Analysis with Computational Intelligence Using Joint Sentiment Topic Detection with MEDLDA. Available online: https://www.techscience.com/iasc/v26n1/39857 (accessed on 8 December 2024).
  150. Hossin, M.; Sulaiman, M.N. A Review on Evaluation Metrics for Data Classification Evaluations. Int. J. Data Min. Knowl. Manag. Process. 2015, 5, 1–11. [Google Scholar] [CrossRef]
  151. Huang, J.; Ling, C. Using AUC and accuracy in evaluating learning algorithms. IEEE Trans. Knowl. Data Eng. 2005, 17, 299–310. [Google Scholar] [CrossRef]
  152. Nti, I.K.; Adekoya, A.F.; Weyori, B.A. A comprehensive evaluation of ensemble learning for stock-market prediction. J. Big Data 2020, 7, 20. [Google Scholar] [CrossRef]
  153. Stock Price Prediction Using News Sentiment Analysis|IEEE Conference Publication|IEEE Xplore. Available online: https://ieeexplore.ieee.org/abstract/document/8848203 (accessed on 8 December 2024).
  154. de Oliveira, F.A.; Nobre, C.N.; Zárate, L.E. Applying Artificial Neural Networks to prediction of stock price and improvement of the directional prediction index—Case study of PETR4, Petrobras, Brazil. Expert Syst. Appl. 2013, 40, 7596–7606. [Google Scholar] [CrossRef]
Figure 1. Framework of this paper.
Appliedmath 05 00076 g001
Figure 2. A generalized CNN structure.
Appliedmath 05 00076 g002
Figure 3. Taxonomy of the evaluation metrics.
Appliedmath 05 00076 g003
Disclaimer/Publisher’s Note: The statements, opinions and data contained in all publications are solely those of the individual author(s) and contributor(s) and not of MDPI and/or the editor(s). MDPI and/or the editor(s) disclaim responsibility for any injury to people or property resulting from any ideas, methods, instructions or products referred to in the content.

