Abstract
Background/Objective: Predicting pharmacological response in cancer remains a key challenge in precision oncology due to intertumoral heterogeneity and the complexity of drug–gene interactions. While machine learning models using multi-omics data have shown promise in predicting pharmacological response, selecting the features with the highest predictive power critically affects model performance and biological interpretability. This study aims to compare computational and biologically informed gene selection strategies for predicting drug response in cancer cell lines and to propose a feature selection strategy that optimizes performance. Methods: Using gene expression and drug response data, we trained models on both data-driven and biologically informed gene sets based on the drug target pathways to predict IC50 values for seven anticancer drugs. Several feature selection methods were tested on gene expression profiles of cancer cell lines, including Recursive Feature Elimination (RFE) with Support Vector Regression (SVR) against gene sets derived from drug-specific pathways in KEGG and CTD databases. The predictability was comparatively analyzed using both AUC and IC50 values and further assessed on proteomics data. Results: RFE with SVR outperformed other computational methods, while pathway-based gene sets showed lower performance compared to data-driven methods. The integration of computational and biologically informed gene sets consistently improved prediction accuracy across several anticancer drugs, while the predictive value of the corresponding proteomic features was significantly lower compared with the mRNA profiles. Conclusions: Integrating biological knowledge into feature selection enhances both the accuracy and interpretability of drug response prediction models. Integrative approaches offer a more robust and generalizable framework with potential applications in biomarker discovery, drug repurposing, and personalized treatment strategies.
1. Introduction
Despite advances in oncology, timely, targeted, and effective treatment is still a major challenge due to the high heterogeneity among cancer types/stages, but also among individual patients. Precision medicine emerges as a promising approach that proposes solutions for targeted therapeutic strategies tailored to each oncology patient. In cancer therapeutics, predicting pharmacological responses and adjusting treatment protocols, dosages and timing for each individual patient remains critical for enhancing therapeutic efficacy and minimizing severe adverse effects.
Over the years, several strategies have been employed to personalize cancer treatment. Clinically established methods rely on genetic and biochemical biomarkers [1,2,3,4,5,6,7]. More recent approaches utilize high-throughput molecular data, such as mRNAs, non-coding RNAs, epigenetic modifications, proteomics, metabolomics, and cfDNA, to identify predictive markers [1,7,8,9,10,11,12,13,14]. These data-driven approaches require advanced analytical tools, including cheminformatics for drug repurposing, pharmacokinetic profiling and prediction of cancer type sensitivity or resistance to drugs [15,16,17,18,19,20], and differential analysis for identifying molecular features distinguishing responders from non-responders [21,22,23,24,25,26,27]. To this end, AI-based approaches are particularly valuable for leveraging the rapidly expanding volume of cancer-related data and predicting pharmacological response.
Machine learning (ML) has emerged as a key tool in pharmacogenomics, offering applications in drug response prediction, cancer diagnosis, prognosis, and staging assessment [28,29,30]. Numerous studies have applied ML for predicting drug response in cancer [31]. Zhu and Dupuy (2022) identified pathways linked to drug response and resistance to BRAFV600 inhibitors in melanoma [32], while Kim et al. (2018) focused on resistance development to taxanes [33]. Sotudian and Paschalidis (2022) used gene expression data from 173 cancer cell lines to predict responses to 100 drugs [34], and Ma et al. (2022) incorporated both gene expression and chemical structure features for IC50 prediction [35]. Finally, Kardamiliotis et al. utilized gene alteration patterns (mutations, expression, and copy number variations—CNVs) from drug-sensitive and drug-resistant cancer cell lines and by computing an interaction score, identified biomarkers capable of predicting whether a cancer cell line is likely to respond to a given anticancer drug [36].
Although ML applications in pharmacogenomics are rapidly growing [31,37,38,39,40,41,42,43], most efforts employ classification models distinguishing responders from non-responders, on a wide variety of feature selection strategies. For example, a regression-based approach was used by Muhammad et al. (2024) to predict IC50 values from gene expression data, applying Select K Best for feature selection [44]. Li et al. (2021) followed a similar path, predicting IC50 values for 320 drugs using the GA/KNN algorithm [45], while Scarborough et al. (2023) identified significant genes by performing differential expression analysis between cisplatin-sensitive and -resistant cell lines using limma, SAM, and multtest, followed by co-expression filtering, and employed these genes to predict IC50 values via ML approaches [46].
Several other feature selection methodologies have been used, including filter methods such as F-score, ANOVA, and mutual information [47,48,49,50,51,52,53,54,55,56,57,58,59], wrapper methods such as SVM-RFE [50,51,52] and embedded methods like LASSO and Random Forest based on feature importance scores [52,53]. In addition, several other feature selection algorithms have been used in precision medicine applications, including bABER, Auto-HMM-LMF, GFFS, ReliefF, and mRMR [47,54,55,56]. However, only a few studies have explored the predictive value of biologically informed features. Parca et al. (2019) selected genes based on the expression variability between drug-sensitive and drug-resistant cells and on drug target interaction networks [57]. Similarly, Koras et al. compared ML-based automated feature selection with biologically guided methods using known drug targets [54], while Shin et al. selected 2369 genes involved in a total of 34 cancer-related pathways for training predictive models [58].
Despite the growing research interest in ML and its expanding application in predicting pharmacological responses in cancer—both in clinical and in in vitro settings—there is still no consensus on the optimal feature selection methodology. Moreover, the exploration of biologically informed feature selection strategies remains limited, while integrative approaches combining biological knowledge with computational methods are notably underrepresented.
This study aims to compare data-driven feature selection approaches with features derived from domain knowledge, to explore potential overlapping and predictability, and ultimately to develop optimized ML models capable of predicting the pharmacological response of cancer cell lines to a range of drugs. Additionally, the study aims to evaluate the transferability of predictive models across different omics data levels, specifically from transcriptomic to proteomic data.
2. Materials and Methods
Seven anticancer drugs were selected based on the following criteria: All drugs are targeted therapies with defined molecular targets and signaling pathways, allowing correlation between gene expression and drug response, extensive response data across diverse cancer cell lines are available, and are either FDA-approved or in advanced clinical trials, ensuring clinical relevance. The selection also covers key signaling pathways to support biologically interpretable feature selection. The drugs that met the inclusion criteria are shown in Table 1.
To determine the most appropriate pharmacological response metric for model training, both IC50 and AUC values were evaluated. IC50 values were retrieved from the GDSC database [59]. The Genomics of Drug Sensitivity in Cancer (GDSC) is a publicly available pharmacogenomic resource that integrates large-scale drug screening data with genomic profiles of human cancer cell lines. GDSC provides dose–response curves, IC50 and AUC values for hundreds of anticancer agents tested across more than 1000 cell lines, along with corresponding genomic and transcriptomic data. In this study, we used the curated IC50 values of the GDSC1 and GDSC2 releases to systematically link molecular features with pharmacological response across a wide range of cancer types. The GDSC dose–response curves are generated by fitting a sigmoidal curve to cell viability measurements across a range of drug concentrations. The IC50 corresponds to the concentration that reduces viability by 50% and is transformed by taking the natural logarithm of the raw micromolar concentrations. No further modifications were applied to obtain the original data that were used to train the models. AUC values were also retrieved from the GDSC, where AUC represents the normalized area under the entire dose–response curve (scaled between 0 and 1), reflecting the overall drug efficacy across tested concentrations. Retrieving IC50 and AUC data directly from the GDSC database ensures systematic assessment using standardized experimental protocols. No additional IC50 or AUC data from other sources were used.
Gene expression data were retrieved using the PharmacoGX R package GDSC_2020 (v2-8.2) [60]. All microarray-based gene expression profiles were log-transformed using the Robust Multi-array Average (RMA) method that includes background correction, quantile normalization, and summarization [60,61,62,63,64,65]. Gene expression data were obtained from 1084 cancer cell lines and 17,611 genes. Data from PharmacoGX were selected over other sources due to the higher number of genes included, the greater overlap with cell lines for which IC50 data were available for the selected drugs, and the common preprocessing and curation steps that had already been applied to the dataset. The final number of matched cell lines is shown in Table 1.

Table 1.
Drugs included in the study and number of cancer cell lines for which data were retrieved for each drug. Drug: Name of the drug included in the study, Pharmacological target: The primary molecular target(s) of the drug, Indications: Cancer types or conditions for which the drug is clinically indicated, Known biomarkers: Genetic or molecular markers associated with drug response for each drug, Drug-related references: Literature references providing information on the drugs’ pharmacological targets/indications/biomarkers, GDSC version: Version of the Genomics of Drug Sensitivity in Cancer (GDSC) database from which IC50 and related data were obtained, Number of cell lines with assigned IC50 values: Number of cell lines for which IC50 values were available from GDSC for the corresponding drug.
| Drug | Pharmacological Target | Indications | Known Biomarkers | Drug-Related References | GDSC Version | Number of Cell Lines with Assigned IC50 Values |
|---|---|---|---|---|---|---|
| Afatinib | EGFR, ERBB2 | NSCLC | EGFR mutations | [66,67,68] | GDSC2 | 866 |
| Capivasertib | AKT (PI3K/MTOR signaling) | Breast Cancer | HER2, PIK3CA, AKT1, PTEN | [66,69,70,71,72] | GDSC1 | 838 |
| Dabrafenib | BRAF | LGG, Melanoma, Metastatic anaplastic thyroid cancer, NSCLC | BRAF (BRAF V600 mutation) | [66,73,74,75,76] | GDSC2 | 856 |
| Gefitinib | EGFR | NSCLC | EGFR, ABCB1, CYP2D6, IKBKB, KIAA1429, FGL1 | [66,77,78,79,80] | GDSC2 | 858 |
| Nutlin-3a | MDM2 | - | p53, KRAS, MDM4, p73 | [66,81,82,83] | GDSC2 | 868 |
| Osimertinib | EGFR | NSCLC | EGFR | [66,84,85,86,87] | GDSC2 | 857 |
| Palbociclib | CDK4/6 | Breast Cancer | ERBB2, ESR1, ESR2, PGR, CCND1 amplification, CDKN2A loss | [61,66,80,88,89] | GDSC2 | 868 |
A variety of machine learning algorithms were explored to identify the most suitable for training predictive models, including: Support Vector Regression (SVR), Categorical Boosting Regressor (CatBoostRegressor), Decision Tree Regressor, Gradient Boosted Decision Trees Regressor (GradientBoostingRegressor), Histogram-Based Gradient Boosting Regressor (HistGradientBoostingRegressor), k-Nearest Neighbors Regressor (KNN), Least Absolute Shrinkage and Selection Operator Regression (Lasso), Light Gradient Boosting Machine Regressor (LGBMRegressor), Linear Regression (LR), Random Forest Regressor and Extreme Gradient Boosting Regressor (XGBoost). Overall, based on the comparative analysis (Supplementary Materials), Linear Regression was selected as the most appropriate algorithm for training the final predictive models.
To train and evaluate the predictive models, two validation strategies were considered: an 80/20 train-test split and 5-fold cross-validation. Both approaches were tested for model training and evaluation. The train-test split approach was ultimately selected, as it yielded better overall performance and required lower computational resources [65].
To identify the most suitable feature selection approach, two computational methods were compared: Recursive Feature Elimination (RFE) with a Linear Regression estimator and SelectKBest with Mutual Information Regression. Based on the predictive performance of the resulting models, RFE consistently outperformed SelectKBest and was therefore selected for subsequent analyses (Supplementary Materials).
To assess the effect of the underlying model on feature selection performance, Recursive Feature Elimination (RFE) was applied using two different estimators: Linear Regression and Support Vector Regression (SVR). RFE with the SVR estimator consistently produced models with superior predictive performance across all drugs and was therefore selected for subsequent analyses (Supplementary Materials). A linear kernel was selected to ensure compatibility with RFE, which requires models with accessible coefficient weights. Τhe SVR was run with the default hyperparameters: C = 1.0, epsilon = 0.1, and gamma = scale. These settings were consistently applied across all drugs.
To train the most efficient models, first an exploratory feature selection step was applied on the complete set of input features (17,611 genes), and this was progressively reduced to the top 1000 genes. Subsequently, an iterative selection step was conducted starting with the top 1000 genes, removing one feature at each step and training the corresponding model at each iteration.
For the biologically derived feature selection, we used the biological pathways that represent the pharmacological targets of each drug, as defined by the KEGG database [90]. To incorporate all relevant domain knowledge, the genes involved in each biological pathway were retrieved from KEGG and The Comparative Toxicogenomics Database (CTD).
Finally, an integrative approach called BEACON (Biological EnhAncement of COmputation methods for feature selectioN) was developed, which combines data-driven feature selection methods with biological evidence derived from drug-target pathways (Figure 1).

Figure 1.
BEACON methodology.
BEACON applies data-driven feature selection techniques to identify the subset of genes that yields the most efficient predictive model and incorporates the genes involved in the drug’s target biological pathway. Finally, a second round of computational feature selection is applied on the expanded gene set.
To evaluate the transferability of the predictive models across different omics data levels, we used proteomic data originating from the study “Proteomic profiling across breast cancer cell lines and models” [91], which includes protein quantifications for 60 breast cancer cell lines. Quantification was performed using Tandem Mass Tag (TMT) labeling combined with LC-MS/MS, while batch normalization was implemented through the use of bridge samples. Initially, 12,485 proteins were identified, including isoforms and protein fragments. After the removal of isoforms and fragments, data corresponding to 10,454 unique genes/proteins were obtained. Among these, 6139 genes overlapped with the gene expression dataset. For each drug, the common genes between gene expression data and proteomic data were identified. A predictive model of pharmacological response was trained exclusively using gene expression data, which was subsequently tested on the matched proteomic data, using the raw and Z-standardized values.
The evaluation of the trained predictive models was conducted R2 (Coefficient of Determination) [92,93] and RMSE (Root Mean Squared Error) [92,94].
The R2 score is computed in scikit-learn using the following formula:
where SSRES is Residual Sum of Squares and SSTOTT is the Total Sum of Squares.
R2 = 1 − (SSRES/SSTOT),
Data preprocessing, data visualization, retrieval of gene expression data, and extraction of pathway-related genes were implemented in R (v 4.3.3). Feature selection, model training, and model evaluation were built in the scikit-learn Python library (v 1.6.1) [92]. Venn Diagrams were built using the jvenn tool (v.1) [95].
3. Results
3.1. Comparative Predictive Value of IC50 and AUC
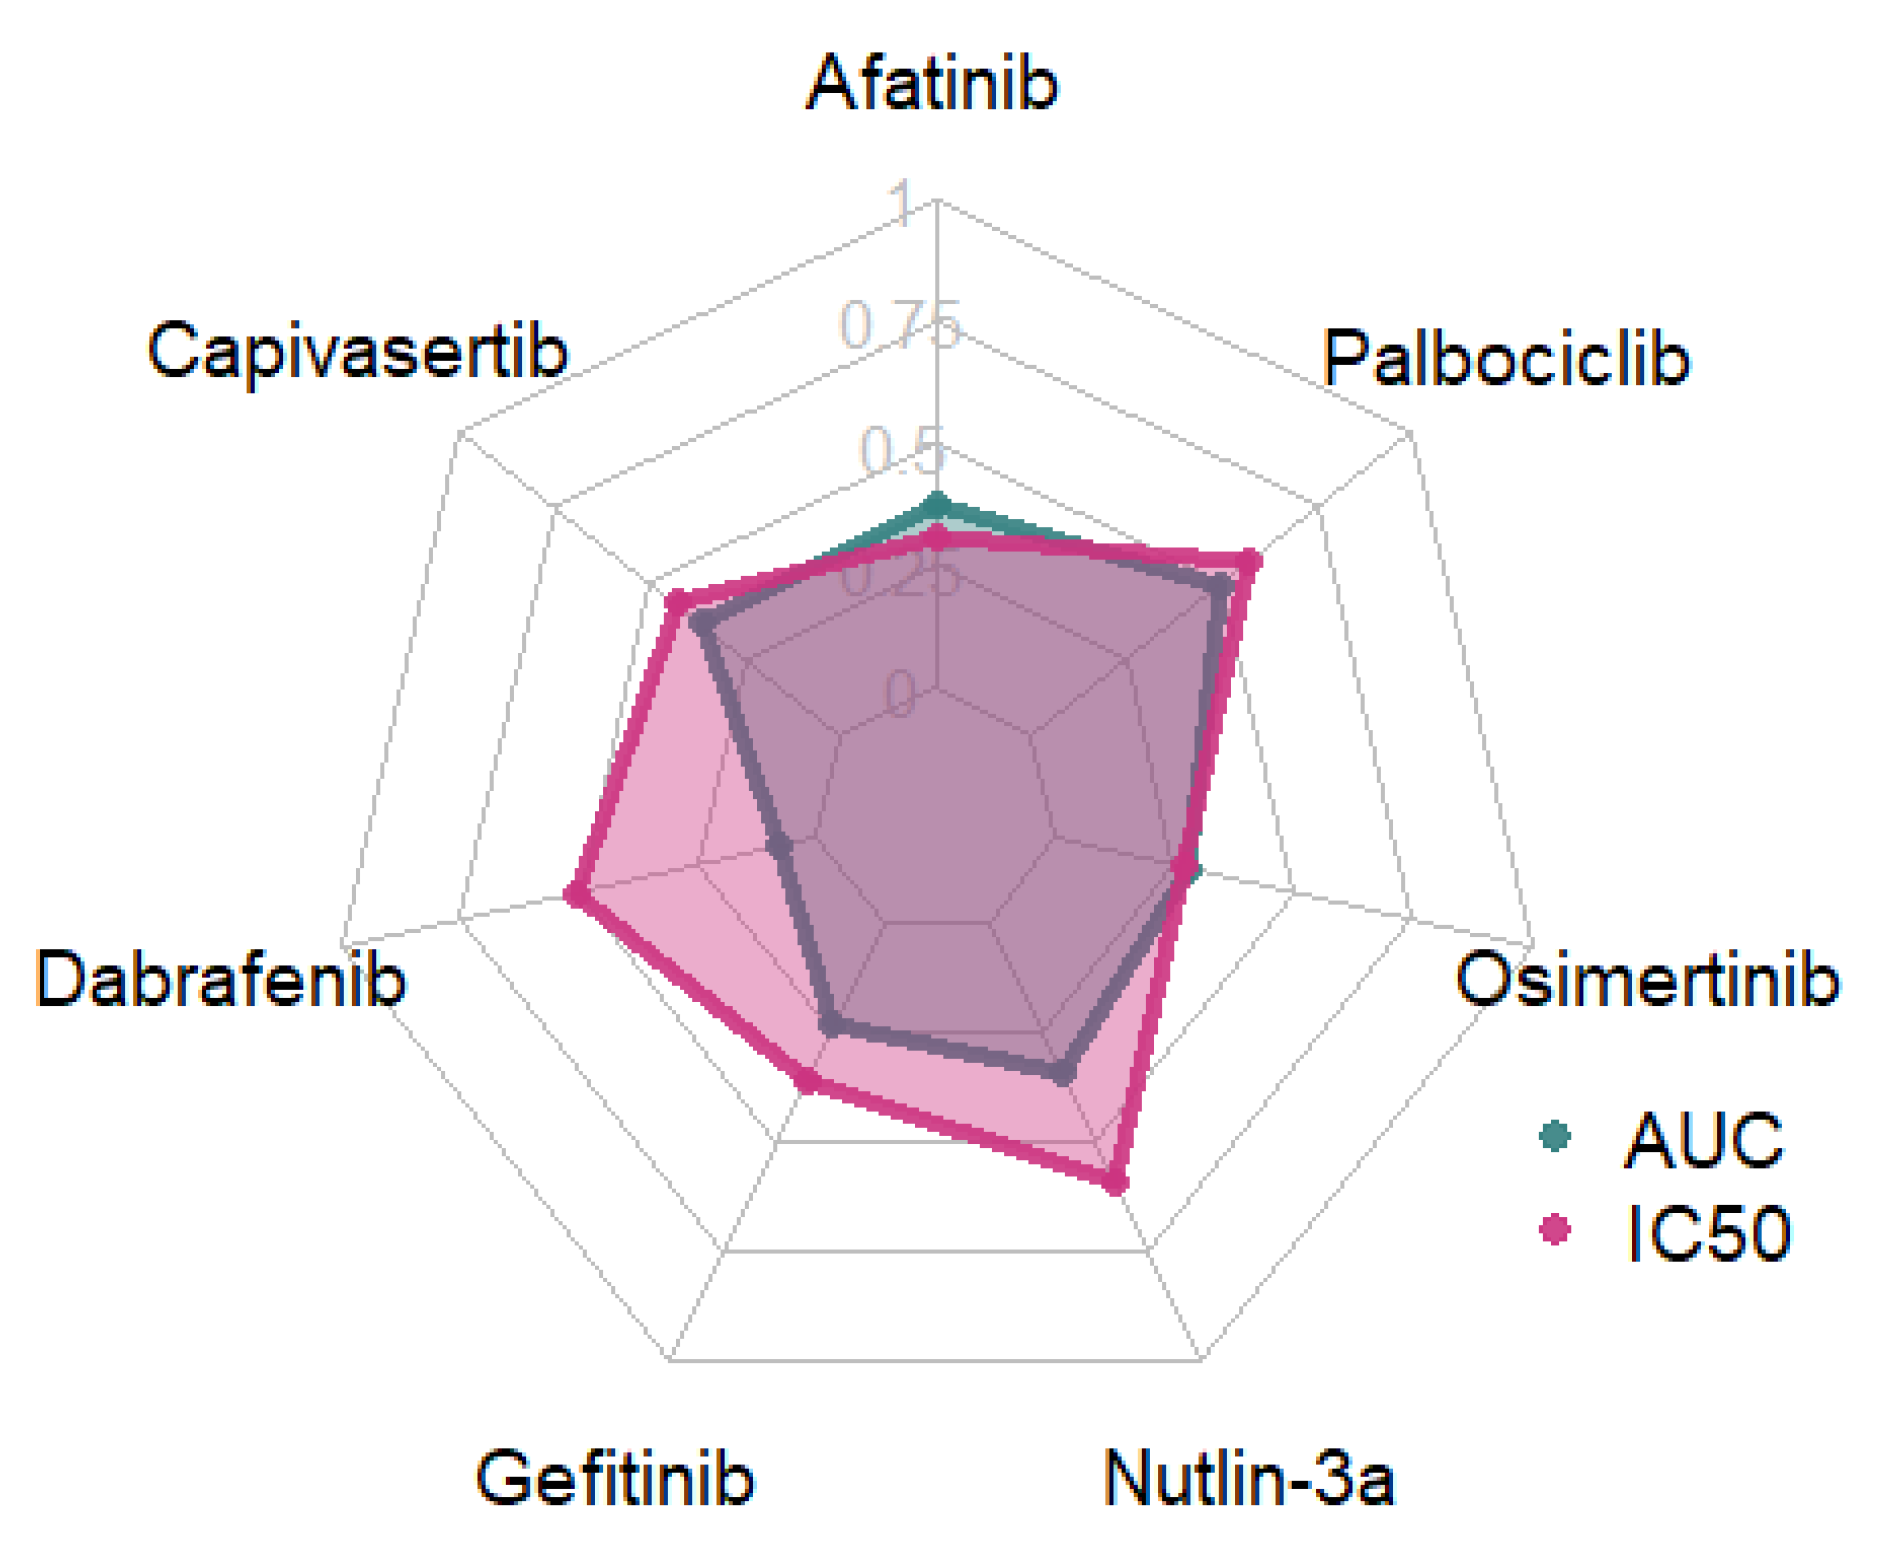
To determine the most suitable response variable for modeling the pharmacological response of cancer cell lines to individual drugs, we conducted a comparative analysis of the IC50 and AUC values. Feature selection was performed using Recursive Feature Elimination (RFE) with a Linear Regression estimator, followed by a Linear Regressor (Figure 2).
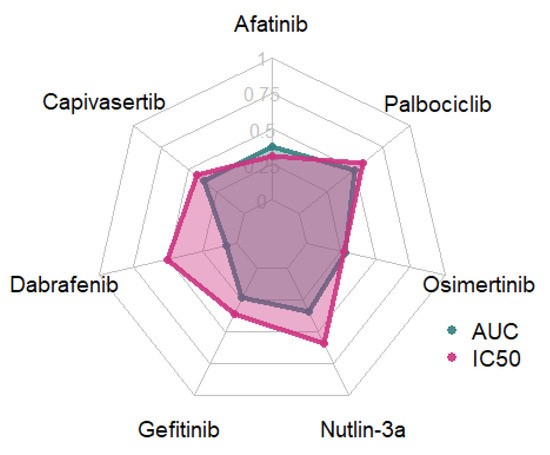
Figure 2.
R2-values for models trained using AUC and IC50 values.
Models trained using IC50 response variables consistently outperformed those based on AUC, except for Afatinib, for which the AUC-based model demonstrated slightly superior performance, and Osimertinib, where IC50 and AUC models exhibited comparable predictive power. IC50 was therefore selected as the target variable for all subsequent analyses.
3.2. Comparison of Feature Selection Strategies
Each drug was assigned to KEGG and CTD biological pathways based on its mechanism of action (Table 2). The ErbB, MAPK, and PI3K-Akt signaling pathways are central regulators of cell proliferation, survival, and differentiation, and their dysregulation is commonly implicated in various cancers. Activation of the ErbB receptor family, particularly EGFR (ErbB1), triggers downstream cascades including the MAPK and PI3K-Akt pathways, promoting oncogenic signaling. Aberrant activation of these pathways contributes to EGFR tyrosine kinase inhibitor (TKI) resistance, a major clinical challenge in targeted cancer therapies. Additionally, the p53 pathway, a critical tumor suppressor network, often becomes inactivated in cancer through mutations or dysregulation by the ubiquitin-proteasome system, impairing DNA damage response and apoptosis.

Table 2.
Number of genes in each biological pathway and drugs whose action is related to each pathway.
For all pathways, there was an overlap of at least 90% of the genes included in the KEGG and CTD. Furthermore, the number of genes associated with most biological pathways shows no substantial deviation, except for the Cancer pathway, where KEGG includes a markedly higher number of genes. Finally, although KEGG lists the “EGFR tyrosine kinase inhibitor resistance” pathway as relevant to the mechanisms of action of Gefitinib and Osimertinib, it does not provide corresponding gene-level data for this pathway.
3.2.1. Data-Driven Feature Selection Methods vs. KEGG Biologically Derived Features
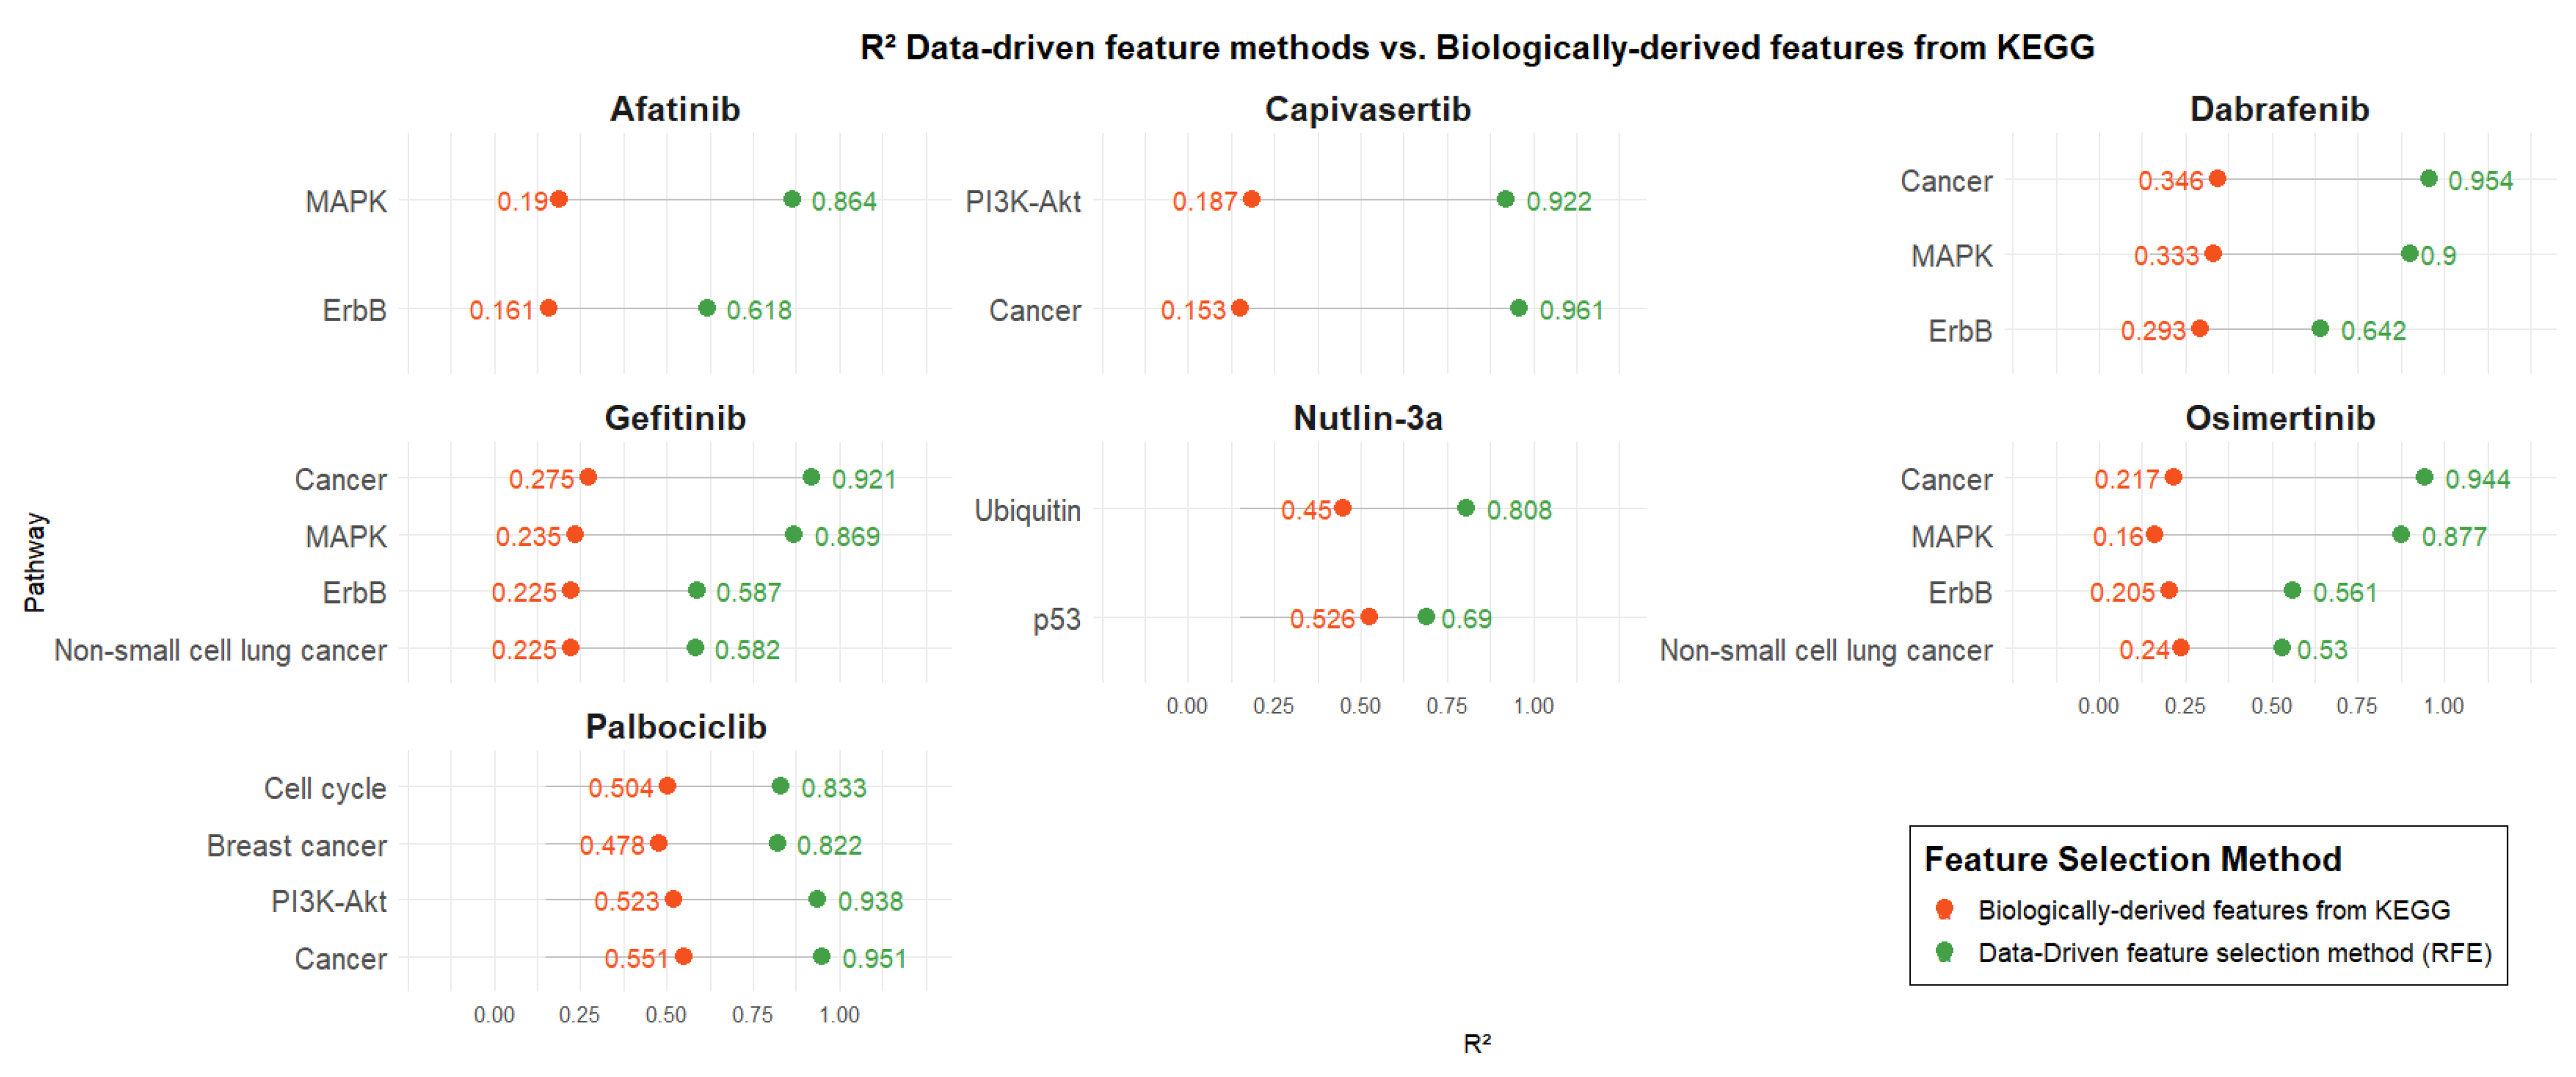
Figure 3 presents the R2 values of predictive models developed using two distinct gene selection strategies: biologically informed pathways related to each drug’s mechanism of action (retrieved from KEGG) and data-driven selection via RFE. For each drug, models were trained using the same number of genes in both approaches to ensure a fair comparison (number of genes associated with each pathway is presented in Table 3). Pathway-based models were trained using SVR, except for the Nutlin-3a model based on the Ubiquitin pathway, which was trained using Linear Regression.
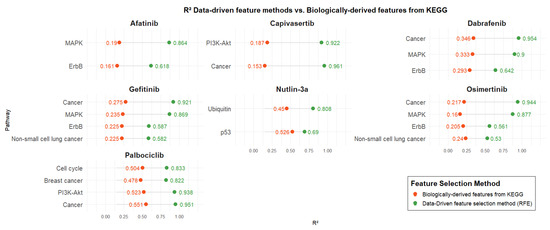
Figure 3.
Comparison of the data-driven feature methods vs. pathway-guided features from KEGG.

Table 3.
Biological Pathways and Feature Selection Algorithms Applied for Each Drug in BEACON.
Across all drugs, models developed using data-driven feature selection consistently outperformed those based solely on biological pathways, regardless of the specific pathway or the number of genes it contained. Biologically derived models for Afatinib exhibited poor performance with R2 values around 0.2, whereas the corresponding data-driven models showed significantly enhanced performance, with R2 values exceeding 0.6 and reaching up to 0.86. Similar performance levels (R2: ~0.2) were observed for the biologically informed models of Capivasertib, Gefitinib, Osimertinib, and Dabrafenib. Capivasertib demonstrated the largest performance gap between biologically derived and data-driven models for the Cancer pathway, with R2 values of 0.15 and 0.96, respectively. In contrast, Nutlin-3a showed the smallest performance difference for the p53 pathway, with R2 values of 0.52 for biologically derived features and 0.69 for data-driven features. Finally, Palbociclib achieved the highest performance among biologically derived models compared to the other drugs, with R2 values ranging from 0.47 to 0.55. Nevertheless, data-driven models still outperformed them, yielding R2 values between 0.82 and 0.95.
3.2.2. Data-Driven Feature Methods vs. Biologically Derived Features from CTD
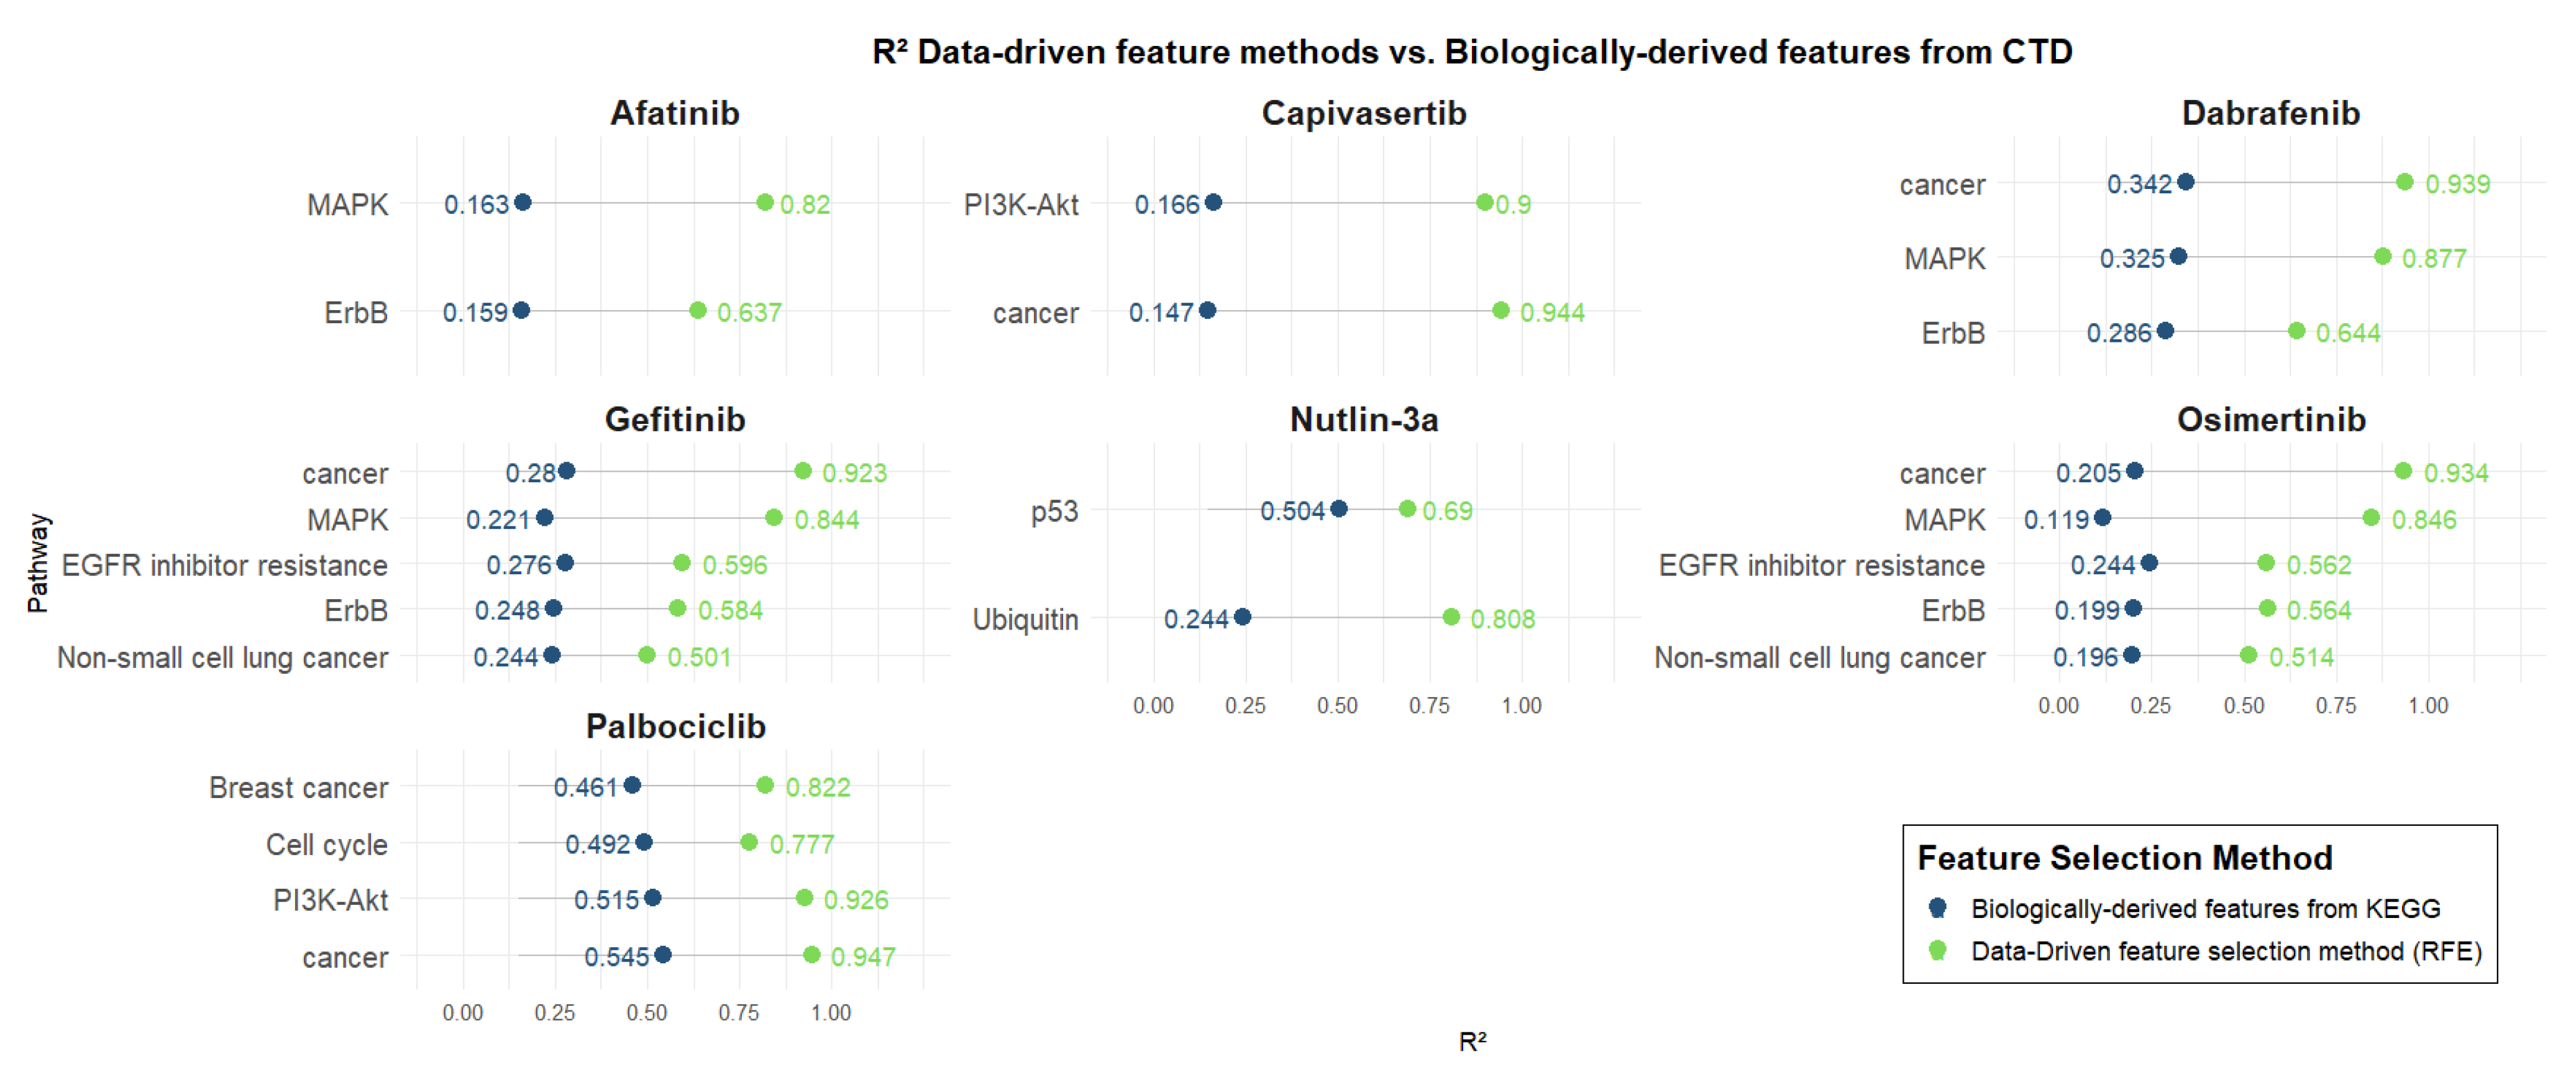
Figure 4 presents the R2 values of predictive models trained using genes derived from biologically relevant pathways associated with each drug, as defined by the Comparative Toxicogenomics Database (CTD). These are compared directly with models based on genes selected through data-driven methods. Pathway-based models were trained using SVR, except for the Nutlin-3a model based on the Ubiquitin pathway, which was trained using Linear Regression.
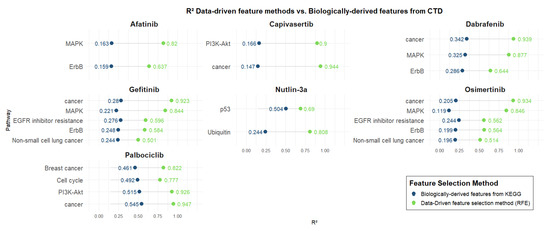
Figure 4.
Data-driven feature methods vs. biologically derived features from CTD.
As for KEGG pathways, all models exhibited superior predictive performance using computationally selected genes, highlighting the enhanced ability of data-driven approaches to capture key determinants of drug response beyond predefined biological annotations. Afatinib, Capivasertib, Gefitinib, Osimertinib, and Dabrafenib exhibit low performance (R2: ~0.2) for models trained using biologically derived features. As also observed for KEGG, Capivasertib shows the largest difference between models trained with biologically derived features and those using data-driven features for the Cancer pathway, with R2 values of 0.14 and 0.94, respectively. Again, Nutlin-3a demonstrates the smallest difference between biologically derived and data-driven models for the p53 pathway, with R2 values of 0.50 and 0.69, respectively. Palbociclib stood out again among the biologically derived models, attaining relatively better performance (R2: [0.46–0.54]) compared to other drugs. Nonetheless, data-driven models provided superior predictive power, with R2 values ranging from 0.77 to 0.94.
3.3. Venn Diagram Analysis of Computationally Selected Genes and Pharmacological Target Pathways
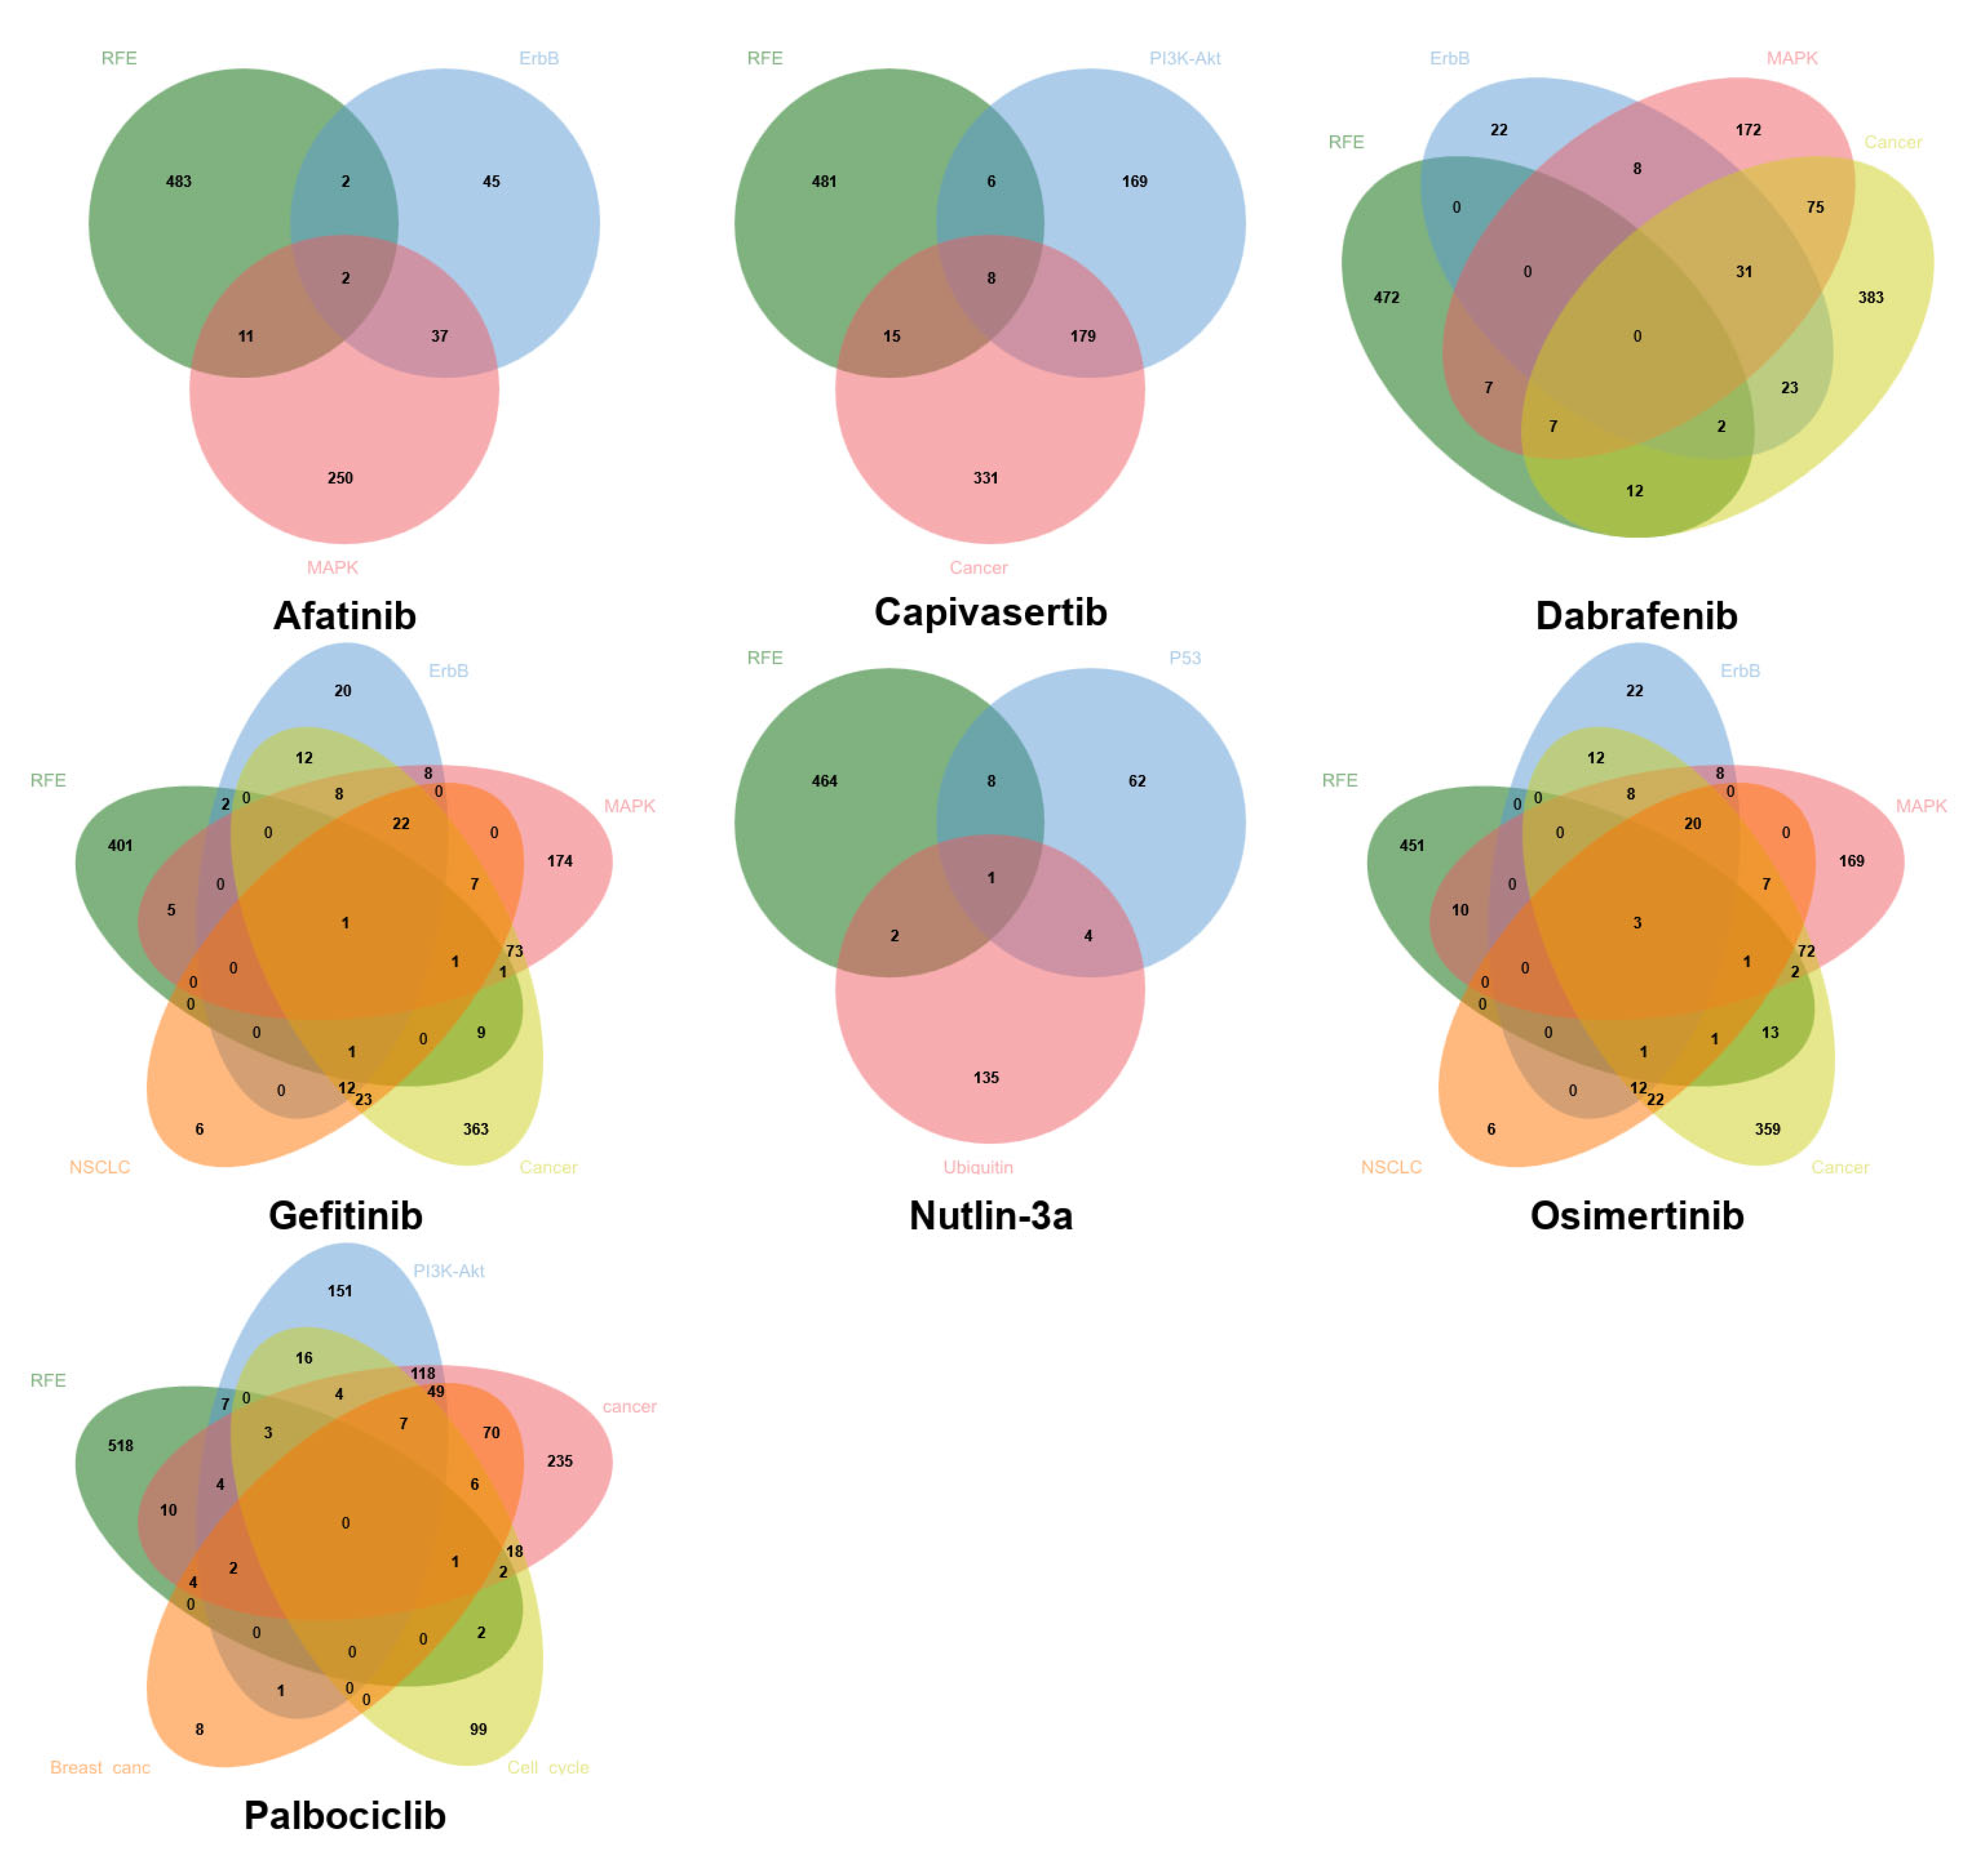
Figure 5 shows the Venn diagrams depicting the common genes between the set selected by data-driven feature selection methods and the KEGG biological pathways for each drug. Notably, although data-driven approaches and pathway-based methods frequently yield distinct gene sets, partial overlaps are consistently observed, indicating that some biologically relevant genes are also prioritized through purely computational selection. This convergence supports the biological validity of the data-driven selected genes in certain contexts. However, the limited size of the intersections also underscores that da-ta-driven and biology-driven methods capture complementary aspects of drug response, possibly reinforcing the rationale for a hybrid strategy that integrates both sources of in-formation. In addition, the selective overlap suggests that neither approach alone is sufficient to fully predict the pharmacological response and that a combined strategy—based on prior biological domain knowledge and improved through data-driven learning—can yield more interpretable and robust models.
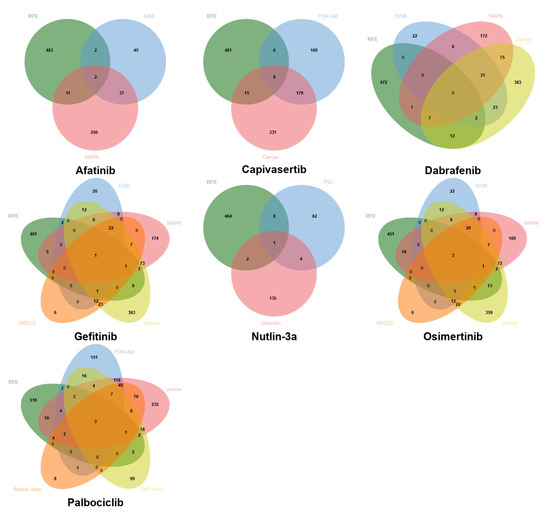
Figure 5.
Venn diagrams depicting common genes between computational methods (RFE with SVR estimator) and the biological target pathways of each drug.
3.4. Integrative Modeling
To evaluate whether a combinatorial approach that integrates both data-driven and pathway-based features leads to convergence between predicted and observed IC50 values, we applied the BEACON methodology. Table 3 presents the biological pathways employed to train the predictive models for each drug, along with the algorithm used for feature selection after integration. The selection of the specific pathways and feature selection methods was based on a comparative evaluation of multiple biologically relevant pathways and computational strategies for each drug. In each case, the combination that achieved the highest predictive performance in terms of R2 was selected.
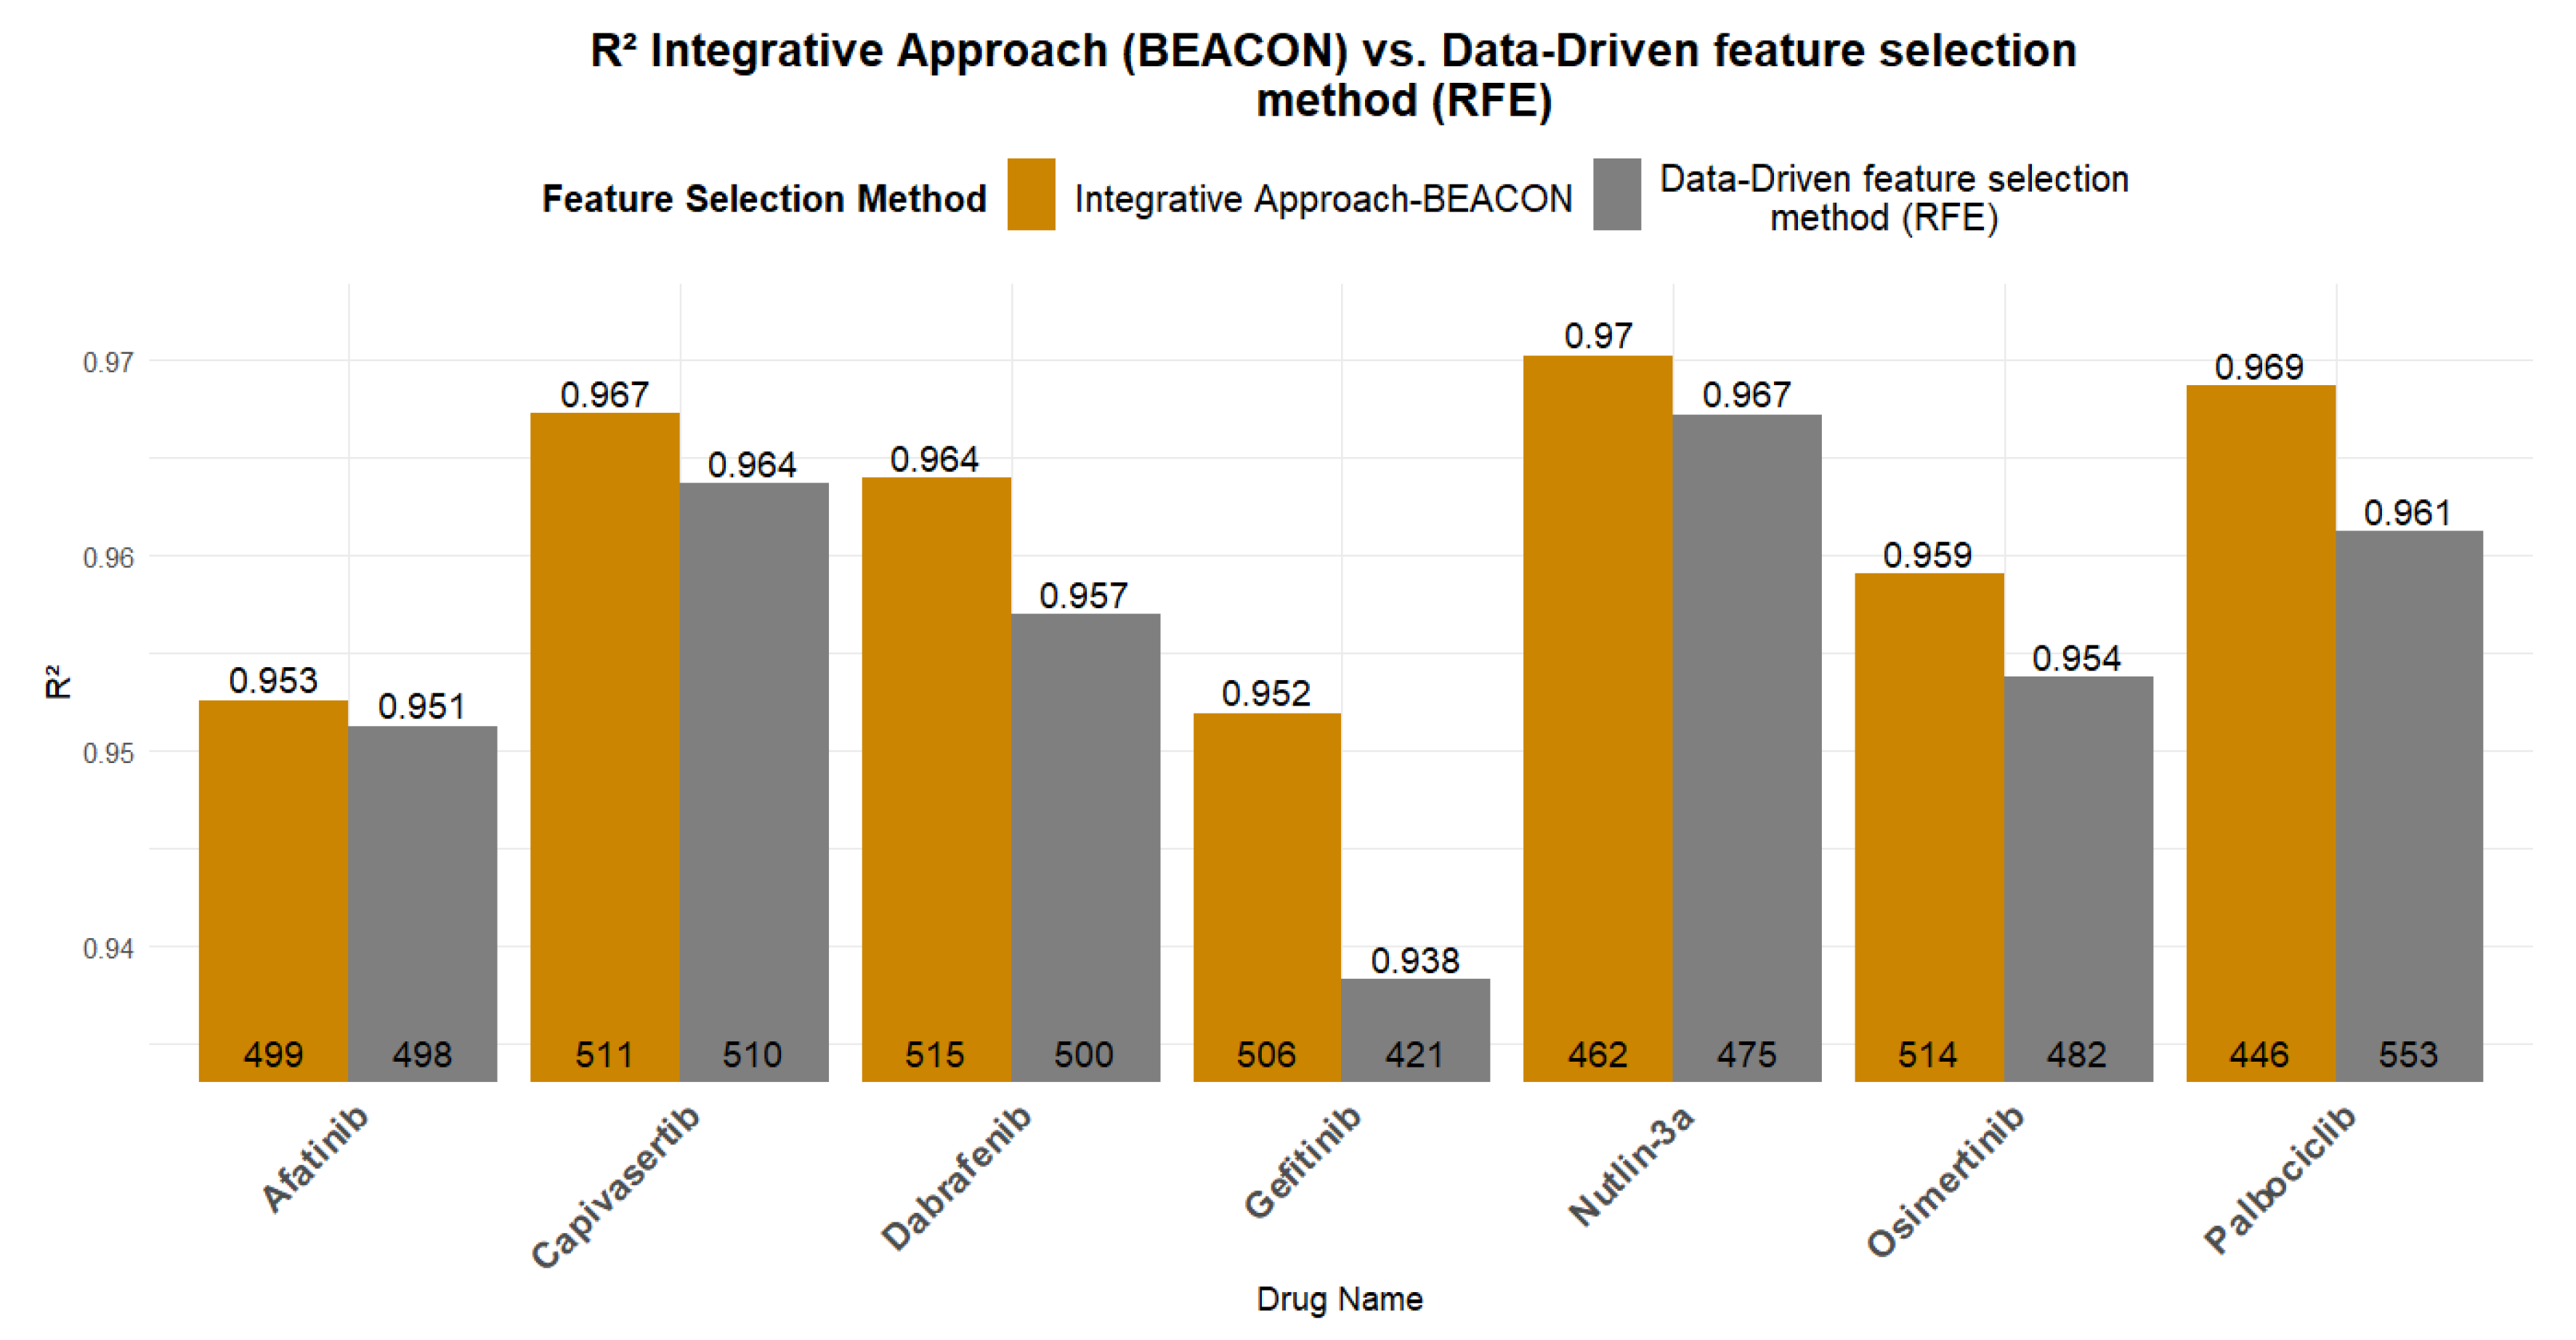
Figure 6 presents a comparative analysis of the R2 and RMSE values between the best models trained using exclusively computational feature selection methods (RFE with SVR estimator) and those trained using the BEACON methodology. All models presented in Figure 6 are trained using Linear Regression algorithm. In all models, the integrative approach exhibited superior performance compared to data-driven approach, validating the initial hypothesis that domain knowledge can positively contribute to the predictability of the underlying ML models.

Figure 6.
Predictability of the data-driven feature methods vs. the integrative approach (BEACON methodology). At the base of each bar, the number of features/genes used in each model is indicated, while the corresponding R2 value is shown at the top of each bar.
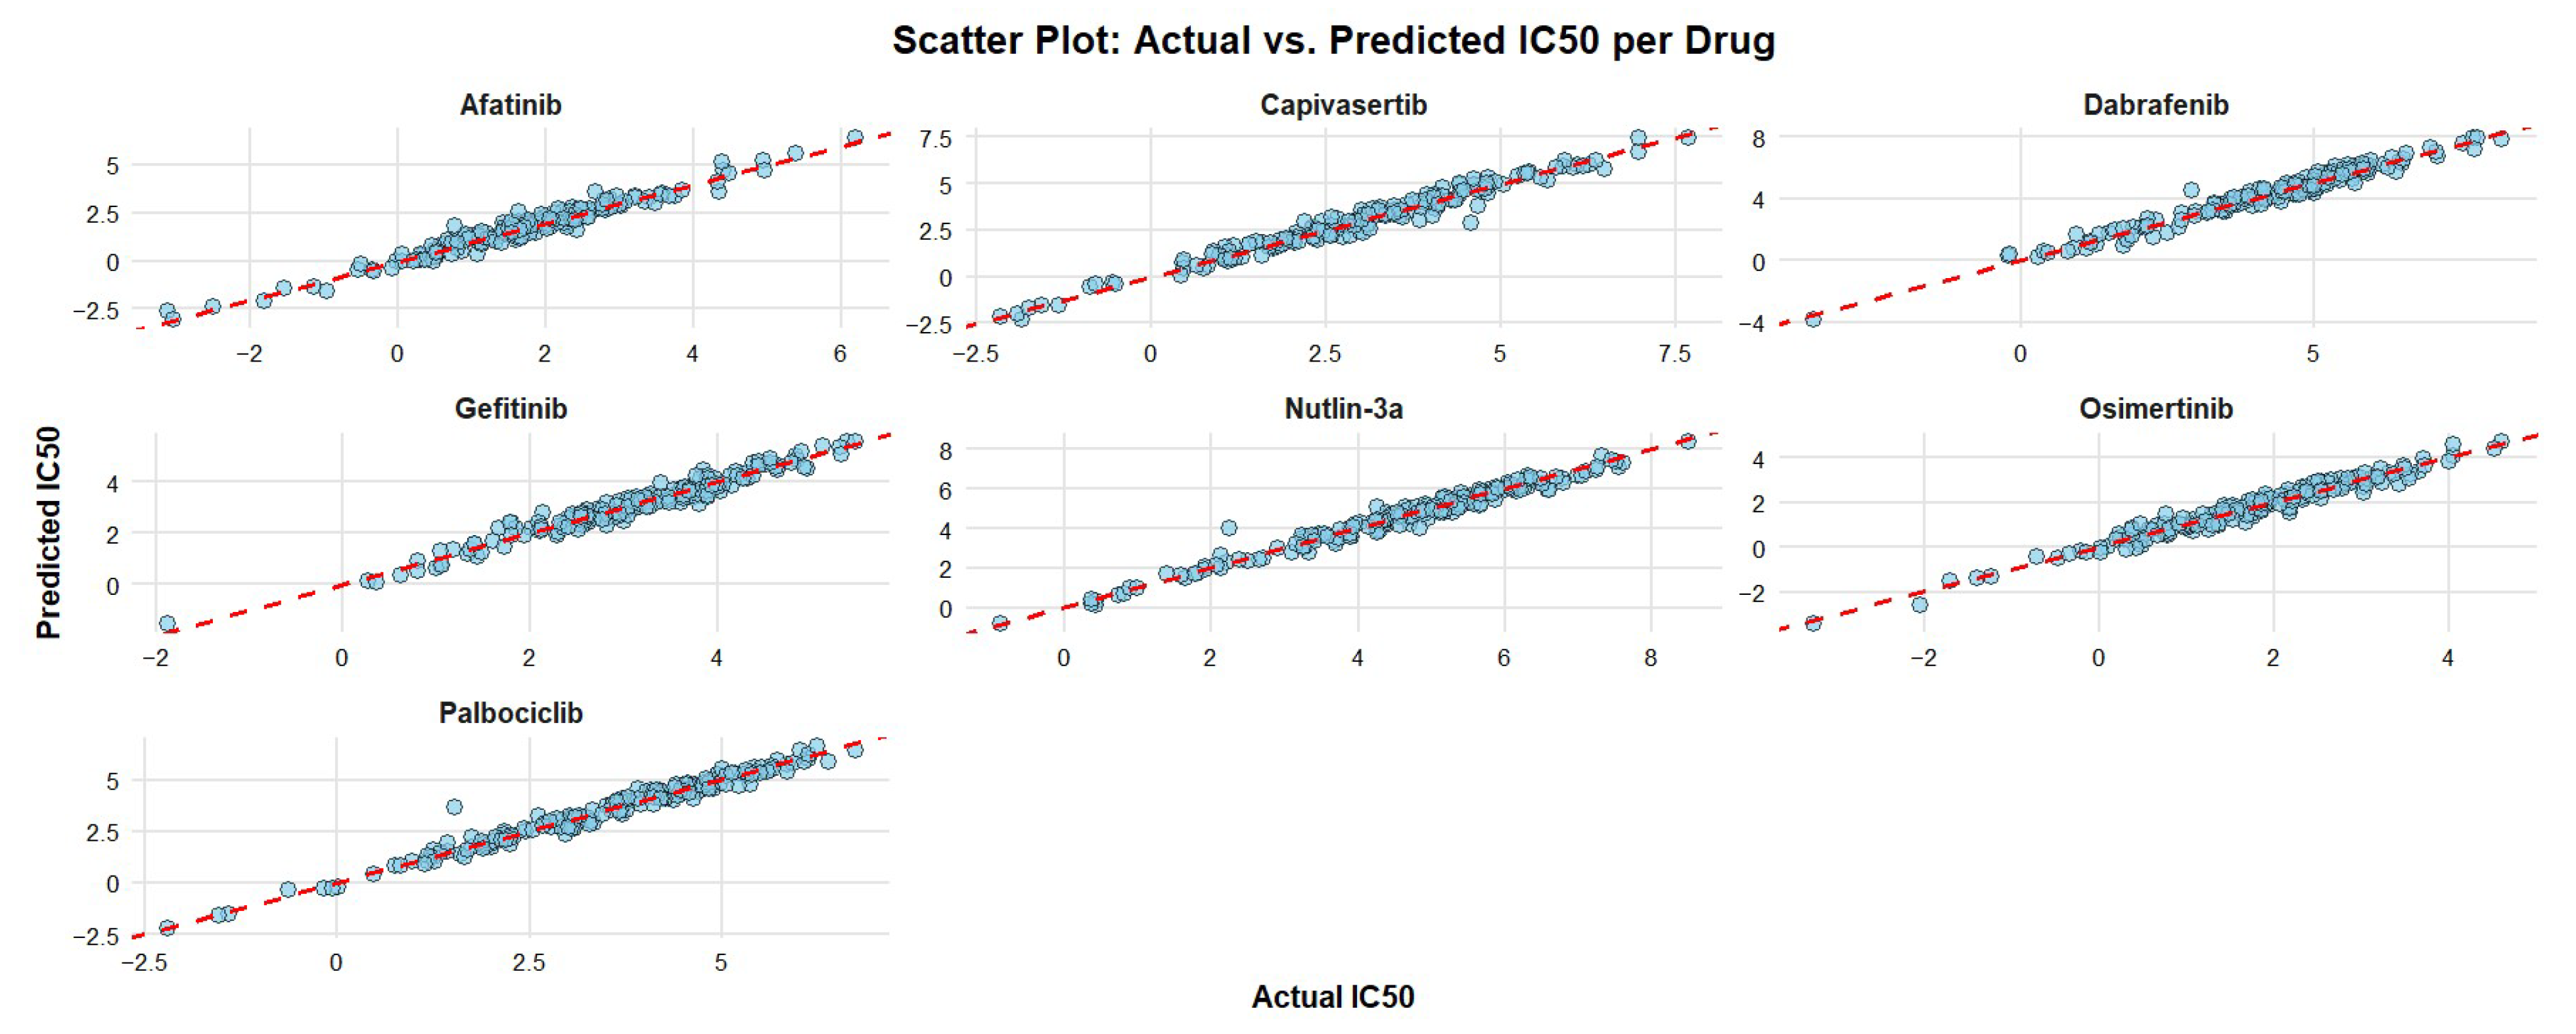
The scatterplots in Figure 7 present the pairwise distance between the expected and actual IC50 values, showing that all residual cell lines fall close on the diagonal line with minor exceptions of one cell line administered with Nutlin-3a and one with Palbociclib.

Figure 7.
Scatter plots of the predictive models for all drugs, where feature selection was performed using the integrative approach. The x-axis represents the actual IC50 values of the cancer cell lines, while the y-axis shows the predicted IC50 values from the models. The dashed red line denotes the ideal prediction (y = x), where predicted and actual values are equal.
Table 4 shows the origin of genes, either data or drug pathway-driven, in the optimized feature set and the corresponding performance metrics using the BEACON methodology and the data-driven regression. Positive differences always indicate improvement using the BEACON compared to RFE for both R2 and RMSE. Table 4 further verifies that BEACON leads to more efficient models. In the case of Gefitinib, the BEACON methodology reduces by 12% the RMSE value, while for Capivasertib, Dabrafenib, Nutlin-3a, and Osimertinib, a reduction of 4.7% to 8.4% is achieved. Of particular interest is Palbociclib, for which the BEACON methodology trains a model with a 10% reduction in RMSE and a slightly improved R2, while using 107 fewer genes (a reduction of ~20% in genes). Regarding the R2 values, the small increases can be attributed to the fact that, using exclusively computational methods, very high R2 values had already been achieved. However, the BEACON methodology achieved more efficient models despite the already high performance and limited room for improvement.

Table 4.
Differences in the number of genes and performance measures of models where gene selection was performed using: Integrative Approach (BEACON methodology) and Data-Driven feature selection (RFE with SVR estimator). DD: BEACON genes derived from data-driven methods, BD: BEACON genes derived from biologically driven methods. DD + BD: Common genes in DD and BD.
3.5. Cross-Omics Model Transferability
To determine whether protein-level expression data could serve as an effective feature set for the integrative regression model, we applied the trained predictive framework to quantitative proteomic profiles. This approach aimed to assess the model’s generalizability and robustness when utilizing post-transcriptional expression features in place of transcriptomic data. Table 5 presents the number of breast cancer cell lines for which proteomic data and IC50 values are available for each drug, as well as the number of genes before and after the removal of missing values.

Table 5.
Number of cell lines and genes with available proteomic data for each drug.
For each drug, a regression model was built based on gene expression data for which protein expression levels are available for the same cell lines. The same trained model (without retraining) was then applied to the proteomic data of the same cell lines, both in raw and Z-standardized form. Table 6 presents the R2 and RMSE values for the models trained on gene expression data, as well as for the predictions made when each model was applied to the corresponding proteomic data.

Table 6.
Predictive performance of models trained on gene expression (GEx) data and evaluated on protein expression data.
All drug models applied to proteomics data yielded R2 values below zero, showing a significant decrease in predictive power. RMSE values increased substantially when the models were applied to raw proteomic inputs, indicating a marked drop in predictive accuracy. For example, RMSE rose from 1.596 to 11.368 for Afatinib and from 0.847 to 8.756 for Gefitinib. This pronounced performance degradation suggests a poor transferability of models across omics layers, likely due to differences in data distribution, scale, and bio-logical dynamics captured by transcriptomic versus proteomic profiles. Notably, applying Z-score standardization to the proteomics data resulted in a consistent reduction in RMSE across all drugs, in some cases quite substantially, e.g., for Palbociclib, RMSE decreased from 10.120 to 1.617.
4. Discussion
This study provides compelling evidence that data-driven models can effectively predict pharmacological responses to widely used anticancer agents, outperforming models based solely on biological pathway information. Furthermore, the main findings from the multi-drug comparative study demonstrate that integrating in silico feature selection with biologically informed gene sets enhances both the predictive performance and interpretability of response models across a diverse panel of cancer therapeutics.
Despite their predictive strength, purely data-driven approaches are constrained by several critical limitations. Chief among these is their limited biological interpretability, which hinders mechanistic insight and translational relevance. Such models are also susceptible to overfitting in high-dimensional, low-sample-size settings common in bio-medical data, often capturing noise or dataset-specific artifacts rather than generalizable patterns. Furthermore, they typically operate agnostically to established biological knowledge—such as signaling hierarchies, pathway topologies, or regulatory interactions—thereby limiting their capacity to elucidate causal mechanisms or support biomarker discovery. These limitations underscore the value of hybrid frameworks that integrate data-driven inference with curated biological priors.
Among data-driven methods, Recursive Feature Elimination (RFE) with Support Vector Regression (SVR) consistently yielded the most robust predictive models. Models trained with RFE-based selected genes achieved R2 values exceeding 0.93 for all drugs, and in some cases even 0.96 for drugs such as Afatinib and Nutlin-3a. These results are consistent with previous studies by Shahzad et al. [44], Li et al. [45] and Scarborough et al. [46], which also reported improved IC50 prediction when using RFE over univariate ranking method.
The performance comparison between models trained using KEGG and CTD biological pathway genes and those using RFE-selected gene sets revealed that data-driven methods clearly outperformed biologically informed feature selection for all drugs. The overlap between genes selected by RFE and those annotated in KEGG target pathways is partial yet biologically meaningful, suggesting that data-driven selection coupled with the established biological knowledge could positively affect the potential of data-driven approaches to inform mechanism-guided biomarker discovery, bridging computational pre-dictions with underlying molecular mechanisms.
The overlap between genes selected by RFE and those annotated in KEGG target pathways is partial yet biologically meaningful, suggesting that data-driven selection coupled with the established biological knowledge could positively affect the potential of data-driven approaches to inform mechanism-guided biomarker discovery, bridging computational predictions with underlying molecular mechanisms.
The proposed BEACON methodology, which integrates biological pathway genes into the RFE pipeline, led to consistently improved or equal performance compared to computational feature selection alone.
A significant convergence of the predicted and actual IC50 values using BEACON-selected genes, with most data points. This pattern, observed consistently across all drugs, indicates that the predictive models achieved high accuracy with minimal large deviations, suggesting limited occurrence of significant prediction errors.
In terms of model transferability, however, a marked decline in performance was observed when testing the models built on gene expression to raw proteomics data and to a lesser extent to Z-transformed protein levels. The results are expected since protein abundance is influenced by additional layers of regulation, including translation efficiency, post-translational modifications, protein stability, and degradation rates. These regulatory processes introduce non-linear and gene-specific relationships between mRNA and protein levels and coupled with technical factors such as differing data distributions, dynamic ranges, and measurement noise between RNA-seq and mass spectrometry platforms justify the reduced model transferability.
While several hybrid strategies have been proposed previously, including network-based feature selection and pathway-regularized machine learning approaches [55,58], BEACON introduces a distinct stepwise integration strategy. Instead of constraining the model a priori through pathway regularization, BEACON first applies a purely data-driven feature selection (RFE–SVR), subsequently augments the selected gene set with pharmacological pathway genes from KEGG or CTD, and then re-applies feature selection on the combined set. This iterative design ensures that biologically relevant features are effectively incorporated while avoiding over-reliance on pre-annotated pathways, thereby balancing computational efficiency with biological interpretability. Importantly, BEACON is algorithm-agnostic and can be readily applied across diverse drugs and datasets. Moreover, unlike previous studies that often focus on a single drug or limited scope, our work systematically benchmarks BEACON across seven clinically relevant anticancer drugs, providing a broad comparative evaluation that underscores its generalizability and translational potential.
When compared with relevant tools using gene expression for drug response prediction, BEACON occupies a complementary niche. SpaRx [96] adapts pharmacogenomic knowledge to spatial single-cell data to highlight intra-tumoral heterogeneity and cell–cell communication, while BEACON focuses on bulk pharmacogenomic panels with systematic multi-drug benchmarking and interpretability. Likewise, DrugFormer [97] employs a graph-enhanced transformer to analyze single-cell RNA-seq data and identify resistant subpopulations, whereas BEACON provides a transparent, generalizable framework tailored to bulk datasets, balancing predictive performance with biological interpretability.
A limitation of the present study is that the predictive models were trained and evaluated exclusively on in vitro cell line datasets (GDSC transcriptomic data and the breast cancer proteomic panel). While these resources enable systematic benchmarking across multiple drugs under standardized conditions, they do not fully capture the complexity of clinical tumors, including tumor–stroma interactions, immune modulation, and inter-patient heterogeneity. Future validation of the BEACON framework should therefore extend beyond cell lines to patient-derived xenografts (PDXs) and organoid models, which retain greater biological fidelity, and ultimately to clinical cohorts with matched treatment outcome data. Such efforts will be crucial to determine the translational utility of BEACON for biomarker discovery, drug repurposing, and personalized therapy optimization in real-world precision oncology contexts.
Future research should focus on validating the BEACON methodology by applying it to additional drugs, and clinical data from cancer patients. In addition, the integration of multi-omic data, including genetic mutations, DNA methylation, proteomics, and metabolomics, may further enhance model robustness and biological relevance. Furthermore, extending the BEACON framework to model combinatorial drug responses and systematically benchmarking its performance against deep learning architectures may yield additional methodological insights. Lastly, evaluating its applicability in drug repurposing contexts could enhance its translational relevance and broaden its potential impact in precision oncology.
5. Conclusions
This study demonstrates that hybrid modeling approaches, exemplified by the BEACON framework, can enhance both the predictive performance and interpretability of drug response models by integrating data-driven feature selection with biologically in-formed priors. The findings underscore the value of combining computational and path-way-guided strategies for more robust and clinically meaningful predictions, particularly in applications such as targeted therapy and drug repurposing. However, limited model transferability from transcriptomic to proteomic data and reliance on in vitro datasets highlight the need for omics-specific approaches and validation in more complex biological systems.
Supplementary Materials
The following supporting information can be downloaded at: https://www.mdpi.com/article/10.3390/futurepharmacol5040058/s1, Figure S1: R2 values for models trained with different algorithms, for the number of genes selected based on the methodology presented above. Figure S2: RMSE values for models trained with different algorithms, for the number of genes selected based on the methodology presented above. Figure S3: R2 values for models trained with different algorithms for Capivasertib. For each algorithm, the best model with the optimal feature set is presented, which were selected using the methodology presented above. Figure S4: RMSE values for models trained with different algorithms for Capivasertib. For each algorithm, the best model with the optimal number of features is presented, which were selected using the methodology presented above. Figure S5: R2 values for comparing Select K Best with Mutual Info Regression (SKB_MIR) score function and RFE with Linear Regression estimator. Figure S6: RMSE values for comparing Select K Best with Mutual Info Regression (SKB_MIR) score function and RFE with Linear Regression estimator. Figure S7: R2 values for models trained using RFE feature selection with Support Vector Regression (SVR) Estimator and RFE with Linear Regression Estimator. Figure S8: RMSE values for models trained using RFE feature selection with Support Vector Regression (SVR) Estimator and RFE with Linear Regression Estimator.
Author Contributions
E.P.: Methodology, data curation, data analysis, investigation, validation, visualization, writing—original draft preparation I.S.V.: Review, validation M.Z.: Analysis consultation, review G.A.: Analysis consultation, review G.T.: Review, validation A.M.: Conceptualization, methodology supervision, writing—original draft preparation. All authors have read and agreed to the published version of the manuscript.
Funding
This research received no external funding.
Institutional Review Board Statement
Not applicable.
Data Availability Statement
All data and source code have been deposited at: https://github.com/BiolApps/BEACON, assessed on 9 August 2025.
Conflicts of Interest
The authors declare no conflicts of interest.
Abbreviations
The following abbreviations are used in this manuscript:
| IC50 | Half maximal inhibitory concentration |
| RFE | Recursive Feature Elimination |
| SVR | Support Vector Regression |
| ML | Machine Learning |
| AUC | Area Under the Curve |
| R2 | Coefficient of Determination |
| RMSE | Root Mean Squared Error |
| GEx | Gene Expression |
| CTD | Comparative Toxicogenomics Database |
| KEGG | Kyoto Encyclopedia of Genes and Genomes |
| NSCLC | Non-Small Cell Lung Cancer |
References
- Zhou, Y.; Tao, L.; Qiu, J.; Xu, J.; Yang, X.; Zhang, Y.; Tian, X.; Guan, X.; Cen, X.; Zhao, Y. Tumor biomarkers for diagnosis, prognosis and targeted therapy. Signal Transduct. Target. Ther. 2024, 9, 132. [Google Scholar] [CrossRef]
- Oren, M. p53: Not just a tumor suppressor. J. Mol. Cell Biol. 2019, 11, 539–543. Available online: https://pubmed.ncbi.nlm.nih.gov/31291648/ (accessed on 8 June 2025). [CrossRef]
- Malumbres, M.; Barbacid, M. RAS oncogenes: The first 30 years. Nat. Rev. Cancer 2003, 3, 459–465. [Google Scholar] [CrossRef]
- Bahrin, N.W.S.; Matusin, S.N.I.; Mustapa, A.; Huat, L.Z.; Perera, S.; Hamid, M.R.W.H.A. Exploring the effectiveness of molecular subtypes, biomarkers, and genetic variations as first-line treatment predictors in Asian breast cancer patients: A systematic review and meta-analysis. Syst. Rev. 2024, 13, 1–31. [Google Scholar] [CrossRef]
- Guo, Y.; Song, J.; Wang, Y.; Huang, L.; Sun, L.; Zhao, J.; Zhang, S.; Jing, W.; Ma, J.; Han, C. Concurrent Genetic Alterations and Other Biomarkers Predict Treatment Efficacy of EGFR-TKIs in EGFR-Mutant Non-Small Cell Lung Cancer: A Review. Front. Oncol. 2020, 10, 610923. [Google Scholar] [CrossRef] [PubMed]
- Varnai, R.; Sipeky, C. Genetic Biomarkers to Guide Poly(ADP-Ribose) Polymerase Inhibitor Precision Treatment of Prostate Cancer. Pharmacogenomics 2020, 21, 1101–1115. [Google Scholar] [CrossRef] [PubMed]
- Coppedè, F.; Lopomo, A.; Spisni, R.; Migliore, L. Genetic and epigenetic biomarkers for diagnosis, prognosis and treatment of colorectal cancer. World J. Gastroenterol. 2014, 20, 943–956. [Google Scholar] [CrossRef] [PubMed]
- Ghazimoradi, M.H.; Karimpour-Fard, N.; Babashah, S. The Promising Role of Non-Coding RNAs as Biomarkers and Therapeutic Targets for Leukemia. Genes 2023, 14, 131. [Google Scholar] [CrossRef]
- Zhang, C.; Sun, C.; Zhao, Y.; Wang, Q.; Guo, J.; Ye, B.; Yu, G. Overview of MicroRNAs as Diagnostic and Prognostic Biomarkers for High-Incidence Cancers in 2021. Int. J. Mol. Sci. 2022, 23, 11389. [Google Scholar] [CrossRef]
- Belczacka, I.; Latosinska, A.; Metzger, J.; Marx, D.; Vlahou, A.; Mischak, H.; Frantzi, M. Proteomics biomarkers for solid tumors: Current status and future prospects. Mass Spectrom. Rev. 2018, 38, 49–78. [Google Scholar] [CrossRef]
- Toden, S.; Goel, A. Non-coding RNAs as liquid biopsy biomarkers in cancer. Br. J. Cancer 2022, 126, 351–360. [Google Scholar] [CrossRef]
- Beylerli, O.; Gareev, I.; Sufianov, A.; Ilyasova, T.; Guang, Y. Long noncoding RNAs as promising biomarkers in cancer. Non-coding RNA Res. 2022, 7, 66–70. [Google Scholar] [CrossRef] [PubMed]
- Cheng, Y.Y.; Jin, H.C.; Chan, M.W.Y.; Chu, W.K.; Grusch, M. Epigenetic Biomarkers in Cancer. Dis. Markers. 2018, 20, 4987103. Available online: https://pubmed.ncbi.nlm.nih.gov/29675115/ (accessed on 8 June 2025). [CrossRef] [PubMed]
- Qi, S.A.; Wu, Q.; Chen, Z.; Zhang, W.; Zhou, Y.; Mao, K.; Li, J.; Li, Y.; Chen, J.; Huang, Y.; et al. High-resolution metabolomic biomarkers for lung cancer diagnosis and prognosis. Sci. Rep. 2021, 11, 11805. Available online: https://pubmed.ncbi.nlm.nih.gov/34083687/ (accessed on 8 June 2025). [CrossRef] [PubMed]
- Shams ul Hassan, S.; Abbas, S.Q.; Hassan, M.; Jin, H.-Z. Computational Exploration of Anti-Cancer Potential of GUAIANE Dimers from Xylopia vielana by Targeting B-Raf Kinase Using Chemo-Informatics, Molecular Docking, and MD Simulation Studies. Anticancer Agents Med. Chem. 2022, 22, 731–746. [Google Scholar] [CrossRef]
- Lo, Y.-C.; Rensi, S.E.; Torng, W.; Altman, R.B. Machine learning in chemoinformatics and drug discovery. Drug Discov. Today 2018, 23, 1538–1546. [Google Scholar] [CrossRef]
- Ávalos-Moreno, M.; López-Tejada, A.; Blaya-Cánovas, J.L.; Cara-Lupiañez, F.E.; González-González, A.; Lorente, J.A.; Sánchez-Rovira, P.; Granados-Principal, S. Drug Repurposing for Triple-Negative Breast Cancer. J. Pers. Med. 2020, 10, 200. [Google Scholar] [CrossRef]
- Ayala-Orozco, C.; Teimouri, H.; Medvedeva, A.; Li, B.; Lathem, A.; Li, G.; Kolomeisky, A.B.; Tour, J.M. Chemoinformatics Insights on Molecular Jackhammers and Cancer Cells. J. Chem. Inf. Model. 2024, 64, 5570–5579. [Google Scholar] [CrossRef]
- Soltan, M.A.; Eldeen, M.A.; Sajer, B.H.; Abdelhameed, R.F.A.; Al-Salmi, F.A.; Fayad, E.; Jafri, I.; Ahmed, H.E.M.; Eid, R.A.; Hassan, H.M.; et al. Integration of Chemoinformatics and Multi-Omics Analysis Defines ECT2 as a Potential Target for Cancer Drug Therapy. Biology 2023, 12, 613. [Google Scholar] [CrossRef]
- Daina, A.; Michielin, O.; Zoete, V. SwissADME: A free web tool to evaluate pharmacokinetics, drug-likeness and medicinal chemistry friendliness of small molecules. Sci. Rep. 2017, 7, 42717. [Google Scholar] [CrossRef]
- Liu, Y.; Lin, Y.; Yang, W.; Lin, Y.; Wu, Y.; Zhang, Z.; Lin, N.; Wang, X.; Tong, M.; Yu, R. Application of individualized differential expression analysis in human cancer proteome. Briefings Bioinform. 2022, 23, bbac096. [Google Scholar] [CrossRef]
- Zhou, J.; Liu, B.; Li, Z.; Li, Y.; Chen, X.; Ma, Y.; Yan, S.; Yang, X.; Zhong, L.; Wu, N. Proteomic Analyses Identify Differentially Expressed Proteins and Pathways Between Low-Risk and High-Risk Subtypes of Early-Stage Lung Adenocarcinoma and Their Prognostic Impacts. Mol. Cell. Proteom. 2021, 20, 100015. [Google Scholar] [CrossRef]
- Jokelainen, O.; Rintala, T.J.; Fortino, V.; Pasonen-Seppänen, S.; Sironen, R.; Nykopp, T.K. Differential expression analysis identifies a prognostically significant extracellular matrix–enriched gene signature in hyaluronan-positive clear cell renal cell carcinoma. Sci. Rep. 2024, 14, 10626. [Google Scholar] [CrossRef]
- Pan, Y.; Liu, G.; Yuan, Y.; Zhao, J.; Yang, Y.; Li, Y. Analysis of differential gene expression profile identifies novel biomarkers for breast cancer. Oncotarget 2017, 8, 114613–114625. [Google Scholar] [CrossRef] [PubMed]
- Przytycki, P.F.; Singh, M. Differential analysis between somatic mutation and germline variation profiles reveals cancer-related genes. Genome Med. 2017, 9, 1–11. [Google Scholar] [CrossRef] [PubMed]
- Matsuta, R.; Yamamoto, H.; Tomita, M.; Saito, R. iDMET: Network-based approach for integrating differential analysis of cancer metabolomics. BMC Bioinform. 2022, 23, 508. [Google Scholar] [CrossRef] [PubMed]
- Xue, J.-M.; Liu, Y.; Wan, L.-H.; Zhu, Y.-X. Comprehensive Analysis of Differential Gene Expression to Identify Common Gene Signatures in Multiple Cancers. Med. Sci. Monit. 2020, 26, e919953-1–e919953-13. [Google Scholar] [CrossRef]
- Cui, Y.; Wang, Q.; Shi, X.; Ye, Q.; Lei, M.; Wang, B. Development of a web-based calculator to predict three-month mortality among patients with bone metastases from cancer of unknown primary: An internally and externally validated study using machine-learning techniques. Front. Oncol. 2022, 12, 1095059. [Google Scholar] [CrossRef]
- Kourou, K.; Exarchos, T.P.; Exarchos, K.P.; Karamouzis, M.V.; Fotiadis, D.I. Machine learning applications in cancer prognosis and prediction. Comput. Struct. Biotechnol. J. 2014, 13, 8–17. [Google Scholar] [CrossRef]
- Swanson, K.; Wu, E.; Zhang, A.; Alizadeh, A.A.; Zou, J. From patterns to patients: Advances in clinical machine learning for cancer diagnosis, prognosis, and treatment. Cell 2023, 186, 1772–1791. [Google Scholar] [CrossRef]
- Mondello, A.; Bo, M.D.; Toffoli, G.; Polano, M. Machine learning in onco-pharmacogenomics: A path to precision medicine with many challenges. Front. Pharmacol. 2024, 14, 1260276. [Google Scholar] [CrossRef]
- Zhu, E.Y.; Dupuy, A.J. Machine learning approach informs biology of cancer drug response. BMC Bioinform. 2022, 23, 187. [Google Scholar] [CrossRef]
- Kim, Y.R.; Kim, D.; Kim, S.Y. Prediction of Acquired Taxane Resistance Using a Personalized Pathway-Based Machine Learning Method. Cancer Res. Treat. 2019, 51, 672–684. [Google Scholar] [CrossRef] [PubMed]
- Sotudian, S.; Paschalidis, I.C. Machine Learning for Pharmacogenomics and Personalized Medicine: A Ranking Model for Drug Sensitivity Prediction. IEEE/ACM Trans. Comput. Biol. Bioinform. 2021, 19, 2324–2333. [Google Scholar] [CrossRef] [PubMed]
- Ma, T.; Liu, Q.; Li, H.; Zhou, M.; Jiang, R.; Zhang, X. DualGCN: A dual graph convolutional network model to predict cancer drug response. BMC Bioinform. 2022, 23, 129. [Google Scholar] [CrossRef] [PubMed]
- Kardamiliotis, K.; Karanatsiou, E.; Aslanidou, I.; Stergiou, E.; Vizirianakis, I.S.; Malousi, A. Unraveling Drug Response from Pharmacogenomic Data to Advance Systems Pharmacology Decisions in Tumor Therapeutics. Futur. Pharmacol. 2022, 2, 31–44. [Google Scholar] [CrossRef]
- Rashid, M.M.; Selvarajoo, K. Advancing drug-response prediction using multi-modal and -omics machine learning integration (MOMLIN): A case study on breast cancer clinical data. Briefings Bioinform. 2024, 25, bbae300. [Google Scholar] [CrossRef]
- Baptista, D.; Ferreira, P.G.; Rocha, M. Deep learning for drug response prediction in cancer. Briefings Bioinform. 2020, 22, 360–379. [Google Scholar] [CrossRef]
- Avci, C.B.; Bagca, B.G.; Shademan, B.; Takanlou, L.S.; Takanlou, M.S.; Nourazarian, A. Machine learning in oncological pharmacogenomics: Advancing personalized chemotherapy. Funct. Integr. Genom. 2024, 24, 182. [Google Scholar] [CrossRef]
- Ding, M.Q.; Chen, L.; Cooper, G.F.; Young, J.D.; Lu, X. Precision Oncology beyond Targeted Therapy: Combining Omics Data with Machine Learning Matches the Majority of Cancer Cells to Effective Therapeutics. Mol. Cancer Res. 2018, 16, 269–278. [Google Scholar] [CrossRef]
- Jin, Y.; Lan, A.; Dai, Y.; Jiang, L.; Liu, S. Development and testing of a random forest-based machine learning model for predicting events among breast cancer patients with a poor response to neoadjuvant chemotherapy. Eur. J. Med Res. 2023, 28, 394. [Google Scholar] [CrossRef]
- Mehmood, A.; Nawab, S.; Jin, Y.; Hassan, H.; Kaushik, A.C.; Wei, D.-Q. Ranking Breast Cancer Drugs and Biomarkers Identification Using Machine Learning and Pharmacogenomics. ACS Pharmacol. Transl. Sci. 2023, 6, 399–409. [Google Scholar] [CrossRef] [PubMed]
- Fan, K.; Cheng, L.; Li, L. Artificial intelligence and machine learning methods in predicting anti-cancer drug combination effects. Briefings Bioinform. 2021, 22, bbab271. [Google Scholar] [CrossRef] [PubMed]
- Shahzad, M.; Kadani, A.Z.U.A.; Tahir, M.A.; Malick, R.A.S.; Jiang, R. DRPO: A deep learning technique for drug response prediction in oncology cell lines. Alex. Eng. J. 2024, 105, 88–97. [Google Scholar] [CrossRef]
- Li, Y.; Umbach, D.M.; Krahn, J.M.; Shats, I.; Li, X.; Li, L. Predicting tumor response to drugs based on gene-expression biomarkers of sensitivity learned from cancer cell lines. BMC Genom. 2021, 22, 272. [Google Scholar] [CrossRef]
- Scarborough, J.A.; Eschrich, S.A.; Torres-Roca, J.; Dhawan, A.; Scott, J.G. Exploiting convergent phenotypes to derive a pan-cancer cisplatin response gene expression signature. NPJ Precis. Oncol. 2023, 7, 38. [Google Scholar] [CrossRef]
- Zanella, L.; Facco, P.; Bezzo, F.; Cimetta, E. Feature Selection and Molecular Classification of Cancer Phenotypes: A Comparative Study. Int. J. Mol. Sci. 2022, 23, 9087. [Google Scholar] [CrossRef]
- Cheng, S.; Ma, L.; Lu, H.; Lei, X.; Shi, Y. Evolutionary computation for solving search-based data analytics problems. Artif. Intell. Rev. 2020, 54, 1321–1348. [Google Scholar] [CrossRef]
- Elaziz, M.A.; Moemen, Y.S.; Hassanien, A.E.; Xiong, S. Toxicity risks evaluation of unknown FDA biotransformed drugs based on a multi-objective feature selection approach. Appl. Soft Comput. 2020, 97, 105509. [Google Scholar] [CrossRef]
- Dong, Z.; Zhang, N.; Li, C.; Wang, H.; Fang, Y.; Wang, J.; Zheng, X. Anticancer drug sensitivity prediction in cell lines from baseline gene expression through recursive feature selection. BMC Cancer 2015, 15, 489. [Google Scholar] [CrossRef]
- Gakii, C.; Rimiru, R. Identification of cancer related genes using feature selection and association rule mining. Informatics Med. Unlocked 2021, 24, 100595. [Google Scholar] [CrossRef]
- Al Mamun, A.; Duan, W.; Mondal, A.M. Pan-cancer Feature Selection and Classification Reveals Important Long Non-coding RNAs. In Proceedings of the 2020 IEEE International Conference on Bioinformatics and Biomedicine, BIBM 2020, Seoul, Republic of Korea, 16–19 December 2020; pp. 2417–2424. [Google Scholar] [CrossRef]
- Vidyasagar, M. Identifying Predictive Features in Drug Response Using Machine Learning: Opportunities and Challenges. Annu. Rev. Pharmacol. Toxicol. 2015, 55, 15–34. [Google Scholar] [CrossRef] [PubMed]
- Koras, K.; Juraeva, D.; Kreis, J.; Mazur, J.; Staub, E.; Szczurek, E. Feature selection strategies for drug sensitivity prediction. Sci. Rep. 2020, 10, 9377. [Google Scholar] [CrossRef] [PubMed]
- Emdadi, A.; Eslahchi, C. Auto-HMM-LMF: Feature selection based method for prediction of drug response via autoencoder and hidden Markov model. BMC Bioinform. 2021, 22, 33. [Google Scholar] [CrossRef] [PubMed]
- MEl-Kenawy, E.S.; Khodadadi, N.; Eid, M.M.; Khodadadi, E.; Khodadadi, E.; Khafaga, D.S.; Alhussan, A.A.; Ibrahim, A.; Saber, M. Improved cancer detection through feature selection using the binary Al Biruni Earth radius algorithm. Sci. Rep. 2025, 15, 9483. [Google Scholar] [CrossRef]
- Parca, L.; Pepe, G.; Pietrosanto, M.; Galvan, G.; Galli, L.; Palmeri, A.; Sciandrone, M.; Ferrè, F.; Ausiello, G.; Helmer-Citterich, M. Modeling cancer drug response through drug-specific informative genes. Sci. Rep. 2019, 9, 15222. [Google Scholar] [CrossRef]
- Shin, J.; Piao, Y.; Bang, D.; Kim, S.; Jo, K. DRPreter: Interpretable Anticancer Drug Response Prediction Using Knowledge-Guided Graph Neural Networks and Transformer. Int. J. Mol. Sci. 2022, 23, 13919. [Google Scholar] [CrossRef]
- Yang, W.; Soares, J.; Greninger, P.; Edelman, E.J.; Lightfoot, H.; Forbes, S.; Bindal, N.; Beare, D.; Smith, J.A.; Thompson, I.R.; et al. Genomics of Drug Sensitivity in Cancer (GDSC): A resource for therapeutic biomarker discovery in cancer cells. Nucleic Acids Res. 2012, 41, D955–D961. [Google Scholar] [CrossRef]
- Smirnov, P.; Safikhani, Z.; El-Hachem, N.; Wang, D.; She, A.; Olsen, C.; Freeman, M.; Selby, H.; Gendoo, D.M.; Grossmann, P.; et al. PharmacoGx: An R package for analysis of large pharmacogenomic datasets. Bioinformatics 2015, 32, 1244–1246. [Google Scholar] [CrossRef]
- Cristofanilli, M.; Turner, N.C.; Bondarenko, I.; Ro, J.; Im, S.-A.; Masuda, N.; Colleoni, M.; DeMichele, A.; Loi, S.; Verma, S.; et al. Fulvestrant plus palbociclib versus fulvestrant plus placebo for treatment of hormone-receptor-positive, HER2-negative metastatic breast cancer that progressed on previous endocrine therapy (PALOMA-3): Final analysis of the multicentre, double-blind, phase 3 randomised controlled trial. Lancet Oncol. 2016, 17, 425–439. [Google Scholar] [CrossRef]
- Cope, L.; Hartman, S.M.; Göhlmann, H.W.; Tiesman, J.P.; Irizarry, R.A. Analysis of Affymetrix GeneChip® Data Using Amplified RNA. BioTechniques 2006, 40, 165–170. [Google Scholar] [CrossRef]
- Kim, C.S.; Hwang, S.; Zhang, S.-D. RMA with quantile normalization mixes biological signals between different sample groups in microarray data analysis. In Proceedings of the 2014 IEEE International Conference on Bioinformatics and Biomedicine (BIBM), Belfast, UK, 2–5 November 2014; pp. 139–143, IEEE, 2014. [Google Scholar] [CrossRef]
- Irizarry, R.A.; Hobbs, B.; Collin, F.; Beazer-Barclay, Y.D.; Antonellis, K.J.; Scherf, U.; Speed, T.P. Exploration, normalization, and summaries of high density oligonucleotide array probe level data. Biostatistics 2003, 4, 249–264. [Google Scholar] [CrossRef] [PubMed]
- Codicè, F.; Pancotti, C.; Rollo, C.; Moreau, Y.; Fariselli, P.; Raimondi, D. The specification game: Rethinking the evaluation of drug response prediction for precision oncology. J. Cheminform. 2025, 17, 33. Available online: https://pmc.ncbi.nlm.nih.gov/articles/PMC11907791/ (accessed on 9 June 2025). [CrossRef] [PubMed]
- Knox, C.; Wilson, M.; Klinger, C.M.; Franklin, M.; Oler, E.; Wilson, A.; Pon, A.; Cox, J.; Chin, N.E.; Strawbridge, S.A.; et al. DrugBank 6.0: The DrugBank Knowledgebase for 2024. Nucleic Acids Res. 2023, 52, D1265–D1275. [Google Scholar] [CrossRef]
- Zhao, J.; Bai, H.; Wang, X.; Wang, Y.; Duan, J.; Chen, H.; Xue, Z.; Tian, Y.; Cseh, A.; Huang, D.C.-L.; et al. Biomarker Subset Analysis of a Phase IIIb, Open-Label Study of Afatinib in EGFR Tyrosine Kinase Inhibitor-Naive Patients with EGFR m+ Non-Small-Cell Lung Cancer. Futur. Oncol. 2022, 18, 1485–1497. [Google Scholar] [CrossRef]
- Wecker, H.; Waller, C.F. Afatinib. Recent Results Cancer Res. 2018, 211, 199–215. Available online: https://pubmed.ncbi.nlm.nih.gov/30069769/ (accessed on 8 June 2025).
- Turner, N.C.; Oliveira, M.; Howell, S.J.; Dalenc, F.; Cortés, J.; Gomez, H.L.; Hu, X.; Jhaveri, K.; Krivorotko, P.; Loibl, S.; et al. A plain language summary of the CAPItello-291 study: Capivasertib in hormone receptor-positive advanced breast cancer. Futur. Oncol. 2024, 20, 2901–2913. [Google Scholar] [CrossRef]
- Andrikopoulou, A.; Chatzinikolaou, S.; Panourgias, E.; Kaparelou, M.; Liontos, M.; Dimopoulos, M.-A.; Zagouri, F. The emerging role of capivasertib in breast cancer. Breast 2022, 63, 157–167. [Google Scholar] [CrossRef]
- Shirley, M. Capivasertib: First Approval. Drugs 2024, 84, 337–346. [Google Scholar] [CrossRef]
- Luboff, A.J.; DeRemer, D.L. Capivasertib: A Novel AKT Inhibitor Approved for Hormone-Receptor-Positive, HER-2-Negative Metastatic Breast Cancer. Ann. Pharmacother. 2024, 58, 1229–1237. [Google Scholar] [CrossRef]
- Dummer, R.; Long, G.V.; Robert, C.; Tawbi, H.A.; Flaherty, K.T.; Ascierto, P.A.; Nathan, P.D.; Rutkowski, P.; Leonov, O.; Dutriaux, C.; et al. Randomized Phase III Trial Evaluating Spartalizumab Plus Dabrafenib and Trametinib for BRAFV600–Mutant Unresectable or Metastatic Melanoma. J. Clin. Oncol. 2022, 40, 1428–1438. [Google Scholar] [CrossRef] [PubMed]
- Planchard, D.; Besse, B.; Groen, H.J.M.; Souquet, P.-J.; Quoix, E.; Baik, C.S.; Barlesi, F.; Kim, T.M.; Mazieres, J.; Novello, S.; et al. Dabrafenib plus trametinib in patients with previously treated BRAFV600E-mutant metastatic non-small cell lung cancer: An open-label, multicentre phase 2 trial. Lancet Oncol. 2016, 17, 984–993. [Google Scholar] [CrossRef] [PubMed]
- Long, G.V.; Flaherty, K.T.; Stroyakovskiy, D.; Gogas, H.; Levchenko, E.; De Braud, F.; Larkin, J.; Garbe, C.; Jouary, T.; Hauschild, A.; et al. Dabrafenib plus trametinib versus dabrafenib monotherapy in patients with metastatic BRAF V600E/K-mutant melanoma: Long-term survival and safety analysis of a phase 3 study. Ann. Oncol. 2017, 28, 1631–1639. [Google Scholar] [CrossRef] [PubMed]
- Kainthla, R.; Kim, K.B.; Falchook, G.S. Dabrafenib. Recent Results Cancer Res. 2014, 201, 227–240. Available online: https://pubmed.ncbi.nlm.nih.gov/24756796/ (accessed on 8 June 2025).
- Wang, M.; Zhang, Z.; Liu, J.; Song, M.; Zhang, T.; Chen, Y.; Hu, H.; Yang, P.; Li, B.; Song, X.; et al. Gefitinib and fostamatinib target EGFR and SYK to attenuate silicosis: A multi-omics study with drug exploration. Signal Transduct. Target. Ther. 2022, 7, 1–13. [Google Scholar] [CrossRef]
- Sun, C.; Gao, W.; Liu, J.; Cheng, H.; Hao, J. FGL1 regulates acquired resistance to Gefitinib by inhibiting apoptosis in non-small cell lung cancer. Respir. Res. 2020, 21, 1–11. [Google Scholar] [CrossRef]
- Lin, X.; Ye, R.; Li, Z.; Zhang, B.; Huang, Y.; Du, J.; Wang, B.; Meng, H.; Xian, H.; Yang, X.; et al. KIAA1429 promotes tumorigenesis and gefitinib resistance in lung adenocarcinoma by activating the JNK/MAPK pathway in an m6A-dependent manner. Drug Resist. Updat. 2022, 66, 100908. [Google Scholar] [CrossRef]
- PharmGKB. Stanford University. Website. 2020. Available online: https://www.pharmgkb.org (accessed on 13 December 2021).
- Cipriano, R.; Patton, J.T.; Mayo, L.D.; Jackson, M.W. Inactivation of p53 signaling by p73 or PTEN ablation results in a transformed phenotype that remains susceptible to Nutlin-3 mediated apoptosis. Cell Cycle 2010, 9, 1373–1379. [Google Scholar] [CrossRef]
- Kim, D.; Min, D.; Kim, J.; Kim, M.J.; Seo, Y.; Jung, B.H.; Kwon, S.; Ro, H.; Lee, S.; Sa, J.K.; et al. Nutlin-3a induces KRAS mutant/p53 wild type lung cancer specific methuosis-like cell death that is dependent on GFPT2. J. Exp. Clin. Cancer Res. 2023, 42, 338. [Google Scholar] [CrossRef]
- Yee-Lin, V.; Pooi-Fong, W.; Soo-Beng, A.K. Nutlin-3, A p53-Mdm2 Antagonist for Nasopharyngeal Carcinoma Treatment. Mini-Reviews Med. Chem. 2018, 18, 173–183. [Google Scholar] [CrossRef]
- Hydbring, P. Plasma-derived immune-related factors as biomarkers of osimertinib resistance in EGFR-mutant non-small cell lung cancer patients. Transl. Lung Cancer Res. 2023, 12, 405–407. [Google Scholar] [CrossRef]
- Choudhury, N.J.; Marra, A.; Sui, J.S.; Flynn, J.; Yang, S.-R.; Falcon, C.J.; Selenica, P.; Schoenfeld, A.J.; Rekhtman, N.; Gomez, D.; et al. Molecular Biomarkers of Disease Outcomes and Mechanisms of Acquired Resistance to First-Line Osimertinib in Advanced EGFR-Mutant Lung Cancers. J. Thorac. Oncol. 2022, 18, 463–475. [Google Scholar] [CrossRef]
- Lamb, Y.N. Osimertinib: A Review in Previously Untreated, EGFR Mutation-Positive, Advanced NSCLC. Target. Oncol. 2021, 16, 687–695. [Google Scholar] [CrossRef]
- Fu, K.; Xie, F.; Wang, F.; Fu, L. Therapeutic strategies for EGFR-mutated non-small cell lung cancer patients with osimertinib resistance. J. Hematol. Oncol. 2022, 15, 173. [Google Scholar] [CrossRef]
- Cristofanilli, M.; Rugo, H.S.; Im, S.-A.; Slamon, D.J.; Harbeck, N.; Bondarenko, I.; Masuda, N.; Colleoni, M.; DeMichele, A.; Loi, S.; et al. Overall Survival with Palbociclib and Fulvestrant in Women with HR+/HER2− ABC: Updated Exploratory Analyses of PALOMA-3, a Double-blind, Phase III Randomized Study. Clin. Cancer Res. 2022, 28, 3433–3442. [Google Scholar] [CrossRef]
- Finn, R.S.; Martin, M.; Rugo, H.S.; Jones, S.; Im, S.-A.; Gelmon, K.; Harbeck, N.; Lipatov, O.N.; Walshe, J.M.; Moulder, S.; et al. Palbociclib and Letrozole in Advanced Breast Cancer. N. Engl. J. Med. 2016, 375, 1925–1936. [Google Scholar] [CrossRef]
- Kanehisa, M.; Furumichi, M.; Sato, Y.; Matsuura, Y.; Ishiguro-Watanabe, M. KEGG: Biological systems database as a model of the real world. Nucleic Acids Res. 2024, 53, D672–D677. [Google Scholar] [CrossRef] [PubMed]
- Kalocsay, M.; Berberich, M.J.; Everley, R.A.; Nariya, M.K.; Chung, M.; Gaudio, B.; Victor, C.; Bradshaw, G.A.; Eisert, R.J.; Hafner, M.; et al. Proteomic profiling across breast cancer cell lines and models. Sci. Data 2023, 10, 514. [Google Scholar] [CrossRef] [PubMed]
- Pedregosa, F.; Varoquaux, G.; Gramfort, A.; Michel, V.; Thirion, B.; Grisel, O.; Blondel, M.; Prettenhofer, P.; Weiss, R.; Dubourg, V.; et al. Scikit-learn: Machine learning in Python. J. Mach. Learn. Res. 2011, 12, 2825–2830. Available online: https://jmlr.org/papers/v12/pedregosa11a.html (accessed on 9 June 2025).
- r2_Score—Scikit-Learn 1.7.0 Documentation. Available online: https://scikit-learn.org/stable/modules/generated/sklearn.metrics.r2_score.html (accessed on 9 June 2025).
- Root_Mean_Squared_Error—Scikit-Learn 1.7.0 Documentation. Available online: https://scikit-learn.org/stable/modules/generated/sklearn.metrics.root_mean_squared_error.html (accessed on 9 June 2025).
- Bardou, P.; Mariette, J.; Escudié, F.; Djemiel, C.; Klopp, C. jvenn: An interactive Venn diagram viewer. BMC Bioinform. 2014, 15, 293. [Google Scholar] [CrossRef] [PubMed] [PubMed Central]
- Tang, Z.; Liu, X.; Li, Z.; Zhang, T.; Yang, B.; Su, J.; Song, Q. SpaRx: Elucidate single-cell spatial heterogeneity of drug responses for personalized treatment. Briefings Bioinform. 2023, 24, bbad338. [Google Scholar] [CrossRef]
- Liu, X.; Wang, Q.; Zhou, M.; Wang, Y.; Wang, X.; Zhou, X.; Song, Q. DrugFormer: Graph-Enhanced Language Model to Predict Drug Sensitivity. Adv. Sci. 2024, 11, e2405861. [Google Scholar] [CrossRef]
Disclaimer/Publisher’s Note: The statements, opinions and data contained in all publications are solely those of the individual author(s) and contributor(s) and not of MDPI and/or the editor(s). MDPI and/or the editor(s) disclaim responsibility for any injury to people or property resulting from any ideas, methods, instructions or products referred to in the content. |
© 2025 by the authors. Licensee MDPI, Basel, Switzerland. This article is an open access article distributed under the terms and conditions of the Creative Commons Attribution (CC BY) license (https://creativecommons.org/licenses/by/4.0/).


