1. Introduction
Tumor necrosis factor-alpha (TNF-α) is a key regulator of inflammation and immune homeostasis, playing a critical role in the pathogenesis of chronic inflammatory diseases such as psoriasis, rheumatoid arthritis, and inflammatory bowel disease [
1,
2,
3,
4]. In addition to its central role in inflammation, TNF-α influences apoptosis, regulates immune cell growth, and contributes to tumor surveillance, highlighting its diverse functions in both normal physiology and disease processes [
5,
6,
7,
8]. TNF-α is initially produced as a membrane-bound precursor (pro-TNF-α), which must undergo proteolytic cleavage by the tumor necrosis factor-α-converting enzyme (TACE), also known as ADAM17, to yield its biologically active soluble form [
9,
10]. TACE is a membrane-bound metalloproteinase characterized by broad substrate specificity. In addition to processing pro-TNF-α, TACE cleaves a broad range of cell surface proteins, including cytokine receptors (e.g., TNF-R and IL-6R), growth factor ligands (e.g., TGF-α and amphiregulin), and adhesion molecules such as ICAM-1 [
11,
12,
13]. By mediating these proteolytic cleavages, TACE plays a crucial role in regulating inflammatory signaling pathways and cellular communication. Dysregulated TACE activity has been implicated in the onset and progression of numerous inflammatory and autoimmune disorders. Its dysregulation promotes excessive cytokine release, receptor shedding, and immune dysregulation, contributing not only to systemic inflammation but also to neuroinflammatory conditions such as Alzheimer’s disease [
14,
15]. This broad pathological relevance has made TACE a compelling drug target, particularly for the suppression of TNF-α-driven inflammation.
Despite extensive efforts, however, the development of selective and effective small-molecule TACE inhibitors has faced several challenges. Many previously reported compounds, including hydroxamate-based inhibitors, have shown off-target effects, limited bioavailability, and poor pharmacokinetics, hindering their clinical translation [
16,
17]. These limitations underscore the need for novel scaffolds with enhanced drug-like properties and distinct chemical frameworks to address selectivity and toxicity issues.
To address this gap, we explore the Enamine diversity library, a commercially available source of over 460,000 synthetically accessible small molecules covering underrepresented regions of chemical space. While our prior work focused on repositioning FDA-approved drugs for TACE inhibition, it identified multiple potent FDA compounds that showed strong potential against TACE [
18]. This study aims to identify first-in-class enamine inhibitors with novel scaffolds. Enamine provides one of the world’s largest and most diverse collections of small molecules, including both commercially available compounds and novel, synthetically accessible building blocks. This extensive chemical space allows for the exploration of a wide variety of structural scaffolds and functional groups, thereby increasing the likelihood of identifying potent and selective hits against diverse biological targets [
19,
20,
21,
22]. Furthermore, enamine compounds are optimized for drug-likeness and lead-likeness, which enhances their potential for further development into therapeutically viable candidates. These compounds also meet medicinal chemistry criteria designed to reduce the likelihood of off-target interactions and adverse toxicity [
23,
24,
25]. An integrated multi-step computational workflow was implemented, combining ligand-based virtual screening driven by deep learning with structure-based approaches, including molecular docking, extended 300 ns molecular dynamics simulations, and binding free energy calculations. This comprehensive strategy was designed to identify candidate molecules exhibiting both stability and strong binding affinity.
2. Methodology
2.1. TACE Dataset, Commercial Enamine Compound Library
A curated collection of compounds targeting TACE was assembled using resources from the DUD-E database (
https://dude.docking.org/) (accessed on 2 September 2024) [
26], which included 532 molecules confirmed as actives and 35,900 compounds categorized as decoys. Each compound’s molecular structure was represented by canonical SMILES notation and cross-referenced with unique DUD-E and ChEMBL identifiers, and both actives and decoys were clearly distinguished through specific annotations. To broaden the scope of the virtual screening, a structurally diverse compound set was also sourced from Enamine Ltd.’s (
https://enamine.net/compound-libraries/diversity-libraries) (accessed on 20 September 2024) diversity-oriented libraries. Additionally, the canonical SMILES for BMS-561392, a recognized TACE inhibitor, was incorporated as a standard for comparative evaluations within the study.
2.2. Descriptor Calculation Using the RDKit Toolkit
Molecular descriptors were generated using RDKit (
https://www.rdkit.org) (accessed on 3 September 2024), a widely adopted open-source cheminformatics resource developed in Python 3.11.1. RDKit provides robust tools for computing diverse chemical descriptors, extracting structural features, and visualizing molecular properties, making it a valuable asset for data-driven research and analysis in chemistry.
2.3. Design of the Deep Learning Framework
The dataset of active and decoy compounds for TACE was partitioned into training, validation, and test sets using an 8:1:1 allocation. To assess molecular activity, a deep learning approach was implemented via the GraphConvMol model from the DeepChem 2.8.0 library. This model leverages graph convolutional neural networks (GCNNs) that interpret each molecule as a graph, mapping atoms to nodes and chemical bonds to edges. Through a series of trainable graph convolutional layers, the network performs hierarchical message-passing steps where each atom assimilates information from neighboring atoms and bonds. This iterative process refines node representations, enabling the model to autonomously learn and extract multi-level structural features directly from the molecular architecture. The learned feature representations are further optimized during training, enhancing the model’s capacity to distinguish essential molecular characteristics relevant to activity prediction.
During training, the model minimizes a chosen loss function by leveraging the molecular input data. Weights in the convolutional layers are refined over successive training epochs via backpropagation, with each update aimed at enhancing predictive performance. This process trains the network to accurately infer various molecular properties, such as solubility, biological activity, and toxicity, directly from the structural attributes of the chemical compounds.
2.4. Acquisition of TACE’s Three-Dimensional Structure
The crystal structure of TACE was sourced from the Protein Data Bank (PDB) with accession code 2OI0 at a resolution of 2.00 Å, accessed via the RCSB PDB portal (
https://www.rcsb.org/) (accessed on 13 November 2024) [
27]. Analysis of secondary structure features, including alpha helices, beta strands, coils, and turn regions, was conducted using the VADAR web server (
http://vadar.wishartlab.com/) (accessed on 18 November 2024) [
28], which employs consensus-based algorithms for structural assignment. The structure subsequently underwent energy minimization and was evaluated for geometric plausibility using Ramachandran plot analysis performed with the UCSF Chimera and Discovery Studio platforms [
29,
30].
2.5. Determination of Ligand Binding Regions
The active binding pocket of TACE refers to the specific region within the protein where a ligand, such as an inhibitor, binds and modulates the protein’s function. Structural studies and ligand interaction analyses reveal that this pocket includes key amino acid residues that directly interact with the inhibitor [
31]. Using the TACE-inhibitor complex structure from the PDB, binding site characterization can be performed with tools like Discovery Studio’s ligand interaction module, which identifies these critical residues by mapping contacts such as hydrogen bonds, hydrophobic interactions, and electrostatic contacts.
The active site of TACE includes conserved catalytic residues coordinating a zinc ion, surrounded by a specific binding pocket. The pocket accommodates inhibitors and defines substrate specificity. Key residues in these pockets have been validated by cross-referencing crystallographic data and biochemical studies [
32,
33].
After identifying the interacting amino acid residues, the bound ligand was chosen, and a binding sphere was created using the selection tool in the binding site panel of Discovery Studio. This binding sphere delineates the three-dimensional region where inhibitors are expected to engage with the protein. To enhance docking precision, this region was further refined by applying specific constraints based on critical amino acid residues. This refinement is essential for directing docking toward the most relevant areas of the binding pocket.
2.6. Molecular Docking
Molecular docking is a computational technique widely used to evaluate the binding interactions between ligands and target proteins [
34,
35]. Prior to docking, the protein structure was processed by minimizing the protein structure using the CHARMm forcefield with default parameters (max steps 200 and RMS gradient 0.1). Furthermore, the protein structure was prepared considering the loop refinement and protonation. Protein dielectric constant was set to 10, pH of protonation was 7.4, ionic strength was 0.145, and energy cutoff was set to 0.9 by default. After complete receptor preparation, the further steps include removing native ligands, water molecules, and adding hydrogen atoms, typically performed using receptor preparation modules in Discovery Studio. Ligand preparation was similarly subjected to energy minimization using the CHARMm forcefield with default parameters (steepest descent followed by conjugate gradient, max steps = 200, and RMS gradient = 0.1). This procedure optimized the ligand geometries and minimized steric clashes to generate energetically favorable conformations before docking. Furthermore, next step of ligand preparation involves generating possible tautomers, optimizing ionization states, and checking for valency correctness using ligand preparation tools to ensure chemical accuracy before docking.
Molecular docking was conducted utilizing the CDocker algorithm within Discovery Studio, employing default parameters for ligand orientation and conformational sampling to maintain consistency. The docked poses generated were primarily assessed according to their docking energy scores, with lower negative values (expressed in kcal/mol) indicating more stable and energetically favorable interactions between the ligand and the target protein, TACE.
To ensure the robustness and reproducibility of the molecular docking results, a comparative docking approach was employed. The top-ranked compounds from the initial Discovery Studio screening were subjected to validation using two widely recognized docking platforms: AutoDock Vina (integrated within PyRx) and GNINA. In all docking experiments, the zinc coordinates were preserved within the binding site to maintain the physiological relevance of the docking environment. This approach facilitated the selection of potential ligands exhibiting strong binding affinity towards the protein based on their calculated energy scores.
2.7. Dynamics Simulations of Molecular Systems
The five compounds with the lowest docking energy scores were selected for the extended 300 ns MD simulations to assess their binding stability. Additionally, the known TACE inhibitor BMS-561392 was included as a reference ligand to provide comparative insights. All simulations employed the CHARMM36 forcefield, which is widely accepted for its reliability in biomolecular simulations [
36]. System preparation was performed using the Solution Builder module of the CHARMM-GUI web server (
https://www.charmm-gui.org/?doc=input/solution) (accessed on 2 December 2024). The prepared complexes, including the receptor, ligand, and zinc ion, were uploaded to the CHARMM-GUI. This tool generated the necessary input files compatible with the GROMACS 2022 simulation engine, including topology (.top) and parameter (.itp) files. The protein–ligand complexes were solvated within a cubic box containing TIP3P water molecules, a three-site water model frequently used due to its accuracy in representing water behavior. Periodic boundary conditions were applied to simulate an infinite environment, and counter ions were added to neutralize the system’s net charge [
37]. Critical interaction parameters were carefully defined: electrostatic and van der Waals forces were computed using the Verlet cutoff scheme with a cutoff distance of 10 Å. Bond constraints were enforced using the LINCS algorithm, enhancing numerical stability and computational efficiency. Electrostatic interactions were precisely calculated through the Particle Mesh Ewald (PME) method, ensuring accurate long-range force evaluation. Prior to production runs, the solvated system underwent energy minimization using the steepest descent method, effectively relieving any steric clashes or unfavorable contacts.
Following minimization, two equilibration stages were performed: first under constant number of particles, volume, and temperature (NVT ensemble), and subsequently under constant number of particles, pressure, and temperature (NPT ensemble). The MD simulation temperature was set to 303.15 K by default. These equilibration steps were crucial for stabilizing system temperature and pressure, thereby preparing the system for subsequent dynamic simulations. The prepared systems were simulated using GROMACS version 2022 on a Ubuntu system [
38].
2.8. Binding Free Energy Calculation
The gmx_MMPBSA tool is specifically designed to compute end-point binding free energies from molecular dynamics (MD) trajectories produced by GROMACS simulations [
39]. It applies the MM/PBSA (Molecular Mechanics Poisson–Boltzmann Surface Area) method on explicit solvent trajectories to separately evaluate the free energy components of the protein–ligand complex, the receptor, and the ligand, thereby determining the binding free energy (ΔG
binding) of the system [
40].
The binding free energy (ΔG
binding) in MM/PBSA is calculated using the equation:
where G
complex, G
receptor, and G
ligand are the free energies of the complex, receptor, and ligand, respectively. Each free energy term is decomposed into molecular mechanics energies (including bonded terms like bonds, angles, dihedrals, and nonbonded terms like electrostatics and van der Waals) plus solvation energies (polar and nonpolar contributions), each calculated in an aqueous environment.
3. Results and Discussion
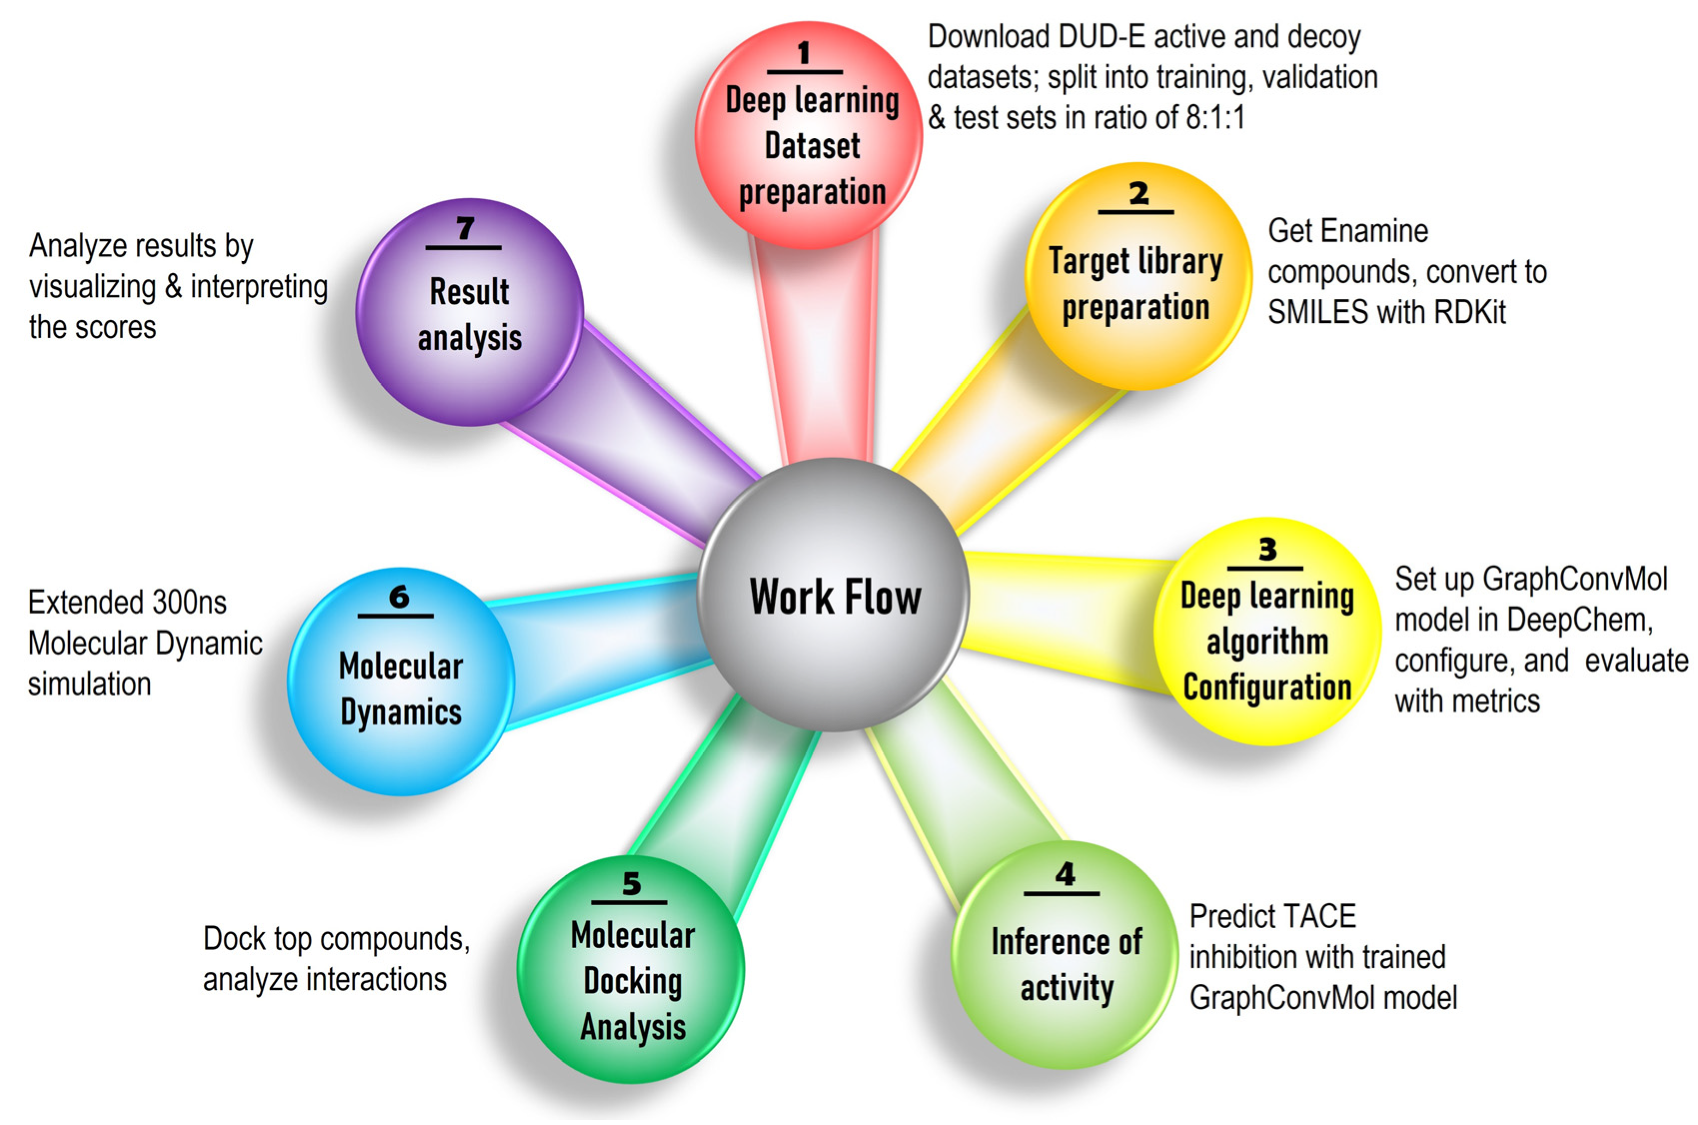
The identification of novel TACE inhibitors was accomplished through a comprehensive computational pipeline that combined ligand-based virtual screening with a deep learning framework and structure-based techniques, including molecular docking and molecular dynamics (MD) simulations, as depicted in
Figure 1. This workflow was executed in seven sequential steps.
Active and decoy compounds were initially retrieved from the DUD-E (Database of Useful Decoys: Enhanced) repository, which provides experimentally validated active molecules alongside decoys with similar physicochemical properties but distinct topologies.
The datasets were curated and preprocessed to prepare target-specific input data suitable for deep learning models, including computation of molecular descriptors via cheminformatics tools such as RDKit.
The deep learning model, specifically the GraphConvMol algorithm from the DeepChem library, was implemented and trained on the dataset to distinguish active TACE inhibitors from decoys by learning molecular representations.
The trained model was employed to predict the inhibitory potential of enamine compounds, to prioritize candidates with a high likelihood of TACE inhibition.
Structural refinement and selection of high-affinity compounds were performed via molecular docking using Discovery Studio tools.
Leading candidate molecules further evaluated by 300 ns MD simulations to evaluate the binding stability and dynamic behavior of the ligand–protein complexes.
Finally, a detailed analysis of computational prediction results was conducted to assess the therapeutic potential of the newly identified inhibitors.
This integrated approach leverages the strengths of Deep learning for high-throughput screening and the precision of structure-based modeling for mechanistic insights, allowing efficient discovery and validation of promising TACE inhibitors.
3.1. TACE Active and Decoy Datasets and RDKit Preprocessing
The Database of Useful Decoys: Enhanced (DUD-E) is a leading resource in computational drug discovery, specifically tailored for benchmarking molecular docking and virtual screening algorithms. DUD-E provides well-curated datasets consisting of experimentally validated active ligands and carefully selected decoy molecules for a wide array of protein targets. Decoys are intentionally designed to share similar physicochemical properties, such as molecular weight, LogP, hydrogen bond donor/acceptor count, topological polar surface area (TPSA), and rotatable bond count, with active compounds, while maintaining topological distinctions that preclude effective binding to the relevant protein target [
41]. For TACE, the dataset for 532 confirmed active compounds was obtained. All molecules in these datasets are typically described by their canonical SMILES representations, supporting detailed computational analysis and chemical annotation. Molecular descriptors are systematically calculated using tools like RDKit, an open-source cheminformatics library in Python that enables the extraction of a broad set of descriptors and supports in-depth visualization and characterization of molecular properties [
42,
43].
Comparative analyses of the TACE-specific dataset reveal that the physicochemical descriptor distributions, spanning molecular weight, LogP, hydrogen bond donors/acceptors, TPSA, and rotatable bonds are closely matched between actives and decoys. Despite these similarities, decoys are structurally dissimilar in terms of their two-dimensional shape, which ensures they do not bind effectively to the protein target.
3.2. Configuration, Training, and Assessment of the Deep Learning Model
DeepChem is a widely adopted open-source toolkit developed in Python, specifically designed to streamline the use of deep learning within cheminformatics and pharmaceutical research. It encompasses an extensive collection of utilities for handling molecular datasets, supporting the development, training, and evaluation of deep learning models. The platform is highly regarded for its flexibility in enabling tasks such as molecular property prediction, ligand-based screening, and optimization of potential therapeutic compounds [
44,
45].
In the current investigation, the GraphConvMol algorithm available in DeepChem was employed to segregate active inhibitors from inactive decoy molecules within the TACE dataset. This model leverages graph-based neural network architectures capable of autonomously learning intricate molecular features directly from chemical graph representations, making it particularly valuable for applications in computational chemistry and virtual screening [
46,
47]. To construct and validate predictive models, the entire dataset was systematically divided into training, validation, and test portions according to an 8:1:1 ratio. To rigorously assess model generalization and performance stability, five-fold cross-validation was implemented.
Model effectiveness was primarily determined using established classification criteria, with a focus on the Area Under the Receiver Operating Characteristic Curve (AUC-ROC) measured across all dataset splits. Within the five-fold cross-validation framework, the model demonstrated an exceptional ability to discriminate between active and inactive compounds: the training set’s ROC analysis revealed a nearly ideal AUC value of 0.99574, characterized by a True Positive Rate approaching 1 at minimal False Positive Rates (
Table 1). This underscores the model’s outstanding classification power.
Within the context of the TACE dataset sourced from DUD-E, the GraphConvMol model consistently delivered perfect discrimination. All major evaluation metrics, including accuracy, sensitivity, specificity, precision, recall, and F1 score, reached their maximum values of 1.0, illustrating the model’s remarkable capacity to distinguish between true TACE inhibitors and decoy molecules without error.
Due to the pronounced imbalance between active compounds and decoys in the dataset, the Matthews correlation coefficient (MCC) was employed to assess the GraphConvMol model’s effectiveness, given its suitability for evaluating performance on skewed datasets. The mean MCC values from five-fold cross-validation reached 1.00 for both training and validation sets, indicating perfect predictive accuracy and emphasizing the model’s reliability and robustness.
3.3. Prediction of TACE Inhibitory Potential from Enamine Compound Libraries
A comprehensive virtual screening was performed on a compound library comprising 460,160 small molecules obtained from Enamine Ltd. To assess their potential as TACE inhibitors, the GraphConvMol deep learning model implemented in the DeepChem platform was utilized for activity prediction. The predicted activity scores, spanning a scale from 0 (inactive) to 1 (highly active), indicated that the vast majority of compounds were unlikely to demonstrate inhibitory activity. However, a subset of 169 molecules achieved high activity predictions, each with a score exceeding 0.95. From this group, the 100 compounds with the highest predicted inhibitory potential were selected to advance to the next stage of the workflow, which involved detailed structure-based virtual screening. The known TACE inhibitor BMS-561392 was also incorporated as a reference compound for comparative evaluation. These prioritized candidates were subsequently subjected to molecular docking and molecular dynamics simulations to further investigate their binding characteristics and stability within the TACE active site.
3.4. Conformational Assessment of the TACE
The crystal structure of TACE (2OI0) is composed of a single polypeptide chain of 266 amino acids arranged into secondary structural elements such as α-helices, β-sheets, and coils. Analysis of the Ramachandran plot revealed that 96.2% of residues reside in favored regions, with all residues located within allowed conformations and no outliers detected in the phi (φ) and psi (ψ) angles, indicating a well-defined and stable protein structure. Complementary secondary structure assessment via VADAR showed that the protein contains roughly 30% α-helices, 27% β-sheets, 42% coils, and 22% turns.
3.5. The Ligand Binding Site Analysis
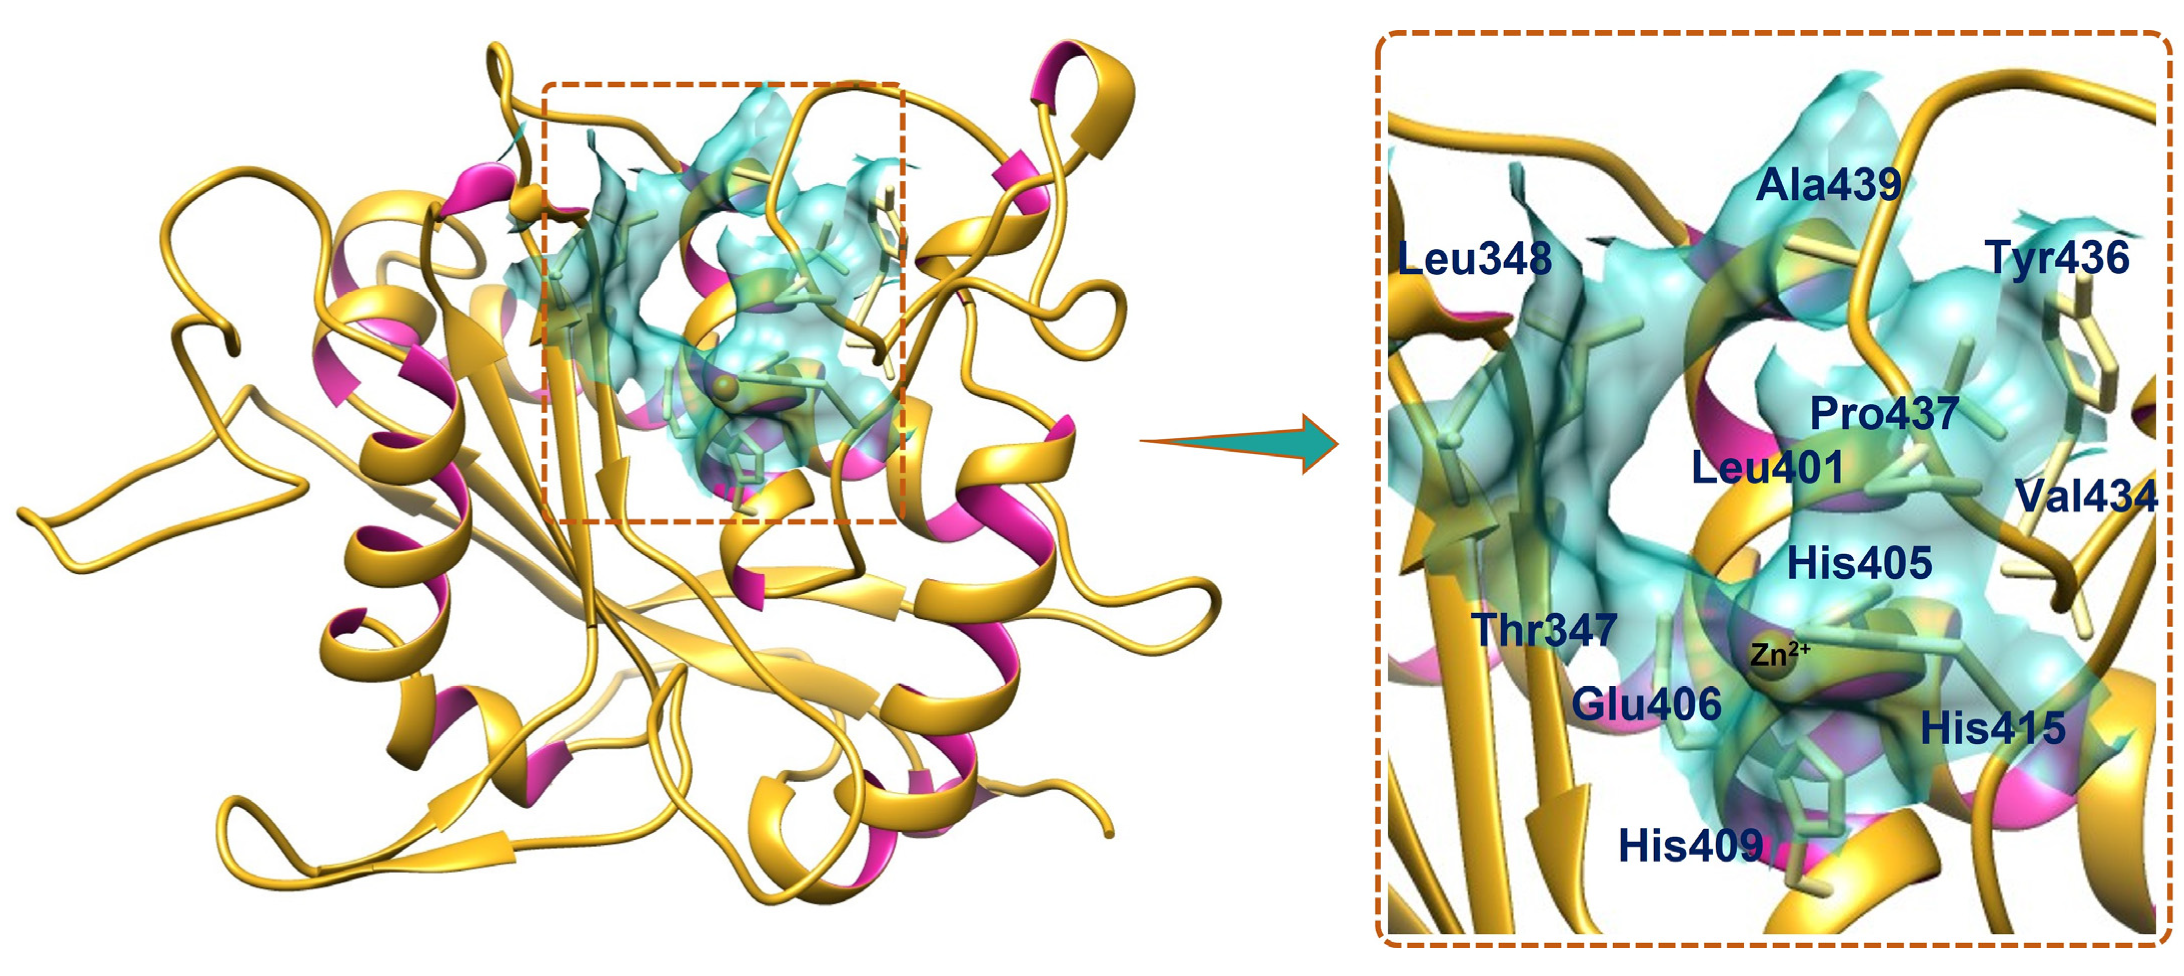
The binding pocket of TACE is a distinct region on the protein surface, defined not only by its three-dimensional geometry and the spatial arrangement of key amino acid residues but fundamentally by the presence of a catalytic zinc ion at its core. This zinc ion is coordinated by three histidine residues (His405, His409, and His415) and a critical glutamic acid (Glu406), forming the core of the active site essential for enzymatic activity [
18,
48,
49,
50,
51]. Using Discovery Studio’s ligand interaction analysis of the ligand-bound TACE structure (PDB: 2OI0), crucial residues forming the binding pocket were identified, including Thr347, Leu348, Leu401, His405, Glu406, His409, Ala439, His415, Val434, Tyr436, and Pro437 (
Figure 2). The zinc ion plays a pivotal role by stabilizing ligand binding through direct coordination, effectively anchoring them within the pocket and facilitating precise molecular recognition. This coordination intricately modulates the chemical environment, enabling the zinc to accommodate diverse ligands. The binding pocket was, therefore, defined with spatial coordinates X = 44.4357, Y = −28.4975, and Z = 3.0389, and a radius of 8.1601, encompassing the residues surrounding the zinc coordination site. This configuration was used to explore interactions between selected enamine compounds and TACE’s active site residues, underscoring the indispensable contribution of the zinc ion in mediating ligand engagement and enzymatic inhibition.
3.6. Molecular Docking Analysis
The CDocker module in Discovery Studio was utilized to assess docking performance by computing key negative energy metrics: CDocker energy and CDocker interaction energy. The CDocker energy encapsulates the total docking score, reflecting the integrated contribution of the protein and ligand’s three-dimensional structures, physicochemical properties, and binding energy. In contrast, the CDocker interaction energy specifically gauges the binding strength by quantifying the energetic contributions from hydrogen bonding, electrostatic interactions, and van der Waals forces that occur directly between the ligand and the protein receptor. This dual analysis facilitates a comprehensive understanding of both overall docking fitness and the detailed interaction profile governing ligand–receptor binding affinity [
52].
Compounds were ranked according to their CDocker energy values, as this scoring function accounts for both ligand–receptor interaction energies and conformational stability, thereby providing a reliable measure of binding affinity and allowing consistent prioritization of the most promising candidates. The results revealed several promising compounds when compared to the reference inhibitor BMS-561392 (
Table 2). The docking results of all docked enamine compounds are manifested in the
Supplementary Data Table S1. Among the top screened compounds, Z2242870510, Z1459964184, Z1450394746, Z1528724474, and Z1528728414 emerged as the top-tier candidates. Z2242870510 manifests the lowest CDocker energy (−56.14 kcal/mol) and a strong interaction energy (−72.07 kcal/mol). This suggests that the compound not only adopts a highly stable conformation within the binding site but also forms favorable interactions with the protein. Z1459964184 displayed very similar behavior, with a CDocker energy of −56.11 kcal/mol and interaction energy of −65.44 kcal/mol, indicating that it too may serve as a potential lead compound. Other molecules such as Z1450394746 (−52.65 and −56.58 kcal/mol), Z1528724474 (−52.25 and −69.94 kcal/mol), and Z1528728414 (−51.95 and −73.50 kcal/mol) also showed strong binding profiles, with Z1528728414 in particular exhibiting a highly favorable interaction energy that closely approaches the reference compound.
When compared with BMS-561392, the reference compound, a clear distinction emerges between docking stability and interaction strength. The reference molecule demonstrated a CDocker energy of −46.88 kcal/mol, which is less favorable than the majority of the screened compounds, yet its interaction energy of −84.74 kcal/mol was the strongest observed. This indicates that although the reference inhibitor may not adopt the most stable pose according to docking calculations, it is capable of forming exceptionally strong and specific interactions within the binding site, likely contributing to its known biological activity. Interestingly, compounds such as Z2242870510 and Z1528728414 showed interaction energies approaching that of the reference compound, while simultaneously maintaining more favorable docking energies, suggesting they could combine the benefits of both stable binding and strong molecular interactions.
Moreover, a molecular docking cross-comparison was carried out on the top 15 compounds identified from Discovery Studio using PyRx (AutoDock Vina) and GNINA. The analysis consistently revealed that compounds Z2242870510, Z1459964184, and Z1450394746 outperformed the other screened candidates across both docking platforms, thereby maintaining their ranking among the top-tier compounds (
Supplementary Data Table S2). Interestingly, the reference inhibitor BMS-561392 emerged as the best-performing compound in both AutoDock Vina and GNINA docking assessments, further validating the reliability of the docking workflow. Overall, the results suggest that several of the screened compounds outperform the reference compound in terms of docking energetics, with Z2242870510, Z1459964184, and Z1528728414 standing out as particularly promising candidates. Their favorable energy profiles highlight their potential as lead scaffolds for further assessment, while the comparison with the reference compound underscores the importance of balancing both docking stability and interaction strength when identifying novel inhibitors.
3.7. Interaction Profiling of Selected Enamine Compounds
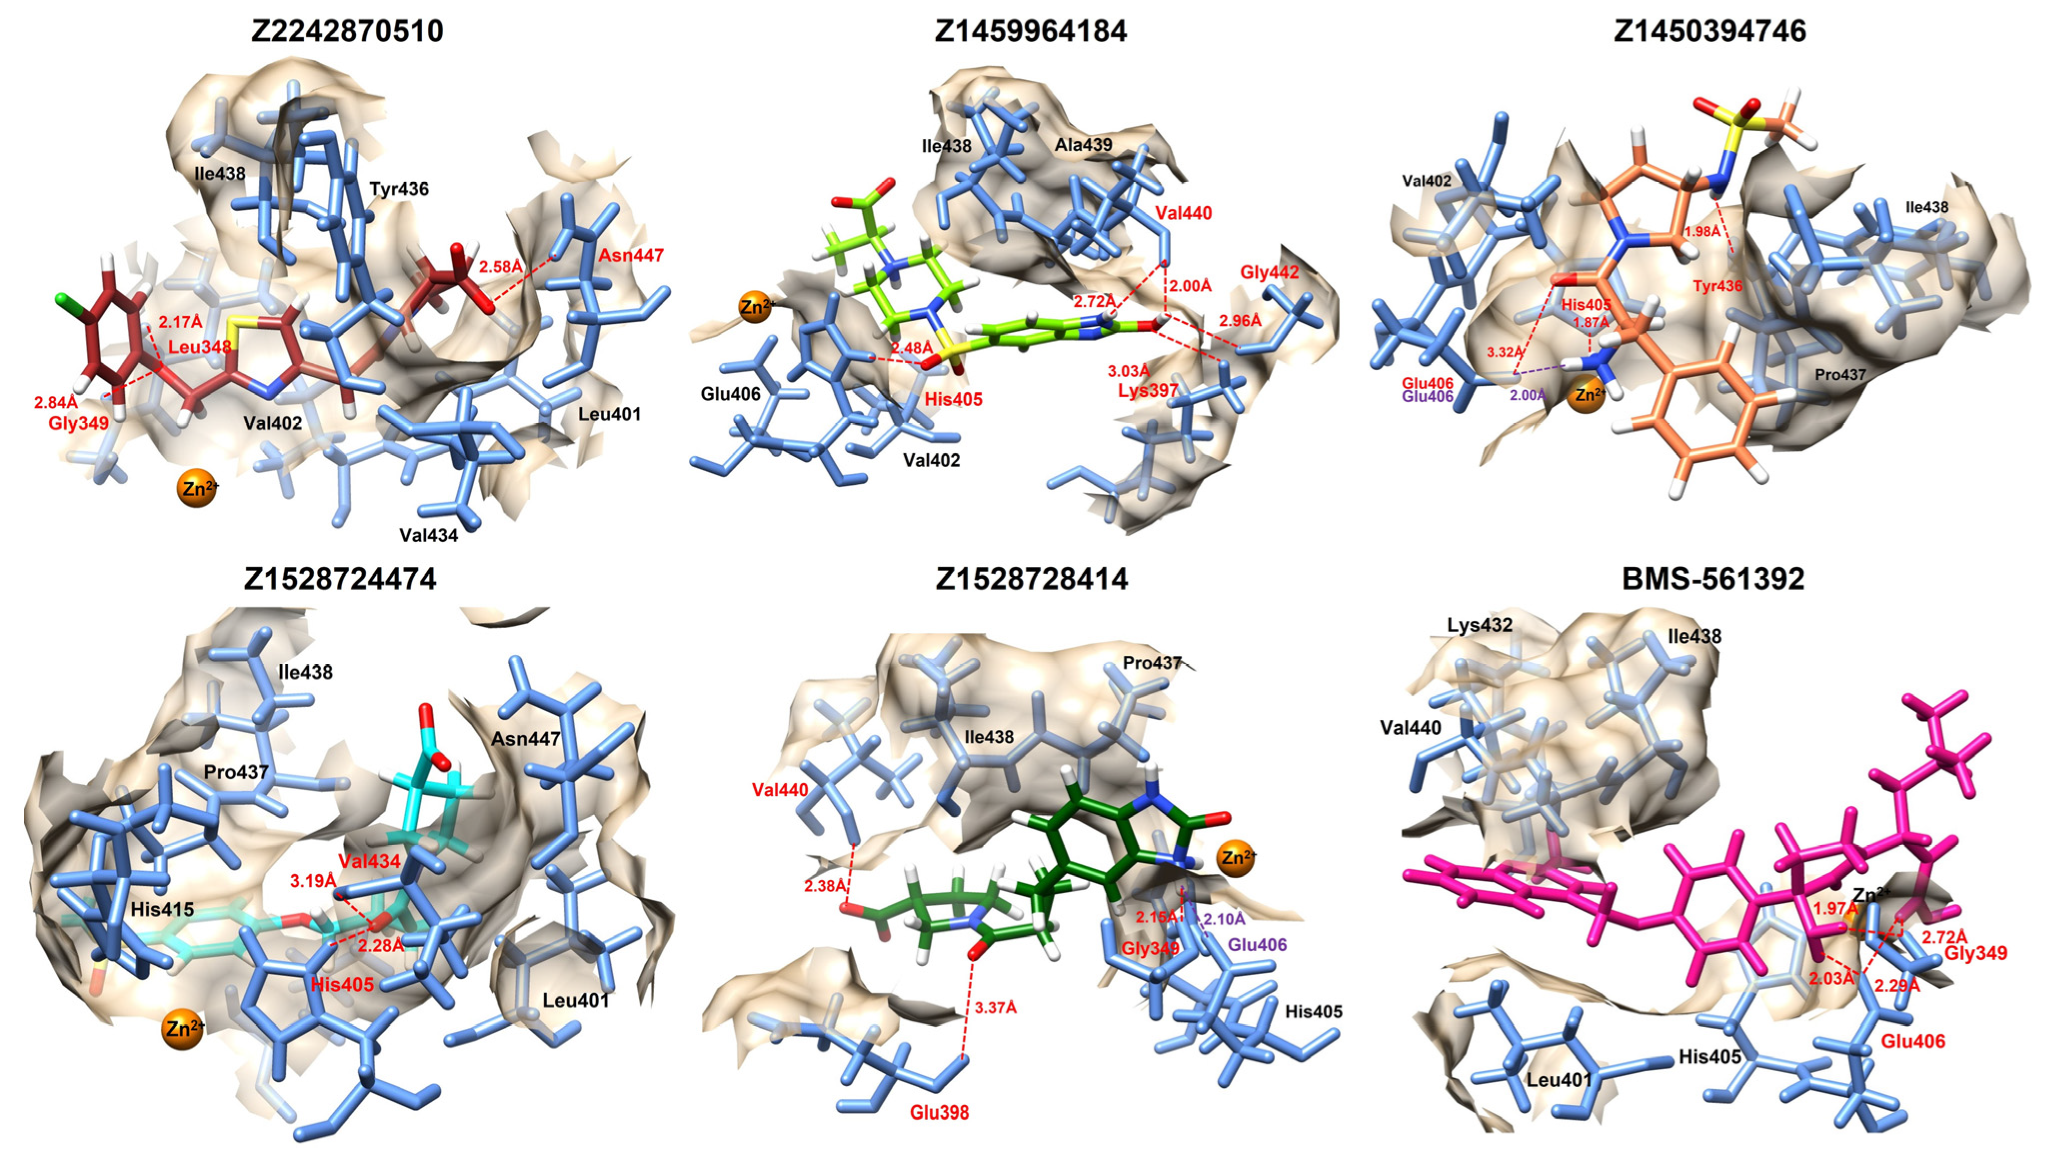
The molecular docking interaction analysis of the top five compounds revealed detailed insights into the specific amino acid residues involved in ligand binding and the strength of interactions based on binding distances. The screened compounds manifested several hydrophobic interactions; however, only strong interactions such as hydrogen bonds and salt bridges were focused on in 3D interaction analysis. The screened enamine compounds mostly formed interactions with His405 and Glu406, critical binding pocket residues; interestingly, Gly349 also emerged in most of the ligand interactions (
Table 3).
Among the screened compounds, Z2242870510 demonstrated interactions with Leu348, Gly349, and Asn447, with hydrogen bond distances of 2.17 Å, 2.84 Å, and 2.58 Å, respectively. The involvement of Gly349 is particularly significant since this residue also interacts with the reference compound BMS-561392, highlighting a potential similarity in binding orientation. Z1459964184 formed interactions with Lys397, His405, Val440, and Gly442, with bond distances ranging from 2.00 Å to 3.03 Å (
Figure 3). Notably, the strong 2.00 Å interaction with Val440 suggests a highly stable bond, while the additional interactions indicate that this compound may anchor itself more extensively within the binding site compared to Z2242870510.
Z1450394746 engaged Glu406, His405, and Tyr436 with very short hydrogen bond distances (1.87 Å and 1.98 Å), suggesting strong and stable interactions. Z1450394746 also formed a salt bridge against Glu406 with a bonding distance of 2.00 Å, a critical binding pocket residue. This is noteworthy as Glu406 also plays a critical role in binding with the reference compound, implying that Z1450394746 may mimic key reference binding modes.
Similarly, Z1528728414 exhibited multiple interactions with Gly349, Glu398, and Val440, at distances of 2.15 Å, 3.37 Å, and 2.38 Å. Furthermore, a salt bridge with Glu406 was also observed with the distance of 2.10 Å. The combination of short bond distances and a salt bridge and additional stabilizing interactions suggests that this compound establishes a broad interaction network within the active site. Z1528724474 formed interactions with His405 and Val434 at 2.28 Å and 3.19 Å, respectively, though the relatively fewer contact points suggest slightly less extensive binding compared to other top compounds.
The reference compound BMS-561392 interacted with Gly349 and Glu406 at short distances ranging from 1.97 Å to 2.72 Å. When compared with the novel compounds, it is evident that Z2242870510, Z1459964184, and Z1528728414 share similar critical interactions with Glu406 and His405, suggesting comparable binding orientations. Moreover, Z1450394746 also made a salt bridge with Glu406, reinforcing its potential as a competitive binder.
Integrating these interaction findings with the docking energy results reveals a consistent trend. Compounds such as Z2242870510, Z1459964184, Z1450394746, and Z1528728414 not only achieved strong docking scores but also engaged in interactions with residues crucial for ligand stability, such as Glu406 and His405, which were also important for the reference inhibitor. Z1528724474, while differing slightly in their residue preferences, formed stable hydrogen bonds with short distances, strengthening their potential as alternative binding scaffolds.
Given these strong interactions and favorable binding properties, these compounds are prime candidates for further molecular dynamics (MD) simulation analysis. MD simulations can provide deeper insights into the dynamic stability and conformational flexibility of these screened enamine compounds over time.
3.8. Molecular Dynamics Simulations
Molecular dynamics (MD) simulations were conducted to investigate the dynamic behavior of protein–ligand complexes, providing detailed information on conformational changes and complex stability under physiological conditions. These simulations also help reveal transient conformations that might enhance inhibitory efficacy. To evaluate the binding stability and structural integrity of the selected TACE–enamine complexes, each docked system underwent a 300-nanosecond MD simulation using the GROMACS software.
3.8.1. RMSD and RMSF
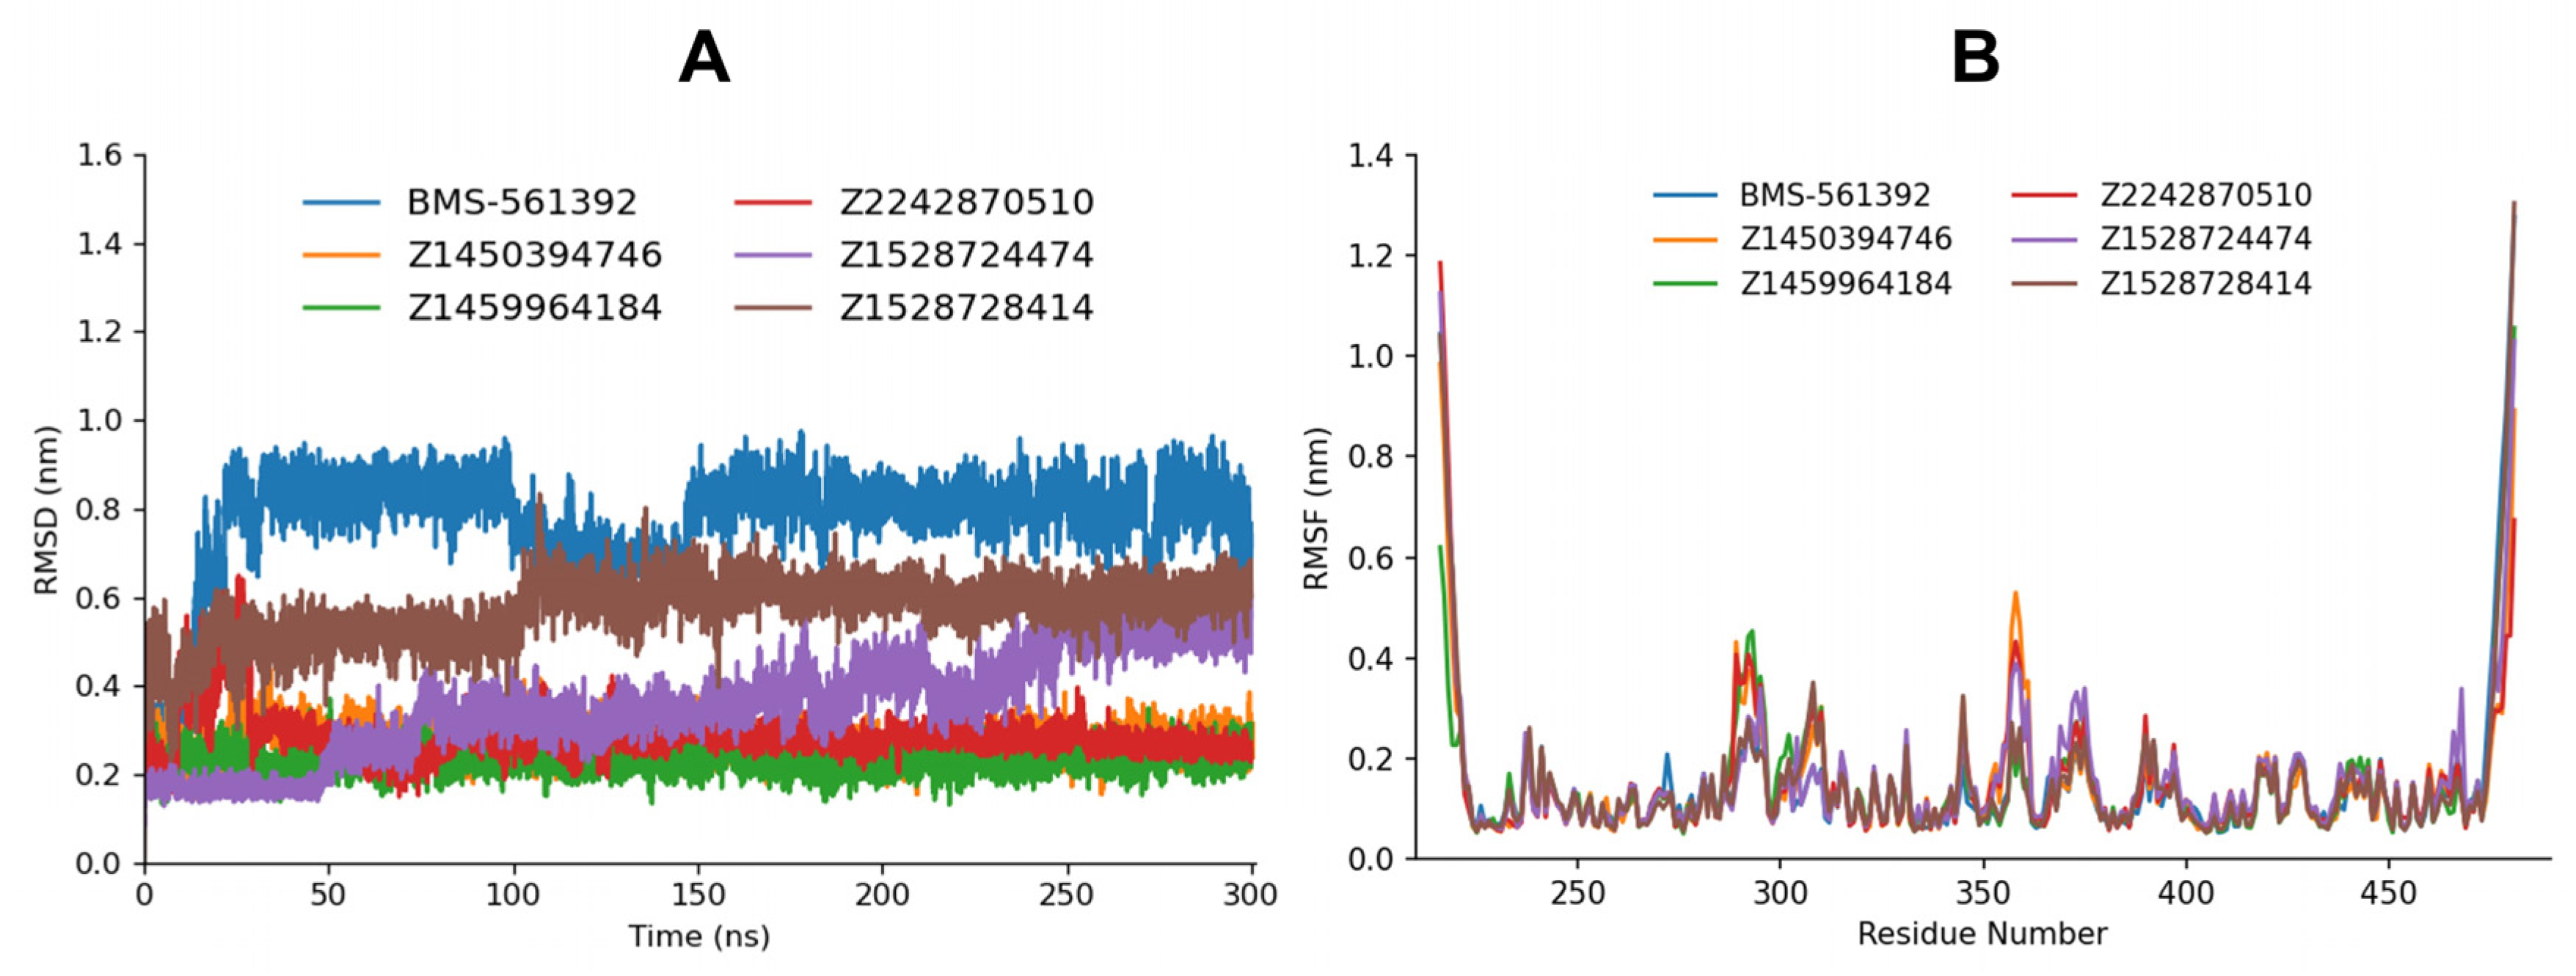
Molecular dynamics trajectory analysis included calculating the Root Mean Square Deviation (RMSD) and Root Mean Square Fluctuation (RMSF) to evaluate the extent of ligand movement within the active site of the TACE protein and receptor residual fluctuation upon ligand binding (
Figure 4).
Across 300 ns, RMSD and RMSF collectively indicate that several candidates stabilize the complex more effectively than the BMS-561392 reference and do so with reduced local loop dynamics. By RMSD, BMS-561392 shows the largest displacement (mean 0.78 ± 0.12 nm), consistent with a comparatively flexible complex. In contrast, Z1459964184 (0.23 ± 0.03 nm) and Z1450394746 (0.27 ± 0.03 nm) maintain compact, low-variance plateaux throughout, and Z2242870510 relaxes by ~128 ns into an equally stable regime (post-eq mean 0.28 ± 0.02 nm with a near-zero drift), all three outperforming the reference by large margins. Z1528728414 sits mid-pack (0.57 ± 0.07 nm) yet is still better than BMS-561392, while Z1528724474 is high (0.36 ± 0.12 nm) with a slight long-time upward drift.
RMSF mirrors these trends: averaged over common residues, Z1450394746 exhibited the lowest per-residue fluctuations (mean 0.147 nm; median 0.113 nm; and SD 0.122 nm), followed closely by Z2242870510 (0.152/0.115/0.128 nm), whereas Z1528724474 showed slightly higher fluctuations (0.157/0.118/0.135 nm). Although the bar graph for Z1528724474 shows greater variation compared to the other compounds, the number of highly flexible sites (RMSF > 0.30 nm) remains comparable across the three ligands (20, 19, and 21, respectively). This suggests that the fluctuations observed for Z1528724474 are more localized to specific residues rather than reflecting global instability of the protein–ligand complex. The most divergent segments are loop/terminal regions: residues ~216–218 peak for all (largest in Z2242870510, consistent with a transient loop breath that does not disrupt its excellent post-eq RMSD), while the C-terminal neighborhood (~468 and 478–481) is more mobile under Z1528724474 than under Z1450394746, matching the latter’s tighter RMSD and suggesting more uniform scaffold stabilization. Taken together, the compounds that minimize global displacement (RMSD) also tend to suppress local backbone fluctuations (RMSF): Z1450394746 couples a low, stable RMSD with the lowest mean RMSF, Z2242870510 combines a brief induced-fit relaxation with very stable post-eq behavior and near-baseline RMSF except for a single loop, and Z1528724474, despite an early RMSD equilibration, permits slightly greater loop breathing at the termini; Z1459964184’s outstanding RMSD and RMSF further reinforce this stability narrative.
The single comparison of each compound against the reference compound has been depicted in the
Supplementary Data Figures S1 and S2 for the RMSD and RMSF, respectively. Overall, the concordance between a low RMSD plateau and a subdued RMSF in key regions supports Z1450394746, Z2242870510, and Z1459964184 as the most compelling stabilizers relative to BMS-561392.
3.8.2. Rg and SASA
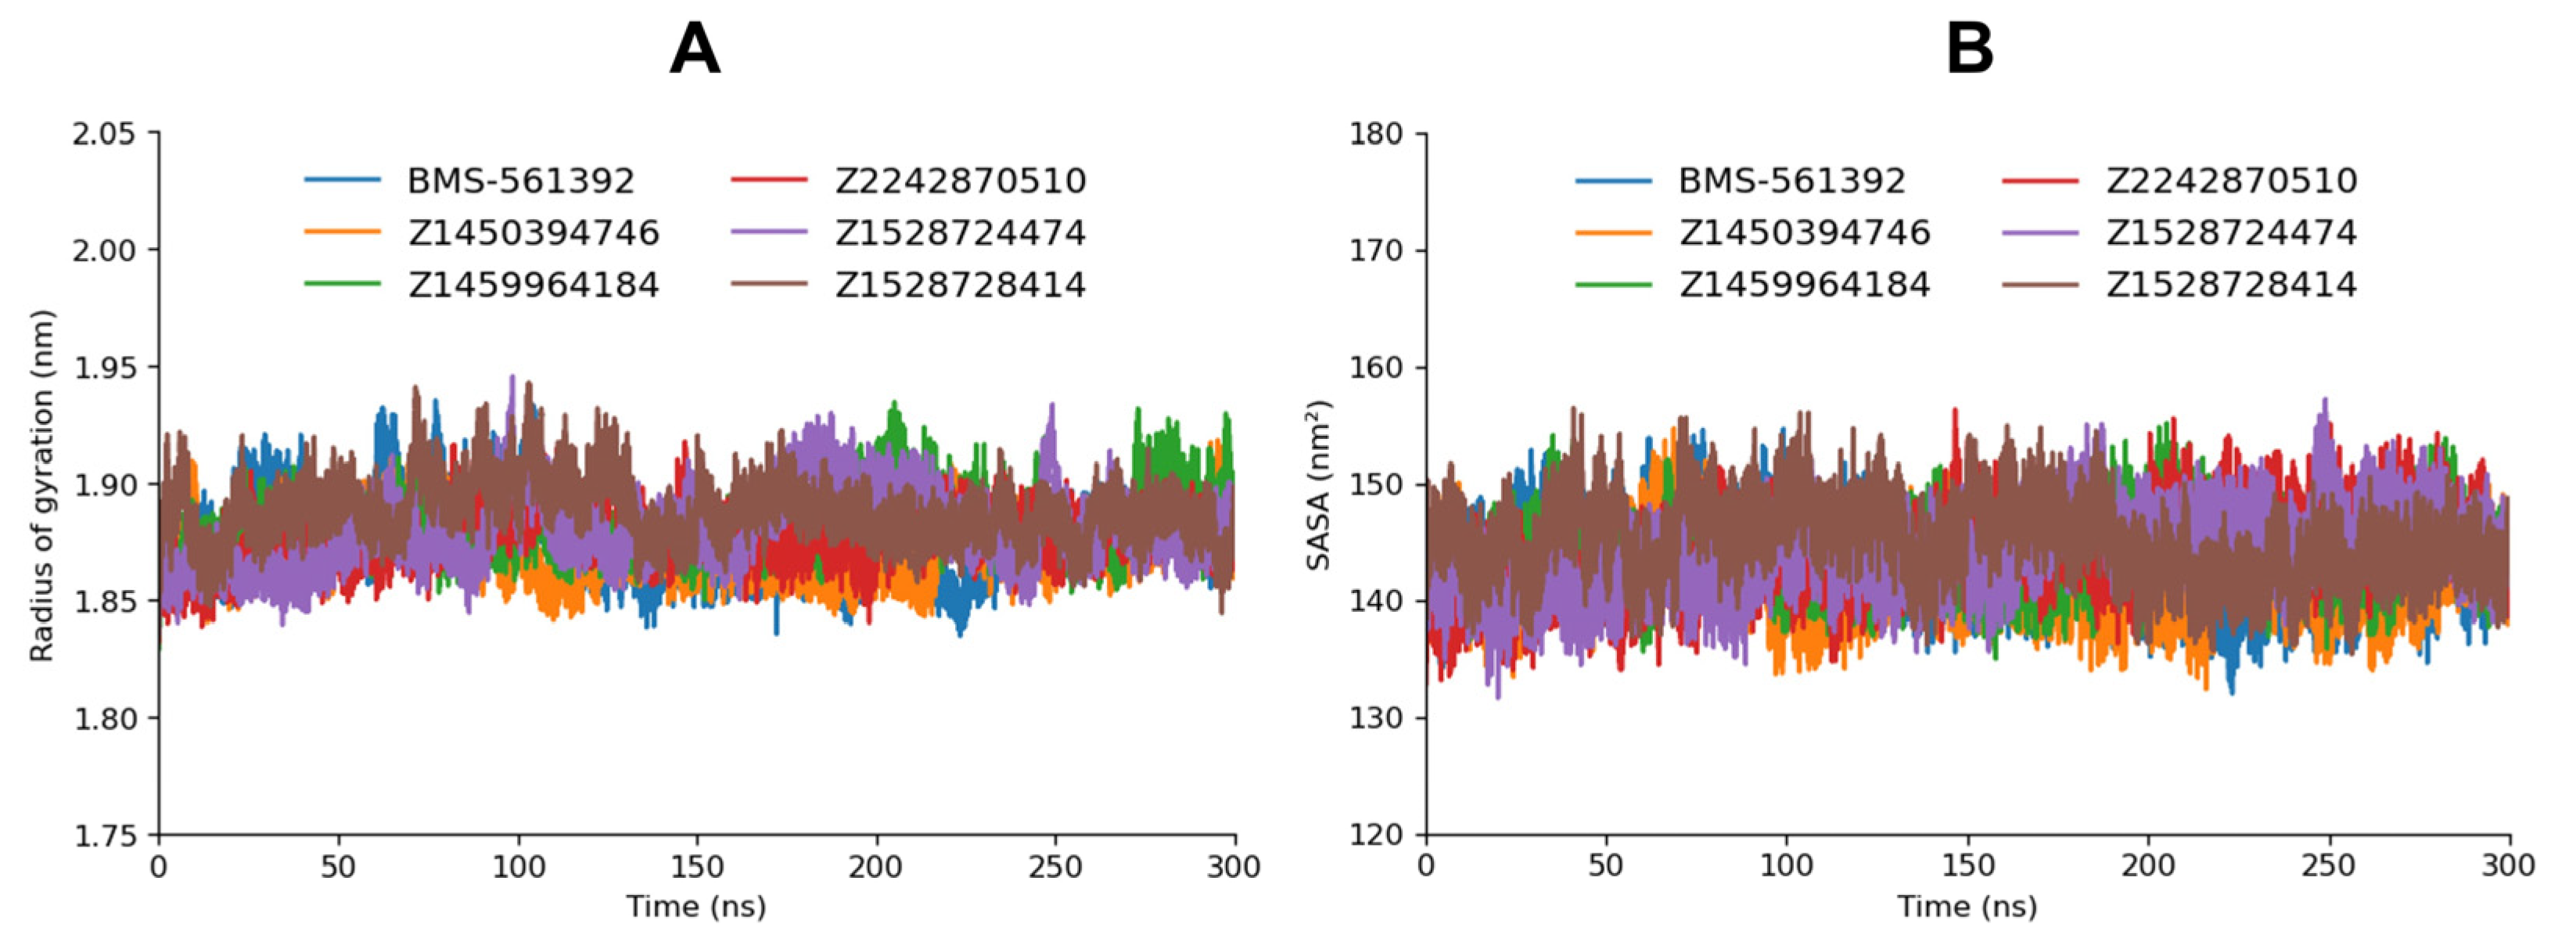
The radius of gyration (R
g) serves as a fundamental descriptor of global compactness and structural stability during molecular dynamics (MD) simulations. Lower R
g values reflect a more compact macromolecular conformation, whereas higher values indicate extended structures. In the present analysis, the reference compound BMS-561392 exhibited a mean R
g of ~1.86 nm and remained highly stable throughout the 300 ns trajectory, with only minor fluctuations. In comparison, the five test complexes (Z2242870510, Z1528728414, Z1528724474, Z1459964184, and Z1450394746) displayed slightly higher average R
g values in the range of 1.87–1.89 nm (
Figure 5). This marginal increase suggests that all test compounds induce subtly fewer compact conformations than BMS-561392, yet without loss of structural integrity. All systems stabilized after the equilibration phase, and no unfolding or large-scale structural perturbations were detected, underscoring the ability of all ligands to sustain a well-folded and stable protein architecture.
Complementary solvent accessible surface area (SASA) analysis corroborates these findings. BMS-561392 maintained a consistent SASA profile, while the five test compounds showed average values fluctuating within 135–140 nm2, nearly identical to the reference. The close overlap in SASA values indicates that none of the complexes underwent appreciable conformational expansion that would increase solvent exposure. Furthermore, the similarity in SASA across all ligands is in line with the Rg analysis, as both metrics converge to demonstrate comparable levels of compactness and solvent shielding.
The comparison of each enamine compound against the BMS-561392 has been manifested in the
Supplementary Data, Figure S3 and Figure S4 for R
g and SASA, respectively. Taken together, the R
g and SASA results collectively indicate that the five test compounds maintain structural compactness and stability nearly equivalent to the reference compound. Among them, subtle differences emerge: BMS-561392 retains the tightest conformation with minimal axis fluctuations, while the test ligands allow slightly greater flexibility but without compromising overall integrity. This suggests that all compounds, despite inducing marginally more dynamic conformations than the reference, stabilize the protein fold effectively, highlighting their suitability as potential inhibitors.
3.8.3. Hydrogen Bond Plot Analysis
The hydrogen bond analysis distinguishes between two types: actual hydrogen bonds, which are directly observed throughout the 100 ns molecular dynamics (MD) trajectory, and potential hydrogen bonds, identified when ligand and receptor atoms remain within 0.35 nm of each other, suggesting a propensity for bond formation in subsequent conformations (
Figure 6).
The hydrogen bond analysis from the 300 ns molecular dynamics simulations provides valuable insight into the interaction profiles of BMS-561392 and the five screened compounds (Z1459964184, Z1450394746, Z1528724474, Z1528728414, and Z2242870510), highlighting notable differences in hydrogen bond formation and stability. BMS-561392 demonstrates a moderate hydrogen bonding profile, averaging about 1.5 hydrogen bonds per frame and 1.8 potential hydrogen bonds, with intermittent peaks of up to 4 hydrogen bonds, reflecting a dynamic yet relatively stable interaction pattern. Among the screened compounds, Z1459964184 exhibits the strongest hydrogen bonding behavior, maintaining an average of 2.0 hydrogen bonds per frame and approximately 5.5 potential hydrogen bonds, with frequent occurrences of 1–3 hydrogen bonds and occasional peaks at 4, suggesting stronger and more stable interactions with the protein or solvent and indicating a potentially superior binding affinity compared to the reference.
Z2242870510 shows significantly compact hydrogen bonding behavior, averaging approximately 1.2 actual hydrogen bonds and 3 potential hydrogen bonds. Interestingly, the number of actual and potential hydrogen bonds increased slightly at the ending trajectory of the MD simulation, a trend similar to BMS-561392, reflecting the adoption of the compound in the binding pocket of the target protein. Z1450394746 also exhibits a robust profile with an average of 1.8 actual hydrogen bonds and an approximate average of 6 Potential hydrogen bonds, suggesting multiple close contacts.
Z1528728414 remained the medium range compound, with approximately 0.8 actual hydrogen bonds and 1.9 potential hydrogen bonds on average. In contrast, Z1528724474 manifested a low number of actual and potential hydrogen bonds with more frequent spatial proximity that does not consistently translate into stable hydrogen bonds, likely due to geometric constraints or weaker interaction energies.
Overall, Z1459964184, Z1528724474, and Z2242870510 emerge as the most promising candidates, with superior hydrogen bonding frequency and stability compared to the reference, while Z1450394746 and Z1528728414 show latent potential that may be structurally optimized to improve hydrogen bond formation.
3.8.4. Binding at 150 ns and 300 ns of MD Simulation
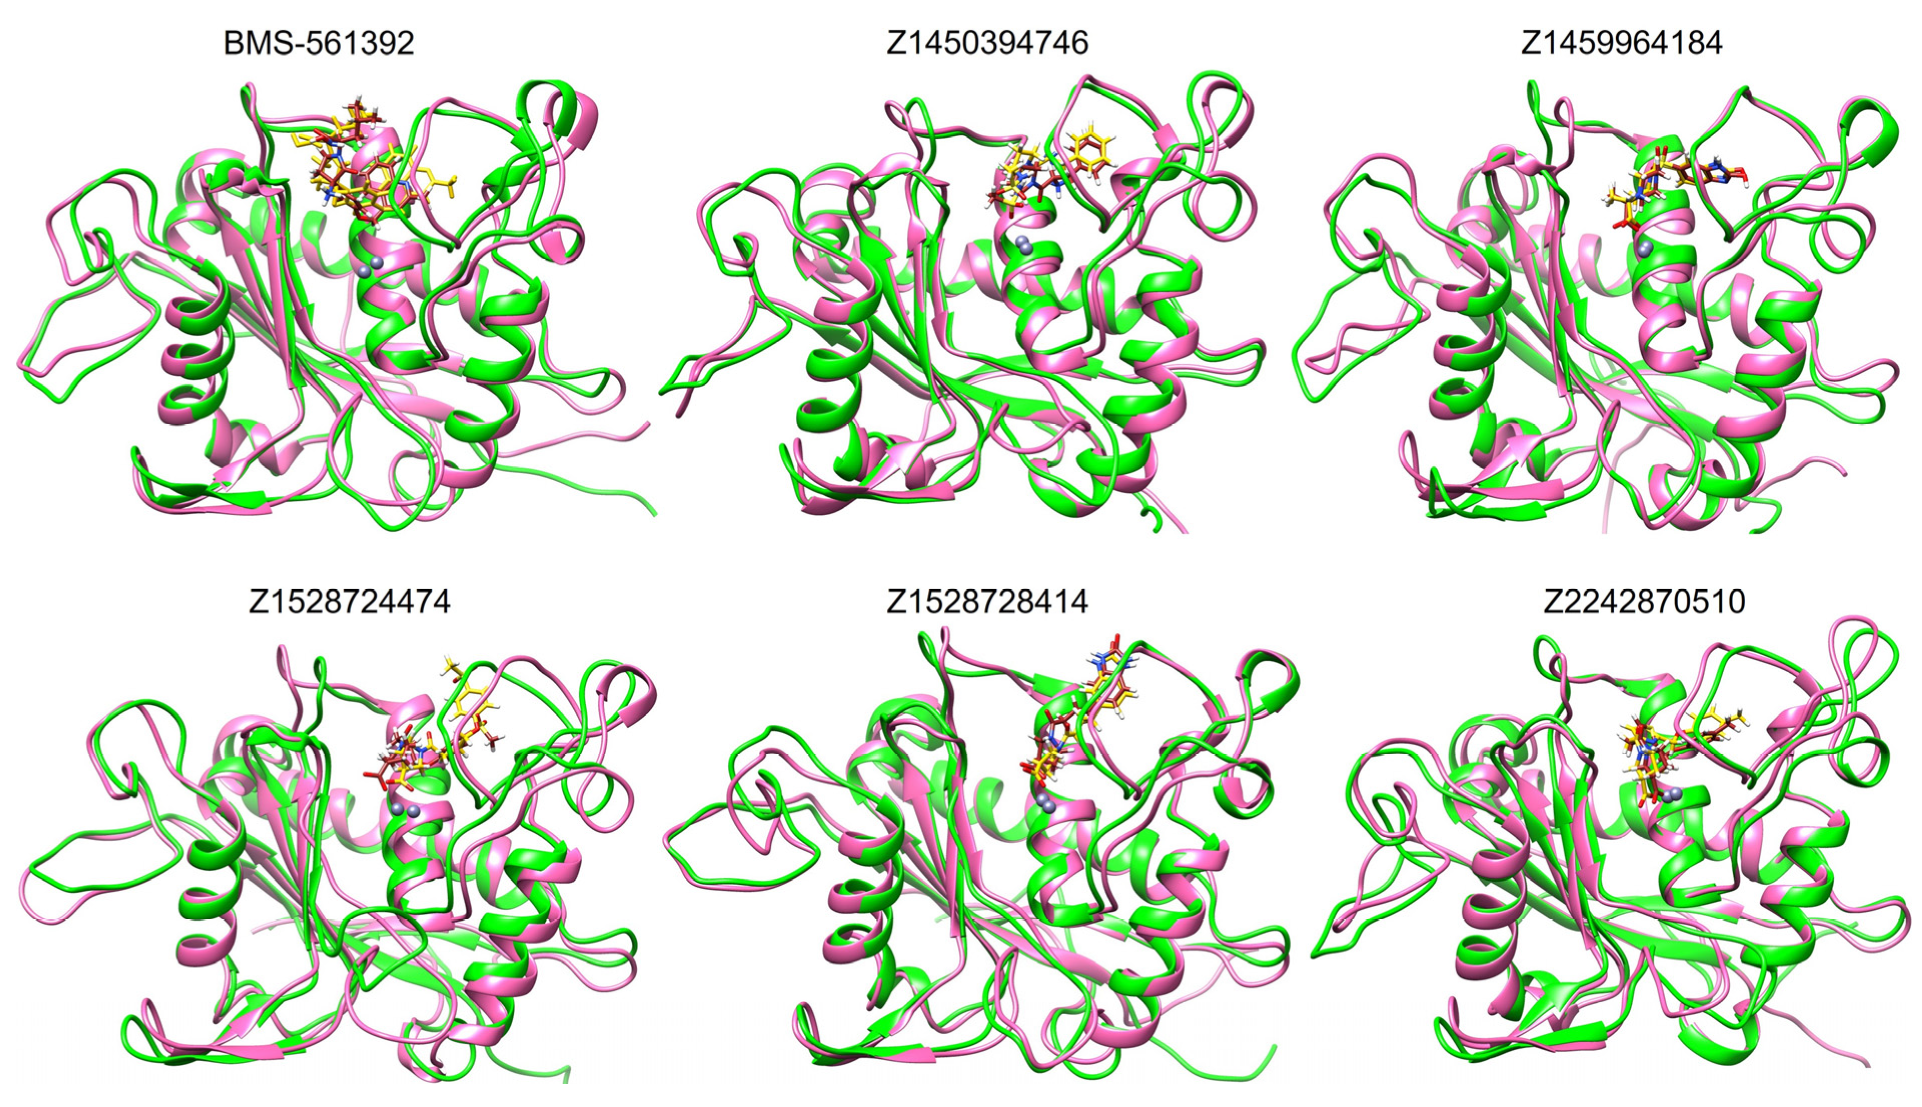
To validate the binding interactions of the enamine compounds during the MD simulation, representative snapshots at 150 ns and 300 ns were analyzed using Discovery Studio and UCSF Chimera and then compared with the RMSD trajectories.
As shown in
Figure 7, the structural snapshots revealed that Z1450394746, Z1528728414, and Z1459964184 depicted almost no conformational change, indicating that these ligands remained tightly accommodated within the catalytic pocket in close proximity to the zinc ion. However, when compared with the RMSD data, a more nuanced picture emerges. While Z1450394746 and Z1459964184 displayed both minimal conformational adjustments in snapshots and excellent RMSD stability, the Z2242870510 snapshot suggested minor conformational adjustments within the binding site, but its RMSD profile revealed strong stability throughout the trajectory, comparable to Z1450394746 and Z1459964184. This indicates that the compound likely achieved stability through gradual accommodation within the pocket, where slight positional shifts ultimately led to a stable ligand–protein interaction.
Z1528728414 showed a minor fluctuation around 110 ns, but from 120 ns to 300 ns the RMSD plot remained highly stable, indicating that the ligand required no further positional adjustment. Similarly, the reference compound BMS-561392 and Z1528724474 displayed minor fluctuations around 150 ns, which may have been captured in the snapshots as slight conformational adjustments. This trend suggests that the minor rearrangements observed in the snapshots correspond well with the moderate RMSD deviations, reflecting partial but overall consistent stability within the binding pocket.
3.9. Binding Free Energy Calculation
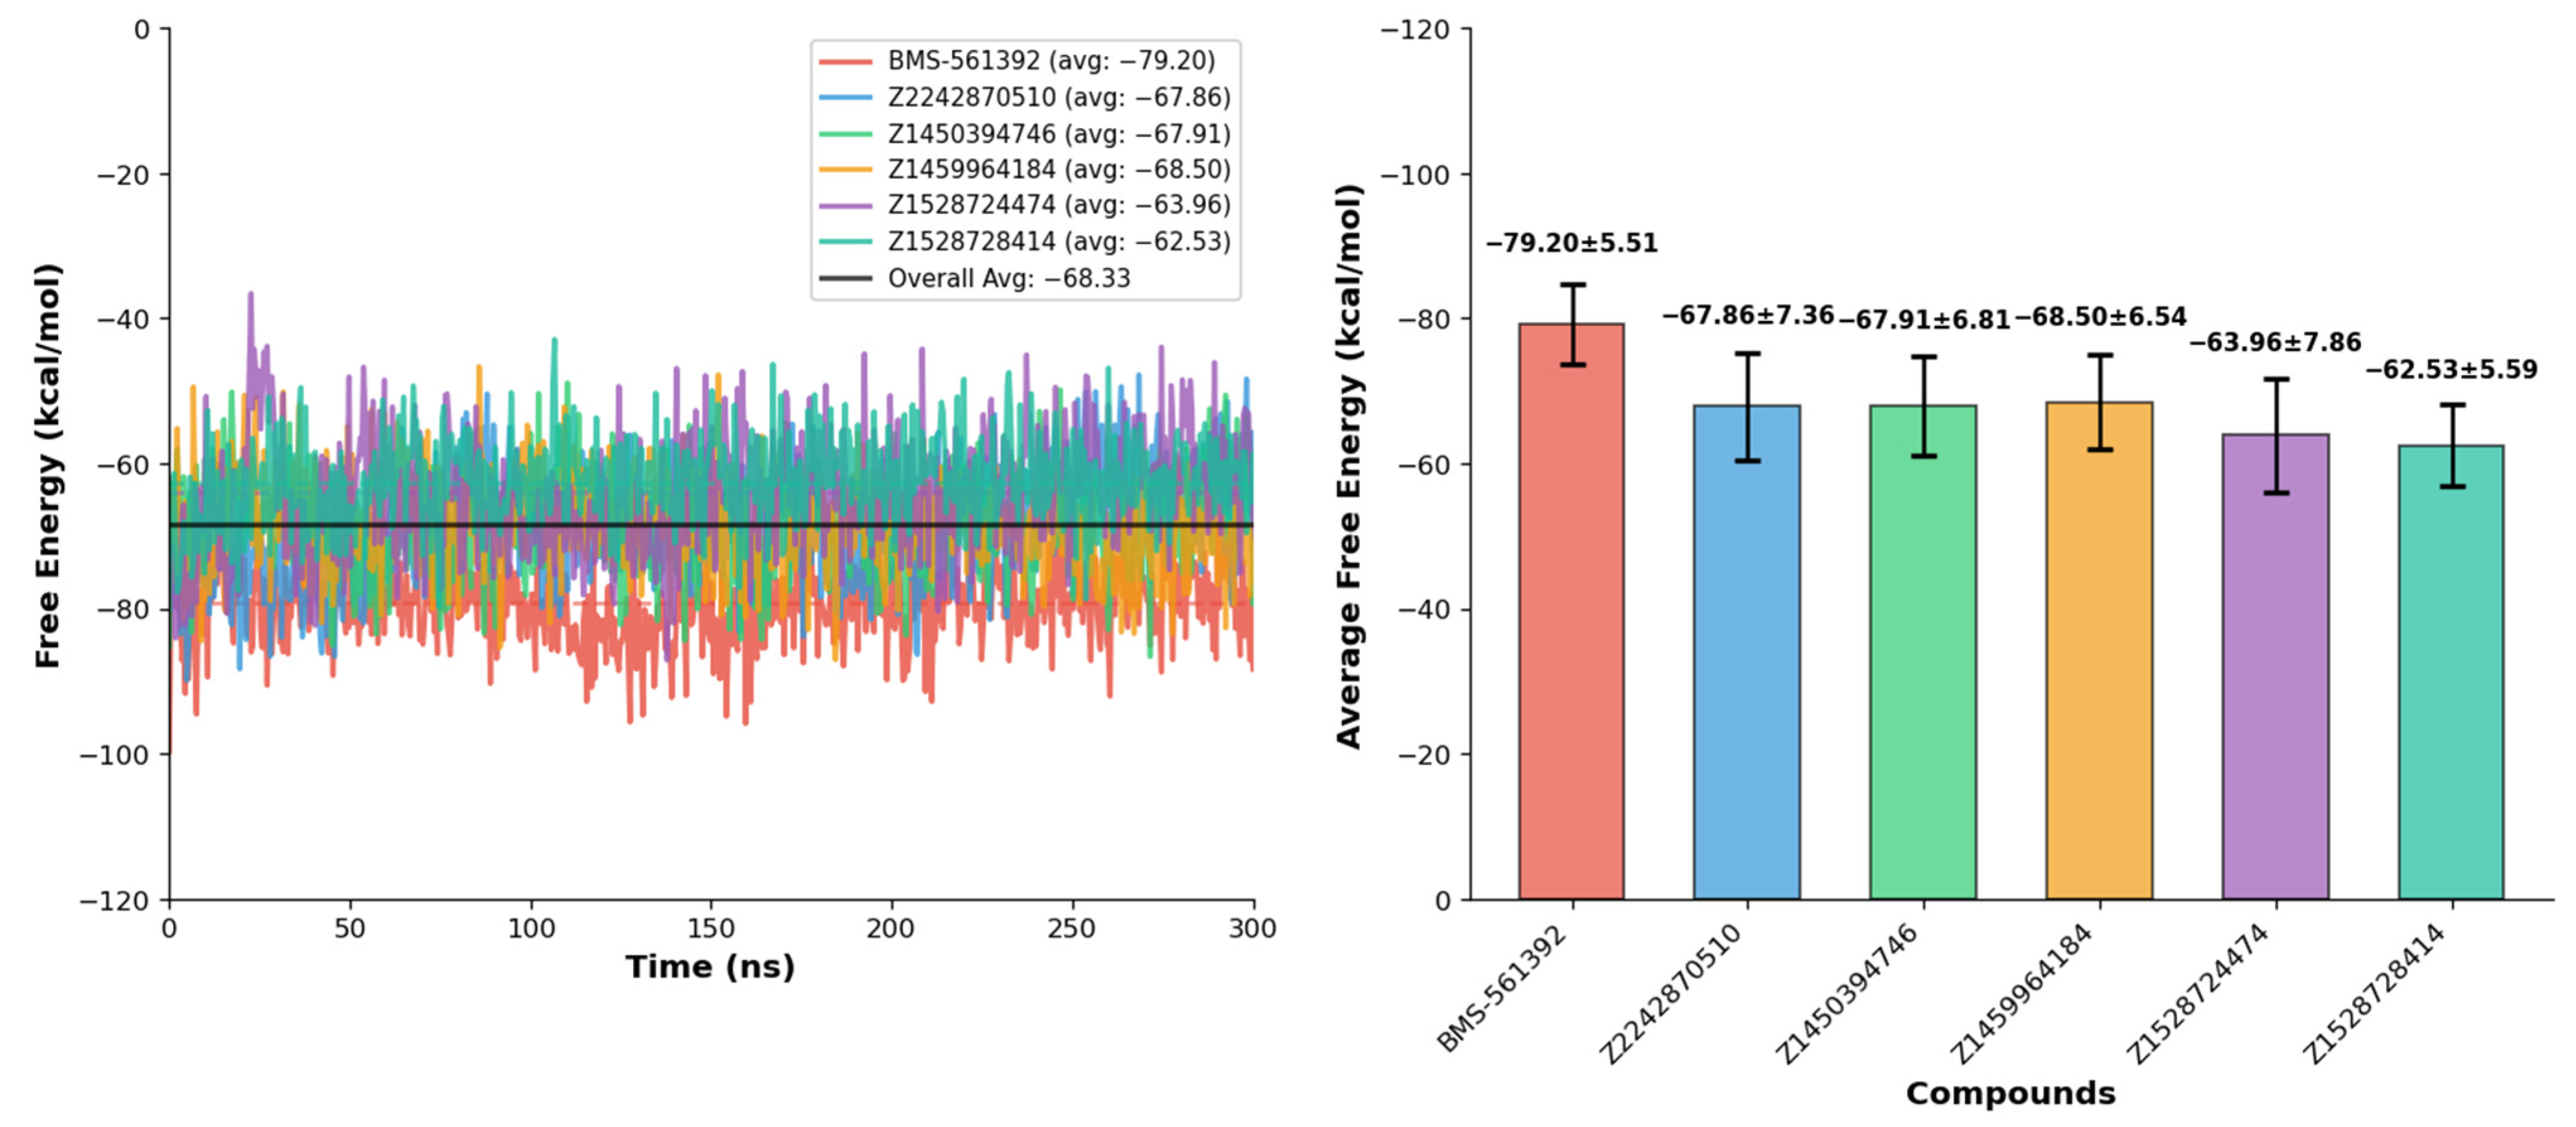
The gmx_MMPBSA analysis was performed to evaluate the binding free energies of BMS-561392 and the top five screened compounds (Z2242870510, Z1450394746, Z1459964184, Z1528724474, and Z1528728414) based on 300 ns molecular dynamics trajectories. The analysis provides the mean binding free energy (ΔG
binding) along with the standard deviation (SD), minimum and maximum energy values observed, and a stability index for each compound (
Table 4).
BMS-561392 exhibits the most favorable binding energy, with a mean ΔG
binding of −79.20 ± 5.51 kcal/mol, ranging from −99.73 to −59.08 kcal/mol, and a stability index of 0.154, indicating consistent and stable interactions with the target. Among the screened compounds, Z1459964184, Z1450394746, and Z2242870510 display the most favorable binding energies, with mean ΔG
binding values of −68.50 ± 6.54, −67.91 ± 6.81, and −67.86 ± 7.36 kcal/mol, respectively, reflecting significant interactions compared to the reference. Z1528724474 and Z1528728414 show the moderate, favorable binding profiles, with mean binding energies of −63.96 ± 7.86 and −62.53 ± 5.59 kcal/mol, respectively, suggesting weaker binding affinity as compared to the top-tier compounds. The minimum and maximum ΔG
binding values provide insight into the fluctuations during the simulation, with Z2242870510 and Z1459964184 reaching minimum energies of −89.86 and −87.03 kcal/mol, respectively. The stability index, calculated as the ratio of the standard deviation to the mean binding energy, indicates that BMS-561392, Z1459964184, and Z2242870510 maintain relatively consistent binding, while compounds like Z1528724474 display greater variability. The graphical comparison of each compound against the reference compound has been shown in the
Supplementary Data Figure S5. Overall, the gmx_MMPBSA results highlight BMS-561392 as the strongest binder, while among the test compounds, Z1459964184 exhibits the most promising interaction profile, followed by Z2242870510 and Z1450394746 (
Figure 8). Whereas Z1528724474 shows the least favorable binding characteristics.
3.10. Structural Evaluation of the Top Compounds
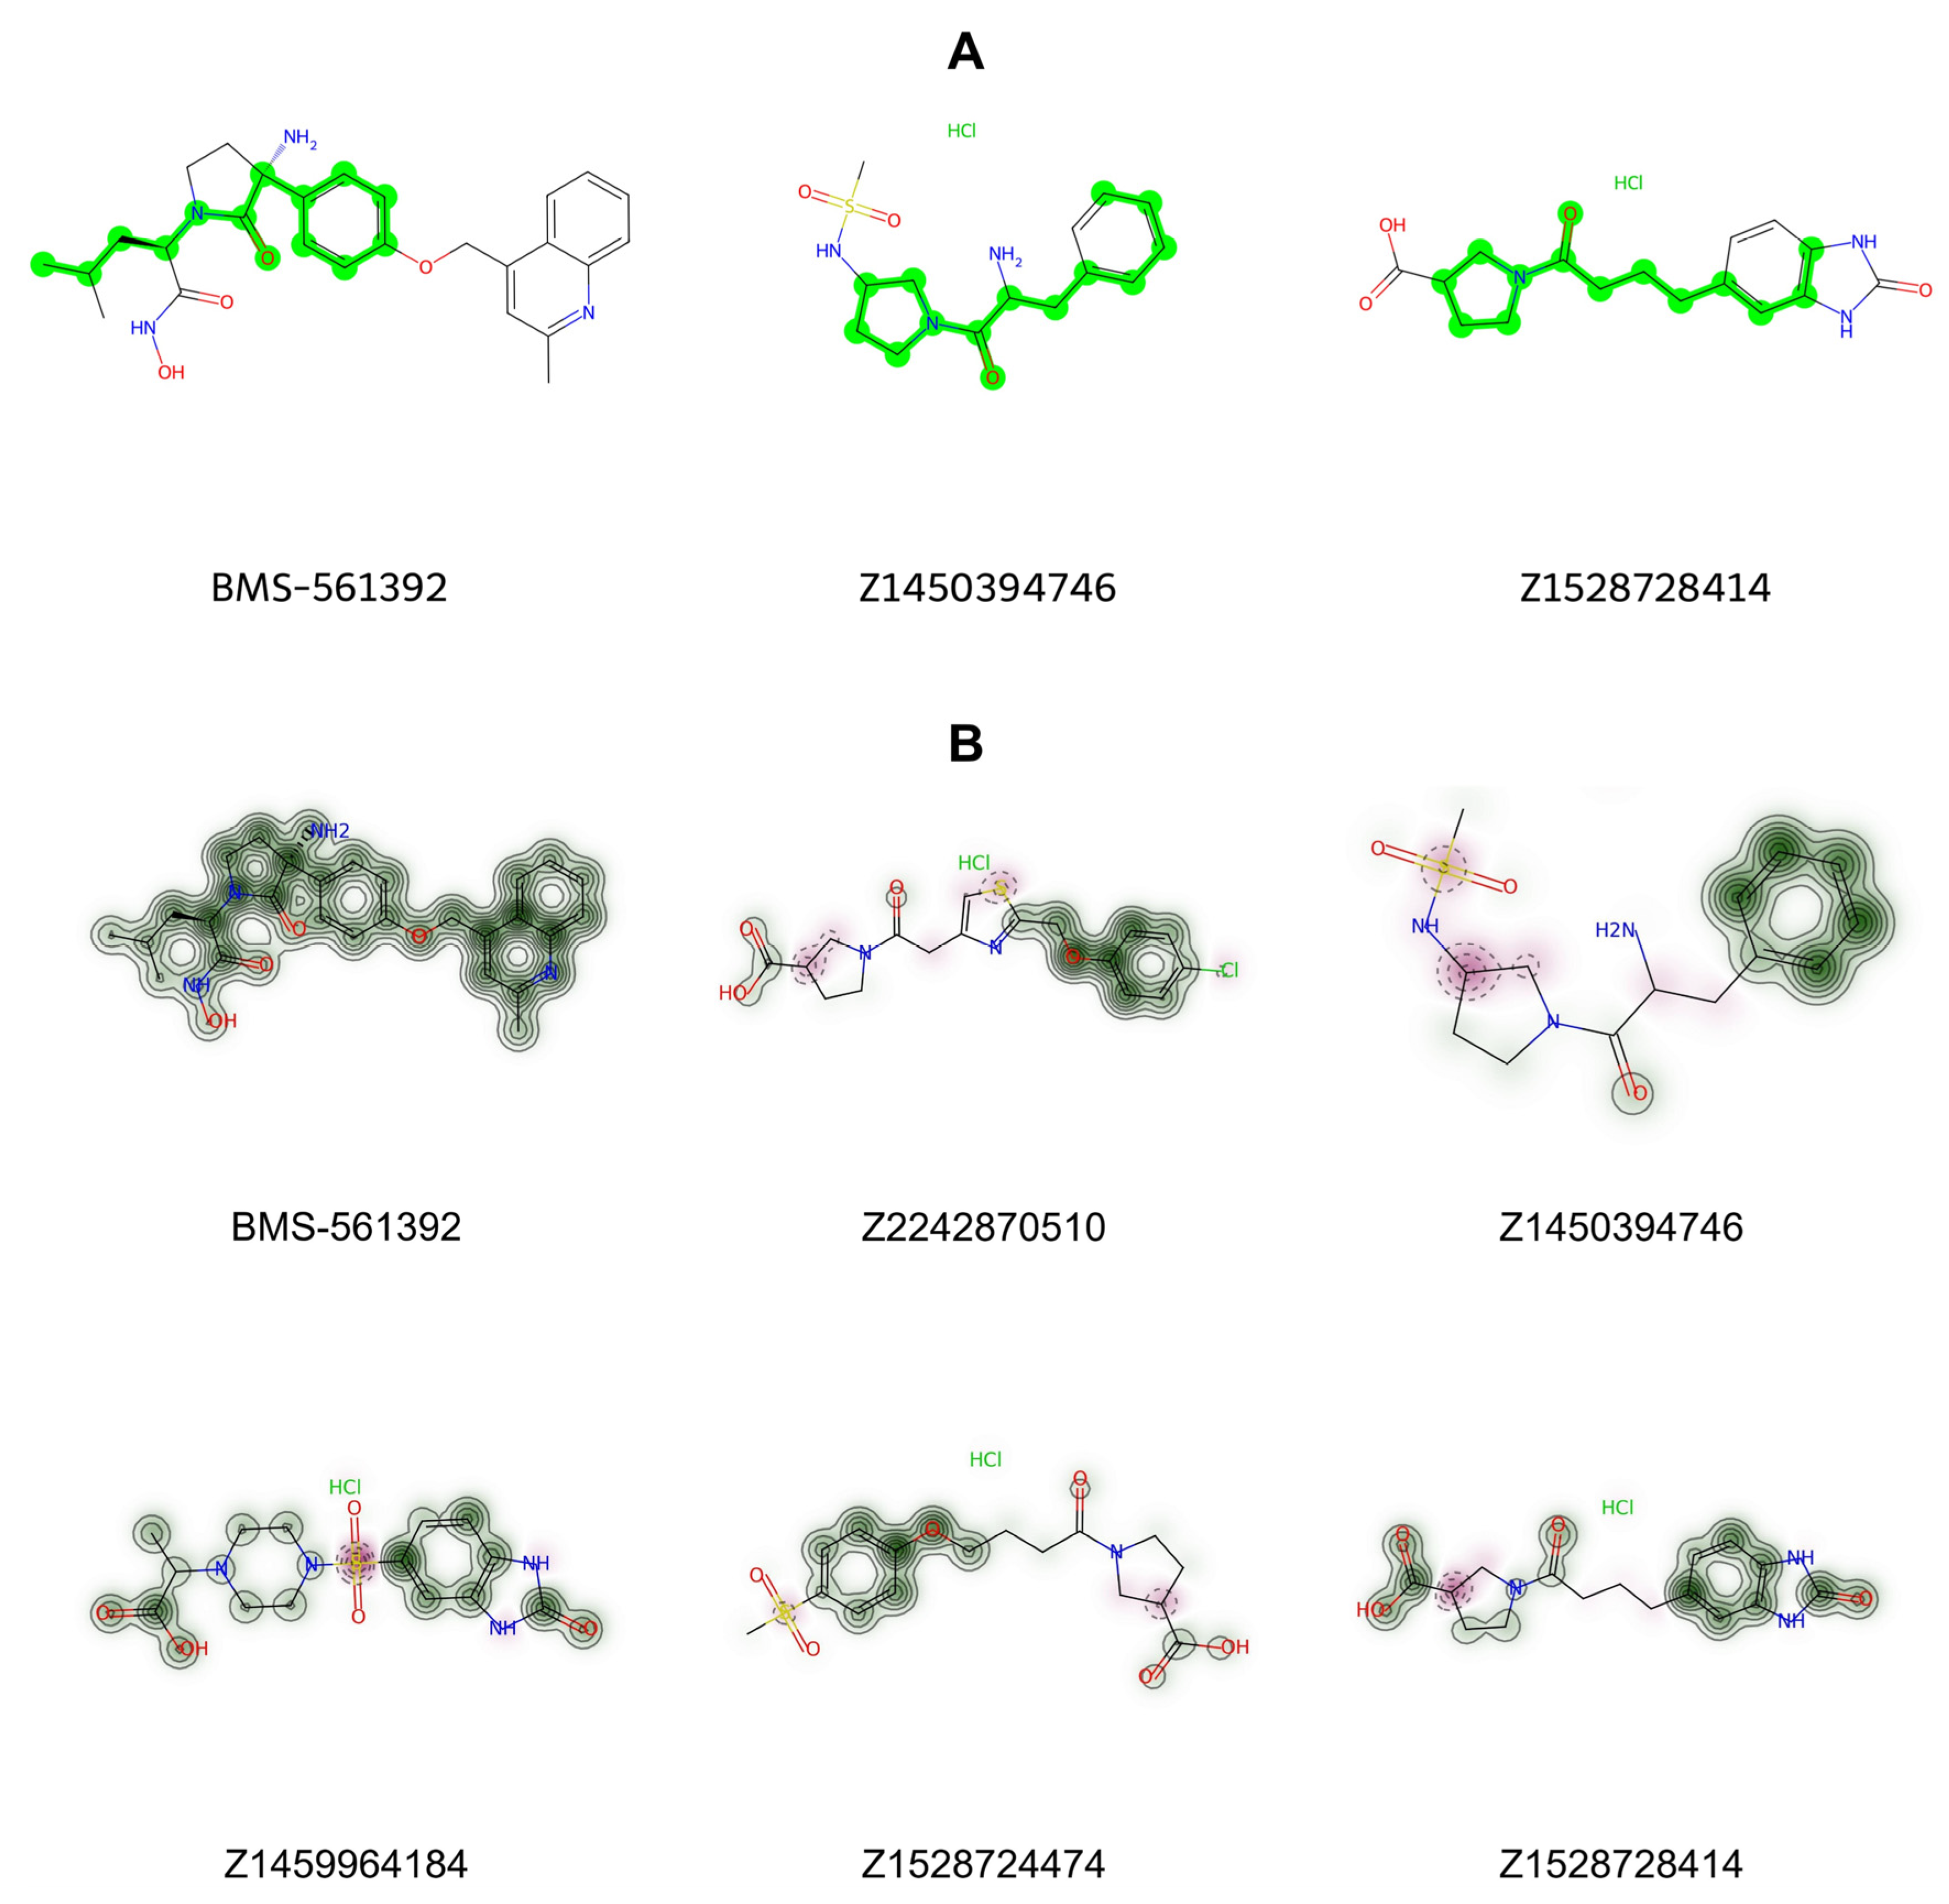
To assess structural commonalities, the Maximum Common Substructure (MCS) algorithm implemented in RDKit, utilizing SMARTS pattern matching, was applied. Apart from the presence of a benzene ring, highlighted in red in
Figure 9, no consistent shared motifs were observed across the selected compounds. This finding implies that inhibitory activity against TACE may be influenced more by the spatial orientation and three-dimensional conformations of these molecules than by simple shared substructures. Furthermore, similarity maps generated from RDKit fingerprints indicated that certain structural features present in BMS-561392 are also found within the selected compounds. Collectively, the insights from similarity mapping analyses offer valuable direction for the rational optimization of these candidate inhibitors.
3.11. Drug Likeness of Top 10 Docked Compounds
The physicochemical characteristics of the screened compounds were further examined, including molecular weight (MW), lipophilicity (LogP), counts of hydrogen bond donors (HBD) and acceptors (HBA), Lipinski rule violations, and the quantitative estimate of drug-likeness (QED).
The molecular weights of these ligands ranged from 347.868 Da in Z1450394746 to 476.577 Da in BMS-561392, remaining within the typical threshold for oral drugs (generally under 500 Da), which suggests favorable absorption and distribution properties. This balance of molecular size indicates that none of the ligands is likely to suffer from bioavailability issues caused by excessive bulk.
The LogP values span a favorable range, indicating an optimal balance between hydrophilicity and lipophilicity that is essential for both solubility and membrane permeability. HBD values range from 0 in Z1450394746 and Z1459964184 to 3 in BMS-561392 and Z2242870510, while HBA values range between 3 (Z1528728414) and 6 (BMS-561392). These values remain well within the desirable limits defined by Lipinski’s rule of five, underscoring the potential of these ligands to engage in hydrogen bonding interactions with biological targets without compromising passive permeability. Importantly, all compounds report zero violations of Lipinski’s rule, reinforcing their drug-likeness and suitability for oral administration.
The QED values, which provide a quantitative estimate of drug-likeness on a scale from 0 to 1, show significant variability among the ligands. BMS-561392 records the lowest QED at 0.3387, likely reflecting its higher molecular weight and structural complexity. In contrast, the novel compounds display markedly higher drug-likeness scores, with values ranging from 0.6770 in Z1459964184 to 0.7914 in Z1450394746. Compounds such as Z2242870510 (0.7806), Z1528724474 (0.7083), and Z1528728414 (0.7574) also demonstrate strong QED values (
Table 5), suggesting a more favorable balance of molecular features compared to the reference compound. Particularly, Z1450394746 exhibits the highest QED (0.7914), emphasizing its strong drug-like characteristics.
Taken together, this comprehensive profiling highlights that while the reference compound BMS-561392 falls within acceptable physicochemical thresholds, its relatively low QED score suggests potential limitations in its drug-likeness. In contrast, the tested ligands, especially Z1450394746, Z2242870510, and Z1528728414, combine favorable molecular weights, balanced hydrogen bonding features, and significantly higher QED scores, making them promising candidates for further in vitro and in vivo validation.
4. Conclusions
In conclusion, this study presents a comprehensive in silico framework for the identification and prioritization of potential TACE inhibitors by integrating DL, molecular docking, molecular dynamics simulations, binding free energy analyses, and physicochemical profiling. Among the screened ligands, Z1459964184, Z2242870510, and Z1450394746 consistently emerged as the most promising candidates, demonstrating strong binding affinities, stable RMSD and RMSF profiles, and favorable hydrogen bonding interactions throughout the simulation period. In particular, Z1459964184 combined high RMSD stability with a high hydrogen bonding capacity, while maintaining a good QED score as compared to the reference compound, indicative of excellent drug-likeness. Similarly, Z2242870510 and Z1450394746 displayed stable conformational dynamics and favorable drug-likeness indices, further reinforcing their suitability for progression. Compound Z1528728414 showed comparatively good RMSD but a low hydrogen bonding strength. Meanwhile, Z1528724474 manifested the least compatibility against TACE. However, these compounds manifest a good QED score, suggesting that while they may not be the top candidates, they still warrant consideration as potential scaffolds for optimization. Taken together, these findings emphasize that Z1459964184, Z2242870510, and Z1450394746 represent the most compelling leads for further biological validation. By integrating deep learning with extended 300 ns structural dynamics, this study not only identifies promising TACE inhibitors but also establishes a rigorous and efficient strategy for future therapeutic development.
