Case Report

Atazanavir/Ritonavir Increased Tizoxanide Exposure from Oral Nitazoxanide through Pharmacokinetic Interaction in Healthy Volunteers

1
Department of Pharmaceutical Chemistry, Obafemi Awolowo University, Ile-Ife 220008, Nigeria
2
Department of Pharmaceutical and Medicinal Chemistry, University of Ilorin, Ilorin 240003, Nigeria
3
Department of Chemistry, University of Liverpool, Liverpool L69 3BX, UK
4
Department of Pharmacology and Therapeutics, University of Liverpool, Sherrington Building, Ashton Street, Liverpool L69 3GE, UK
*
Author to whom correspondence should be addressed.
Future Pharmacol. 2024, 4(1), 163-172; https://doi.org/10.3390/futurepharmacol4010011
Submission received: 6 December 2023 / Revised: 24 January 2024 / Accepted: 18 February 2024 / Published: 22 February 2024

Abstract

:
Nitazoxanide use is limited by gastrointestinal side effects associated with increasing dose. In this drug repurposing study, we investigated the possibility of enhancing the exposure of its active metabolite, tizoxanide, through pharmacokinetic interaction with atazanavir/ritonavir. In this crossover drug–drug interaction study, 18 healthy participants received a single dose of 1000 mg of nitazoxanide alone and in combination with 300/100 mg atazanavir/ritonavir in period 1 and 2 respectively. On both days, blood samples for intensive pharmacokinetic analyses were collected at 0–12 h post-dose. To explore the utility of dried blood spots (DBS) as an alternative to plasma for tizoxanide quantification, 50 µL of blood from some participants was spotted on DBS cards and correlated with plasma concentrations. Pharmacokinetic parameters were derived by non-compartmental analysis and compared between both periods. Co-administration of nitazoxanide with atazanavir/ritonavir resulted in a significant increase in tizoxanide plasma exposure [GMR (90% CI) of AUC0–12h, Cmax and C12h being 1.872 (1.870–1.875), 2.029 (1.99–2.07) and 3.14 (2.268–4.352), respectively]. DBS concentration (%CV) was 46.3% (5.6%) lower than plasma concentrations, and there was strong correlation (R = 0.95, p < 0.001) between DBS-derived plasma concentration and plasma concentrations. Co-administration with atazanavir/ritonavir enhanced tizoxanide exposure with no report of adverse events in healthy volunteers.

1. Introduction

Repurposing existing drugs represents a viable option to identify new and effective treatments for emerging pandemics and diseases [1]. This concept is believed to reduce the cost of new drug development and minimize the time for therapeutic intervention for new pandemics [2]. Often, repurposing an existing drug for new indications may warrant the modification of the drug formulation, doses, and dosing regimen to achieve the intended efficacy and safety for the new application [3]. One of the emerging strategies to repurpose drugs towards new indications is obtaining drug–drug interaction information. Drug–drug interaction occurs when the presence of a drug influences the effect of another drug, thereby affecting the pharmacokinetics and pharmacodynamic effect of the victim drug, as well as its overall therapeutic effect [1]. Several factors often influence drug interactions, including binding to plasma protein and extravascular sites, food intake, and enzyme activity [4]. In the instance of a pharmacokinetic drug–drug interaction (an interaction that may result in the alteration of the absorption, distribution, metabolism, and excretion of the victim drug), the systemic exposure of the broad-spectrum victim drug may be increased, making it applicable as a repurposed drug for new indications. While drug–drug interaction information represents a potential resource for repurposing existing drugs towards new indications, this approach remains not fully exploited.
Nitazoxanide, 2-(acetyloxy)-N-(5-nitro-2-thiazolyl) benzamide is a thiazolide anti-infective agent initially developed for the treatment of veterinary helminthics [5,6]. It has been studied for its anti-infective and, more recently, antineoplastic properties as well as activity on bone resorption [7,8,9]. It possesses a broad-spectrum antimicrobial activity against a wide range of human pathogens, including human helminthics, anaerobic bacteria, and protozoans [10,11,12]. Nitazoxanide has been reported to have excellent activity against a few non-protozoan parasites such as the intestinal tapeworms Hymenolepis nana and Trichuris trichiura as well as against viruses, including enteric, human immunodeficiency virus, the Middle East respiratory syndrome, viral hepatitis, the rotaviruses, and ebola virus [13,14,15,16,17]. Nitazoxanide is rapidly metabolised to its active metabolite tizoxanide which is highly bound to plasma proteins, and the inactive tizoxanide-glucuronide [18]. Recently, it was reported to possess in vitro antiviral activity against SARS-CoV-2 and was investigated in several drug repurposing trials for COVID-19 management [19,20].
However, efficacy against a new pathogen often requires systemic exposure levels that are not achievable at the approved dose [21]. In addition to the time lost to getting a new dose approved in a disease outbreak, tolerability may be compromised with higher doses. This has been reported for nitazoxanide whose clinical use is limited by severe gastrointestinal adverse events. These adverse events have been reported to be associated with increasing doses of nitazoxanide higher than 1000 mg that are capable of disrupting patients’ activities [22,23,24]. As a result, the recommended and currently approved dose is 500 mg twice daily, but 1000 mg has been used in previous studies with higher tolerability [25].
Precedent exists for concomitant administration of a drug with another agent that inhibits or induces certain aspect(s) of its disposition pathway to improve systemic exposure, a strategy known as pharmacokinetic boosting. This has been applied to drugs used in the treatment of different diseases such as HIV and cancer [26,27,28,29,30]. Interaction between nitazoxanide and atazanavir/ritonavir has not been reported. However, since viral protease inhibitors inhibit uridine 5′-diphospho-glucuronosyltransferase (UDP-glucuronosyltransferase, UGT) enzymes [31], atazanavir/ritonavir is expected to inhibit the glucuronidation of tizoxanide, potentially increasing its exposure. We conducted a single-dose study in healthy volunteers to explore this concept.

2. Methods

2.1. Study Design and Participants

This was a single center, open-label, two-period crossover study, with a 3-week washout period in between. In period 1, participants received a single dose of 1000 mg of nitazoxanide alone (two 500 mg tablets) in the morning after a regular local meal. Following a 3-week washout period to ensure complete elimination of the drug administered in period 1, participants received a single dose of 1000 mg of nitazoxanide (two 500 mg tablets) along with a single dose of 300 mg and 100 mg atazanavir/ritonavir (co-formulated tablet) in period 2, that is, nitazoxanide plus atazanavir/ritonavir in the morning. The study protocol was reviewed by the Institute of Public Health, Obafemi Awolowo University Ile-Ife, Nigeria and approved on 16 December 2020 (IPH/OAU/12/1574). The study is registered on ClinicalTrials.gov (NCT05680792), assessed on 12 January 2021. Participants were recruited from the community of Obafemi Awolowo University Ile-Ife, and included healthy individuals who were at least 18 years old, able to understand the study information, non-smokers, and non-alcoholics. Individuals who were pregnant, breastfeeding, have taken any medication or coffee within 2 weeks of their participation, or allergic to nitazoxanide, atazanavir, or ritonavir were excluded. Only participants who agreed to participate after understanding the study procedure and who signed the informed consent form were enrolled.

2.2. Sample Collection

Intensive pharmacokinetic sampling was conducted after an observed single dose in each of the two periods. This involved the collection of 2 mL venous blood into EDTA tubes at 0, 0.25, 0.5, 1, 2, 4, 6, and 12 h after dose. Plasma was separated from the blood cells by immediate centrifugation at 3000× g rpm for 5 min at 4 °C. Plasma samples were transferred into cryovials and stored at −70 °C until analysis. To evaluate the potential utility of the dried blood spot (DBS) method and for its cross-validation against the plasma method, intensive pharmacokinetic DBS samples were prepared from blood samples from six individuals in period 1 and six individuals in period 2. Briefly, before plasma separation from venous blood from each time point as described above, 50 µL blood volume per spot was spotted within the marked circles of Whatman 903® Protein Saver card (GE Healthcare Life Sciences, New York, NY, USA). The cards were allowed to dry at room temperature for 2 h before they were packed into zip-lock bags containing desiccants and stored at −70 °C until analysis. Both plasma and DBS samples were analyzed within one week of collection.

2.3. Bioanalysis of Study Samples

Quantification of tizoxanide in plasma and DBS was carried out using an earlier reported LC-MS/MS method [32], modified and partially validated as follows. The liquid chromatography (LC) system consisted of Accela Open Autosampler and an Accela LC-Pump (Thermo Fischer Scientific, Hemel Hempstead, UK). Chromatographic separation was carried out on a reverse phase Fortis™ C18 column (3 µm particle size, 100 mm × 2.1 mm; Fortis Technologies Ltd., Neston, Cheshire, UK) with a 2 μm C18 Quest guard-column (Thermo Electron Corporation, Hemel Hempstead, Hertfordshire, UK). Gradient elution consisted of 10 mM ammonium formate in water (mobile phase A) and 10 mM ammonium formate in acetonitrile (mobile phase B) at a flow rate of 400 µL/min. The gradient program started with 5% of mobile phase B, maintained for 1 min, and increased to 80% at 1.5 min. It was further increased to 95% at 4 min and returned to 5% at 6 min. The total run time was 6 min. Detection and quantification was on the TSQ Vantage (Thermo Electron Corporation, Hemel Hempstead, Hertfordshire, UK) with a heated electrospray ionization source operated in the negative ionization mode and selective reaction monitoring. Xcalibur™ was used for compound tuning and optimization while the Lcquan™ (version 2.7.0, Thermo Fisher Scientific, Hemel Hempstead, UK) was used for sequence acquisition and data processing.
Tizoxanide plasma and DBS calibration standards and quality control (QC) samples were prepared to validate the method. The calibration standards for tizoxanide plasma and DBS assay consisted of zero blank and nine calibrator levels ranging from 50 to 20,000 ng/mL, prepared by serial dilution of plasma working stock of tizoxanide with drug-free plasma from a healthy volunteer. The QC samples included a lower limit of quantitation (LLOQ; 50 ng/mL), low-QC (LQC; 120 ng/mL), medium-QC (MQC; 8600 ng/mL), and high-QC (HQC; 18,000 ng/mL), similarly prepared from a different working stock. All working stock solutions and plasma working stock were prepared from a 1 mg/mL stock solution prepared from tizoxanide reference compound (Toronto Research Chemicals Inc., Toronto, ON, Canada). Efavirenz (Selleck Chemicals LLC, Houston, TX, USA) was used as the internal standard.
Extraction of tizoxanide from the plasma validation samples and participants’ samples was carried out by protein precipitation method using acetonitrile. Briefly, 100 µL of plasma was transferred into clean 7 mL extraction tubes, followed by the addition of 20 µL of internal standard (efavirenz; 750 ng/mL) and 20 µL of formic acid. One thousand µL of acetonitrile was then added and vortexed for 10 s to precipitate proteins. The extract was left to stand for 10 min and vortexed again for 10 s before centrifugation at 3500× g rpm for 10 min at 4 °C. An amount of 400 µL of the supernatant was transferred into 400 µL glass autosampler vials, and the injection volume was 25 µL. For DBS, three 6 mm punches were taken from a spot per sample and transferred into 7 mL extraction tubes with screw caps. Five hundred µL of acetonitrile and 20 µL of internal standard (efavirenz; 750 ng/mL) were added and vortexed for 10 s. The tubes were left to stand for 30 min, and vortexed for 10 s every 10 min. The extracts were centrifuged at 4000× g rpm for 15 min at 4 °C and 400 µL of the supernatants were transferred into another clean 7 mL extraction tube. Twenty µL of formic acid was added to the supernatant, and the samples were vortexed again. Four hundred µL of the final extract was transferred into 400 µL glass autosampler vials, and 25 µL was injected. At least 8 validation assay batches for precision and accuracy were run for each sample type, and additional assay batches for selectivity, recovery, matrix effect, and extraction efficiency. Plasma and DBS samples obtained from the study participants were analyzed in the same way as described above. All validation and study plasma and DBS samples were stored at ultralow temperature (−70 °C) and were assayed in less than a week after sample preparation or collection from the participants.

2.4. Data Analysis

Bioanalytical method validation data were processed using Excel®, version 2016 (Microsoft Inc., Washington, DC, USA,) and assessed using FDA guidance [33]. For instance, accuracy and precision were only accepted if the %CV were less than ±15% for all QCs except for LLOQ, which was ±20%. Additionally, for the calibration curve, the non-zero calibrators should be ±15% of nominal (theoretical) concentrations, except at LLOQ where the calibrator should be ±20% of the nominal concentrations in each validation run. Tizoxanide pharmacokinetic parameters (AUC0–12h, Cmax, C12 and tmax) from the concentration-time data for both periods were obtained by non-compartmental analysis using GraphPad Prism®, version 9.1.2 (GraphPad Software, La Jolla, CA, USA). In line with the FDA guidance, geometric mean ratios and their 90% CIs were calculated for AUC0–12, Cmax, and C12 to assess the clinical significance of any observed interaction [34]. For the cross-validation of the plasma and DBS methods, linear regression was first used to describe the relationship between measured plasma and DBS concentrations. The DBS-derived plasma concentrations were calculated from the equation DBS-derived plasma = [DBSconc/(1 − hct)] × 0.999 [35], where DBSconc is the concentration measured in DBS, hct is average hematocrit value [36], and 0.999 [18,37] is the plasma bound fraction of tizoxanide. Afterwards, DBS-derived plasma concentrations were compared with the paired plasma concentration using linear regression analysis.

3. Results

3.1. Participant’s Disposition and Demographics

A total of 25 participants consented to participate in the study but 4 withdrew from the study due to illnesses, non-related to the study, such as malaria, while 3 were withdrawn due to non-compliance with the study protocol. Eventually, 18 participants (males, n = 10 and females, n = 8) completed the study. The mean (±SD) age and mean weight (±SD) were 27.4 (6.9) years and 60.4 (12.8) kg, respectively. In both periods of the study, no participant reported any serious symptom or adverse effect.

3.2. Method Validation

3.2.1. Linearity, Accuracy, and Precision of Plasma and DBS Assay

Linearity of the assay method for both plasma and DBS was established in more than eight assays over the range of 50–20,000 ng/mL, with all the calibration standards having a percentage bias falling below ±15%. A typical regression coefficient (r2) was 0.9971. For plasma assay, accuracy and precision were 84.4–112.2% and 1.0–0.6%, while for DBS, they were 91.8–108.4% and 0.49–13.1% (Table 1 and Table 2). All values were within the acceptance criteria from the FDA guideline.

3.2.2. Recovery, Matrix Effect, and Extraction Proficiency

The mean (%CV) recoveries of tizoxanide from plasma at LLOQ, LQC, MQC, and HQC were 88.8% (4.6), 87.1% (3.8), 110.1% (7.6), and 100.9 (2.3), respectively, and the overall mean (%CV) recovery was 96.7% (11.2). The plasma matrix effect was between 103.1% and 112.7% with a %CV less than ±15. Also, mean extraction proficiency was 104.4 with %CV less than 15% for all QC levels.

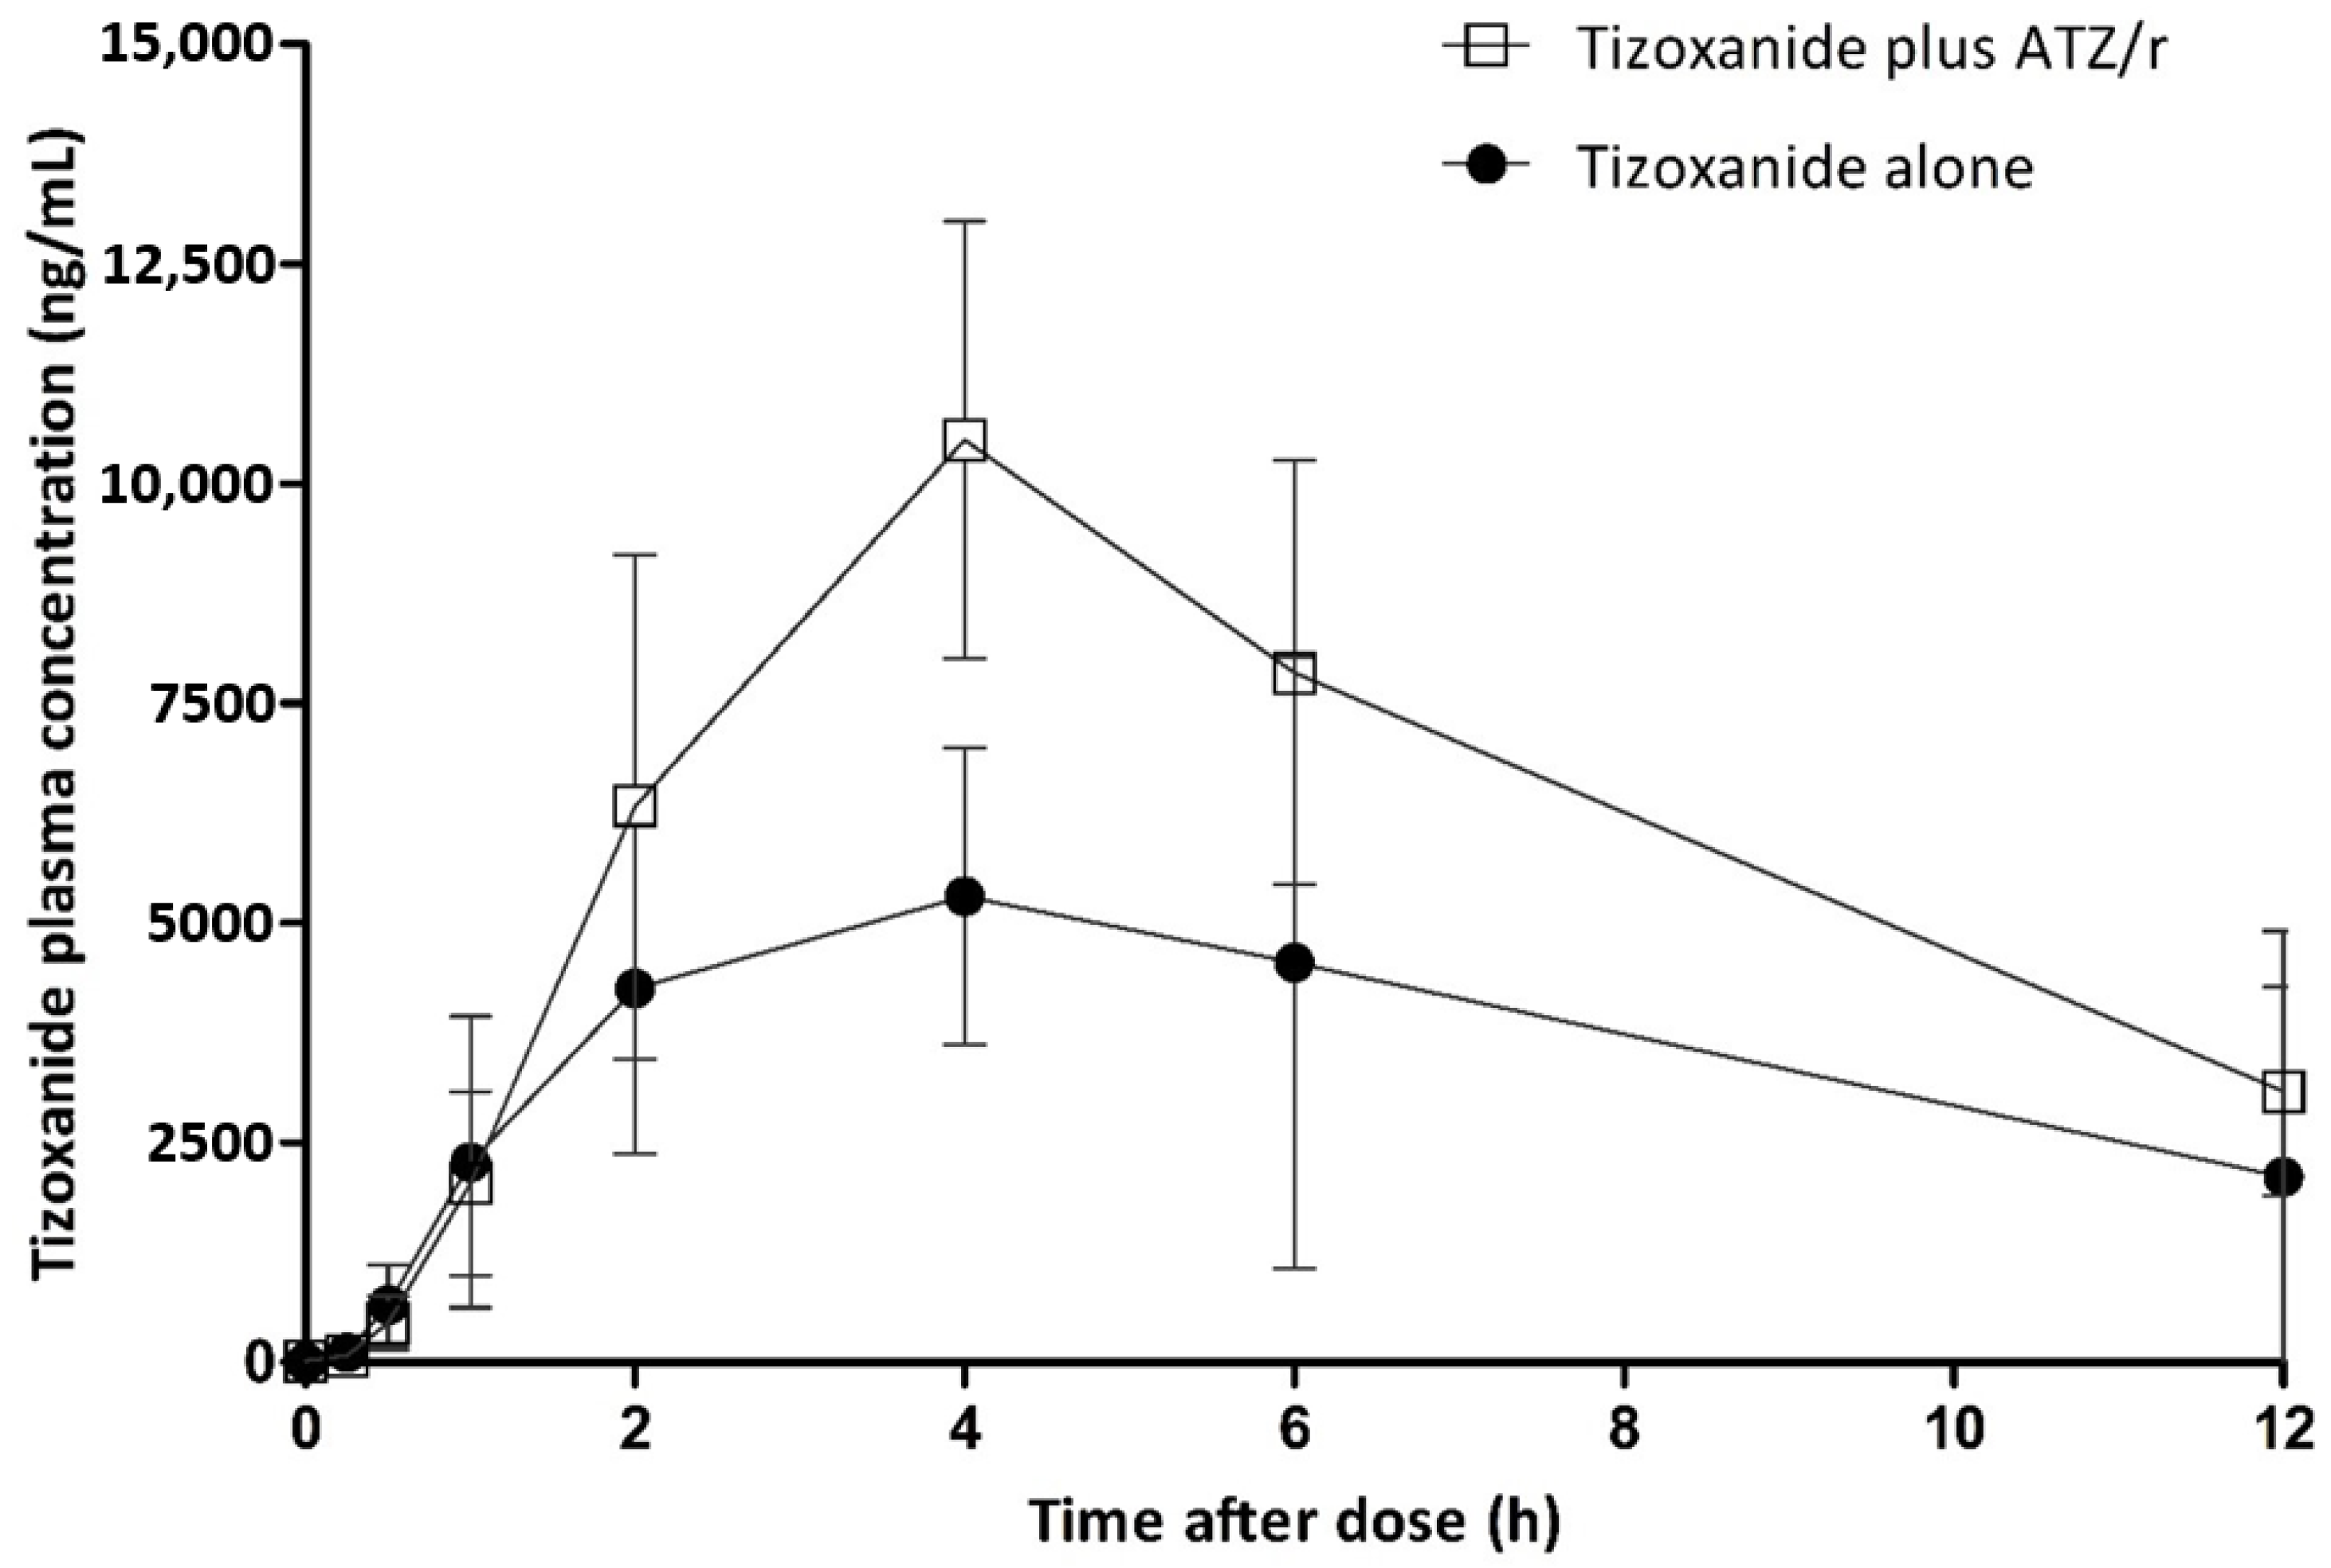
3.2.3. Pharmacokinetics of Tizoxanide and the Effects of Co-Administration of Atazanavir/Ritonavir

In period 1 (nitazoxanide alone) and period 2 (nitazoxanide plus atazanavir/ritonavir), tizoxanide was undetectable in the plasma until after 30 min following drug administration, and the median (range) tmax was consistently at 4 (2–6) hrs (Figure 1). Geometric mean tizoxanide AUC0–12h was 124,967.7 ng.h/mL in period 1 compared with 233,984.1 ng.h/mL in period 2, representing GMR of 1.872 (Table 3). The Cmax was 4375.7 ng/mL for period 1 compared with 8882.1 ng/mL for period 2 (GMR: 2.029), while C12 was 553.8 ng/mL period 1 compared with 1740.7 ng/mL for period 2 (GMR: 3.143). The values obtained for the parameters were outside the 0.80–1.25 range indicating clinical significance. Similarly, PK parameters obtained from DBS-derived plasma concentrations showed increased exposure from period 1 to period 2, but the folds increase was more than what was observed in plasma (Figure S1 and Table 4).

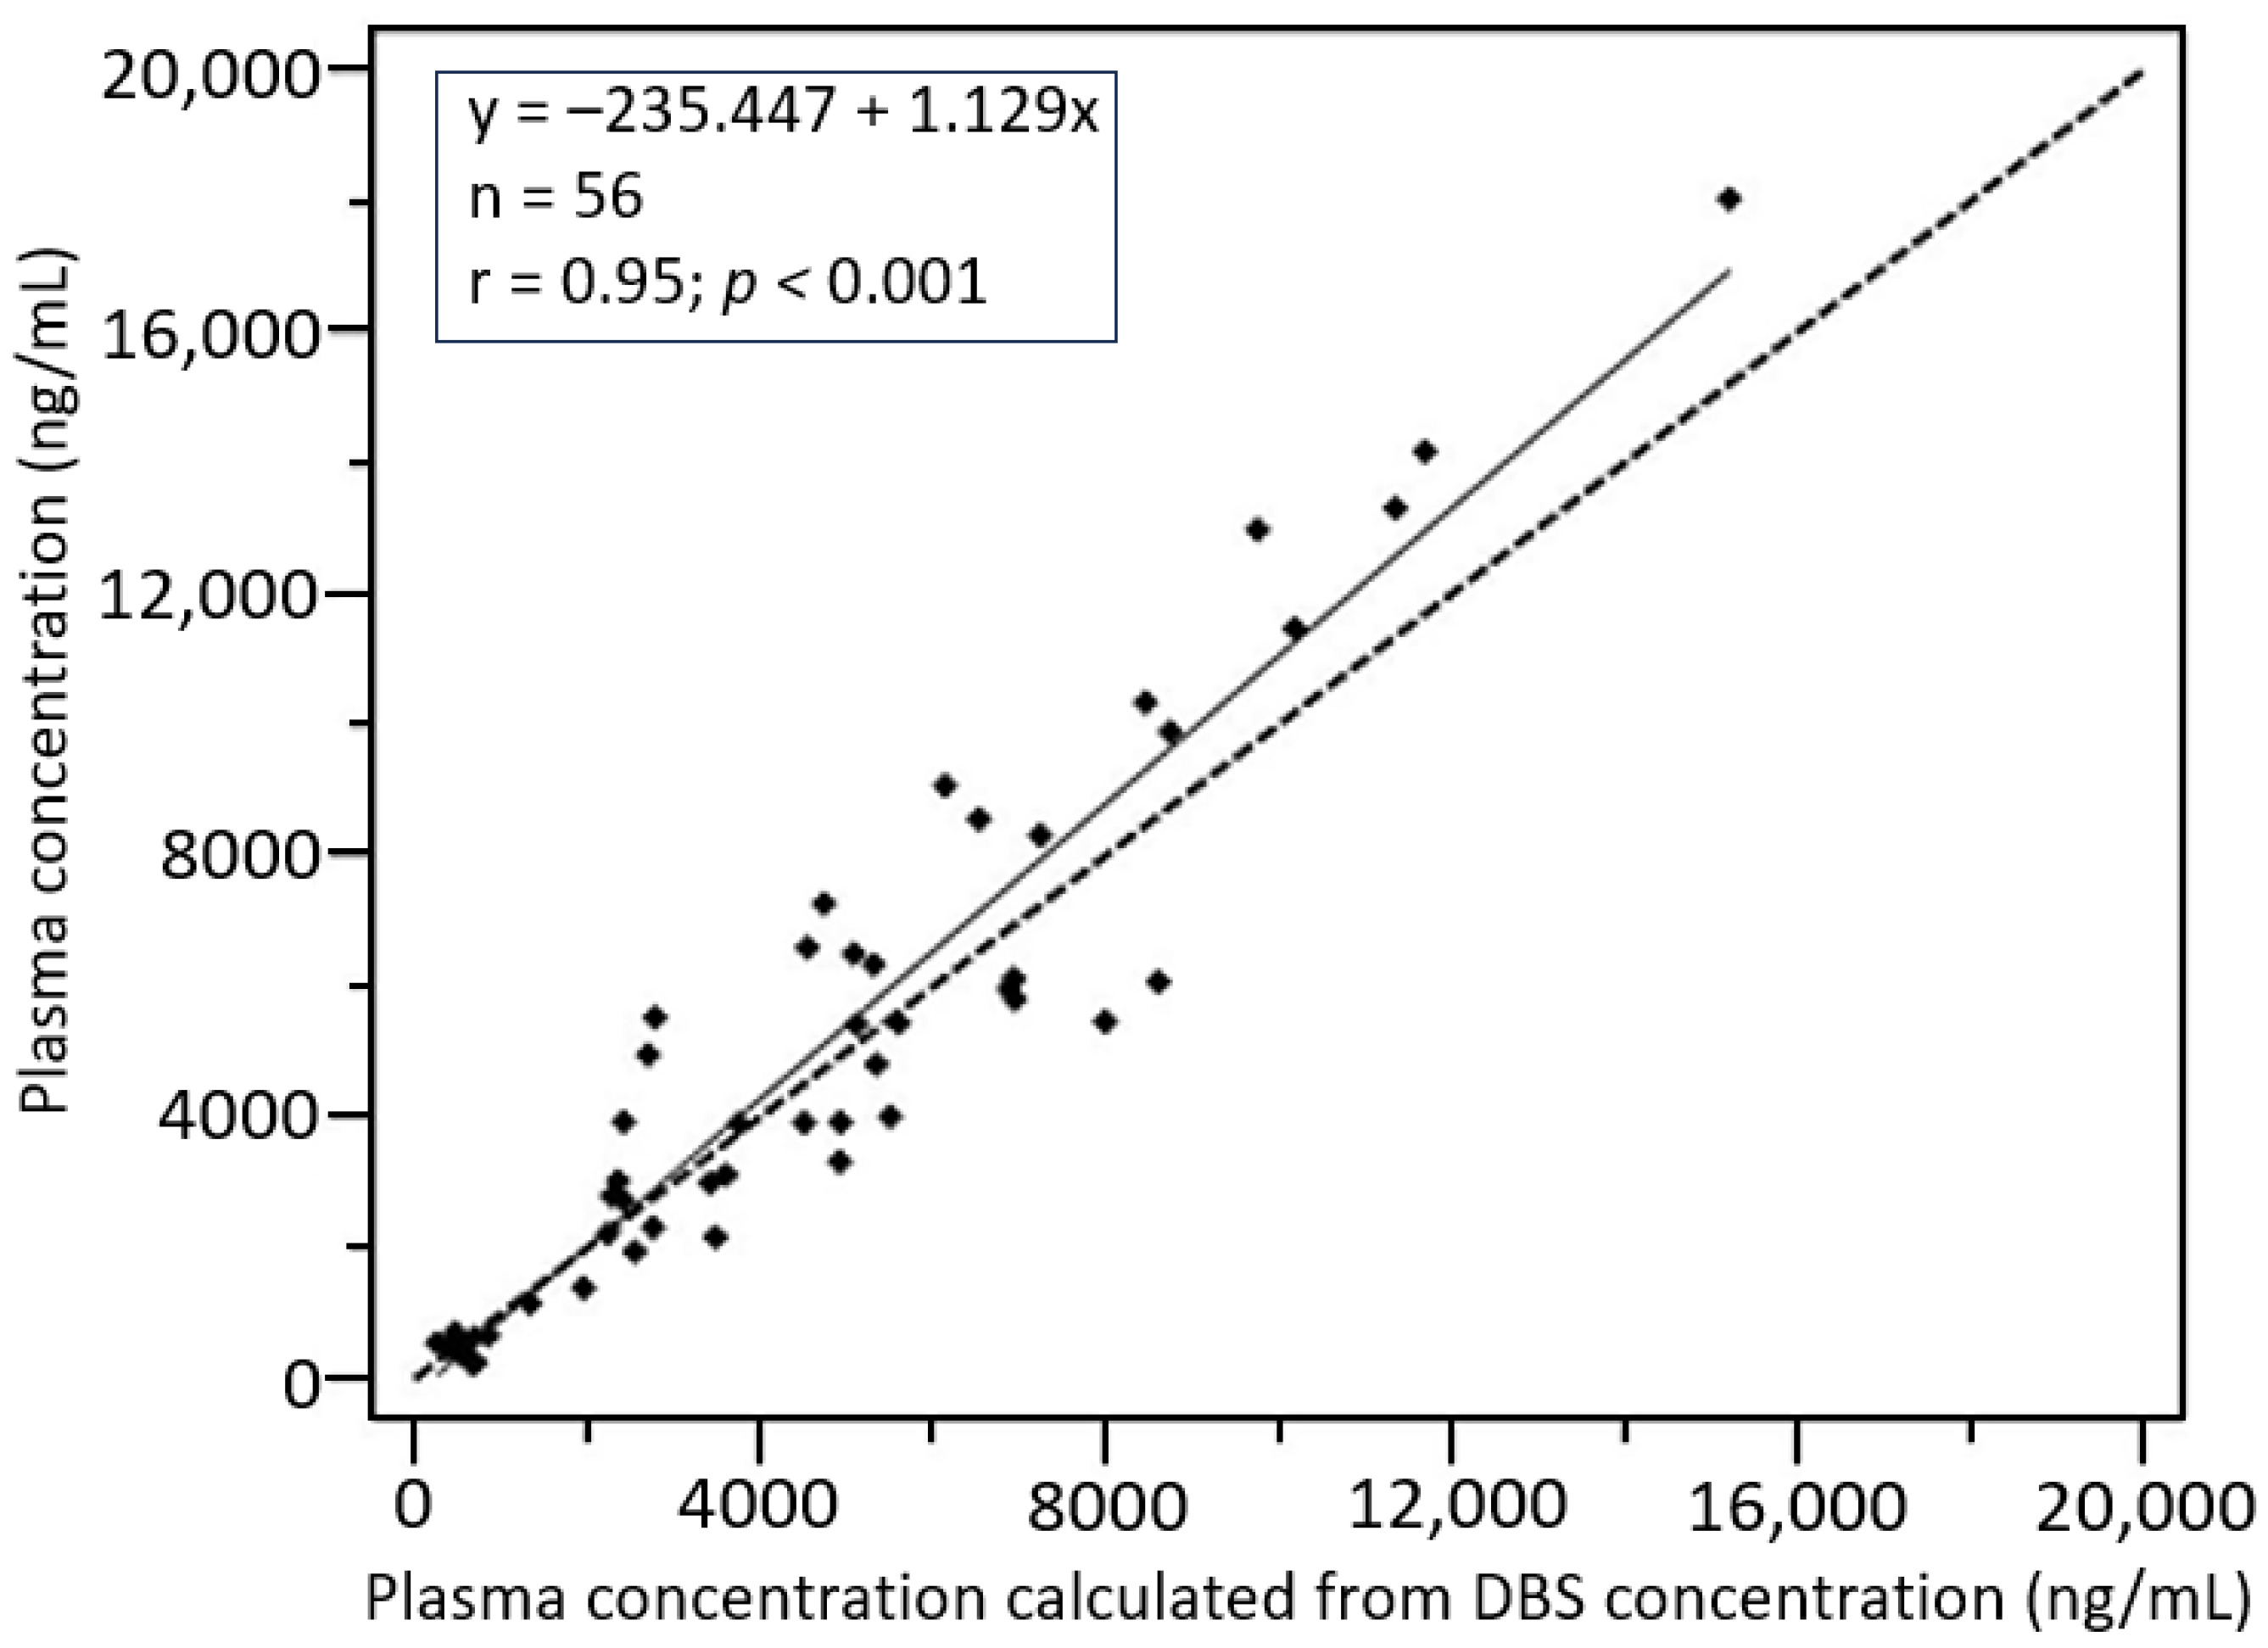
3.2.4. Plasma-DBS Cross-Validation

Average (SD) DBS concentration was 68.6% lower than the corresponding plasma concentrations in the intensive PK samples. A significant correlation was observed between tizoxanide concentration in plasma and DBS samples. (coefficient, R = 0.87, p < 0.001). The equation y = 2.1343x + 53,489 described the relationship between tizoxanide concentration in the two matrices, where y is the plasma concentrations and x is the DBS concentrations. Similarly, DBS-derived plasma concentrations obtained from DBS concentrations had a very strong correlation with measured plasma concentration with a correlation coefficient R = 0.95, p < 0.001 (Figure 2).

4. Discussions

The pharmacokinetic interaction between oral nitazoxanide (1000 mg) and atazanavir/ritonavir (300/100 mg) was successfully investigated in this single dose, cross-over study in healthy volunteers. Co-administration with atazanavir/ritonavir boosted the plasma pharmacokinetics of tizoxanide, the active metabolite of nitazoxanide, by 69.05%. This strategy could potentially create opportunities to explore nitazoxanide for indications requiring exposure levels not achievable with the standard dose, with further benefit of synergistic antiviral activity of atazanavir/ritonavir in the case of viral infections.
Doses higher than 500 mg of nitazoxanide were predicted to achieve tizoxanide plasma and lung tissue levels to ensure EC90 of 1.43 mg/L required for SARS-CoV-2 viral suppression [21]. Since efficacy, ease of administration, and more importantly, safety concerns usually inform the choice of drugs and dosing in repurposed drugs [3,38], we decided to investigate the appropriateness of a 1000 mg dose since its safety has been previously established and not associated with most gastrointestinal side effects associated with higher doses [39,40]. Although this dose was reported to only achieve plasma concentration higher than the EC90 and not in the lungs, the strategy investigated here resulted in the in situ elevation of tizoxanide metabolite, preventing its conversion to tizoxanide-glucuronide by UGT enzymes, in the presence of atazanavir, a known UGT enzyme inhibitor [31]. Investigating the exact mechanism of the UGT enzyme inhibition effect of atazanavir was beyond the scope of this study. However, pharmacokinetic boosting by intentional modulation of drug disposition is not new, and it is extensively used in HIV treatment (e.g., lopinavir/ritonavir, atazanavir/cobisistat, elvitegravir/cobisistat). A recent review is also available on pharmacokinetic boosting strategies for kinase inhibitors [28]. Additionally, atazanavir/ritonavir is an antiviral drug with activity against several viral pathogens; it is reportedly active in vitro against SARS-CoV-2 [23,41,42]. Hence, its combination with nitazoxanide could be investigated for efficacy against SARS-CoV-2 infection and other viruses in the future. Furthermore, this combination was not associated with any serious adverse events in this cohort. In clinical practice, nitazoxanide is administered at a usual adult dose of 500 mg twice daily and atazanavir/ritonavir at 300/100 mg once daily. Despite the differences in the dosing frequencies of these drugs, we employed a single-dose design in this study because the half-life of nitazoxanide and those of the concomitantly administered drugs is shorter than the dosing interval, and the risk of mark accumulation of nitazoxanide is minimal.
Our exploration of the DBS method as an alternative for the plasma method was prompted by sample collection limitations associated with risk mitigation strategies in pandemic settings. Samples collected on DBS cards are considered non-infectious and are exempted from UN3373 transport of dangerous goods regulation [43]. Hence, it could facilitate pharmacokinetic sampling as part of drug repurposing trials under stringent risk mitigation strategies. The strong correlation observed between tizoxanide concentration in plasma and DBS, along with good linearity in linear regression analysis, allowed reasonable confidence in predicting plasma concentrations from DBS concentrations using the linear equation generated. Furthermore, the strong correlation between plasma concentration and DBS-derived plasma concentration indicated the strong potential of replacing the plasma sampling method of the drug with the DBS sampling approach. Advantages include ease of sample collection, no need for centrifugation, storage at room temperature for stable analytes, and no need for specialized shipment beyond three-component packaging. However, it should be noted that plasma and DBS-derived tizoxanide data were quite similar with nitazoxanide dosing alone, but significantly different with co-administration of nitazoxanide and atazanavir/ritonavir (Figure S1). We did not investigate whether this is due to the effect on ionization, recovery from DBS, or some other factors. Hence, this correlation can only be confidently applied to tizoxanide alone without co-administered atazanvir/ritonavir. Furthermore, more studies are required to establish room temperature stability, and the impact of other variables not evaluated in the present study on tizoxanide DBS concentration (e.g., hematocrit, plasma protein binding), in the same way these have been evaluated for some drugs, such as efavirenz and dolutegravir, in the past [44,45].
Another limitation of this study is bias associated with the non-randomization of drug administration in the control and intervention period. However, this was minimized by using study volunteers as their own control. Additionally, the UGT enzyme activity determining the drugs’ levels is independent on the order of drug contacts, especially with sufficient washout period between the two periods. Concurrent administration of atazanavir/ritonavir (an inhibitor of the UGT enzyme) with nitazoxanide (a UGT enzyme substrate) did not result in any serious effect in this study. However, this cannot be extrapolated to other UGT metabolized drugs not included in this study. Furthermore, evaluation of the potential clinical application of this strategy should include exclusion of HIV-positive individuals not on suppressive therapy to prevent chances of drug resistance due to concomitant atazanavir/ritonavir.

Supplementary Materials

The following supporting information can be downloaded at: https://www.mdpi.com/article/10.3390/futurepharmacol4010011/s1, Figure S1: DBS-derived plasma concentration-time curve of tizoxanide alone and with atazanavir/ritonavir (ATZ/r); data are presented here as mean (95% CI).

Author Contributions

A.A., T.O. and O.E. conducted the experiment, performed data analysis, and prepared the original draft of the manuscript. B.A., O.B. and A.O. (Adeniyi Olagunju) participated in the protocol design, data analysis, and manuscript review; S.R., A.O. (Andrew Owen) and A.O. (Adeniyi Olagunju) were involved in supervision, research conceptualization, and manuscript review. All authors have read and agreed to the published version of the manuscript

Funding

This work was supported by Obafemi Awolowo University, Nigeria and the University of Liverpool, UK. No external support was received.

Institutional Review Board Statement

The study protocol was reviewed by the Institute of Public Health, Obafemi Awolowo University Ile-Ife, Nigeria and approved on 16 December 2020 (IPH/OAU/12/1574).

Informed Consent Statement

Informed consent was obtained from all subjects involved in the study.

Data Availability Statement

The data supporting the findings of this study are available upon a request to the corresponding author. No part of the data is made publicly available.

Conflicts of Interest

The authors declare no conflicts of interest.

References

  1. Zhou, B.; Wang, R.; Wu, P.; Kong, D. Drug Repurposing Based on Drug–Drug Interaction. Chem. Biol. Drug Des. 2014, 85, 137–144. [Google Scholar] [CrossRef]
  2. Sahu, N.U.; Kharkar, P.S. Computational Drug Repositioning: A Lateral Approach to Traditional Drug Discovery? Curr. Top. Med. Chem. 2016, 16, 2069–2077. [Google Scholar] [CrossRef]
  3. Low, Z.Y.; Farouk, I.A.; Lal, S.K. Drug Repositioning: New Approaches and Future Prospects for Life-Debilitating Diseases and the COVID-19 Pandemic Outbreak. Viruses 2020, 12, 1058. [Google Scholar] [CrossRef] [PubMed]
  4. Ai, N.; Fan, X.; Ekins, S. In silico methods for predicting drug–drug interactions with cytochrome P-450s, transporters and beyond. Adv. Drug Deliv. Rev. 2015, 86, 46–60. [Google Scholar] [CrossRef] [PubMed]
  5. El-Fadeal, N.M.A.; Nafie, M.S.; El-Kherbetawy, M.K.; El-Mistekawy, A.; Mohammad, H.M.F.; Elbahaie, A.M.; Hashish, A.A.; Alomar, S.Y.; Aloyouni, S.Y.; El-Dosoky, M.; et al. Antitumor Activity of Nitazoxanide against Colon Cancers: Molecular Docking and Experimental Studies Based on Wnt/β-Catenin Signaling Inhibition. Int. J. Mol. Sci. 2021, 22, 5213. [Google Scholar] [CrossRef]
  6. Bolia, R. Nitazoxanide: Jack of All, Master of None? Indian J. Pediatr. 2019, 87, 4–5. [Google Scholar] [CrossRef] [PubMed]
  7. Di Santo, N.; Ehrisman, J. A functional perspective of nitazoxanide as a potential anticancer drug. Mutat. Res. Mol. Mech. Mutagen. 2014, 768, 16–21. [Google Scholar] [CrossRef]
  8. Lü, Z.; Li, X.; Li, K.; Wang, C.; Du, T.; Huang, W.; Ji, M.; Li, C.; Xu, F.; Xu, P.; et al. Structure–Activity Study of Nitazoxanide Derivatives as Novel STAT3 Pathway Inhibitors. ACS Med. Chem. Lett. 2021, 12, 696–703. [Google Scholar] [CrossRef] [PubMed]
  9. Grayson, M.L.; Cosgrove, S.E.; Crowe, S.; Hope, W.; McCarthy, J.S.; Mills, J.; Mouton, J.W.; Paterson, D.L. Kucers’ the Use of Antibiotics: A Clinical Review of Antibacterial, Antifungal, Antiparasitic, and Antiviral Drugs, 7th ed.; Taylor and Francis: Abingdon, UK, 2017. [Google Scholar] [CrossRef]
  10. Dubreuil, L.; Houcke, I.; Mouton, Y.; Rossignol, J.F. In vitro evaluation of activities of nitazoxanide and tizoxanide against anaerobes and aerobic organisms. Antimicrob. Agents Chemother. 1996, 40, 2266–2270. [Google Scholar] [CrossRef] [PubMed]
  11. Anderson, V.R.; Curran, M.P. Nitazoxanide. Drugs 2007, 67, 1947–1967. [Google Scholar] [CrossRef]
  12. Aslam, S.; Musher, D.M. Nitazoxanide: Clinical studies of a broad-spectrum anti-infective agent. Futur. Microbiol. 2007, 2, 583–590. [Google Scholar] [CrossRef]
  13. Chero, J.C.; Saito, M.; Bustos, J.A.; Blanco, E.M.; Gonzalvez, G.; Garcia, H.H. Hymenolepis nana infection: Symptoms and response to nitazoxanide in field conditions. Trans. R. Soc. Trop. Med. Hyg. 2007, 101, 203–205. [Google Scholar] [CrossRef] [PubMed]
  14. Speich, B.; Ame, S.M.; Ali, S.M.; Alles, R.; Hattendorf, J.; Utzinger, J.; Albonico, M.; Keiser, J. Efficacy and Safety of Nitazoxanide, Albendazole, and Nitazoxanide-Albendazole against Trichuris trichiura Infection: A Randomized Controlled Trial. PLoS Negl. Trop. Dis. 2012, 6, e1685. [Google Scholar] [CrossRef]
  15. Lokhande, A.S.; Devarajan, P.V. A review on possible mechanistic insights of Nitazoxanide for repurposing in COVID-19. Eur. J. Pharmacol. 2021, 891, 173748. [Google Scholar] [CrossRef] [PubMed]
  16. Jasenosky, L.D.; Cadena, C.; Mire, C.E.; Borisevich, V.; Haridas, V.; Ranjbar, S.; Nambu, A.; Bavari, S.; Soloveva, V.; Sadukhan, S.; et al. The FDA-Approved Oral Drug Nitazoxanide Amplifies Host Antiviral Responses and Inhibits Ebola Virus. iScience 2019, 19, 1279–1290. [Google Scholar] [CrossRef] [PubMed]
  17. Hargest, V.; Sharp, B.; Livingston, B.; Cortez, V.; Schultz-Cherry, S. Astrovirus Replication Is Inhibited by Nitazoxanide In Vitro and In Vivo. J. Virol. 2020, 94, 10–1128. [Google Scholar] [CrossRef] [PubMed]
  18. Zhao, Z.; Xue, F.; Zhang, L.; Zhang, K.; Fei, C.; Zheng, W.; Wang, X.; Wang, M.; Meng, X. The pharmacokinetics of nitazoxanide active metabolite (tizoxanide) in goats and its protein binding ability in vitro. J. Veter-Pharmacol. Ther. 2010, 33, 147–153. [Google Scholar] [CrossRef]
  19. Stachulski, A.V.; Santoro, M.G.; Piacentini, S.; Belardo, G.; La Frazia, S.; Pidathala, C.; Row, E.C.; Berry, N.G.; Iqbal, M.; Allman, S.A.; et al. Second-generation nitazoxanide derivatives: Thiazolides are effective inhibitors of the influenza A virus. Futur. Med. Chem. 2018, 10, 851–862. [Google Scholar] [CrossRef]
  20. Wang, M.; Cao, R.; Zhang, L.; Yang, X.; Liu, J.; Xu, M.; Shi, Z.; Hu, Z.; Zhong, W.; Xiao, G. Remdesivir and chloroquine effectively inhibit the recently emerged novel coronavirus (2019-nCoV) in vitro. Cell Res. 2020, 30, 269–271. [Google Scholar] [CrossRef]
  21. Rajoli, R.K.R.; Pertinez, H.; Arshad, U.; Box, H.; Tatham, L.; Curley, P.; Neary, M.; Sharp, J.; Liptrott, N.J.; Valentijn, A.; et al. Dose prediction for repurposing nitazoxanide in SARS-CoV-2 treatment or chemoprophylaxis. Br. J. Clin. Pharmacol. 2021, 87, 2078–2088. [Google Scholar] [CrossRef]
  22. Stockis, A.; Allemon, A.-M.; De Bruyn, S.; Gengler, C. Nitazoxanide pharmacokinetics and tolerability in man using single ascending oral doses. Int. J. Clin. Pharmacol. Ther. 2002, 40, 213–220. [Google Scholar] [CrossRef]
  23. Stockis, A.; De Bruyn, S.; Gengler, C.; Rosillon, D. Nitazoxanide pharmacokinetics and tolerability in man during 7 days dosing with 0.5 g and 1 g b.i.d. Int. J. Clin. Pharmacol. Ther. 2002, 40, 221–227. [Google Scholar] [CrossRef] [PubMed]
  24. Walker, L.E.; FitzGerald, R.; Saunders, G.; Lyon, R.; Fisher, M.; Martin, K.; Eberhart, I.; Woods, C.; Ewings, S.; Hale, C.; et al. An Open Label, Adaptive, Phase 1 Trial of High-Dose Oral Nitazoxanide in Healthy Volunteers: An Antiviral Candidate for SARS-CoV-2. Clin. Pharmacol. Ther. 2022, 111, 585–594. [Google Scholar] [CrossRef]
  25. Walsh, K.F.; McAulay, K.; Lee, M.H.; Vilbrun, S.C.; Mathurin, L.; Francois, D.J.; Zimmerman, M.; Kaya, F.; Zhang, N.; Saito, K.; et al. Early Bactericidal Activity Trial of Nitazoxanide for Pulmonary Tuberculosis. Antimicrob. Agents Chemother. 2020, 64, 10–1128. [Google Scholar] [CrossRef] [PubMed]
  26. Salama, E.; Eke, A.C.; Best, B.M.; Mirochnick, M.; Momper, J.D. Pharmacokinetic Enhancement of HIV Antiretroviral Therapy During Pregnancy. J. Clin. Pharmacol. 2020, 60, 1537–1550. [Google Scholar] [CrossRef]
  27. Larson, K.B.; Wang, K.; Delille, C.; Otofokun, I.; Acosta, E.P. Pharmacokinetic Enhancers in HIV Therapeutics. Clin. Pharmacokinet. 2014, 53, 865–872. [Google Scholar] [CrossRef] [PubMed]
  28. Westra, N.; Touw, D.; Hooge, M.L.-D.; Kosterink, J.; Munnink, T.O. Pharmacokinetic Boosting of Kinase Inhibitors. Pharmaceutics 2023, 15, 1149. [Google Scholar] [CrossRef] [PubMed]
  29. van Veelen, A.; Gulikers, J.; Hendriks, L.E.; Dursun, S.; Ippel, J.; Smit, E.F.; Dingemans, A.-M.C.; van Geel, R.; Croes, S. Pharmacokinetic boosting of osimertinib with cobicistat in patients with non-small cell lung cancer: The OSIBOOST trial. Lung Cancer 2022, 171, 97–102. [Google Scholar] [CrossRef]
  30. Boosman, R.J.; de Gooijer, C.J.; Groenland, S.L.; Burgers, J.A.; Baas, P.; van der Noort, V.; Beijnen, J.H.; Huitema, A.D.; Steeghs, N. Ritonavir-Boosted Exposure of Kinase Inhibitors: An Open Label, Cross-over Pharmacokinetic Proof-of-Concept Trial with Erlotinib. Pharm. Res. 2022, 39, 669–676. [Google Scholar] [CrossRef]
  31. Zhang, D.; Chando, T.J.; Everett, D.W.; Patten, C.J.; Dehal, S.S.; Humphreys, W.G. In Vitro inhibition of UDP glucuronosyltransferases by atazanavir and other HIV protease inhibitors and the relationship of this property to In Vivo bilirubin glucuronidation. Drug Metab. Dispos. 2005, 33, 1729–1739. [Google Scholar] [CrossRef]
  32. Neary, M.; Arshad, U.; Tatham, L.; Pertinez, H.; Box, H.; Rajoli, R.K.; Valentijn, A.; Sharp, J.; Rannard, S.P.; Biagini, G.A.; et al. Quantitation of tizoxanide in multiple matrices to support cell culture, animal and human research. J. Chromatogr. B 2023, 1228, 123823. [Google Scholar] [CrossRef]
  33. FDA. Bioanalytical Method Validation; Guidance for Industry; Availability; Federal Information & News Dispatch, LLC.: Washington, DC, USA, 2018; Volume 83. [Google Scholar]
  34. FDA. Clinical Drug Interaction Studies: Cytochrome P450 Enzyme- and Transporter-Mediated Drug Interactions; Guidance for Industry; Centre for Drug Evaluation and Research, FDA: Silver Spring, MY, USA, 2020. Available online: https://www.fda.gov/regulatory-information/search-fda-guidance-documents/clinical-drug-interaction-studies-cytochrome-p450-enzyme-and-transporter-mediated-drug-interactions (accessed on 10 December 2023).
  35. Li, W.; Tse, F.L.S. Dried blood spot sampling in combination with LC-MS/MS for quantitative analysis of small molecules. Biomed. Chromatogr. 2010, 24, 49–65. [Google Scholar] [CrossRef]
  36. Mondal, H.; Lotfollahzadeh, S. Hematocrit. In StatPearls; StatPearls Publishing LLC.: Treasure Island, FL, USA, 2023. [Google Scholar]
  37. Vets, E.; Rossignol, J.-F.; Jackson, A.S. Effects of nitazoxanide on pharmacokinetics and pharmacodynamics of a single dose of warfarin. Am. J. Health Pharm. 2009, 66, 838–842. [Google Scholar] [CrossRef]
  38. Stachulski, A.V.; Taujanskas, J.; Pate, S.L.; Rajoli, R.K.R.; Aljayyoussi, G.; Pennington, S.H.; Ward, S.A.; Hong, W.D.; Biagini, G.A.; Owen, A.; et al. Therapeutic Potential of Nitazoxanide: An Appropriate Choice for Repurposing versus SARS-CoV-2? ACS Infect. Dis. 2021, 7, 1317–1331. [Google Scholar] [CrossRef] [PubMed]
  39. Blum, V.F.; Cimerman, S.; Hunter, J.R.; Tierno, P.; Lacerda, A.; Soeiro, A.; Cardoso, F.; Bellei, N.C.; Maricato, J.; Mantovani, N.; et al. Nitazoxanide superiority to placebo to treat moderate COVID-19—A Pilot prove of concept randomized double-blind clinical trial. EClinicalMedicine 2021, 37, 100981. [Google Scholar] [CrossRef] [PubMed]
  40. Bobrowski, T.; Chen, L.; Eastman, R.T.; Itkin, Z.; Shinn, P.; Chen, C.Z.; Guo, H.; Zheng, W.; Michael, S.; Simeonov, A.; et al. Synergistic and Antagonistic Drug Combinations against SARS-CoV-2. Mol. Ther. 2021, 29, 873–885. [Google Scholar] [CrossRef] [PubMed]
  41. Fintelman-Rodrigues, N.; Sacramento, C.Q.; Lima, C.R.; da Silva, F.S.; Ferreira, A.C.; Mattos, M.; de Freitas, C.S.; Soares, V.C.; da Silva Gomes Dias, S.; Temerozo, J.R.; et al. Atazanavir, Alone or in Combination with Ritonavir, Inhibits SARS-CoV-2 Replication and Proinflammatory Cytokine Production. Antimicrob. Agents Chemother. 2020, 64, 10–1128. [Google Scholar] [CrossRef] [PubMed]
  42. Chaves, O.A.; Sacramento, C.Q.; Ferreira, A.C.; Mattos, M.; Fintelman-Rodrigues, N.; Temerozo, J.R.; Vazquez, L.; Pinto, D.P.; da Silveira, G.P.E.; da Fonseca, L.B.; et al. Atazanavir Is a Competitive Inhibitor of SARS-CoV-2 Mpro, Impairing Variants Replication In Vitro and In Vivo. Pharmaceuticals 2021, 15, 21. [Google Scholar] [CrossRef] [PubMed]
  43. World Health Organization. Guidance on Regulations for the Transport of Infectious Substances 2013–2014: Applicable as from 1 January 2013; World Health Organization: Geneva, Switzerland, 2012. [Google Scholar]
  44. Olagunju, A.; Amara, A.; Waitt, C.; Else, L.; Penchala, S.D.; Bolaji, O.; Soyinka, J.; Siccardi, M.; Back, D.; Owen, A.; et al. Validation and clinical application of a method to quantify nevirapine in dried blood spots and dried breast-milk spots. J. Antimicrob. Chemother. 2015, 70, 2816–2822. [Google Scholar] [CrossRef]
  45. Akinloye, A.M.; Eniayewu, O.M.; Adeagbo, B.; Bolaji, O.; Olagunju, A. Validation and Clinical Application of a Liquid Chromatography–Ultraviolet Detection Method to Quantify Dolutegravir in Dried Blood Spots. Ther. Drug Monit. 2022, 44, 430–437. [Google Scholar] [CrossRef] [PubMed]
Figure 1. Plasma concentration–time curve of tizoxanide alone and with atazanavir/ritonavir (ATZ/r); data are presented here as mean (95% CI) for n = 18.
Futurepharmacol 04 00011 g001
Figure 2. Linearity between tizoxanide plasma concentrations and the DBS-calculated plasma concentrations (broken line represents true line of identity).
Futurepharmacol 04 00011 g002
Table 1. Accuracy and precision of plasma analysis.
Nominal Conc (ng/mL)Inter-AssayIntra-Assay
Mean (ng/mL)SD%Accuracy%CVMean (ng/mL)SD%Accuracy%CV
5046.93.984.48.345.10.590.31.0
150154.09.8102.66.4162.13.5108.02.2
400410.733.892.48.2448.816.0112.23.6
10001060.085.094.28.0974.640.997.54.2
25002671.6196.2106.97.32640.2165.3105.66.3
50005076.0359.9101.57.15205.5192.8104.13.7
10,0009850.4436.998.54.49797.1416.598.04.3
15,00014,055.01239.593.78.814,008.41301.693.49.3
20,00018,729.41975.593.610.519,647.21158.098.25.9
LLOQ (50 ng/mL)47.33.394.67.046.64.593.19.7
LQC (120 ng/mL)116.910.697.49.0125.99.2104.97.3
MQC (8600 ng/mL)8455.0896.798.310.68934.3697.2103.97.8
HQC (18,000 ng/mL)18,080.81481.2100.48.219,464.71058.7108.15.4
Table 2. Accuracy and precision of dried blood spot (DBS) analysis.
Nominal Conc (ng/mL)Inter-AssayIntra-Assay
Mean (ng/mL)SD%Accuracy%CVMean (ng/mL)SD%Accuracy%CV
5051.66.25103.112.1254.04.12107.94.12
150145.414.897.010.18137.76.0591.84.39
400414.629.2596.37.05417.99.22104.52.21
1000998.986.199.98.63987.8368.2998.86.91
25002418.6236.7696.89.792487.793.8899.53.77
50004902.9478.2898.19.764660.5235.2193.25.05
10,0009829.3773.5398.37.879403.2518.96945.52
15,00015,510.0720.3103.44.6414,828.3624.4398.94.21
20,00020,058.4673.36100.33.3619,944.497.9199.70.49
LLOQ (50 ng/mL)52.95.7105.710.849.56.599.113.1
LQC (120 ng/mL)118.313.598.611.4117.513.197.911.2
MQC (8600 ng/mL)9085.2729.1105.68.19012.3881.7104.89.8
HQC (18,000 ng/mL)17,604.71793.497.910.219,504.4648.6108.43.3
Table 3. Pharmacokinetic parameters of plasma tizoxanide with and without atazanavir/ritonavir.
Pharmacokinetic Parameters
(n = 18)
NTZ AloneNTZ Plus ATZ/rGMR (90% CI)
Mean (%CV)GM (%CV)Mean (%CV)GM (%CV)
AUC0–12 h (ng.h/mL)171,135.9 (111.4)124,967.7 (6.4)289,297.9 (58.9)233,984.1 (6.1)1872 (1870–1875)
Cmax (ng/mL)5304.4 (64.1)4375.7 (7.8)10,495.4 (47.7)8882.1 (7.8)2029 (1990–2070)
Cτ (ng/m L)1898.2 (262.2)553.8 (22.9)3082.8 (74.7)1740.7 (29.8)3143 (2268–4352)
NTZ: Nitazoxanide; ATZ/r: Atazanavir/ritonavir; GM: Geometric mean; GMR: Geometric mean ratio (GM of NTZ plus ATZr/GM of NTZ alone).
Table 4. Pharmacokinetic parameters of DBS-derived plasma tizoxanide with and without atazanavir/ritonavir.
Pharmacokinetic Parameters
(n = 18)
NTZ AloneNTZ Plus ATZ/rGMR [%, (90% CI)]
Mean (%CV)GM (%CV)Mean (%CV)GM (%CV)
AUC0–12 h (ng.h/mL)16,168.4 (75.8)13,646.2 (8.9)42,403.0 (24.3)41,772.6 (2.3)3.1 (1.5–6.2)
Cmax (ng/mL)3528.3 (94.4)2626.5 (14.5)8034.7 (7.8)8022.5 (0.9)3.05 (1.68–10.5)
Cτ (ng/m L)389.1 (14.2)387.1 (2.4)699.0 (18.3)550.5 (5.8)1.42 (1.28–2.04)
Disclaimer/Publisher’s Note: The statements, opinions and data contained in all publications are solely those of the individual author(s) and contributor(s) and not of MDPI and/or the editor(s). MDPI and/or the editor(s) disclaim responsibility for any injury to people or property resulting from any ideas, methods, instructions or products referred to in the content.

