Article

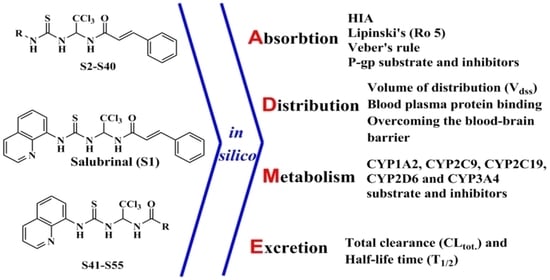
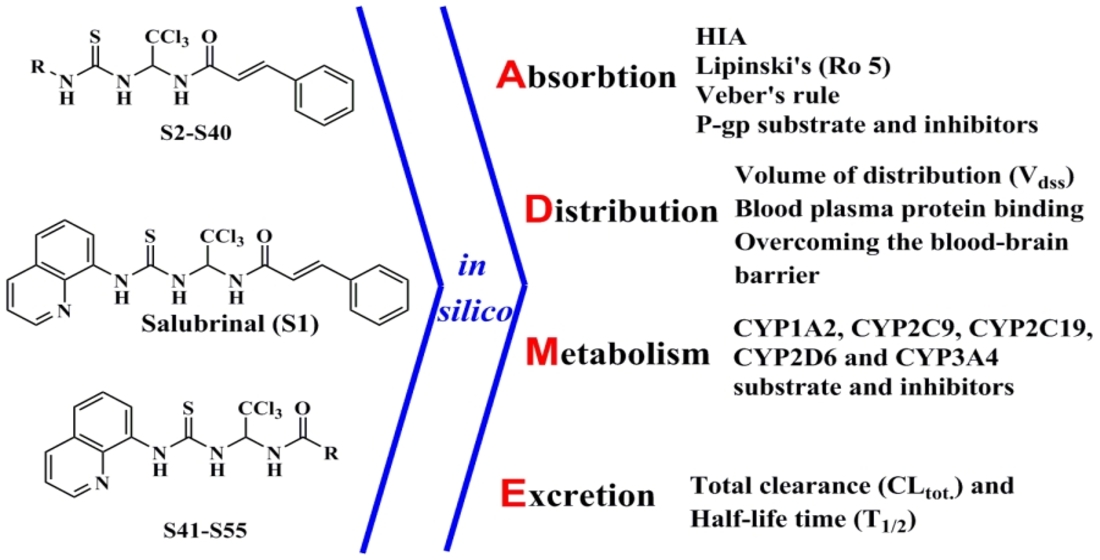
In Silico ADME Profiling of Salubrinal and Its Analogues

by
Pavlo V. Zadorozhnii
*,
Vadym V. Kiselev
and
Aleksandr V. Kharchenko
Department of Pharmacy and Technology of Organic Substances, Ukrainian State University of Chemical Technology, Gagarin Avenue, 8, 49005 Dnipro, Ukraine
*
Author to whom correspondence should be addressed.
Future Pharmacol. 2022, 2(2), 160-197; https://doi.org/10.3390/futurepharmacol2020013
Submission received: 29 April 2022 / Revised: 6 June 2022 / Accepted: 8 June 2022 / Published: 16 June 2022

Abstract

:
This work reports on a complex in silico assessment of the ADME properties of Salubrinal (S1) and 54 of its structural analogues containing a cinnamic acid residue (S2S40) or a quinoline ring (S41S55). In the work for (Q)SAR forecast, the online servers SwissADME, ADMETlab, admetSAR 2.0, Molinspiration, ALOGPS 2.1, pkCSM, SuperCYPsPred, and Vienna LiverTox were used. In addition, using AutoDock Vina, molecular docking studies were performed with transporter proteins and metabolic enzymes, which were intended to interact with the test compounds. In silico assessment of the ability of the S1S55 compounds to be absorbed in the intestine was carried out using the SAR classification models implemented in these servers, as well as on the basis of two empirical rules—Lipinski’s and Veber’s. Most of the studied compounds had moderate lipophilicity (MLogP ˂ 4.15) and a polar surface area of less than 140 Å2. They complied with Lipinski’s and Veber’s rules, and are predicted to have good intestinal absorption. In silico analysis of the distribution of the S1S55 compounds throughout the body, the volume of distribution at steady-state (Vdss), the ability to bind to blood plasma proteins and cross the blood-brain barrier (BBB) were taken into account. Most compounds are predicted to have low or medium Vdss and the ability to cross the BBB. Molecular docking studies were carried out with the structures most important for drug binding of blood plasma proteins, human serum albumin (HSA), and alpha-1-acid glycoprotein (AGP). The studies showed that these substances can effectively bind to blood plasma proteins. When assessing metabolism, the prediction of inhibitory and substrate activity to cytochromes P450 (CYP1A2, CYP2C9, CYP2C19, CYP2D6, and CYP3A4) was carried out. For most of these enzymes, the analyzed compounds are likely to be potential inhibitors, as indicated by the molecular docking data. For all studied compounds, a low total clearance (CLtot. ˂ 5 mL/min/kg) and a half-life time (T1/2 ˂ 3 h) are predicted.

Graphical Abstract

1. Introduction

The development of new highly effective and safe drugs is one of the most important and urgent tasks of modern pharmaceutical science. Among the obstacles standing in the way of modern pharmaceutical research and development, the main ones are their high cost [1,2,3] and huge financial risks [4]. Large pharmaceutical companies are forced to invest billions of dollars in new drug development projects. Usually, such projects have extremely low chances of success, and the likelihood that the developed drug will enter the pharmaceutical market and make a profit is very small [1,4]. The balance between risk and reward has been and remains a major problem in the pharmaceutical industry [4]. The inability of a new drug to enter the pharmaceutical market is usually associated with efficacy and safety issues, which are in part due to absorption, distribution, metabolism, excretion (ADME) properties, and toxic (side) effects [5,6]. Modern methods for assessing ADME/T properties are very expensive, time-consuming, and labor-intensive [6,7]. Usually, such studies require a large number of tests on animals [8], which, especially at the initial stages, is not justified from an ethical and economic point of view [9,10,11]. The solution to these problems can be seen in the application of rational drug design methods using modern computing resources [12,13,14].
At the moment, a large number of QSAR/SAR models have been developed [15], and special programs (online servers) based on them [16,17] allow highly accurate predictions of the ADME/T properties of chemical compounds. The use of in silico experiments at the initial stages of drug development makes it possible to screen out most of the candidate compounds with unfavorable properties even before the start of in vivo and in vitro tests [12,13]. This can significantly reduce financial investments, time, and labor costs, and also saves the lives of millions of laboratory animals [18,19]. The main goal of this work is a comprehensive in silico assessment of the ADME properties of Salubrinal and a number of its structural analogues.
Salubrinal slows down the synthesis of proteins in the cell and thereby helps it to get out of the state of stress of the endoplasmic reticulum [20]. The stress of the endoplasmic reticulum is a molecular pathological process. It is observed during functional overload of the ER caused by the accumulation of a large number of unfolded or incorrectly folded proteins [21]. This process poses a threat to the cell, can lead to its death through the apoptosis system [22], and underlies many serious diseases [23,24,25,26,27]. The mechanism of action of Salubrinal is associated with inhibition of the holoenzyme complex GADD34:PP1, which, by dephosphorylation, activates one of the key participants in protein synthesis, eukaryotic translation initiation factor 2α (eIF2α) [28]. It is eIF2α that triggers the synthesis of the peptide chain, facilitating the binding of the 40S-subunit of the ribosome with tRNAimet. As a result, the ribosome recognizes the mRNA start codon and begins protein synthesis [29]. Thus, Salubrinal reduces the intensity of protein synthesis processes, thereby facilitating the release of a cell from a state of stress and, literally, saves its life.
For the first time, the cytoprotective activity of Salubrinal was reported by M. Boyce et al. in 2005 [28]. Since then, this drug has been intensively used in biomedical research to study ER stress [20,30,31,32]. There are a large number of works devoted to the practical use of this drug, which show its promise in the treatment of diseases of the central nervous system [33,34,35,36,37], liver [38,39], urinary organs [32,40,41,42], cardiovascular [43,44,45] and endocrine systems [46,47], disorders associated with the integrity of bone tissues [48,49,50] and other diseases [20,51]. Salubrinal directly exhibits antitumor activity [52,53] and also reduces the resistance of tumor cells to other chemotherapeutic agents [54,55,56]. This drug has shown promising results in combination therapy for malignant tumors [57,58,59,60]. There are several studies devoted to the search for analogues of this drug (Figure 1) [61,62,63,64] and the study of its toxicity [65].
Information regarding the ADME properties of Salubrinal is scarce and scattered. It can be argued with confidence that this drug and some of its analogues are capable of being absorbed from the gastrointestinal tract (GIT) into the systemic circulation after intra-abdominal injection in experimental animals [23,61,63]. In addition, Salubrinal appears to cross the blood–brain [23,36,66,67,68] and ophthalmic barriers [69]. In this work, using open access online servers [16], we have performed in silico prediction of the ADME properties of Salubrinal and 54 of its structural analogues containing a cinnamic acid residue (S2S40) or a quinoline ring (S41S55) (Figure 2). Molecular docking studies have been carried out with transporter proteins and metabolic enzymes that are intended to interact with the studied compounds [70].

2. Materials and Methods

The structures of the S1S55 compounds for in silico studies were taken from the SciFinder database (Tables S1 and S2). Before predicting ADME properties, the structures of all compounds were preliminarily converted to SMILE format using the OpenBabel 2.3.1 program [71]. The open online servers SwissADME [72], ADMETlab [73], admetSAR 2.0 [74,75], Molinspiration [76], ALOGPS 2.1 [77], pkCSM [78], SuperCYPsPred [79] and Vienna LiverTox [80] were used for prediction (Table S3). Molecular docking studies with transporter proteins and metabolic enzymes of the P450 family (CYP) were carried out at AutoDock Vina [81] based on the PyRx 0.8 platform. The Chimera 1.14 program was used to prepare the structures of protein molecules for docking [82]. Before docking, the structures of the studied compounds S1S55 and reference drugs were optimized in the ArgusLab 4.0.1 software package [83,84,85,86,87] using the semi-empirical PM3 method [88]. The structural features of Salubrinal and its structural analogues were discussed earlier in [64]. The molecular docking results were visualized in PyMOL 0.99rc6 [89].

2.1. Absorption

In silico assessment of the ability of the studied compounds to be absorbed in the intestine was carried out using the web servers ADMETLab [73], admetSAR 2.0 [74,75] and SwissADME [72], as well as on the basis of two empirical rules—Lipinski’s [90] and Veber’s [91] (Table S4).
The HIA forecast in ADMETLab is based on the N.-N. Wang and co-authors’ model [92] constructed using a modified random forest (RF) approach [93] from a dataset of 970 compounds. For forecasting HIA, admetSAR 2.0 uses the model of J. Shen and co-authors [94], which is built using an approach based on the recognition of the substructure image followed by the use of the support vector machine (SVM) algorithm [93]. SwissADME predicts intestinal absorption of small molecules using the BOILED-Egg method (Brain or IntestinaL EstimateD), which is based on the calculation of parameters such as lipophilicity index (WLOGP) and polar surface area (TPSA) [95]. All forecast results obtained by the above methods have categorical values. ADMETLab and admetSAR 2.0 provide predicted probabilities for the results (+ or −). For ADMETLab these values must be higher than 0.5, otherwise, the result belongs to a different category, and for admetSAR 2.0 they have a value from 0 to 1. SwissADME does not provide a probability value, but only a category—High or Low.
According to Lipinski’s rule (rule of 5, Ro 5), a substance will be well absorbed in the intestine, provided that it has a molecular weight (Mw) of less than 500 a.m.u., less than five hydrogen bond donors (NH bond donors), less than ten hydrogen acceptors bonds (NH bond acceptors) and the calculated CLOGP value [96] is less than five (for MLOGP [96] it is less than 4.15) [90]. If a substance does not meet two or more criteria, its absorption in the intestine will be low. Veber’s rule takes into account only two parameters: the number of bonds, around which free rotation is possible (Nrot. bonds), and the polar surface area (PSA). For poor oral bioavailability, Nrot. bonds must be over 10, and PSA must be over 140 Å2. Calculation of parameters such as Mw, NH bond donors, NH bond acceptors, and Nrot. bonds were carried out using the online server Molinspiration [76]. Various methods and approaches were used to calculate LogP and PSA (see Section 2.1.1 and Section 2.1.2).
In addition, the ability of drugs to be absorbed in the intestine can be significantly influenced by the transmembrane efflux transporter, P-glycoprotein (P-gp) [97]. The structures of the S1S55 compounds were analyzed in silico for substrate and inhibitory activity towards this transporter.

2.1.1. Calculation of the Lipophilicity Coefficient (LogP)

Since at the moment there are no experimental data on the value of the lipophilicity coefficient of Salubrinal and its analogues, we used various calculation methods to determine it. In this case, only the MLOGP value was taken into account as a parameter for assessing the analyzed structures for compliance with Ro 5 [90]. The LogP values obtained by other methods were used solely for comparative assessment (Table S5). We used substructure-based methods, which conditionally cut the structure of a molecule into separate atoms (atom-based methods) or fragments (fragmental methods). The final LogP value was calculated as the sum of the contributions of each atom or fragment [96]. Among the atom-based methods, we used the original Ghose-Crippen (ALOGP) [98] and its modification (WLOGP) [99], as well as the method developed by the Shanghai Institute of Organic Chemistry at the Chinese Academy of Sciences (XLOGP3) [100]. Among the fragmental methods, we used the approach implemented in Molinspiration (miLOGP) [96]. To calculate the LogP, we also used property-based methods. Two methods are based on topological descriptors—the Moriguchi method (MLogP) [101,102] and the method developed by Tetko et al. (ALOGPs) [96,103]. One more method, based on the GB/SA approach (Generalized Born (GB) model augmented with the hydrophobic solvent accessible surface area (SA)), was developed by A. Daina et al. (ILOGP) [104]. We also used the hybrid fragmental/topological method proposed by SILICOS-IT. In addition, we calculated the consensus LogP value obtained as the arithmetic mean of all LogP values obtained by the above methods.
The calculation of LogP by the above methods was carried out using the web servers admetSAR 2.0, ADMETLab, SwissADME, Molinspiration, and ALOGPS 2.1. ADMETLab and admetSAR 2.0 use the Ghose-Crippen method for calculation and, as a result, give the identical ALOGP values. SwissADME calculates LogP using five different methods and, as a result, gives the iLOGP, XLOGP3, WLOGP, MLOGP values, and the LogP value calculated in program Filter-it™ using a method developed by SILICOS-IT. Molinspiration and ALOGPS 2.1 use their methods to calculate LogP and give the miLOGP and ALOGPs values, respectively.

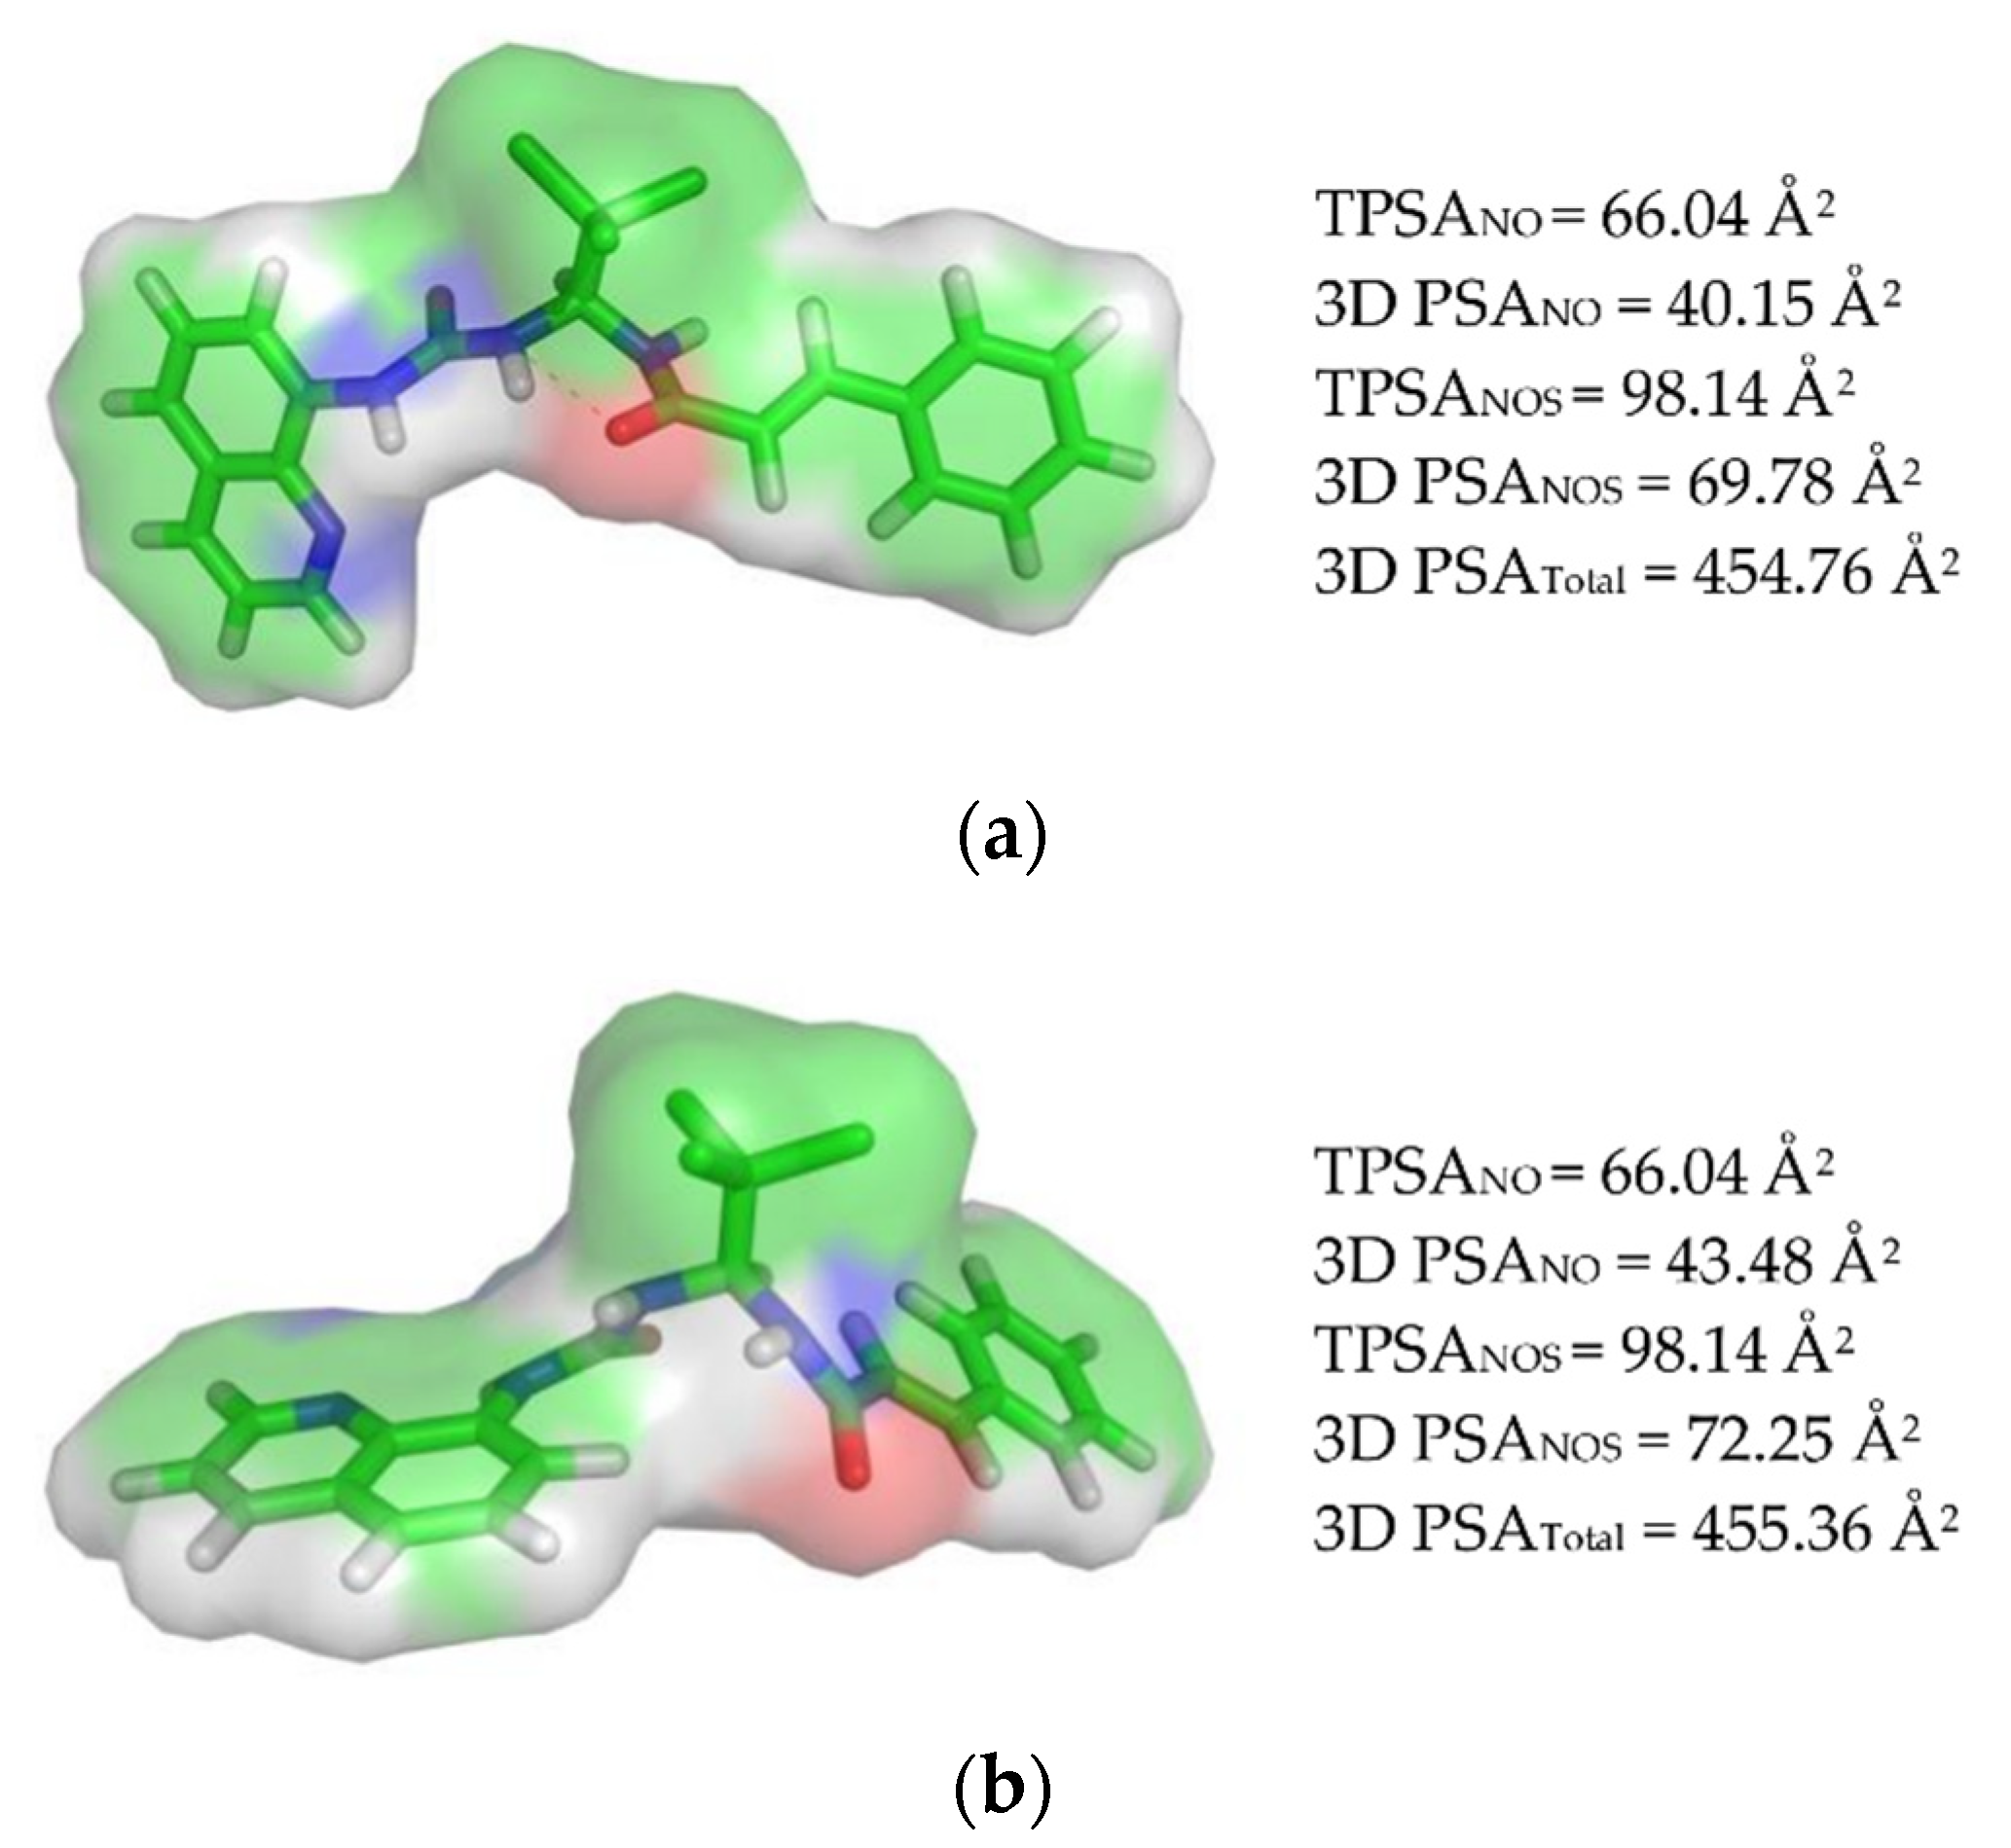
2.1.2. Calculating the Polar Surface Area (PSA)

The polar surface area (PSA) of a molecule is the surface that belongs to polar atoms. To calculate it, we used 2D PSA/TPSA (topological PSA) and 3D PSA approach (Table S6). The TPSA calculation method is based on the summation of the tabulated surface contributions of polar fragments [105]. We used Molinspiration and SwissADME to calculate the TPSA. Molinspiration considers only nitrogen and oxygen atoms as polar atoms, taking into account the adjacent hydrogen atoms. SwissADME also takes into account sulfur atoms and -SH groups [106]. The 3D PSA was calculated by a static method based on atomic Van der Waals radii [107] using the PyMOL 0.99rc6 program [89]. Three different 3D PSA values were obtained for all studied compounds. In the first case, the atoms of N and O were taken into account, in the second—N, O, and S, and in the third, for comparison, the total area of the polar surface of the molecule (total PSA) was calculated. In all cases, adjacent hydrogen atoms were taken into account. For the calculation, we used the following commands [108]:
set dot_density, 4
set dot_solvent, off
get_area elem N + O or get_area elem N + O + S or get_area all.

2.1.3. Interaction with P-glycoprotein (P-gp)

P-glycoprotein (P-gp, ABCB1) belongs to the superfamily of transmembrane transporters ABC [109]. It is concentrated in the cells of most of the body’s biological barriers (small intestine, blood–brain barrier, liver, and kidneys). P-gp is an efflux transporter and is able to remove drugs from the cell, thus affecting their intestinal absorption [109,110]. For structures S1S55, the ability to inhibit P-gp or act as a substrate for it was predicted. The forecast was carried out using the online servers ADMETlab, admetSAR 2.0, and Vienna LiverTox (Table S7).
The prognosis of inhibitory activity in ADMETlab and admetSAR 2.0 was based on models built using data from F. Broccatelli et al. [111] and L. Chen et al. [112]. The F. Broccatelli’s database includes 1275 compounds (666 P-gp inhibitors and 609 P-gp non-inhibitors), and the L. Chen’s database includes 1273 compounds (797 Pgp inhibitors and 476 Pgp non-inhibitors). The final model in ADMETLab was built using an extended-connectivity fingerprint of diameter 4 (ECFP4) [113], and in admetSAR 2.0, using AtomPairs [113]. In both cases, the SVM algorithm was used to construct the model [93]. Substrate activity was predicted by the ADMETlab online server based on a model created using data from Z. Wang et al. [114] and D. Li et al. [115]. Z. Wang’s work includes 332 compounds (127 P-gp substrates and 205 P-gp non-substrates), and D. Li’s work includes 933 compounds (448 P-gp substrates and 485 P-gp non-substrates). The SVM algorithm and ECFP4 fingerprints were used to build the model. To predict substrate activity, admetSAR 2.0 used a model based on data from [114,115]. The resulting classification model contains 718 P-gp substrates and 847 P-gp non-substrates. To construct the model, the SVM algorithm [93] and Morgan fingerprints [116] were used. The prognosis of inhibitory activity in Vienna LiverTox is based on the model constructed from data by F. Broccatelli et al. [111], and the substrate activity is based on the work of G. Szakács et al. [117], which includes 48 known substrates.
For the structures of all studied compounds, molecular docking studies were carried out with the cryo-EM P-gp structure in the inward-facing conformation (Table S7). The P-gp structure was downloaded from the Protein Data Bank, PDB ID 6QEX [118]. For molecular docking, molecules of all non-protein components were previously removed from 6QEX: taxol (TA 11320), 1,2-diacyl-SN-glycero-3-phosphoethanolamine (3PE 1321, 1322), 2-acetamido-2-deoxy-beta-D-glucopyranose (NAG 1301–1303), cholesterol (CLR 1304–1319). In addition, chains B and C of the antigen-binding fragment (Fab) of the inhibitory antibody UIC2 were removed from 6QEX. Hydrogen atoms were added to the P-gp structure before molecular docking. All the above operations to prepare the protein structure were performed using the Chimera 1.14 program [82]. During molecular docking, the docking site on the protein target was determined by creating a grid with dimensions of 25.0 × 25.0 × 25.0 Å. The grid was centered on amino acids Ile 306, Ile 340, Phe 343, Phe 728, Val 982 [119], center coordinates—X: 174.4, Y: 168.7, Z: 157.2 Å.

2.2. Distribution

In silico analysis of the distribution of the studied compounds throughout the body, the volume of distribution parameter, the ability to bind to blood plasma proteins and cross the blood–brain barrier were taken into account (Table S8).

2.2.1. Volume of Distribution

The volume of distribution (apparent volume of distribution, Vd) is a hypothetical volume of fluid, in which an injected amount of a drug could be distributed to create a concentration corresponding to that in blood plasma [120]. To predict this parameter, we used the online servers ADMETLab and pkCSM. Both servers calculate the volume of distribution at steady-state (Vdss), which is the most significant among similar parameters in drug development [121]. ADMETLab and pkCSM use a predictive model built using the RF method based on the database by R.S. Obach and co-authors’ containing information on the pharmacokinetic parameters of 670 drugs [122]. According to the prediction results, ADMETLab and pkCSM gave the values of the decimal logarithm of Vdss, for the convenience of interpretation, the obtained values were extracted from the lagorithm function. When interpreting the results obtained, a Vdss value less than the total body water content (0.6 L/kg) was considered low, Vdss from 0.6 to 5.0 L/kg—moderate, and more than 5.0 L/kg—high [121].

2.2.2. Blood Plasma Protein Binding

The ability of a substance to bind to blood plasma proteins is one of the key factors determining its pharmacokinetics [123,124]. In silico evaluation of this property for the S1S55 compounds was carried out using the online servers ADMETLab and admetSAR 2.0. The forecast in ADMETLab is based on a database of 1822 compounds collected by developers from literary sources [125,126,127,128] and the DrugBank database [129]. admetSAR 2.0 uses the model of L. Sun’s et al., [130] which was built using the random forest method and contains 1209 compounds. Both online servers provide the prediction result as a percentage of the protein-bound drug fraction (fb,%).
Among the large number of different blood plasma proteins involved in drug binding, human serum albumin (HSA) and alpha-1-acid glycoprotein (AGP) play a primary role [131]. We have carried out molecular docking studies with the structures of these proteins. As a target for docking, we chose the X-ray structure of HSA in a complex with indomethacin (PDB ID 2BXM) with a resolution of 2.50 Å [132]. Before docking, hydrogen atoms were added to the crystal structure, and all non-protein components were removed: myristic acid (MYR 1001–1007), indomethacin (IMN 2001, 2002), and water molecules. Molecular docking was performed at two main binding sites, the first of which (site 1) was located in the IIA sub-domain, and the second one (site 2) was located in IIIA. In the first case, a grid with dimensions 25.0 × 25.0 × 25.0 Å was centered on the amino acids Tyr 150, Lys 195, Lys 199, Trp 214, Arg 218, Leu 219, Arg 222, Phe 223, Leu 238, His 242, Arg 257, Leu 260, Ile 264, Ser 287, Ile 290 and Ala 291, and in the second case—on the amino acids Arg 410, Tyr 411, Lys 414 and Ser 489 [131]. The coordinates of the grid center were X: 32.0, Y: 12.6, Z: 10.0 Å, and X: 6.6, Y: 3.1, Z: 18.3 Å, respectively.
In human blood plasma, AGP is represented by two main genetic variants—A and F1*S. The molar ratio of the variants A and F1*S usually ranges from 1:3 to 1:2 [133]. The F1*S variant has a significantly larger binding pocket compared to the A variant and less selectivity for drug interactions [134]. Molecular docking was performed with the protein structures of both variants. From the Protein Data Bank, we selected the structure of the A variant with a resolution of 2.10 Å (PDB ID 3APU) [135] and the F1*S variant with a resolution of 1.80 Å (PDB ID 3KQ0) [136]. All non-protein components were removed from both crystal structures before docking. Tetraethylene glycol (PG4 190) and water molecules were removed from the 3APU structure, and the (2R)-2,3-dihydroxypropyl acetate (JIM 193) molecule, chlorine ion, and water molecules were removed from the 3KQ0 structure. Furthermore, hydrogen atoms were added to both structures. During molecular docking, the docking site on both protein targets was determined by creating a grid with dimensions of 25.0 × 25.0 × 25.0 Å. In the case of the A variant structure, the grid was centered on the amino acids Tyr 27, Phe 49, Phe 51, Leu 62, Arg 68, Leu 79, Val 88, Arg 90, Leu 101, Leu 110, Phe 112, and Tyr127, and in the case of the F1*S variant structure—on the amino acids Tyr 27, Phe 49, Phe 51, Leu 62, Arg 68, Leu 79, Ile 88, Arg 90, Leu 101, Tyr 110, Leu 112 and Tyr 127 [131]. In the first case, the coordinates of the grid center were X: 8.7, Y: 2.1, Z: 16.7 Å, and in the second case—X: 20.4, Y: −1.6, Z: 6.0 Å.

2.2.3. Overcoming the Blood–Brain Barrier

The blood–brain barrier (BBB) is a unique biological barrier that consists of microvascular endothelial cells of the central nervous system (CNS). These cells filter everything that enters and exits the brain. The main role of the BBB is to maintain homeostasis in the central nervous system by limiting the transport of toxic substances and removing metabolites from the brain [137]. For most modern drugs, the BBB is an insurmountable obstacle [138]. In silico assessment of the ability of Salubrinal and analogues to cross the blood–brain barrier was carried out using the online servers ADMETLab, admetSAR 2.0, and pkCSM. ADMETLab uses datasets of H. Li et al., for forecasting [139], and contains data on 415 compounds, and the work by J. Shen et al., [94], containing data on 1840 compounds. The model was built using the support vector machine [93]. The molecules of compounds from the training set were represented by Extended-Connectivity Fingerprints (ECFP2). Furthermore, admetSAR 2.0 also uses J. Shen’s model for forecasting [94]. Since both online servers use binary models, the forecast result is a categorical value—if the substance is capable of penetrating the BBB (+) or not (−). In ADMETLab and admetSAR 2.0, forecast accuracy is indicated as a value of the probability with which this ability of a substance will be detected in a biological experiment. The higher the probability value, the greater the forecast reliability.
The prediction of the ability of a substance to cross the BBB into pkCSM is based on the model by A. Yan’s et al., [140], which contains 320 data points. The result of the prediction is the LogBB value, defined as the logarithm of the ratio of the drug concentration in the brain to the concentration in blood measured at a steady state. According to the prediction results, substances with a value of LogBB ˃ 0.3 were those that easily cross the BBB, and substances with LogBB ˂ −1.0 were those that were difficult to cross [141].

2.3. Metabolism

In the metabolism of drugs, xenobiotics, and other exogenous products, heme-containing enzymes of the P450 family (CYP) play a primary role. These enzymes are predominantly associated with the membranes of the smooth endoplasmic reticulum and mitochondria of hepatocytes and intestines. To date, 57 P450 isoforms have been identified in humans [142]. Five of them are of primary importance for drug metabolism: CYP1A2, CYP2C9, CYP2C19, CYP2D6, and CYP3A4. These enzymes are involved in the metabolism of more than 80% of all known drugs [143]. For in silico assessment of the inhibitory and substrate activities of Salubrinal and its analogues towards these five isoforms, we used the online servers ADMETLab, admetSAR 2.0, pkCSM, SwissADME, and SuperCYPsPred (Tables S9–S13). All the listed online servers use classification models for forecasting, i.e., whether the analyte will exhibit inhibitory and substrate activity towards P450 of a particular isoform or not (+ or −). At the same time, ADMETLab, admetSAR 2.0, and pkCSM provide a value for the probability of forecast accuracy. In the case of ADMETLab, it should be from 0.5 to 1.0, otherwise, the forecast result will be assigned to another category, and in the case of admetSAR 2.0 and pkCSM, the probability takes a value from 0 to 1.
In ADMETLab, the prognosis of inhibitory activity is based on a dataset prepared by M. Rostkowski et al. [144], which contains information on the inhibitory activity of 17,143 compounds obtained using quantitative high-throughput screening with in vitro bioluminescence assay [145]. Predictive models were constructed using RF or SVM methods and an extended-connectivity fingerprint with a diameter of either 2 or 4 (ECFP2/4) [113]. admetSAR 2.0 uses models built by F. Cheng et al. [146], which contain more than 24,700 unique compounds in the dataset retrieved from the open PubChem database [147]. The models were constructed using the SVM algorithm and the molecular ACCess system (MACCS) keys [148]. pkCSM, like admetSAR 2.0, uses a dataset of F. Cheng et al. [146]. This prediction is based on distance-based graph signatures using the Cutoff Scanning algorithm [149], which was adapted to represent the structure and chemical composition of small molecules. For forecasting, SwissADME uses models based on data from H. Veith et al. [145] using the SVM algorithm. The developers of SuperCYPsPred used datasets from two open databases to build predictive models: PubChem BioAssay database (AID: 1851) [150] and SuperCYP’s own database [151]. When creating the models, the RF algorithm was used with the use of two types of fingerprints—MACCS [148] and Morgan [116]. We used both types of fingerprints for the forecast.
Before molecular docking, we searched the admetSAR database for known cytochrome P450 inhibitors, which are structurally similar to the studied compounds (the Tanimoto coefficient was more than 0.7). We selected 13 compounds (E1E13) containing a trichloroethylcarboxamide fragment (CCl3CHNHC(O)R), for which the AC50 value was at least 10 µM (Table S14). The structures of the reference compounds E1E13 were optimized (Figure S6) and subsequently subjected to a docking procedure. Molecular docking for compounds E1E13 and S1S55 was carried out simultaneously. Furthermore, the results obtained for E1E13 were used to construct correlation dependences.
For all studied compounds, molecular docking studies were carried out with X-ray structures of the main five P450 isoforms, which were downloaded from the Protein Data Bank, PDB ID: 2HI4 (CYP1A2, resolution 1.95 Å) [152], 1OG5 (CYP2C9, resolution 2.55 Å) [153], 4GQS (CYP2C19, resolution 2.87 Å) [154], 3QM4 (CYP2D6, resolution 2.85 Å) [155] and 1W0E (CYP3A4, resolution 2.80 Å) [156]. These protein structures were prepared for molecular docking using the Chimera 1.14 program [82]. Previously, water molecules and all non-amino acid components, except for hemes, were removed from the proteins. The 2-phenyl-4H-benzo[h]chromen-4-one (BHF 800) molecule was removed from the 2HI4 structure, the S-Warfarin (SWF 502) molecule was removed from the 1OG5 structure, and the molecule of (4-hydroxy-3,5-dimethylphenyl)(2-methyl-1-benzofuran-3-yl)methanone (0XV 502) and three glycerol molecules (GOL 503-505) were removed from the 4GQS structure, and the Prinomastat molecule (PNO 503) was removed from the 3QM4 structure. In addition, due to the identity with chain A, chain B was removed from structures 1OG5 and 3QM4; and chains B, C, and D were removed from the 4GQS structure as well. Hydrogen atoms were also added to the structures. In all cases, during molecular docking, the docking site on the protein target was determined by creating a grid with dimensions of 25.0 × 25.0 × 25.0 Å. For CYP1A2, the grid was centered on amino acids Thr 124, Phe 125, Thr 223, Phe 226, Phe 260, Gly 316, Thr 321, Ile 386, Leu 497 [143], center coordinates—X: 2.6, Y: 16.8, Z: 18.5 Å. In the case of CYP2C9, on the amino acids Arg 97, Arg 108, Val 113, Phe 114, Gln 214, Asn 217, Asp 293, Thr 364, Ser 365, Phe 476 [143], center coordinates X: −21.7, Y: 89.3, Z: 36.5 Å. When docked with CYP2C19, the coordinates of the grid center were X: −81.3, Y: 25.1, Z: −44.4 Å, and the grid was centered on the amino acids Phe 114, Asn 204, Ile 205, Ala 292, Asp 293, Gly 296, Ala 297, Ile 362, Phe 476 [143]. For CYP2D6, the grid was centered on the amino acids Phe 112, Phe 120, Ala 209, Lys 214, Phe 247, Asp 301, Ala 305, Thr 309, Val 374, Phe 483 [143], center coordinates X: −8.3, Y: −9.8, Z: 30.1 Å. In the case of CYP3A4, on the amino acids Phe 57, Asp 76, Arg 106, Phe 108, Ser 119, Phe 213, Phe 215, Thr 224, Phe 304, Thr 309, Met 371, Arg 372, Glu 374, Gly 481 [143], center coordinates—X: 63.0, Y: 86.6, Z: 13.7 Å.
Prediction of substrate activity for the S1S55 compounds was carried out using the online server ADMETLab (for all five P450 isoforms), admetSAR 2.0 (for CYP2C9, CYP2D6, and CYP3A4), and pkCSM (for CYP2D6 and CYP3A4) (Tables S9–S13). The forecast in ADMETLab is based on models built using the RF algorithm and ECFP4 fingerprints. Compounds for the training set were taken from M. Carbon-Mangels et al. [157], J. Zaretzki et al. [158], and the PubChem BioAssay database (AID: 1851) [150]. admetSAR 2.0 also uses models based on data from M. Carbon-Mangels et al. [157], built using MACCS fingerprints and SVM algorithm. The pkCSM online server uses models built by admetSAR developers for operation, the forecast is based on graph signatures based on distances using the Cutoff Scanning algorithm [149].

2.4. Elimination

In silico analysis of how Salubrinal and its analogues under consideration are excreted from the body, we predicted two most important pharmacokinetic parameters: total clearance (CLtot.) and half-life time (T1/2) (Table S15).
Clearance is a pharmacological parameter that quantifies the rate of irreversible removal of a drug from the body [159]. Since medicinal substances can be excreted from the body by various organs (kidneys, liver, lungs, salivary, mammary glands, etc.), several types of clearance are also distinguished—renal (CLr) [160], hepatic (CLh) [161], etc. For the S1S55 compounds, we predicted the total clearance, which is the sum of all types of clearance. To calculate this parameter, we used the online servers ADMETLab and pkCSM. ADMETLab predicts the clearance value based on the RF model and uses the data collected by R.S. Obach et al. [122]. The online server pkCSM uses 503 data points from C.W. Yap et al. to predict this parameter. [162]. The prediction is based on distance-based graph signatures using the adapted Cutoff Scanning algorithm [159]. Both online servers use regression models for forecasting and, as a result of the forecast, give continuous clearance values in mL/min/kg. In this case, ADMETLab directly gives the value of CLtot., and pkCSM—in the form of the value of logCLtot.. To unify the results obtained, the values obtained using pkCSM were extracted from the lagorithm function.
The half-life time is the time required for the concentration of a drug (usually in blood or plasma) to fall to half of the initial value [163]. To calculate this parameter, we used the ADMETLab online server, which uses a model for forecasting based on data collected by R.S. Obach et al. [122] constructed using the RF method. The model used is regression and the forecast results have continuous T1/2 values in h.

3. Results and Discussion

3.1. Absorption

The oral route of administration has many advantages over other routes of drug administration, making it the most common [164]. One of the key processes that determine the oral bioavailability of drugs is their absorption in the small intestine. An in silico assessment of the ability of the studied compounds to be absorbed in the intestine was carried out based on the N.-N. Wang et al., model [92] (implemented in ADMETLab), the model by J. Shen et al. [94] (implemented in admetSAR 2.0), and the BOILED-Egg method [95] used in SwissADME [72].
admetSAR 2.0 predicted the capacity for absorption in the human intestine for all 55 analyzed compounds, the probability was 0.831–0.964. ADMETLab predicted HIA for 52 compounds (probability 0.520–0.739) and SwissADME predicted high absorption capacity for 47 compounds (Table S4). The obtained prediction results turned out to be contradictory and did not make it possible to take away substances with potentially low HIA. According to the prediction results in ADMETLab, compounds S7, S20, and S21 should be poorly absorbed in the intestine, while other methods predict good absorption for these compounds. A similar situation is observed in the case of the forecast in SwissADME, according to which compounds S17, S23, S24, S31, S33, S34, S54 and S55 should have low absorption capacity. In this regard, we had to resort to two empirical rules that have already become classics—Lipinski’s [90] and Veber’s [91].

3.1.1. Calculation of the Lipophilicity Coefficient (LogP) and Ro 5

The calculation of such parameters as Mw, NH bond donors and NH bond acceptors was not difficult and was successfully carried out using the online server Molinspiration [76] (Table S4). There are many different methods and approaches for calculating LogP [96]. In their classic work, Lipinski and colleagues suggested using the CLOGP (value should be ˂5) or MLOG (value should be ˂4.15) [90]. To assess the analyzed structures for compliance with Ro 5, we took into account the MLOGP value. In total, to calculate the lipophilicity coefficients of the analyzed compounds, we used eight different methods ALOGP, iLOGP, XLOGP3, WLOGP, MLOGP, SILICOS-IT, miLOGP, and ALOGPs. We also calculated the consensus LogP value as the arithmetic mean of all LogP values obtained by the above methods (Table S5).
The calculated LogP values obtained by these methods generally correlate well with each other. The R2 value was 0.38–0.92 (Figure S1). The best correlation was observed between the ALOGP, ALOGPs, and XLOGP3 methods, R2 ˃ 0.90. The same methods gave a better correlation with LogPConsensus, R2—0.93–0.96 (Figure S2). When comparing the LogP values calculated by the Moriguchi method with other methods, R2 was 0.39–0.66. The best correlation was observed with the XLOGP3 and ALOGPs methods. When comparing the MLOGP values with LogPConsensus—R2 was 0.73. Salubrinal and Sal 003 had the MLOGP values of 2.71 and 4.09, respectively. They satisfied Lipinski’s rule for other criteria as well, and therefore should have good oral bioavailability. For the four analyzed compounds S29, S30, S31, and S50, the MLOGP value exceeded the threshold value of 4.15. However, only the S31 and S50 compounds did not satisfy two parameters at once (Mw ˃ 500 a.m.u.) and, therefore, did not correspond to Ro 5 (Table S4). It is noteworthy that the replacement of the chlorine atom in the structure of Sal 003 by bromine (S50) led to a significant increase (by 1.3) in MLOGP (Figure 3).

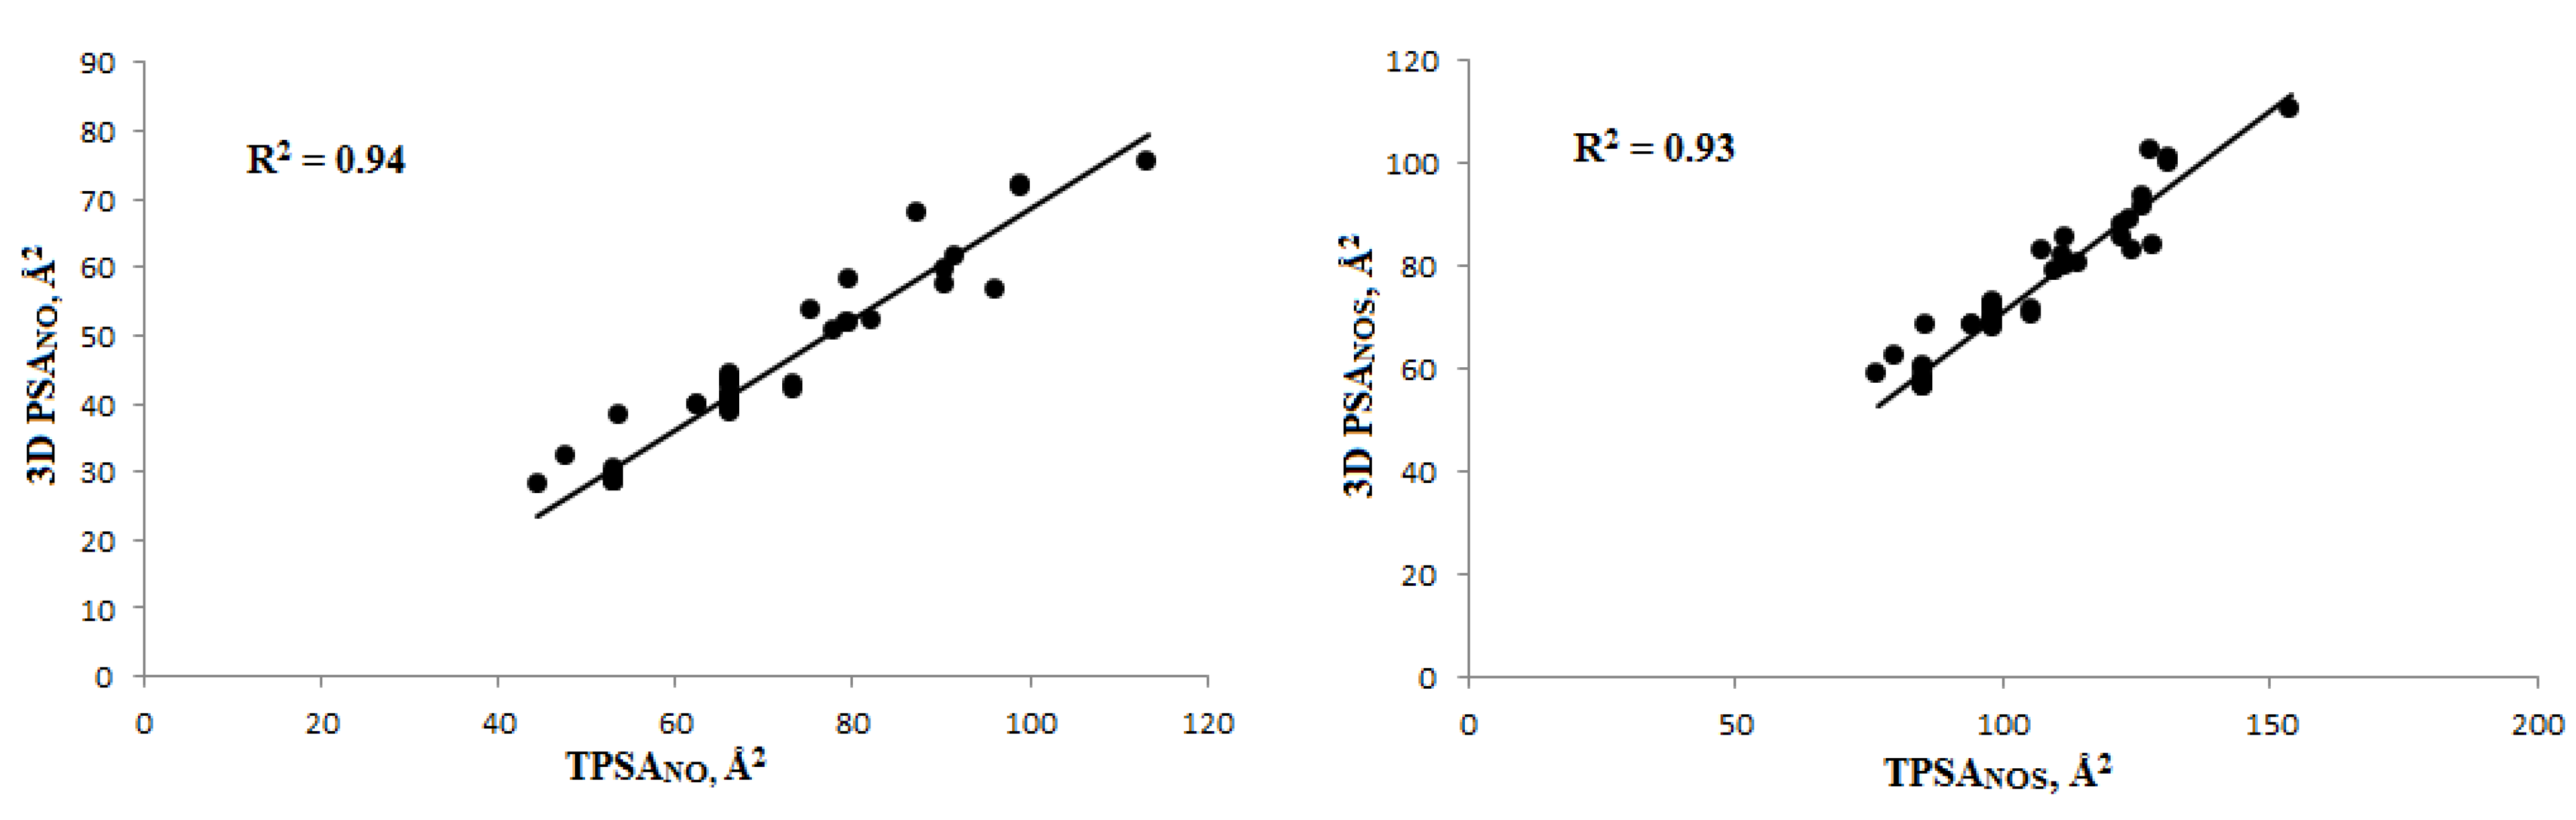
3.1.2. Polar Surface Area (PSA) Calculation and Veber’s Rule

Veber’s rule is based on two parameters, the number of bonds around which free rotation is possible (Nrot. bonds) and the polar surface area (PSA). Molinspiration was used to calculate Nrot. bonds (Table S4). The calculation of the polar surface area of Salubrinal and its analogues was carried out using 2D PSA/TPSA (topological PSA) and 3D PSA methods. To calculate 3D PSA, we used S1S55 structures optimized by the PM3 method. It was noted that for various conformers, including containing an intramolecular hydrogen bond NH…O=C [64,165], the 3D PSA value remains practically unchanged (Figure 4). Therefore, the calculation was carried out by a static method based on atomic Van der Waals radii. For both TPSA and 3D PSA, two values were obtained; in the first case, nitrogen and oxygen atoms were taken into account, and in the second case, sulfur atoms were also taken into account (Table S6). In the case of 3D PSA, the total polar surface area of the molecule (total PSA) was additionally calculated.
The results of PSA calculation by the TPSA and 3D PSA methods correlate well with each other (Figure 5). R2 for the PSA values calculated with allowance for nitrogen and oxygen atoms was 0.94, and with an additional allowance for sulfur atoms—0.93. The PSA values obtained by the topological method are about 25–30 Å2 higher than by the 3D method. In this case, both methods for all studied compounds, except for S34 (TPSANOS 153.79 Å2), gave the PSANO and PSANOS values ˂ 140 Å2. As the final PSA value, we took the PSANOS calculated by the 3D method. According to the results obtained, only tert-butyl (4-(3-(2,2,2-trichloro-1-cinnamamidoethyl)thioureido)butyl)carbamate (S7) did not meet Veber’s rule, since it had 14 bonds, around which free rotation was possible.

3.1.3. Interaction with P-glycoprotein (P-gp)

P-glycoprotein (P-gp, ABCB1) is an efflux transporter, and is able to influence the absorption of drugs in the intestine, removing them from the cell [109,110]. The structures of all studied compounds were analyzed in silico for inhibitory and substrate activity towards P-gp. The forecast results were not unambiguous. ADMETLab, with a probability of 0.506–0.900, predicted for all 55 compounds the ability to inhibit P-gp and the role of the substrate was not predicted for any of them (Table S7). Vienna LiverTox also did not predict substrate activity for compounds S1S55 but inhibiting one, with a probability of 0.530–0.750, for 14 compounds (S1, S22, S31, S36, S45, S47S55). According to the forecast in admetSAR 2.0, three compounds (S33, S51, and S52), with a probability of 0.597–0.634, were potential inhibitors of P-gp, and only compound S7 (a probability of 0.527) was assigned the role of a substrate. In this regard, we carried out molecular docking studies of compounds S1S55 with the P-gp structure.
At the moment, there is no atomic structure of human P-gp obtained by the X-ray diffraction method in the protein data bank. However, there are several cryo-EM structures of this transporter. For molecular docking, we chose the P-gp structure with the best resolution (3.6 Å), which was in the inward conformation [118]. Inhibitors and substrates of P-gp interact with an identical active site. Therefore, based only on the position in the P-gp pocket, the ligand cannot be unambiguously assigned to one or another. However, it was noted that inhibitors form somewhat stronger complexes with the active site as compared to substrates [166]. We selected Zosuquidar and Mibefradil, IC50 0.02 and 1.90 µ, respectively, as reference drugs capable of inhibiting P-gp [167]. Topotecan [168] and Colchicin [169] were used as reference substrates (Figure S3).
According to the results obtained, Zosuquidar and Mibefradil formed stronger complexes with P-gp compared to Topotecan and Colchicin. The energy of the complex for Zosuquidar was −11.3 kcal/mol, and for Mibefradil—−8.0 kcal/mol. Zosuquidar and Mibefradil bound to the active site not only through hydrophobic interactions but also formed two intermolecular hydrogen bonds with the amino acids of the active site (Figure 6). Zosuquidar was in contact with amino acids Gln 341 and Phe 343; the bond lengths were 3.1 and 3.2 Å, respectively. Mibefradil formed hydrogen bonds with the amino acids Tyr 310 (3.1 Å in length) and Gln 725 (3.0 Å in length). The Topotecan molecule did not form hydrogen bonds with the amino acids of the active site P-gp but was fixed only due to π-π contacts and non-polar interactions. The Colchicin molecule formed a hydrogen bond 2.8 Å long with the amino acid Gln 725. For Topotecan and Colchicin, the ∆G value was −7.6 and −7.2 kcal/mol, respectively.
According to the results of molecular docking, Salubrinal and all its analogues under study were superior to Topotecan and Colchicin in terms of the strength of the complex formed with P-gp (∆G from −8.0 to −10.6 kcal/mol). Most of them were superior to Mibefradil, except for compound S7, for which ∆G was also −8.0 kcal/mol. At the same time, S1S55 compounds were inferior to Zosuquidar. The strongest complexes with P-gp formed compounds containing the naphtholine ring: N-(2,2,2-trichloro-1-(3-(quinolin-8-yl)thioureido)ethyl)-2-naphthamide (S52) (∆G = −10.6 kcal/mol), N-(2,2,2-trichloro-1-(3-(naphthalen-1-yl)thioureido)ethyl)cinnamamide (S3) (∆G = −10.2 kcal/mol) and N-(2,2,2-trichloro-1-(3-(naphthalen-2-yl)thioureido)ethyl)cinnamamide (S4) (∆G = −10.2 kcal/mol). The molecule of compound S52 was additionally fixed in the active site due to intermolecular hydrogen bonds with the amino acids Tyr 310 and Gln 990, the bond lengths were 3.3 and 3.1 Å, respectively (Figure 7). The molecule of compound S3 formed three hydrogen bonds with the amino acids of the active site, two of which, 3.0 and 3.3 Å long, with the amino acid Gln 990, and one, 3.2 Å long, with the amino acid Gln 725. The S4 molecule did not form intermolecular hydrogen bonds but was fixed due to π-π contacts and hydrophobic interactions. When docked, Salubrinal (S1) showed average results, ∆G = −9.3 kcal/mol. The Salubrinal molecule in the active site P-gp formed two hydrogen bonds with the amino acid Gln 990, 3.0, and 3.1 Å in length.
Based on our results, the S1S55 compounds are potential inhibitors of P-gp. As P-gp is a factor in the development of multiple drug resistance of cancer cells to chemotherapeutic agents [170,171], further research in this area will be very promising. It is likely that the mechanism of action of Salubrinal in combination therapy for cancer may be associated not only with inhibition of GADD34: PP1 but also P-gp.

3.2. Distribution

3.2.1. Volume of Distribution

According to the results of the forecast carried out in ADMETLab for 53 studied compounds, Vdss has a low value (˂0.6 L/kg) and only for compounds S38 and S40—an average value (0.6 ˂ Vdss ˂ 5.0 L/kg) (Table S8). The pkCSM online server predicts a low Vdss value for nine compounds (S5S7, S20S22, S32, S34, and S41), and an average value for the remaining 46 compounds. Even though ADMETLab and pkCSM use the same database compiled by R.S. Obach et al. [122], the forecast results correlate very poorly with each other, R2 = 0.58 (Figure S4). This is probably due to the use of various descriptors. In both cases, the highest value of the volume of distribution is predicted for compounds S38 and S40 containing the piperidine and piperazine cycles. Vdss is 0.711 (2.506) and 0.845 (3.141) L/kg, respectively. For Salubrinal Vdss is significantly lower—0.418 (1.327) L/kg, and for Sal 003 (S27) even lower values are predicted—0.366 (0.873) L/kg.

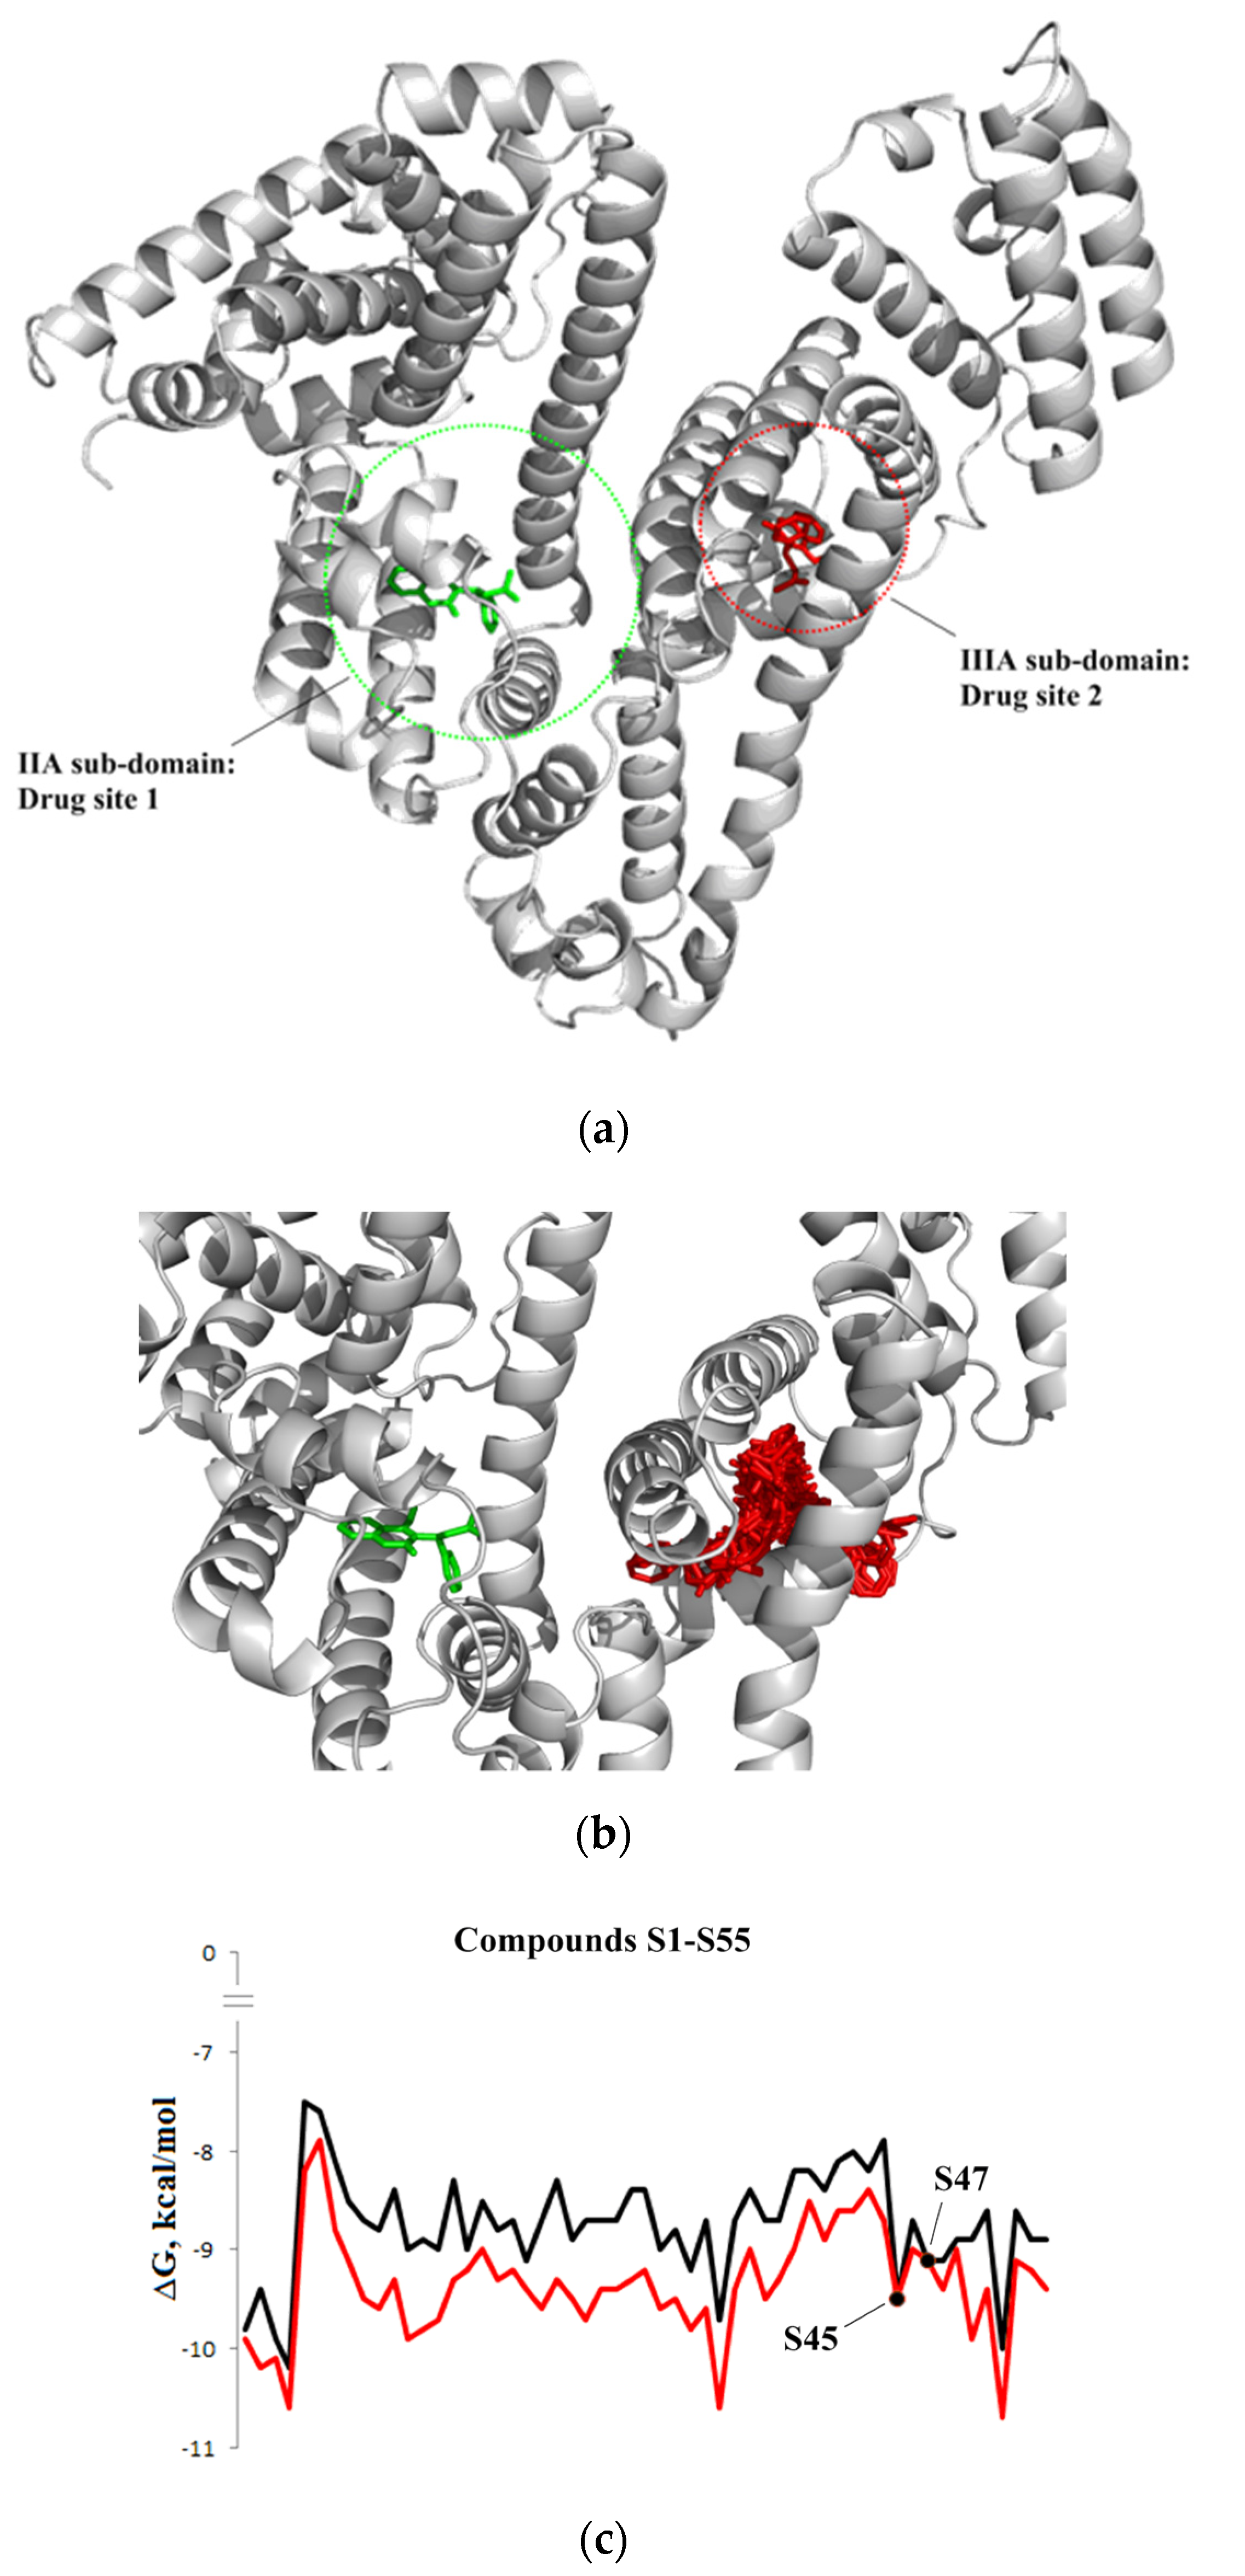
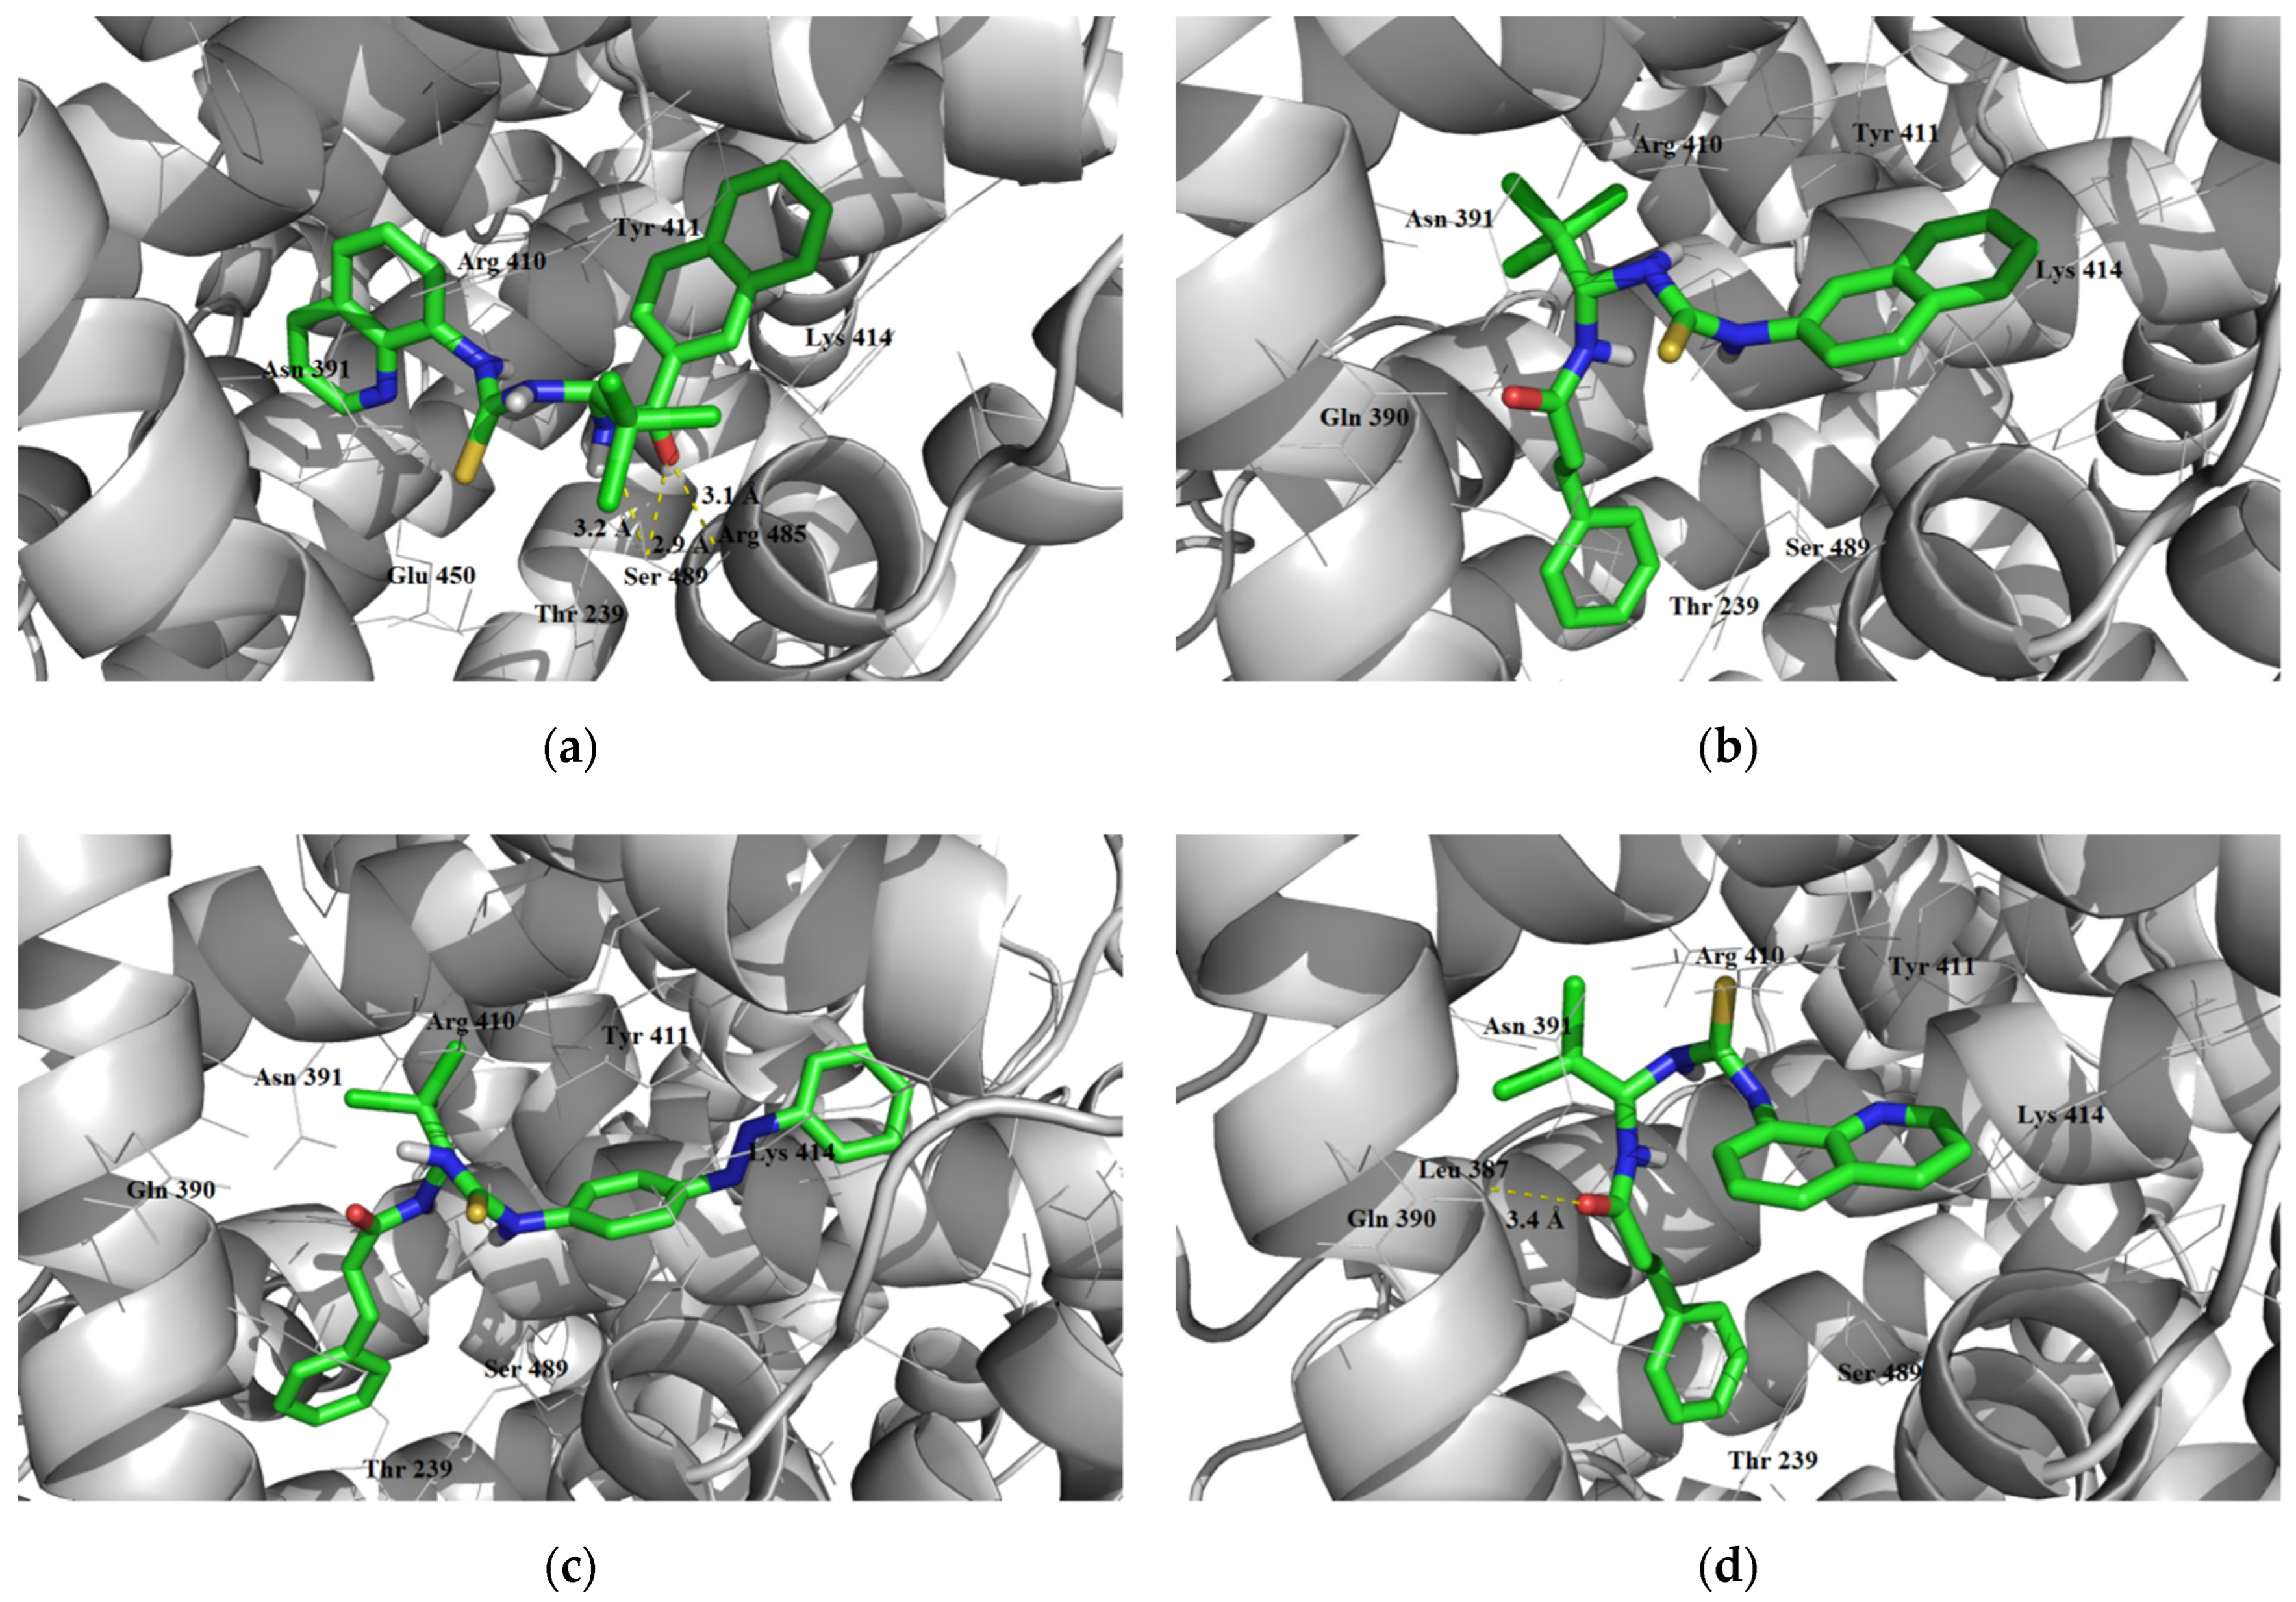
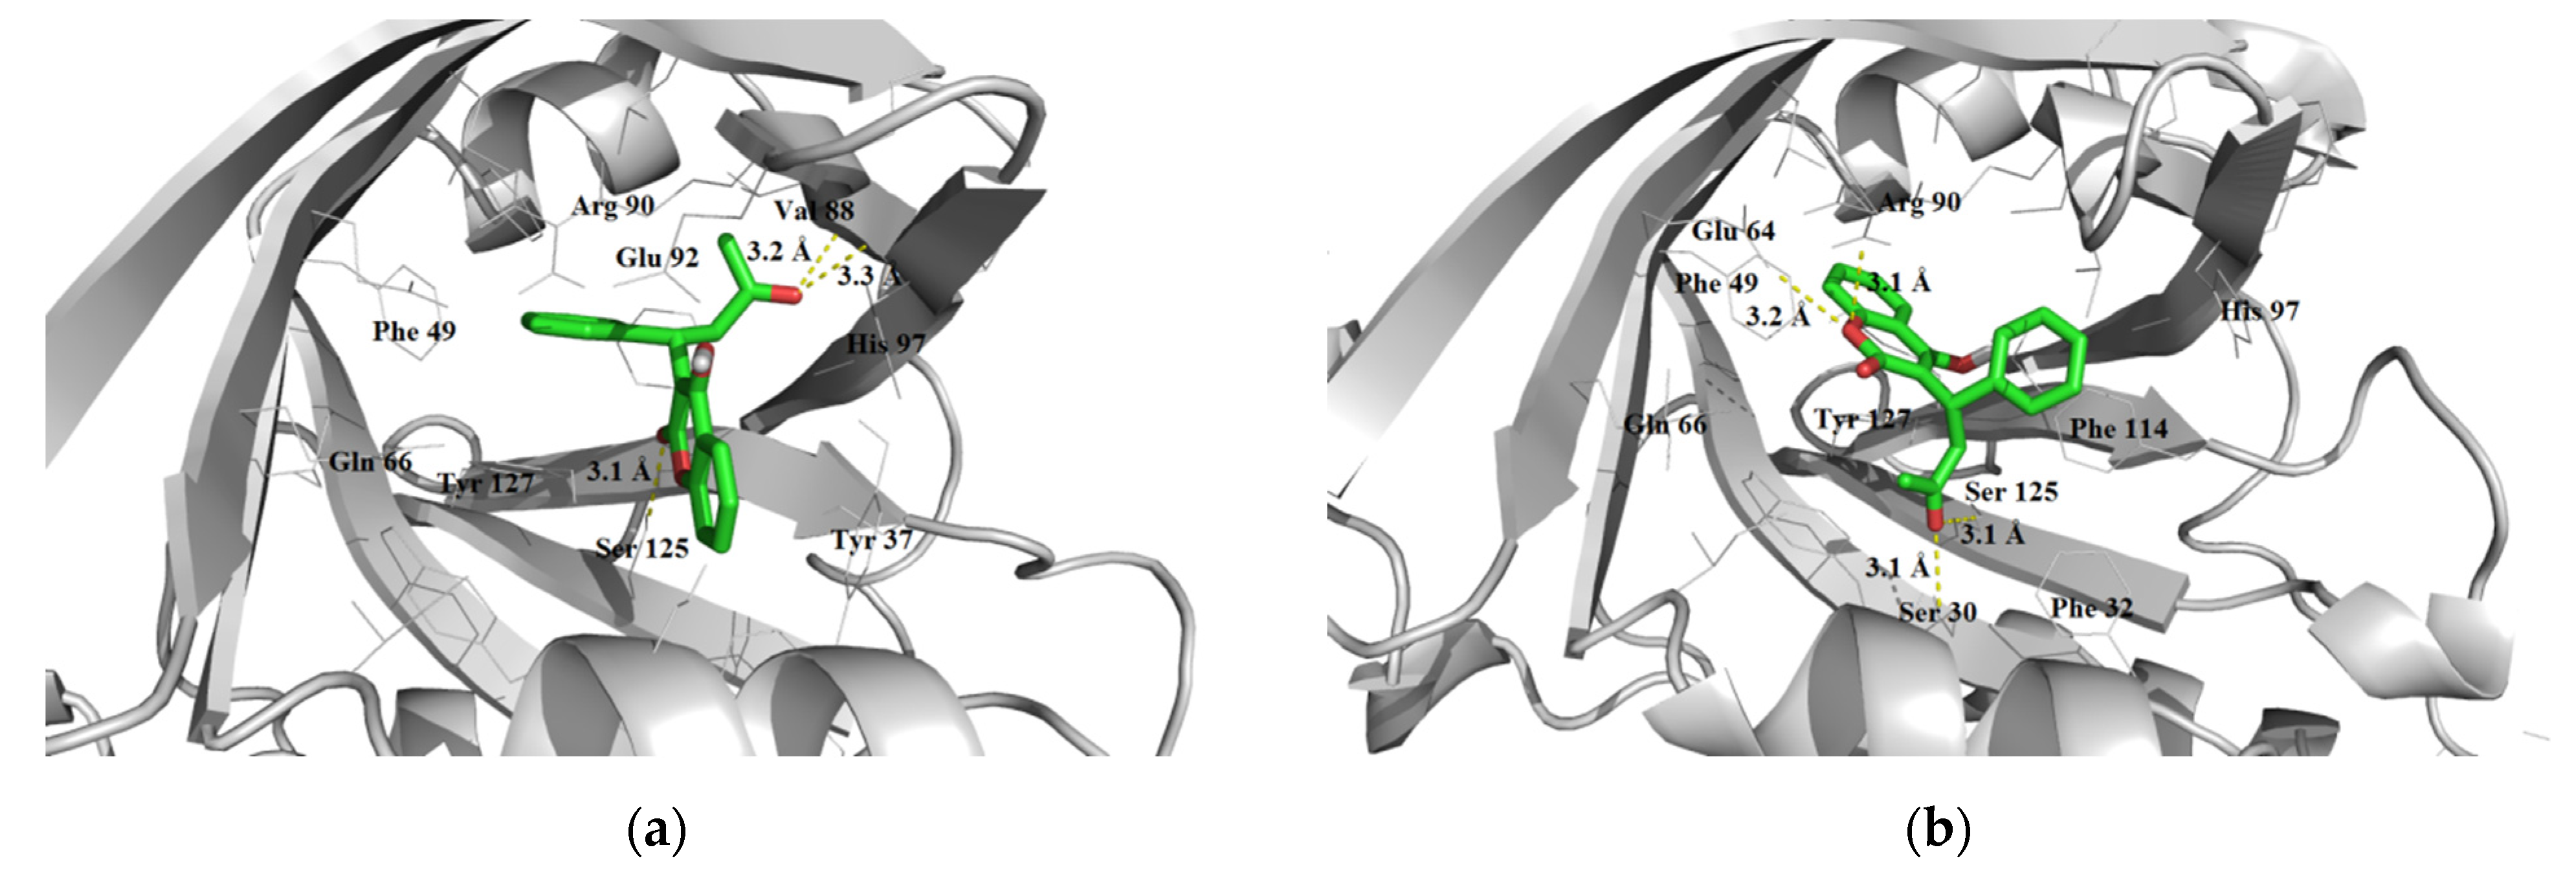
3.2.2. Blood Plasma Protein Binding

Plasma protein binding is an important criterion in the development of new drugs. Only the free form of the drug can overcome biological barriers and have a pharmacological effect. According to the results of in silico evaluation carried out in ADMETLab, all studied compounds effectively bind to blood plasma proteins. The proportion of the bound fraction of the drug (fb) was 73.8–96.2%. The forecast results in admetSAR 2.0 are radically opposite, the fb value was about 1%. Due to the ambiguity of the results obtained, we carried out molecular docking studies of the S1S55 structures with blood plasma proteins, which play a major role in drug binding.
We selected human serum albumin (HSA) and alpha-1-acid glycoprotein (AGP) structures as potential targets. HSA predominantly binds acidic molecules, while AGP is mainly involved in the binding of basic drugs [131]. Most drugs are capable of binding to both proteins with varying degrees of affinity [172]. We took Warfarin (Figure S5) as a reference drug, which is known to bind to both targets [173].
According to the results of molecular docking, Warfarin was effectively bound to its active site in the HSA (drug site 1), which was located in the IIA sub-domain [174]. The energy of the complex was −9.3 kcal/mol. For comparison, we also docked to site 2, located in the IIIA sub-domain. As expected, in this case, the ∆G value was lower and amounted to −8.9 kcal/mol (Figure 8a). When Salubrinal and its analogues docked with site 1, seven compounds (≈13%) surpassed Warfarin in the strength of the formed complex with HSA (Table S8). However, according to calculations, Salubrinal and all its analogues bound more efficiently, not to the Warfarin active site, but to site 2 (Figure 8b,c). The exceptions were the S45 and S47 compounds, which, when coupled with both sites, gave the same ∆G values equal to −9.5 and −9.1 kcal/mol, respectively. If we do not take into account the position of the binding site on the protein molecule, and take only the energy of the formed complex as a criterion, then Warfarin is inferior to 28 out of 55 analyzed compounds (≈51%), with six more compounds having the same ∆G value. The strongest complexes with HSA formed compounds containing substituents with several aromatic rings—N-(2,2,2-trichloro-1-(3-(quinolin-8-yl)thioureido)ethyl)-2-naphthamide (S52), N-(2,2,2-trichloro-1-(3-(naphthalen-2-yl)thioureido)ethyl)cinnamamide (S4) and N-(2,2,2-trichloro-1-(3-(4-((E)-phenyldiazenyl)phenyl)thioureido)ethyl)cinnamamide (S33) (Figure 9). Apparently, non-polar interactions played a primary role in the interaction with active site 2. Of the three compounds forming the strongest complexes with HSA, the presence of intermolecular hydrogen bonds was characteristic only for S52. The S52 molecule was additionally fixed in the active site 2 through three hydrogen bonds, two of which were formed with the hydroxyl group of the amino acid Ser 489 (2.9 and 3.2 Å long) and one with the oxygen atom of the peptide bond formed by the amino acid Arg 485. For S52, the value of ∆G was −10.7 kcal/mol. For S4 and S33, the ∆G values were equal and amounted to −10.6 kcal/mol. In this case, both S4 and S33 did not form intermolecular hydrogen bonds with the amino acids of the active site at all. For comparison, Salubrinal formed one hydrogen bond with the oxygen atom of the peptide bond of amino acid Leu 387. The bond length was 3.4 Å. However, at the same time, ∆G was lower than for the S4 and S33 compounds and amounted to −9.9 kcal/mol.
Taking into account the fact that in human blood plasma AGP is represented by two main genetic variants—A and F1*S, we carried out molecular docking with the protein structures of both variants. Warfarin formed a more durable complex with the structure of the AGP A variant than the F1*S. In the first case, ∆G was −9.1 kcal/mol, and in the second it was −8.7 kcal/mol. It is noteworthy that when docked with the structure of the A variant, the Warfarin molecule formed three intermolecular hydrogen bonds, and with the F1*S variant—four bonds (Figure 10). In the case of the A variant, hydrogen bonds were formed with the participation of the hydroxyl group Ser 125 (bond length 3.1 Å) and with the oxygen atoms of the peptide bonds of amino acids Val 88 (bond length 3.2 Å) and His 97 (bond length 3.3 Å). Among the amino acids of the active site of the F1*S variant, Ser 30, Ser 125, Arg 90 (bond lengths of about 3.1 Å), and Glu 64 (bond length 3.2 Å) participated in the binding of the Warfarin molecule through hydrogen bonds.
According to molecular docking results, Salubrinal formed a stronger complex with the A variant structure (Figure 11a). The ∆G value was −9.9 kcal/mol, while for the F1*S variant it was −9.5 kcal/mol. The Salubrinal molecule was additionally fixed in the active site through the formation of two hydrogen bonds with the Tyr 127 hydroxyl group, bond lengths 2.9 and 3.0 Å. Among the considered analogues of Salubrinal, some substances were more efficiently docked with both the AGP A variant and the F1*S variant (Table S8). In general, we can conclude that this is a purely individual feature of each compound. It should be noted, however, that compounds containing the quinoline ring predominantly formed stronger complexes with the AGP A variant, whereas compounds without this cycle formed stronger complexes with the F1*S variant (Figure 11b). In this case, out of 17 compounds containing the quinoline ring (S1, S2, S41S55), only two (S2 and S52) interacted predominantly with the structure of the F1*S variant, and the rest interacted with the structure of the A variant. In turn, of the 38 remaining compounds that did not contain the quinoline ring, only five formed more stable complexes with the A variant, and 32 did with the F1*S variant. Compound S38 was an exception. When coupled with the structures of both variants, it gave the same ∆G values equal to −8.8 kcal/mol. The formation of predominantly more stable complexes between substances containing the quinoline ring and the active site of the AGP A variant was most likely associated with the predominant contribution of polar interactions. The presence of a nitrogen atom of the piridine type in the quinoline ring accompanied the formation of an additional intermolecular hydrogen bond with the hydroxyl group of the amino acid Tyr 127. When docking with the active site of the AGP F1*S variant, nonpolar interactions played the main role. For example, if the quinoline ring in the Salubrinal structure was replaced by a naphthalene one (compound S3), then the interaction with the AGP F1*S variant would be preferable (∆G = −9.8 kcal/mol) than with the A variant (∆G = −8.9 kcal/mol). The replacement of the cinnamic acid residue in Salubrinal with a more bulky and lipophilic naphtholine cycle (S52) also accompanied the formation of a more stable complex with the F1*S variant (∆G = −10.3 kcal/mol) than with the A variant (∆G = −10.0 kcal/mol). In the case of compound S2, in which the quinoline ring was linked to the thiourea fragment through the C7 atom rather than C8, as in Salubrinal, the formation of an intermolecular hydrogen bond between the nitrogen atom of the quinoline ring and Tyr 127 became spatially impossible, and therefore non-polar interactions occurred.
Among the Salubrinal analogues studied with an active site of the AGP A variant, the most stable complexes were formed by S48, S47, and S49, and with the F1*S variant—by S52, S4, and S49 (Figure 12). For S48, ∆G of the complex with the structure of the A variant was 10.8 kcal/mol, while for S47 and S49, the ∆G values were equal and amounted to −10.6 kcal/mol. The analysis of the results of molecular docking showed that polar contacts played a significant role in the interaction of the studied compounds with the structure of the AGP A variant. For example, the S48 molecule was fixed in the active site of the AGP A variant through three intermolecular hydrogen bonds, two of which were formed with Tyr 127 (bond lengths 2.9 and 3.1 Å), and one was formed with Glu 92 (bond length 3.6 Å). The S47 molecule also formed a hydrogen bond with Tyr 127 (bond length 2.9 Å) and one more with Ser 125 (bond length 3.3 Å). S49 was characterized by the formation of four hydrogen bonds, two of which with Tyr 127, bond lengths 2.8 and 2.9 Å, and two more—with amino acids Ser 40 and Ser 125, bond lengths 3.1 and 3.3 Å, respectively. In turn, interactions with the active site of the AGP F1*S variant were predominantly non-polar. For example, the S52 molecule in the active site formed only one hydrogen bond with Glu 64, 2.9 Å long (∆G = −10.3 kcal/mol). The S4 molecule interacted with the amino acids of the active site of the AGP F1*S variant only through non-polar contacts (∆G = −10.3 kcal/mol). The S49 compound formed one of the strongest complexes not only with the A structure but also with the AGP F1*S variant (∆G = −9.9 kcal/mol). At the same time, Figure 12 clearly shows how the orientation of the molecule changes in the active sites of these structures. So, in the case of the A variant, the molecule is focused on the formation of the maximum number (four) hydrogen bonds, and in the case of the F1*S variant, on lipophilic interactions with the residues of Phe 32, Phe 49, Phe 114 and other amino acids. At the same time, in the active site of the F1*S variant, S49 formed only one intermolecular bond with Tyr 127, bond length 2.9 Å.
The results obtained indicate that the S1S55 compounds can bind rather effectively to blood plasma proteins. However, taking into account the literature data on the high biological activity of Salubrinal and some of its analogues in vivo [61,62,63], it can be concluded that either the fraction of the unbound form is sufficient to provide a pharmacological effect, or the binding to proteins is reversible.

3.2.3. Overcoming the Blood–Brain Barrier

The ability of drugs to cross the BBB is a very important pharmacokinetic indicator. Only substances that have overcome the BBB can affect the physiological processes occurring in the brain. Salubrinal and Sal 003 are widely used in experimental medicine in the study of brain diseases and their treatment [33,175,176,177]. Considering this fact, the ability to cross the BBB seems to be a very desirable property for the Salubrinal analogues under study. According to the results of in silico assessment carried out in ADMETLab and admetSAR 2.0, all studied compounds can cross the BBB with a probability of 0.719–0.992 and 0.972–0.981, respectively. The online server pkCSM predicts LogBB to be less than −1.0 for 15 studied compounds, i.e., these substances will have difficult crossing the BBB. For the remaining 40 compounds, moderate BBB crossing is predicted (0.3 ˂ LogBB ˃ −1.0). The calculated LogBB values for Salubrinal and Sal 003 were −0.063 and 0.014, respectively. Based on the results obtained and the available literature data, it can be concluded that the substances under study are predominantly capable of crossing the BBB.

3.3. Metabolism

3.3.1. Inhibitory Activity

Enzymes of the P450 family through oxidation reactions take part in the metabolism of most known drugs [143,178]. The results of in silico evaluation of the inhibition of the five main P450 isoforms (CYP1A2, CYP2C9, CYP2C19, CYP2D6, and CYP3A4) by Salubrinal and its analogues using the online servers ADMETLab, admetSAR 2.0, pkCSM, SwissADME, and SuperCYPsPred turned out to be very ambiguous (Tables S9–S13). In this regard, we carried out molecular docking studies of the S1S55 compounds with X-ray structures of the five main P450 isoforms. When carrying out molecular docking, we used known P450 inhibitors—E1E13 (Table S14) as reference compounds. They were selected from the admetSAR database, which is currently one of the most extensive (contains over 24700 inhibitor/non-inhibitor and CYP substrates/non-substrates structures). The E1E13 compounds have a high degree of similarity with the studied compounds, contain a trichloroethylcarboxamide fragment, and some (E1E4) also contain a thiourea fragment. It is noteworthy that among the selected reference compounds was Sal 003 (S27), which in this case was assigned the E1 cipher.

Inhibition of CYP1A2

CYP1A2 is responsible for the biotransformation of approximately 8.9% of drugs to be metabolized in the liver [143]. The online server ADMETLab predicted inhibition in CYP1A2 for 52 out of 55 analyzed compounds with a probability of 0.524–0.978. The exceptions were compounds S37, S39, and S40 containing sulfolane, morpholine, and piperazine rings in the thiourea fragment. According to the prediction results in admetSAR 2.0, 47 compounds were potential inhibitors of CYP1A2, and the probability value was 0.537–0.929. At the same time, the prediction results in ADMETLab and admetSAR 2.0 were quite well compared, so if admetSAR 2.0 did not predict inhibitory activity for compounds S5, S20, S21, and S34, then ADMETLab gave these compounds only a small probability of this activity (0.524–0.690). The only exception was compound S16, which was classified by ADMETLab with a high probability (0.906) as a CYP1A2 inhibitor, and admetSAR 2.0 was classified as a non-inhibitor (probability 0.500). The rest of the online servers gave less unambiguous results, as pkCSM classified 26 out of 55 studied compounds as CYP1A2 inhibitors, SwissADME—36 compounds, and SuperCYPsPred using MACCS fingerprints—1 compound and using Morgan fingerprint—11 compounds.
Among the reference compounds, CYP1A2 inhibitors were E1, E3E8, E10E13, for compounds E2 and E9 no inhibitory activity was observed, or the AC50 value was more than 10 µ. Molecular docking results with these compounds were in very good agreement with experimental data (Figure 13a), the R2 value was 0.80. Of the 55 analyzed structural analogues of Salubrinal, the strongest complexes with the active site CYP1A2 formed Sal 003 (S27), S43, S42, and S48. Sal 003 and S43 formed complexes with a binding energy of −9.8 kcal/mol (Figure 13b,c), while S42 and S48 formed complexes with −9.0 kcal/mol (Figure 13d,e). The calculated pAC50 value for these compounds was 5.2 and 4.8, respectively. Salubrinal with an active site CYP1A2 formed a very weak complex, ∆G = −5.9 kcal/mol, which corresponded to a pAC50 value of 3.0 (Figure 13f). Apparently, nonpolar contacts played the primary role in the interaction with the active site of CYP1A2, which was also observed for other compounds [179,180,181,182]. Of the four hit compounds, only Sal 003 and S42 formed one hydrogen bond each with the amino acids of the active site. Sal 003 formed a hydrogen bond with Asp 320 (bond length 3.1 Å) and S42 formed a hydrogen bond with Gly 316 (bond length 3.0 Å). The rest of the compounds were fixed in the active site of CYP1A2 only through lipophilic interactions.

Inhibition of CYP2C9

Under the action of the CYP2C9 enzyme, approximately 12.8% of drugs subject to biotransformation in the liver are metabolized [143]. According to the prediction results in ADMETLab, 54 out of 55 analyzed compounds were inhibitors of CYP2C9 with a probability of 0.551–0.969. The only exception was compound S37 containing the sulfolane ring. Online server admetSAR 2.0 predicted the ability to inhibit CYP2C9 for 50 compounds, the value of the prediction probability was 0.509–0.933. The exception was also the S37 compound and the S38S40 compounds containing piperidine, morpholine, and piperazine rings in the thiourea fragment. In addition, the absence of inhibitory activity was predicted for S34 containing phenylsulfonamide fragment. It was in the case of this compound that the most significant contradictions arose in the results of the forecasts carried out in ADMETLab and admetSAR 2.0. ADMETLab for S34 predicted inhibitory activity with a probability of 0.883, and admetSAR 2.0 predicted its absence with a probability of 0.714. The forecast results in ADMETLab, admetSAR 2.0, pkCSM, and SwissADME were very well comparable. pkCSM classified 43 out of 55 studied compounds as CYP2C9 inhibitors, SwissADME—all 55. At the same time, the results obtained with SuperCYPsPred were controversial. When using MACCS fingerprints, inhibitory activity was predicted for 47 compounds (probability 0.503–0.690); while using Morgan fingerprints, this activity was not predicted for any compound.
All selected reference compounds were inhibitors of CYP2C9, with the only exception being compound E3, for which there was no information on this activity. Molecular docking results for the remaining compounds correlated well with the experimental pAC50 value, the R2 value was 0.82 (Figure 14a). In the docking of S1S55 structures with the active site of CYP2C9, the main role was played by non-polar interactions, which was observed earlier in the docking of other compounds with this enzyme [181,183,184,185]. According to the results of molecular docking, the strongest complexes with this enzyme were formed by S3, S4, Salubrinal (S1), S2, and Sal 003 (S27, E1). The binding energy for these compounds ranged from −9.8 to −10.6 kcal/mol, which corresponded to the pAC50 value of 6.3–6.8. None of the hit compounds were characterized by the formation of intermolecular hydrogen bonds with the amino acids of the active site (Figure 14b–f). Amino acids with non-polar radicals—Val 113, Phe 114, Phe 476, etc., were of paramount importance in ligand binding.

Inhibition of CYP2C19

CYP2C19 is responsible for the biotransformation of approximately 6.8% of drugs that are metabolized in the liver [143]. According to the prediction results in ADMETLab, out of 55 analyzed compounds, 52, with a probability of 0.541–0.961, were potential inhibitors of CYP2C19. The exceptions were the S20 and S21 compounds containing a benzoic acid residue, as well as compound S37. admetSAR 2.0, with a probability of 0.530–0.913, predicted the presence of inhibitory activity in 50 compounds. There were no significant contradictions between the forecast results in ADMETLab and admetSAR 2.0. Although admetSAR 2.0 predicted the absence of inhibitory activity for the S5 and S34 compounds, ADMETLab predicted its presence with an extremely low probability—0.556 and 0.541, respectively. The rest of the online servers also gave very good comparable results, so pkCSM classified 47 out of 55 studied compounds as CYP2C19 inhibitors, SwissADME—54. The exception was the results obtained using the SuperCYPsPred online server, which, when using MACCS fingerprints, did not predict inhibitory activity for any of the studied compounds, and when using fingerprints, Morgan assigned only compound S19 to the CYP2C19 inhibitors. Notably, all online servers, except for ADMETLab, did not predict inhibitory activity for S34.
All selected reference substances E1E13 were CYP2C19 inhibitors. The results of their molecular docking with the active site of this enzyme were in very good agreement with the experimental data, R2 = 0.93 (Figure 15a). When interacting with the active site of CYP2C19, not only were lipophilic interactions important, so too were polar contacts. For example, Sal 003 (S27, E1) with the amino acid Asp 293 formed two intermolecular hydrogen bonds, 3.1 and 3.2 Å in length (Figure 15b). The ∆G value was −8.2 kcal/mol, which corresponded to the calculated pAC50 = 5.6. Of the 55 compounds analyzed, the strongest complexes with the active site CYP2C19 were formed by S52, S48, S46, and S31. The S52 compound was additionally fixed in the active site by one hydrogen bond with Asp 293, 3.1 Å in length (Figure 15c), and formed a complex with a binding energy of −11.0 kcal/mol (pAC50 = 7.3). S48 was characterized by the formation of three intermolecular bonds, one with Asp 293 (bond length 3.4 Å) and two with the amino acid Gly 296, 2.9, and 3.1 Å in length (Figure 15d). The energy of the complex was −10.6 kcal/mol (pAC50 = 7.0). The S46 and S31 compounds formed complexes with CYP2C19 with ∆G = −10.3 kcal/mol. In this case, S46 formed three hydrogen bonds with the amino acids of the active center, and S31—two bonds. In both cases, the interactions involved the amino acids Asp 293 and Gly 296. With Asp 293, the S46 and S31 compounds formed one hydrogen bond each (bond lengths 3.4 and 3.3 Å), respectively. With the amino acid Gly 296, the S46 compound formed two hydrogen bonds, 3.1 and 3.2 Å in length, and the S31 compound -only one, 3.1 Å in length (Figure 15e,f). A detailed analysis of the orientation of the molecules of the studied compounds in the active site of CYP2C19 indicated a large number of lipophilic contacts with Phe 100, Val 113, Phe 114, Phe 476, and other amino acids. This was observed earlier when other compounds were docked with this enzyme [186,187,188,189].

Inhibition of CYP2D6

By means of CYP2D6 biotransformation is subject to approximately 20% of drugs that are metabolized in the liver [143]. The online server ADMETLab, with a very low probability (0.500–0.660), predicted the ability to inhibit CYP2D6 for 14 out of 55 compounds studied. admetSAR 2.0 predicted the presence of this activity in 16 compounds. In this case, the probability value was 0.510–0.893. At the same time, there were no significant contradictions between the forecast results in ADMETLab and admetSAR 2.0. Both online servers predominantly predicted the absence of inhibitory activity in the studied compounds. The greatest contradictions arose in the case of structures S3, S11, and S25, for which ADMETLab, with a probability of 0.388–0.445, predicted the absence of this activity, and admetSAR 2.0, with a probability of 0.635–0.789, predicted its presence. The rest of the online servers also predominantly indicated that the S1S55 compounds could not inhibit CYP2D6. For example, pkCSM classified nine out of fifty-five studied compounds as CYP2D6 inhibitors, SwissADME—twelve compounds. The online server SuperCYPsPred, using MACCS fingerprints, predicted inhibitory activity for five compounds (probability 0.505–0.563) and using Morgan fingerprints classified only compounds as CYP2D6 inhibitors S38 and S40, with a probability of 0.535 and 0.552, respectively.
Of the thirteen selected reference compounds, only seven were CYP2D6 inhibitors: E1E4, E6, E7, and E11. For the rest of the compounds, no inhibitory activity was observed, or the AC50 value was more than 10 µ. Molecular docking results with these compounds were in very good agreement with experimental data (Figure 16a), and the R2 value was 0.78. Of the 55 analyzed compounds, S1, S52, S3, and S48 formed the strongest complexes with the active site CYP2D6. An analysis of the orientation of the molecules of the studied compounds in the active site of CYP2D6 indicated an essential role of polar contacts with the amino acids Glu 216, Asp 301, and Ser 304 [190]. For example, Sal 003 (S27, E1) formed three intermolecular hydrogen bonds with the amino acids of the active site. Two bonds, 3.2 Å long, were formed with Glu 216 and Ser 304, and the third with the amino acid Asp 301, 3.5 Å long (Figure 16b). The ∆G value was −10.0 kcal/mol, which corresponded to the calculated pAC50 = 5.2. The strongest complexes with the active site CYP2D6 formed Salubrinal (S1) and S52, ∆G = −11.8 ka/mol, which corresponded to a pAC50 value of 7.2. Salubrinal was additionally fixed in the active site due to four intermolecular hydrogen bonds, three of which, 3.0–3.2 Å long, were formed with the Ser 304 residue and one more—with Asp 301, bond length was 2.8 Å (Figure 16c). S52 was characterized by the formation of three intermolecular bonds, all with the participation of Asp 301 (bond lengths were 2.9 and 3.3 Å). The S3 and S48 compounds formed complexes with the active site CYP2D6 with a binding energy of −11.5 kcal/mol (pAC50 = 6.8). In this case, S3 was additionally fixed due to only one hydrogen bond with Asp 301, bond length was 3.5 Å. The S48 compound formed four hydrogen bonds, all with Asp 301. Two bonds were 2.9 Å in length and the rest were 3.2 and 3.3 Å. In addition to polar contacts, when the considered compounds interacted with CYP2D6, lipophilic interactions with Phe 58, Phe 112, Phe 120, Phe 247, Phe 483, and other amino acids also occurred. These amino acids seemed to also control the orientation of the aromatic rings of these ligands in the enzyme cavity. The active participation of Glu 216, Asp 301, Ser 304, and the considered amino acids with nonpolar radicals was observed earlier in the molecular docking of other compounds with CYP2D6 [190,191,192,193].

Inhibition of CYP3A4

CYP3A4 is the most clinically significant member of the cytochrome family. It participates in the metabolism of 30.2% of drugs that are metabolized in the liver [143]. According to the prediction results, the online server ADMETLab classified 53 compounds out of 55 analyzed ones as potential inhibitors of CYP3A4, and the probability value was 0.544–0.947. The exceptions were the S6 and S41 compounds, containing the residue of the methyl ester of acetic acid and the acetamide fragment, respectively. admetSAR 2.0 predicted the presence of inhibitory activity in 52 compounds with a probability of 0.522–0.921. The exceptions were the S33, S39, and S40 compounds. It is in the case of these compounds, as well as S41, that the most significant contradictions arose between the forecast results in ADMETLab and admetSAR 2.0. The rest of the online servers gave more contradictory results, for example, pkCSM predicted inhibitory activity for 41 out of 55 studied compounds, SwissADME—for 51 compounds. The online server SuperCYPsPred did not predict inhibitory activity for any of the studied compounds using MACCS fingerprints, and when using Morgan fingerprints, only compounds S36 and S54 were assigned to CYP2C19 inhibitors.
All selected reference substances E1E13 were CYP3A4 inhibitors. The ∆G values obtained as a result of molecular docking with the active site of this enzyme correlated very well with the experimental data pAC50, R2 = 0.90 (Figure 17a). When interacting with the active site of CYP3A4, nonpolar interactions played the main role, which was observed in the molecular docking of other compounds with this enzyme [182,194,195,196]. According to the results of molecular docking, the strongest complexes with the active site of CYP3A4 were formed by S3, S47, S31, and S52. The binding energy for these compounds and CYP3A4 ranged from −10.8 to −10.5 kcal/mol, which corresponded to the calculated pAC50 value of about 5.6. For Sal 003 (S27, E1), the ∆G value was slightly lower and amounted to −9.7 kcal/mol (pAC50 = 5.3). None of the studied compounds were characterized by the formation of intermolecular hydrogen bonds with the amino acids of the active site (Figure 17b–f). Amino acids with nonpolar radicals Phe 57, Phe 108, Ile 120, Phe 213, Phe 215, Phe 304, etc., were of paramount importance in ligand binding.

Substrate Activity

For the S1S55 compounds, the ability to inhibit enzymes of the P450 family was predominantly predicted, the role of a substrate was assigned only for some compounds and, as a rule, with a very low probability. For example, ADMETLab classified 38 out of 55 analyzed compounds as CYP1A2 substrates. At the same time, the value of the probability of the forecast accuracy was 0.503–0.690. The same online server classified 35 compounds as CYP2C9 substrates, with a probability of 0.503–0.684. Online server admetSAR 2.0 predicted substrate activity towards this enzyme for six compounds, and the probability value was 0.596–0.809. The role of the substrate of the CYP2C19 enzyme was assigned only to the S40 compound by the online server ADMETLab, probability 0.627. Concerning the CYP2D6 enzyme, ADMETLab predicted substrate activity for three compounds, the probability was 0.507–0.584, pkCSM—for 36 compounds, and admetSAR 2.0 did not predict this type of activity for any compound. Substrate activity towards CYP3A4 was predicted by ADMETLab for 21 compounds (probability 0.504–0.732), admetSAR 2.0—for 51 compounds (probability 0.500–0.623), and pkCSM—for all 55 compounds.
Based on the obtained SAR prediction results, as well as molecular docking data, it can be concluded that the analyzed compounds are likely to behave as inhibitors of cytochrome. At the same time, we do not exclude that the same compound may exhibit inhibitory activity for one isoform of the enzyme and substrate activity for another. Of course, the presence of inhibitory activity can lead to potentiation of the action of other drugs [197,198], especially if we also take into account the potential ability to inhibit P-gp [199,200].

3.4. Elimination

The prediction of the total clearance (CLtot) for the studied compounds was carried out using the online servers ADMETLab and pkCSM (Table S15). The obtained quantitative results of the CLtot values predicted by these servers were very poorly correlated with each other, the R2 value was 0.34 (Figure 18). For example, for Salubrinal and Sal 003, according to ADMETLab, the total clearance values were very close and amounted to 0.780 and 0.781 mL/min/kg, respectively. While the pkCSM for Salubrinal predicted significantly greater clearance compared to Sal 003, CLtot were 0.682 and 0.333 mL/min/kg, respectively. At the same time, both online servers predicted a low CLtot. clearance for all compounds ˂ 5 mL/min/kg. According to the forecast in ADMETLab, the value of CLtot. lay in the range of 0.495–1.108 mL/min/kg, and according to the forecast in pkCSM—in the range of 0.256–1.592 mL/min/kg.
ADMETLab also predicted a low half-life time (T1/2 ˂ 3 h) for all studied compounds. The obtained T1/2 values ranged from 50 min to 2 h. For example, for Salubrinal and Sal 003, the elimination half-lives were 1 h 55 min and 1 h 37 min, respectively.

4. Conclusions

In this work, a complex in silico assessment of the ADME properties of Salubrinal and 54 of its analogues containing a cinnamic acid residue or a quinoline ring was carried out. It has been shown that almost all 55 studied structures comply with Lipinski and Weber’s rules, and good absorption in the gastrointestinal tract is predicted for them. The exceptions are S31 and S50, which do not correspond to Ro 5, as well as S7, which does not meet Weber’s rule. For the studied compounds, the absence of substrate activity for P-gp has been predicted. The question of whether the studied compounds are capable of inhibiting this transporter remains open. However, the results of molecular docking and, in part, SAR predictions indicate the potential presence of this property.
Salubrinal and its analogues are predicted to have from low to moderate Vdss value and the ability to cross the blood–brain barrier. The results of SAR predictions regarding the ability of the studied compounds to bind to blood plasma proteins are ambiguous. However, the results of molecular docking have indicated very effective binding to human serum albumin (HSA) and alpha-1-acid glycoprotein (AGP). In addition, low total clearance (CLtot.) and elimination half-life time (T1/2) have been predicted for all compounds studied.
For the considered compounds, the ability to inhibit the activity of liver microsomal enzymes of the P450 family has been predicted. This fact is also indicated by the results of molecular docking. In this case, the substrate activity concerning P450 for these compounds, if predicted, is with an extremely low probability.
Considering all of the above, out of 55 studied structures, we do not recommend three of them, S7, S31, and S50, for in vitro and in vivo studies, since they are likely to be poorly absorbed in the gastrointestinal tract. The remaining 52 compounds have successfully passed the stage of in silico testing of ADME properties and can be recommended for further research. It should be noted that it is necessary to pay special attention to their testing for the ability to inhibit P-gp, CYP1A2, CYP2C9, CYP2C19, CYP2D6, and CYP3A4, as well as to bind to blood plasma proteins.

Supplementary Materials

The following supporting information can be downloaded at: https://www.mdpi.com/article/10.3390/futurepharmacol2020013/s1, Figure S1: Correlation of the LogP values for Salubrinal and its analogues calculated by different methods. Figure S2: Correlation of the LogP values for Salubrinal and its analogues calculated by different methods with LogPConsensus. Figure S3: Zosuquidar, Mibefradil, Topotecan, and Colchicin structures optimized using the semi-empirical PM3 method in the ArgusLab 4.0.1 software package. Figure S4: Correlation of the Vdss values for Salubrinal and its analogues calculated using online servers pkCSM and ADMETLab. Figure S5: Warfarin structure optimized using the semi-empirical PM3 method in the ArgusLab 4.0.1 software package. Figure S6: Structures of compounds E2E13 optimized by the PM3 method in the ArgusLab 4.0.1 software package. Table S1: Structures of Salubrinal analogues containing a cinnamic acid residue. Table S2: Structures of Salubrinal analogues containing quinoline ring. Table S3: List of online servers used in the work. Table S4: Prediction results of the absorption of Salubrinal and its analogues in the human intestine. Table S5: Lipophilicity (LogPo/w) prediction results for Salubrinal and its analogues using various online servers. Table S6: Calculation results of 2D PSA and 3D PSA by different methods. Table S7: Prediction results of the inhibitory and substrate activity of Salubrinal and its analogues concerning the transmembrane transporter P-gp. Table S8: Results of in silico analysis of the distribution of Salubrinal and its analogues in the body. Table S9: Prediction results of the inhibitory and substrate activity of Salubrinal and its analogues concerning the metabolic enzyme CYP1A2. Table S10: Prediction results of the inhibitory and substrate activity of Salubrinal and its analogues concerning the metabolic enzyme CYP2C9. Table S11: Prediction results of the inhibitory and substrate activity of Salubrinal and its analogues concerning the metabolic enzyme CYP2C19. Table S12: Prediction results of the inhibitory and substrate activity of Salubrinal and its analogues concerning the metabolic enzyme CYP2D6. Table S13: Prediction results of the inhibitory and substrate activity of Salubrinal and its analogues concerning the metabolic enzyme CYP3A4. Table S14: Molecular docking results for reference compounds E1E13 with enzymes of the P450 family. Table S15: Predicted results of the total clearance (CLtot.) and half-life time (T1/2) for Salubrinal and its analogues.

Author Contributions

P.V.Z.; conceptualization, methodology, writing—original draft, formal analysis, investigation, visualization, project administration. V.V.K.; validation, resources, writing—review and editing. A.V.K.; validation, supervision, writing—review and editing. All authors have read and agreed to the published version of the manuscript.

Funding

This research received no external funding.

Institutional Review Board Statement

Not applicable.

Informed Consent Statement

Not applicable.

Data Availability Statement

Not applicable.

Conflicts of Interest

The author declares no conflict of interest.

Abbreviations

ABCATP-binding cassette;
ADME/Tabsorption, distribution, metabolism, excretion / toxicity;
AGPalpha-1-acid glycoprotein;
ATF4/6activating transcription factor 4/6;
BBBblood–brain barrier;
BOILED-EggBrain Or IntestinaL EstimateD;
CNScentral nervous system;
CYPcytochrome P450;
eIF2αeukaryotic translation initiation factor 2α;
ERendoplasmic reticulum;
GITgastrointestinal tract;
HIAhuman intestinal absorption;
HSAhuman serum albumin;
MACCSmolecular ACCess system;
P-gpP-glycoprotein;
(Q)SAR(quantitative) structure-activity relationship;
RFrandom forest;
Ro 5Lipinski’s rule or rule of 5;
SVMsupport vector machine;
(T)PSA(topological) polar surface area.

References

  1. Wouters, O.J.; McKee, M.; Luyten, J. Estimated Research and Development Investment Needed to Bring a New Medicine to Market, 2009–2018. JAMA 2020, 323, 844–853. [Google Scholar] [CrossRef] [PubMed]
  2. DiMasi, J.A.; Grabowski, H.G.; Hansen, R.W. Innovation in the pharmaceutical industry: New estimates of R&D costs. J. Health Econ. 2016, 47, 20–33. [Google Scholar] [CrossRef] [PubMed] [Green Version]
  3. Prasad, V.; Mailankody, S. Research and Development Spending to Bring a Single Cancer Drug to Market and Revenues after Approval. JAMA Intern. Med. 2017, 177, 1569–1575. [Google Scholar] [CrossRef] [PubMed]
  4. Khanna, I. Drug discovery in pharmaceutical industry: Productivity challenges and trends. Drug Discov. Today 2012, 17, 1088–10102. [Google Scholar] [CrossRef] [PubMed]
  5. Waring, M.J.; Arrowsmith, J.; Leach, A.R.; Leeson, P.D.; Mandrell, S.; Owen, R.M.; Pairaudeau, G.; Pennie, W.D.; Pickett, S.D.; Wang, J.; et al. An analysis of the attrition of drug candidates from four major pharmaceutical companies. Nat. Rev. Drug Discov. 2015, 14, 475–486. [Google Scholar] [CrossRef]
  6. Basavaraj, S.; Betageri, G.V. Can formulation and drug delivery reduce attrition during drug discovery and development—Review of feasibility, benefits and challenges. Acta Pharm. Sin. B 2014, 4, 3–17. [Google Scholar] [CrossRef] [Green Version]
  7. Shou, W.Z. Current status and future directions of high-throughput ADME screening in drug discovery. J. Pharm. Anal. 2020, 10, 201–208. [Google Scholar] [CrossRef]
  8. Pellegatti, M. The debate on animal ADME studies in drug development: An update. Expert Opin. Drug Metab. Toxicol. 2014, 10, 1615–1620. [Google Scholar] [CrossRef]
  9. Van Norman, G.A. Limitations of Animal Studies for Predicting Toxicity in Clinical Trials: Is it Time to Rethink Our Current Approach? JACC Basic Transl. Sci. 2019, 4, 845–854. [Google Scholar] [CrossRef]
  10. Aysha, A. The Flaws and Human Harms of Animal Experimentation. Camb. Q. Healthc. Ethics. 2015, 24, 407–419. [Google Scholar] [CrossRef] [Green Version]
  11. Ferdowsian, H.R.; Beck, N. Ethical and Scientific Considerations Regarding Animal Testing and Research. PLoS ONE 2011, 6, e24059. [Google Scholar] [CrossRef] [PubMed] [Green Version]
  12. Kiriiri, G.K.; Njogu, P.M.; Mwangi, A.N. Exploring different approaches to improve the success of drug discovery and development projects: A review. Future J. Pharm. Sci. 2020, 6, 27. [Google Scholar] [CrossRef]
  13. Wang, Y.; Xing, J.; Xu, Y.; Zhou, N.; Peng, J.; Xiong, Z.; Liu, X.; Luo, X.; Luo, C.; Chen, K.; et al. In silico ADME/T modelling for rational drug design. Q. Rev. Biophys. 2015, 48, 488–515. [Google Scholar] [CrossRef] [Green Version]
  14. Zhu, H. Big Data and Artificial Intelligence Modeling for Drug Discovery. Annu. Rev. Pharmacol. Toxicol. 2020, 60, 573–589. [Google Scholar] [CrossRef] [PubMed] [Green Version]
  15. Muratov, E.N.; Bajorath, J.; Sheridan, R.P.; Tetko, I.V.; Filimonov, D.; Poroikov, V.; Oprea, T.I.; Baskin, I.I.; Varnek, A.; Roitberg, A.; et al. QSAR without borders. Chem. Soc. Rev. 2020, 49, 3525–3564. [Google Scholar] [CrossRef]
  16. Kar, S.; Leszczynski, J. Open access in silico tools to predict the ADMET profiling of drug candidates. Expert Opin. Drug Discov. 2020, 15, 1473–1487. [Google Scholar] [CrossRef]
  17. Jia, C.-Y.; Li, J.-Y.; Hao, G.-F.; Yang, G.-F. A drug-likeness toolbox facilitates ADMET study in drug discovery. Drug Discov. Today 2020, 25, 248–258. [Google Scholar] [CrossRef]
  18. Madden, J.C.; Enoch, S.J.; Paini, A.; Cronin, M.T.D. A Review of In Silico Tools as Alternatives to Animal Testing: Principles, Resources and Applications. Altern. Lab. Anim. 2020, 48, 146–172. [Google Scholar] [CrossRef]
  19. Van Norman, G.A. Limitations of Animal Studies for Predicting Toxicity in Clinical Trials: Part 2: Potential Alternatives to the Use of Animals in Preclinical Trials. JACC Basic Transl. Sci. 2020, 5, 387–397. [Google Scholar] [CrossRef]
  20. Matsuoka, M.; Komoike, Y. Experimental Evidence Shows Salubrinal, an eIF2α Dephosphorylation Inhibitor, Reduces Xenotoxicant-Induced Cellular Damage. Int. J. Mol. Sci. 2015, 16, 16275–16287. [Google Scholar] [CrossRef]
  21. Schwarz, D.S.; Blower, M.D. The endoplasmic reticulum: Structure, function and response to cellular signaling. Cell. Mol. Life Sci. 2016, 73, 79–94. [Google Scholar] [CrossRef] [PubMed] [Green Version]
  22. Iurlaro, R.; Munoz-Pinedo, C. Cell death induced by endoplasmic reticulum stress. FEBS J. 2016, 283, 2640–2652. [Google Scholar] [CrossRef] [PubMed] [Green Version]
  23. Da Silva, D.C.; Valentão, P.; Andrade, P.B.; Pereira, D.M. Endoplasmic reticulum stress signaling in cancer and neurodegenerative disorders: Tools and strategies to understand its complexity. Pharmacol. Res. 2020, 155, 104702. [Google Scholar] [CrossRef]
  24. Fu, J.; Tao, T.; Li, Z.; Chen, Y.; Li, J.; Peng, L. The roles of ER stress in epilepsy: Molecular mechanisms and therapeutic implications. Biomed. Pharmacother. 2020, 131, 110658. [Google Scholar] [CrossRef] [PubMed]
  25. Ren, J.; Bi, Y.; Sowers, J.R.; Hetz, C.; Zhang, Y. Endoplasmic reticulum stress and unfolded protein response in cardiovascular diseases. Nat. Rev. Cardiol. 2021, 18, 499–521. [Google Scholar] [CrossRef]
  26. Choi, J.A.; Song, C.H. Insights into the Role of Endoplasmic Reticulum Stress in Infectious Diseases. Front. Immunol. 2020, 10, 3147. [Google Scholar] [CrossRef] [Green Version]
  27. Manalo, R.V.M.; Medina, P.M.B. The endoplasmic reticulum stress response in disease pathogenesis and pathophysiology. Egypt. J. Med. Hum. Genet. 2018, 19, 59–68. [Google Scholar] [CrossRef]
  28. Boyce, M.; Bryant, K.F.; Jousse, C.; Long, K.; Harding, H.P.; Scheuner, D.; Kaufman, R.J.; Ma, D.; Coen, D.M.; Ron, D.; et al. A Selective Inhibitor of eIF2α Dephosphorylation Protects Cells from ER Stress. Science 2005, 307, 935–939. [Google Scholar] [CrossRef]
  29. Chistiakov, D.A.; Sobenin, I.A.; Orekhov, A.N.; Bobryshev, Y.V. Role of endoplasmic reticulum stress in atherosclerosis and diabetic macrovascular complications. BioMed Res. Int. 2014, 2014, 610140. [Google Scholar] [CrossRef] [Green Version]
  30. Gonzalez-Teuber, V.; Albert-Gasco, H.; Auyeung, V.C.; Papa, F.R.; Mallucci, G.R.; Hetz, C. Small Molecules to Improve ER Proteostasis in Disease. Trends Pharmacol. Sci. 2019, 40, 684–695. [Google Scholar] [CrossRef]
  31. Grandjean, J.M.D.; Wiseman, R.L. Small molecule strategies to harness the unfolded protein response: Where do we go from here? J. Biol. Chem. 2020, 295, 15692–15711. [Google Scholar] [CrossRef] [PubMed]
  32. Emincik, A.; Gungor, Z.B.; Guzel, E. Effects of salubrinal on ER stress in an experimental model of polycystic ovary syndrome. Ultrastruct. Pathol. 2020, 44, 422–435. [Google Scholar] [CrossRef] [PubMed]
  33. Wang, Z.F.; Gao, C.; Chen, W.; Gao, Y.; Wang, H.C.; Meng, Y.; Luo, C.-L.; Zhang, M.-Y.; Chen, G.; Chen, X.-P.; et al. Salubrinal offers neuroprotection through suppressing endoplasmic reticulum stress, autophagy and apoptosis in a mouse traumatic brain injury model. Neurobiol. Learn. Mem. 2019, 161, 12–25. [Google Scholar] [CrossRef] [PubMed]
  34. Goswami, P.; Afjal, M.A.; Akhter, J.; Mangla, A.; Khan, J.; Parvez, S.; Raisuddin, S. Involvement of endoplasmic reticulum stress in amyloid β(1-42)-induced Alzheimer’s like neuropathological process in rat brain. Brain Res. Bull. 2020, 165, 108–117. [Google Scholar] [CrossRef]
  35. Borreca, A.; Valeri, F.; De Luca, M.; Ernst, L.; Russo, A.; Nobili, A.; Cordella, A.; Corsetti, V.; Amadoro, G.; Mercuri, N.B.; et al. Transient upregulation of translational efficiency in prodromal and early symptomatic Tg2576 mice contributes to Aβ pathology. Neurobiol. Dis. 2020, 139, 104787. [Google Scholar] [CrossRef]
  36. Anuncibay-Soto, B.; Santos-Galdiano, M.; Fernández-López, A. Neuroprotection by salubrinal treatment in global cerebral ischemia. Neural. Regen. Res. 2016, 11, 1744–1745. [Google Scholar] [CrossRef]
  37. Romero-Ramírez, L.; Nieto-Sampedro, M.; Barreda-Manso, M.A. Integrated Stress Response as a Therapeutic Target for CNS Injuries. BioMed Res. Int. 2017, 2017, 6953156. [Google Scholar] [CrossRef]
  38. Wang, T.; Zhang, S.J.; Cao, S.L.; Guo, W.Z.; Yan, B.; Fang, H.B. Protective effects of salubrinal on liver injury in rat models of brain death. Chin. Med. J. 2015, 128, 1523–1528. [Google Scholar] [CrossRef]
  39. Li, J.; Li, X.; Liu, D.; Zhang, S.; Tan, N.; Yokota, H.; Zhang, P. Phosphorylation of eIF2α signaling pathway attenuates obesity-induced non-alcoholic fatty liver disease in an ER stress and autophagy-dependent manner. Cell Death Dis. 2020, 11, 1069. [Google Scholar] [CrossRef]
  40. Yang, B.; Lu, X.; Li, Y.; Li, Y.; Yu, D.; Zhang, W.; Duan, C.; Taguchi, K.; Yasui, T.; Kohri, K.; et al. A Proteomic Network Approach across the Kidney Stone Disease Reveals Endoplasmic Reticulum Stress and Crystal-Cell Interaction in the Kidney. Oxidative Med. Cell. Longev. 2019, 2019, 9307256. [Google Scholar] [CrossRef]
  41. Wu, C.T.; Sheu, M.L.; Tsai, K.S.; Chiang, C.K.; Liu, S.H. Salubrinal, an eIF2α dephosphorylation inhibitor, enhances cisplatin-induced oxidative stress and nephrotoxicity in a mouse model. Free Radic. Biol. Med. 2011, 51, 671–680. [Google Scholar] [CrossRef] [PubMed]
  42. Chen, J.H.; Wu, C.H.; Chiang, C.K. Therapeutic Approaches Targeting Proteostasis in Kidney Disease and Fibrosis. Int. J. Mol. Sci. 2021, 22, 8674. [Google Scholar] [CrossRef] [PubMed]
  43. Rani, S.; Sreenivasaiah, P.K.; Cho, C.; Kim, D.H. Salubrinal Alleviates Pressure Overload-Induced Cardiac Hypertrophy by Inhibiting Endoplasmic Reticulum Stress Pathway. Mol. Cells 2017, 40, 66–72. [Google Scholar] [CrossRef] [PubMed] [Green Version]
  44. Gong, N.; Wu, J.H.; Liang, Z.S.; Jiang, W.H.; Wang, X.W. Role of salubrinal in protecting cardiomyocytes from doxorubicin-induced apoptosis. Genet. Mol. Res. 2015, 14, 12377–12385. [Google Scholar] [CrossRef]
  45. Liu, Y.; Wang, J.; Qi, S.Y.; Ru, L.S.; Ding, C.; Wang, H.J.; Zhao, J.-S.; Li, J.-J.; Li, A.-Y.; Wang, D.-M. Reduced endoplasmic reticulum stress might alter the course of heart failure via caspase-12 and JNK pathways. Can. J. Cardiol. 2014, 30, 368–375. [Google Scholar] [CrossRef]
  46. Cnop, M.; Toivonen, S.; Igoillo-Esteve, M.; Salpea, P. Endoplasmic reticulum stress and eIF2α phosphorylation: The Achilles heel of pancreatic β cells. Mol. Metab. 2017, 6, 1024–1039. [Google Scholar] [CrossRef]
  47. Aoi, K.; Nishio, A.; Okazaki, T.; Takeo, M.; Masuda, M.; Fukui, T.; Uchida, K.; Okazaki, K. Inhibition of the dephosphorylation of eukaryotic initiation factor 2α ameliorates murine experimental pancreatitis. Pancreatology 2019, 19, 548–556. [Google Scholar] [CrossRef]
  48. Takigawa, S.; Frondorf, B.; Liu, S.; Liu, Y.; Li, B.; Sudo, A.; Wallace, J.M.; Yokota, H.; Hamamura, K. Salubrinal improves mechanical properties of the femur in osteogenesis imperfecta mice. J. Pharmacol. Sci. 2016, 132, 154–161. [Google Scholar] [CrossRef] [Green Version]
  49. Li, J.; Li, X.; Liu, D.; Hamamura, K.; Wan, Q.; Na, S.; Yokota, H.; Zhang, P. eIF2α signaling regulates autophagy of osteoblasts and the development of osteoclasts in OVX mice. Cell Death Dis. 2019, 10, 921. [Google Scholar] [CrossRef]
  50. Liu, D.; Zhang, Y.; Li, X.; Li, J.; Yang, S.; Xing, X.; Fan, G.; Yokota, H.; Zhang, P. eIF2α signaling regulates ischemic osteonecrosis through endoplasmic reticulum stress. Sci. Rep. 2017, 7, 5062. [Google Scholar] [CrossRef] [Green Version]
  51. Chen, S.; Sun, C.; Gu, H.; Wang, H.; Li, S.; Ma, Y.; Wang, J. Salubrinal protects against Clostridium difficile toxin B-induced CT26 cell death. Acta Biochim. Biophys. Sin. 2017, 49, 228–237. [Google Scholar] [CrossRef] [PubMed] [Green Version]
  52. Alsterda, A.; Asha, K.; Powrozek, O.; Repak, M.; Goswami, S.; Dunn, A.M.; Memmel, H.C.; Sharma-Walia, N. Salubrinal Exposes Anticancer Properties in Inflammatory Breast Cancer Cells by Manipulating the Endoplasmic Reticulum Stress Pathway. Front. Oncol. 2021, 11, 654940. [Google Scholar] [CrossRef] [PubMed]
  53. Wu, L.; Liang, C.; Huang, X.; Deng, X.; Jiang, J.; Luo, Z. Salubrinal Regulates the Apoptosis of Adrenocortical Carcinoma Cells via the PERK/eIF2α/ATF4 Signaling Pathway. Int. J. Endocrinol. 2021, 2021, 5038130. [Google Scholar] [CrossRef] [PubMed]
  54. Chen, X.; Cubillos-Ruiz, J.R. Endoplasmic reticulum stress signals in the tumour and its microenvironment. Nat. Rev. Cancer 2021, 21, 71–88. [Google Scholar] [CrossRef] [PubMed]
  55. Avril, T.; Vauléon, E.; Chevet, E. Endoplasmic reticulum stress signaling and chemotherapy resistance in solid cancers. Oncogenesis 2017, 6, e373. [Google Scholar] [CrossRef]
  56. Lin, Y.; Jiang, M.; Chen, W.; Zhao, T.; Wei, Y. Cancer, and ER stress: Mutual crosstalk between autophagy, oxidative stress and inflammatory response. Biomed. Pharmacother. 2019, 118, 109249. [Google Scholar] [CrossRef]
  57. Zhao, X.; Zhang, C.; Zhou, H.; Xiao, B.; Cheng, Y.; Wang, J.; Yao, F.; Duan, C.; Chen, R.; Liu, Y.; et al. Synergistic antitumor activity of the combination of salubrinal and rapamycin against human cholangiocarcinoma cells. Oncotarget 2016, 7, 85492–85501. [Google Scholar] [CrossRef] [Green Version]
  58. Jeon, Y.-J.; Kim, J.H.; Shin, J.-I.; Jeong, M.; Cho, J.; Lee, K. Salubrinal-Mediated Upregulation of eIF2α Phosphorylation Increases Doxorubicin Sensitivity in MCF-7/ADR Cells. Mol. Cells 2016, 39, 129–135. [Google Scholar] [CrossRef] [Green Version]
  59. Kardos, G.R.; Gowda, R.; Dinavahi, S.S.; Kimball, S.; Robertson, G.P. Salubrinal in Combination with 4E1RCat Synergistically Impairs Melanoma Development by Disrupting the Protein Synthetic Machinery. Front. Oncol. 2020, 10, 834. [Google Scholar] [CrossRef]
  60. Bastola, P.; Neums, L.; Schoenen, F.J.; Chien, J. VCP inhibitors induce endoplasmic reticulum stress, cause cell cycle arrest, trigger caspase-mediated cell death, and synergistically kill ovarian cancer cells in combination with Salubrinal. Mol. Oncol. 2016, 10, 1559–1574. [Google Scholar] [CrossRef] [Green Version]
  61. Liu, J.; He, K.L.; Li, X.; Li, R.J.; Liu, C.L.; Zhong, W.; Li, S. SAR, Cardiac Myocytes Protection Activity and 3D-QSAR Studies of Salubrinal and its Potent Derivatives. Curr. Med. Chem. 2012, 19, 6072–6079. [Google Scholar] [CrossRef] [PubMed]
  62. Costa-Mattioli, M.; Gobert, D.; Stern, E.; Gamache, K.; Colina, R.; Cuello, C.; Sossin, W.; Kaufman, R.; Pelletier, J.; Rosenblum, K.; et al. eIF2alpha phosphorylation bidirectionally regulates the switch from short- to long-term synaptic plasticity and memory. Cell 2007, 129, 195–206. [Google Scholar] [CrossRef] [PubMed] [Green Version]
  63. Long, K.; Boyce, M.; Lin, H.; Yuan, J.; Ma, D. Structure-activity relationship studies of salubrinal lead to its active biotinylated derivative. Bioorg. Med. Chem. Lett. 2005, 15, 3849–3852. [Google Scholar] [CrossRef] [PubMed]
  64. Zadorozhnii, P.V.; Pokotylo, I.O.; Kiselev, V.V.; Okhtina, O.V.; Kharchenko, A.V. Molecular docking studies of salubrinal and its analogs as inhibitors of the GADD34:PP1 enzyme. ADMET DMPK 2019, 7, 140–150. [Google Scholar] [CrossRef] [Green Version]
  65. Zadorozhnii, P.V.; Kiselev, V.V.; Kharchenko, A.V. In silico toxicity evaluation of Salubrinal and its analogues. Eur. J. Pharm. Sci. 2020, 155, 105538. [Google Scholar] [CrossRef]
  66. Barreda-Manso, M.A.; Yanguas-Casás, N.; Nieto-Sampedro, M.; Romero-Ramírez, L. Neuroprotection and Blood-Brain Barrier Restoration by Salubrinal After a Cortical Stab Injury. J. Cell. Physiol. 2017, 232, 1501–1510. [Google Scholar] [CrossRef]
  67. Anuncibay-Soto, B.; Pérez-Rodríguez, D.; Santos-Galdiano, M.; Font, E.; Regueiro-Purriños, M.; Fernández-López, A. Post-ischemic salubrinal treatment results in a neuroprotective role in global cerebral ischemia. J. Neurochem. 2016, 138, 295–306. [Google Scholar] [CrossRef]
  68. Anuncibay-Soto, B.; Pérez-Rodriguez, D.; Santos-Galdiano, M.; Font-Belmonte, E.; Ugidos, I.F.; Gonzalez-Rodriguez, P.; Regueiro-Purriños, M.; Fernández-López, A. Salubrinal and robenacoxib treatment after global cerebral ischemia. Exploring the interactions between ER stress and inflammation. Biochem. Pharmacol. 2018, 151, 26–37. [Google Scholar] [CrossRef]
  69. Hu, Y.; Lu, X.; Xu, Y.; Lu, L.; Yu, S.; Cheng, Q.; Yang, B.; Tsui, C.-K.; Ye, D.; Huang, J.; et al. Salubrinal attenuated retinal neovascularization by inhibiting CHOP-HIF1α-VEGF pathways. Oncotarget 2017, 8, 77219–77232. [Google Scholar] [CrossRef] [Green Version]
  70. Pinzi, L.; Rastelli, G. Molecular Docking: Shifting Paradigms in Drug Discovery. Int. J. Mol. Sci. 2019, 20, 4331. [Google Scholar] [CrossRef] [Green Version]
  71. O’Boyle, N.M.; Banck, M.; James, C.A.; Morley, C.; Vandermeersch, T.; Hutchison, G.R. Open Babel: An open chemical toolbox. J. Cheminform. 2011, 3, 33. [Google Scholar] [CrossRef] [PubMed] [Green Version]
  72. Daina, A.; Michielin, O.; Zoete, V. SwissADME: A free web tool to evaluate pharmacokinetics, drug-likeness and medicinal chemistry friendliness of small molecules. Sci. Rep. 2017, 7, 42717. [Google Scholar] [CrossRef] [PubMed] [Green Version]
  73. Dong, J.; Wang, N.N.; Yao, Z.J.; Zhang, L.; Cheng, Y.; Ouyang, D.; Lu, A.-P.; Cao, D.-S. ADMETlab: A platform for systematic ADMET evaluation based on a comprehensively collected ADMET database. J. Cheminform. 2018, 10, 29. [Google Scholar] [CrossRef] [PubMed]
  74. Yang, H.; Lou, C.; Sun, L.; Li, J.; Cai, Y.; Wang, Z.; Lu, A.-P.; Cao, D.-S. admetSAR 2.0: Web-service for prediction and optimization of chemical ADMET properties. Bioinformatics 2019, 35, 1067–1069. [Google Scholar] [CrossRef] [PubMed]
  75. Cheng, F.; Li, W.; Zhou, Y.; Shen, J.; Wu, Z.; Liu, G.; Lee, P.W.; Tang, Y. admetSAR: A comprehensive source and free tool for evaluating chemical ADMET properties. J. Chem. Inf. Model. 2012, 52, 3099–3105. [Google Scholar] [CrossRef]
  76. Molinspiration Cheminformatics. 1986. Available online: https://www.molinspiration.com/ (accessed on 4 April 2020).
  77. Tetko, I.V.; Tanchuk, V.Y. Application of associative neural networks for prediction of lipophilicity in ALOGPS 2.1 program. J. Chem. Inf. Comput. Sci. 2002, 42, 1136–1145. [Google Scholar] [CrossRef]
  78. Pires, D.E.V.; Blundell, T.L.; Ascher, D.B. pkCSM: Predicting Small-Molecule Pharmacokinetic and Toxicity Properties Using Graph-Based Signatures. J. Med. Chem. 2015, 58, 4066–4072. [Google Scholar] [CrossRef]
  79. Banerjee, P.; Dunkel, M.; Kemmler, E.; Preissner, R. SuperCYPsPred—A web server for the prediction of cytochrome activity. Nucleic Acids Res. 2020, 48, W580–W585. [Google Scholar] [CrossRef]
  80. Montanari, F.; Knasmüller, B.; Kohlbacher, S.; Hillisch, C.; Baierová, C.; Grandits, M.; Ecker, G.F. Vienna LiverTox Workspace—A Set of Machine Learning Models for Prediction of Interactions Profiles of Small Molecules with Transporters Relevant for Regulatory Agencies. Front. Chem. 2020, 7, 899. [Google Scholar] [CrossRef]
  81. Trott, O.; Olson, A.J. AutoDock Vina: Improving the speed and accuracy of docking with a new scoring function, efficient optimization and multithreading. J. Comput. Chem. 2010, 31, 455–461. [Google Scholar] [CrossRef] [Green Version]
  82. Pettersen, E.F.; Goddard, T.D.; Huang, C.C.; Couch, G.S.; Greenblatt, D.M.; Meng, E.C.; Ferrin, T.E. UCSF Chimera—A visualization system for exploratory research and analysis. J. Comput. Chem. 2004, 25, 1605–1612. [Google Scholar] [CrossRef] [PubMed] [Green Version]
  83. Thompson, M.A.; Zerner, M.C. A theoretical examination of the electronic structure and spectroscopy of the photosynthetic reaction center from Rhodopseudomonas viridis. J. Am. Chem. Soc. 1991, 113, 8210–8215. [Google Scholar] [CrossRef]
  84. Thompson, M.A.; Glendening, E.D.; Feller, D. The Nature of K+/Crown Ether Interactions: A Hybrid Quantum Mechanical-Molecular Mechanical Study. J. Phys. Chem. 1994, 98, 10465–10476. [Google Scholar] [CrossRef]
  85. Thompson, M.A.; Schenter, G.K. Excited States of the Bacteriochlorophyll b Dimer of Rhodopseudomonas viridis: A QM/MM Study of the Photosynthetic Reaction Center That Includes MM Polarization. J. Phys. Chem. 1995, 99, 6374–6386. [Google Scholar] [CrossRef]
  86. Thompson, M.A. QM/MMpol: A Consistent Model for Solute/Solvent Polarization. Application to the Aqueous Solvation and Spectroscopy of Formaldehyde, Acetaldehyde, and Acetone. J. Phys. Chem. 1996, 100, 14492–14507. [Google Scholar] [CrossRef]
  87. Thompson, M. ArgusLab 4.0.1; Planaria Software LLC: Seattle, WA, USA, 2004; Available online: http://www.arguslab.com (accessed on 24 November 2021).
  88. Thiel, W. Semiempirical quantum-chemical methods. Wiley Interdiscip. Rev. Comput. Mol. Sci. 2014, 4, 145–157. [Google Scholar] [CrossRef] [Green Version]
  89. DeLano, W.L. The PyMOL Molecular Graphics System; DeLano Scientific: Palo Alto, CA, USA, 2003; Available online: http://www.pymol.org (accessed on 27 August 2015).
  90. Lipinski, C.A.; Lombardo, F.; Dominy, B.W.; Feeney, P.J. Experimental and computational approaches to estimate solubility and permeability in drug discovery and development settings. Adv. Drug Deliv. Rev. 2001, 46, 3–26. [Google Scholar] [CrossRef]
  91. Veber, D.F.; Johnson, S.R.; Cheng, H.Y.; Smith, B.R.; Ward, K.W.; Kopple, K.D. Molecular properties that influence the oral bioavailability of drug candidates. J. Med. Chem. 2002, 45, 2615–2623. [Google Scholar] [CrossRef]
  92. Wang, N.-N.; Huang, C.; Dong, J.; Yao, Z.-J.; Zhu, M.-F.; Deng, Z.-K.; Lv, B.; Lu, A.-P.; Chen, A.F.; Cao, D.-S. Predicting human intestinal absorption with modified random forest approach: A comprehensive evaluation of molecular representation, unbalanced data, and applicability domain issues. RSC Adv. 2017, 7, 19007–19018. [Google Scholar] [CrossRef] [Green Version]
  93. Mitchell, J.B.O. Machine learning methods in chemoinformatics. Wiley Interdiscip. Rev. Comput. Mol. Sci. 2014, 4, 468–481. [Google Scholar] [CrossRef] [Green Version]
  94. Shen, J.; Cheng, F.; Xu, Y.; Li, W.; Tang, Y. Estimation of ADME properties with substructure pattern recognition. J. Chem. Inf. Model. 2010, 50, 1034–1041. [Google Scholar] [CrossRef]
  95. Daina, A.; Zoete, V. A BOILED-Egg to Predict Gastrointestinal Absorption and Brain Penetration of Small Molecules. ChemMedChem 2016, 11, 1117–1121. [Google Scholar] [CrossRef] [Green Version]
  96. Mannhold, R.; Poda, G.I.; Ostermann, C.; Tetko, I.V. Calculation of Molecular Lipophilicity: State-of-the-Art and Comparison of Log P Methods on More Than 96,000 Compounds. J. Pharm. Sci. 2009, 98, 861–893. [Google Scholar] [CrossRef] [PubMed]
  97. Zakeri-Milani, P.; Valizadeh, H. Intestinal transporters: Enhanced absorption through P-glycoprotein-related drug interactions. Expert Opin. Drug Metab. Toxicol. 2014, 10, 859–871. [Google Scholar] [CrossRef] [PubMed]
  98. Ghose, A.K.; Crippen, G.M. Atomic physicochemical parameters for three-dimensional-structure-directed quantitative structure-activity relationships. 2. Modeling dispersive and hydrophobic interactions. J. Chem. Inf. Comput. Sci. 1987, 27, 21–35. [Google Scholar] [CrossRef]
  99. Wildman, S.A.; Crippen, G.M. Prediction of Physicochemical Parameters by Atomic Contributions. J. Chem. Inf. Comput. Sci. 1999, 39, 868–873. [Google Scholar] [CrossRef]
  100. Cheng, T.; Zhao, Y.; Li, X.; Lin, F.; Xu, Y.; Zhang, X.; Li, A.Y.; Wang, R.; Lai, L. Computation of Octanol-Water Partition Coefficients by Guiding an Additive Model with Knowledge. J. Chem. Inf. Model. 2007, 47, 2140–2148. [Google Scholar] [CrossRef] [PubMed]
  101. Moriguchi, I.; Hirono, S.; Nakagome, I.; Hirano, H. Comparison of Reliability of log P Values for Drugs Calculated by Several Methods. Chem. Pharm. Bull. 1994, 42, 976–978. [Google Scholar] [CrossRef] [Green Version]
  102. Moriguchi, I.; Hirono, S.; Liu, Q.; Nakagome, I.; Matsushita, Y. Simple Method of Calculating Octanol/Water Partition Coefficient. Chem. Pharm. Bull. 1992, 40, 127–130. [Google Scholar] [CrossRef] [Green Version]
  103. Huuskonen, J.J.; Villa, A.E.; Tetko, I.V. Prediction of partition coefficient based on atom-type electrotopological state indices. J. Pharm. Sci. 1999, 88, 229–233. [Google Scholar] [CrossRef]
  104. Daina, A.; Michielin, O.; Zoete, V. iLOGP: A Simple, Robust, and Efficient Description of n-Octanol/Water Partition Coefficient for Drug Design Using the GB/SA Approach. J. Chem. Inf. Model. 2014, 54, 3284–3301. [Google Scholar] [CrossRef] [PubMed]
  105. Clark, D.E. What has polar surface area ever done for drug discovery? Future Med. Chem. 2011, 3, 469–484. [Google Scholar] [CrossRef] [PubMed]
  106. Ertl, P.; Rohde, B.; Selzer, P. Fast calculation of molecular polar surface area as a sum of fragment-based contributions and its application to the prediction of drug transport properties. J. Med. Chem. 2000, 43, 3714–3717. [Google Scholar] [CrossRef] [PubMed]
  107. Clark, D.E. Rapid calculation of polar molecular surface area and its application to the prediction of transport phenomena. 1. Prediction of intestinal absorption. J. Pharm. Sci. 1999, 88, 807–814. [Google Scholar] [CrossRef] [PubMed]
  108. Rossi Sebastiano, M.; Doak, B.C.; Backlund, M.; Poongavanam, V.; Over, B.; Ermondi, G.; Caron, G.; Matsson, P.; Kihlberg, J. Impact of Dynamically Exposed Polarity on Permeability and Solubility of Chameleonic Drugs Beyond the Rule of 5. J. Med. Chem. 2018, 61, 4189–4202. [Google Scholar] [CrossRef] [PubMed]
  109. He, S.M.; Li, R.; Kanwar, J.R.; Zhou, S.F. Structural and functional properties of human multidrug resistance protein 1 (MRP1/ABCC1). Curr. Med. Chem. 2011, 18, 439–481. [Google Scholar] [CrossRef]
  110. Saaby, L.; Brodin, B. A Critical View on In Vitro Analysis of P-glycoprotein (P-gp) Transport Kinetics. J. Pharm. Sci. 2017, 106, 2257–2264. [Google Scholar] [CrossRef] [Green Version]
  111. Broccatelli, F.; Carosati, E.; Neri, A.; Frosini, M.; Goracci, L.; Oprea, T.I.; Cruciani, G. A novel approach for predicting P-glycoprotein (ABCB1) inhibition using molecular interaction fields. J. Med. Chem. 2011, 54, 1740–1751. [Google Scholar] [CrossRef] [Green Version]
  112. Chen, L.; Li, Y.; Zhao, Q.; Peng, H.; Hou, T. ADME evaluation in drug discovery. 10. Predictions of P-glycoprotein inhibitors using recursive partitioning and naive Bayesian classification techniques. Mol. Pharm. 2011, 8, 889–900. [Google Scholar] [CrossRef]
  113. O’Boyle, N.M.; Sayle, R.A. Comparing structural fingerprints using a literature-based similarity benchmark. J. Cheminform. 2016, 8, 36. [Google Scholar] [CrossRef] [Green Version]
  114. Wang, Z.; Chen, Y.; Liang, H.; Bender, A.; Glen, R.C.; Yan, A. P-glycoprotein substrate models using support vector machines based on a comprehensive data set. J. Chem. Inf. Model. 2011, 51, 1447–1456. [Google Scholar] [CrossRef] [PubMed]
  115. Li, D.; Chen, L.; Li, Y.; Tian, S.; Sun, H.; Hou, T. ADMET evaluation in drug discovery. 13. Development of in silico prediction models for P-glycoprotein substrates. Mol. Pharm. 2014, 11, 716–726. [Google Scholar] [CrossRef] [PubMed]
  116. Morgan, H.L. The Generation of a Unique Machine Description for Chemical Structures-A Technique Developed at Chemical Abstracts Service. J. Chem. Doc. 1965, 5, 107–113. [Google Scholar] [CrossRef]
  117. Szakács, G.; Annereau, J.P.; Lababidi, S.; Shankavaram, U.; Arciello, A.; Bussey, K.J.; Reinhold, W.; Guo, Y.; Kruh, G.D.; Reimers, M.; et al. Predicting drug sensitivity and resistance: Profiling ABC transporter genes in cancer cells. Cancer Cell 2004, 6, 129–137. [Google Scholar] [CrossRef] [Green Version]
  118. Alam, A.; Kowal, J.; Broude, E.; Roninson, I.; Locher, K.P. Structural insight into substrate and inhibitor discrimination by human P-glycoprotein. Science 2019, 363, 753–756. [Google Scholar] [CrossRef] [PubMed] [Green Version]
  119. Jain, S.; Grandits, M.; Ecker, G.F. Interspecies comparison of putative ligand binding sites of human, rat and mouse P-glycoprotein. Eur. J. Pharm. Sci. 2018, 122, 134–143. [Google Scholar] [CrossRef] [PubMed]
  120. Sodhi, J.K.; Huang, C.H.; Benet, L.Z. Volume of Distribution is Unaffected by Metabolic Drug–Drug Interactions. Clin. Pharmacokinet. 2021, 60, 205–222. [Google Scholar] [CrossRef]
  121. Smith, D.A.; Beaumont, K.; Maurer, T.S.; Di, L. Volume of Distribution in Drug Design. J. Med. Chem. 2015, 58, 5691–5698. [Google Scholar] [CrossRef]
  122. Obach, R.S.; Lombardo, F.; Waters, N.J. Trend analysis of a database of intravenous pharmacokinetic parameters in humans for 670 drug compounds. Drug Metab. Dispos. 2008, 36, 1385–1405. [Google Scholar] [CrossRef] [Green Version]
  123. Lambrinidis, G.; Vallianatou, T.; Tsantili-Kakoulidou, A. In vitro, in silico and integrated strategies for the estimation of plasma protein binding. A review. Adv. Drug Deliv. Rev. 2015, 86, 27–45. [Google Scholar] [CrossRef]
  124. Wanat, K. Biological barriers, and the influence of protein binding on the passage of drugs across them. Mol. Biol. Rep. 2020, 47, 3221–3231. [Google Scholar] [CrossRef] [PubMed] [Green Version]
  125. Zhu, X.W.; Sedykh, A.; Zhu, H.; Liu, S.S.; Tropsha, A. The use of pseudo-equilibrium constant affords improved QSAR models of human plasma protein binding. Pharm. Res. 2013, 30, 1790–1798. [Google Scholar] [CrossRef] [PubMed] [Green Version]
  126. Hall, L.M.; Hall, L.H.; Kier, L.B. QSAR modeling of beta-lactam binding to human serum proteins. J. Comput. Aided Mol. Des. 2003, 17, 103–118. [Google Scholar] [CrossRef] [PubMed]
  127. Zhivkova, Z.; Doytchinova, I. Quantitative structure—Plasma protein binding relationships of acidic drugs. J. Pharm. Sci. 2012, 101, 4627–4641. [Google Scholar] [CrossRef]
  128. Ghafourian, T.; Amin, Z. QSAR Models for the Prediction of Plasma Protein Binding. Bioimpacts 2013, 3, 21–27. [Google Scholar] [CrossRef]
  129. Wishart, D.S.; Feunang, Y.D.; Guo, A.C.; Lo, E.J.; Marcu, A.; Grant, J.R.; Sajed, T.; Johnson, D.; Li, C.; Sayeeda, Z.; et al. DrugBank 5.0: A major update to the DrugBank database for 2018. Nucleic Acids Res. 2018, 46, D1074–D1082. [Google Scholar] [CrossRef]
  130. Sun, L.; Yang, H.; Li, J.; Wang, T.; Li, W.; Liu, G.; Tang, Y. In Silico Prediction of Compounds Binding to Human Plasma Proteins by QSAR Models. ChemMedChem 2018, 13, 572–581. [Google Scholar] [CrossRef]
  131. Bteich, M. An overview of albumin and alpha-1-acid glycoprotein main characteristics: Highlighting the roles of amino acids in binding kinetics and molecular interactions. Heliyon 2019, 5, e02879. [Google Scholar] [CrossRef] [Green Version]
  132. Ghuman, J.; Zunszain, P.A.; Petitpas, I.; Bhattacharya, A.A.; Otagiri, M.; Curry, S. Structural basis of the drug-binding specificity of human serum albumin. J. Mol. Biol. 2005, 353, 38–52. [Google Scholar] [CrossRef]
  133. Taguchi, K.; Yamasaki, K.; Seo, H.; Otagiri, M. Potential Use of Biological Proteins for Liver Failure Therapy. Pharmaceutics 2015, 7, 255–274. [Google Scholar] [CrossRef] [Green Version]
  134. Huang, J.X.; Cooper, M.A.; Baker, M.A.; Azad, M.A.; Nation, R.L.; Li, J.; Velkov, T. Drug-binding energetics of human α-1-acid glycoprotein assessed by isothermal titration calorimetry and molecular docking simulations. J. Mol. Recognit. 2012, 25, 642–656. [Google Scholar] [CrossRef] [Green Version]
  135. Nishi, K.; Ono, T.; Nakamura, T.; Fukunaga, N.; Izumi, M.; Watanabe, H.; Suenaga, A.; Maruyama, T.; Yamagata, Y.; Curry, S.; et al. Structural insights into differences in drug-binding selectivity between two forms of human alpha1-acid glycoprotein genetic variants, the A and F1*S forms. J. Biol. Chem. 2011, 286, 14427–14434. [Google Scholar] [CrossRef] [PubMed] [Green Version]
  136. Schönfeld, D.L.; Ravelli, R.B.; Mueller, U.; Skerra, A. The 1.8-A crystal structure of alpha1-acid glycoprotein (Orosomucoid) solved by UV RIP reveals the broad drug-binding activity of this human plasma lipocalin. J. Mol. Biol. 2008, 384, 393–405. [Google Scholar] [CrossRef] [PubMed]
  137. Bagchi, S.; Chhibber, T.; Lahooti, B.; Verma, A.; Borse, V.; Jayant, R.D. In-vitro blood-brain barrier models for drug screening and permeation studies: An overview. Drug Des. Dev. Ther. 2019, 13, 3591–3605. [Google Scholar] [CrossRef] [PubMed] [Green Version]
  138. Pandit, R.; Chen, L.; Götz, J. The blood-brain barrier: Physiology and strategies for drug delivery. Adv. Drug Deliv. Rev. 2020, 165–166, 1–14. [Google Scholar] [CrossRef] [PubMed]
  139. Li, H.; Yap, C.W.; Ung, C.Y.; Xue, Y.; Cao, Z.W.; Chen, Y.Z. Effect of selection of molecular descriptors on the prediction of blood-brain barrier penetrating and nonpenetrating agents by statistical learning methods. J. Chem. Inf. Model. 2005, 45, 1376–1384. [Google Scholar] [CrossRef]
  140. Yan, A.; Liang, H.; Chong, Y.; Nie, X.; Yu, C. In-silico prediction of blood-brain barrier permeability. SAR QSAR Environ. Res. 2013, 24, 61–74. [Google Scholar] [CrossRef]
  141. Vilar, S.; Chakrabarti, M.; Costanzi, S. Prediction of passive blood-brain partitioning: Straightforward and effective classification models based on in silico derived physicochemical descriptors. J. Mol. Graph. Model. 2010, 28, 899–903. [Google Scholar] [CrossRef] [Green Version]
  142. Zanger, U.M.; Schwab, M. Cytochrome P450 enzymes in drug metabolism: Regulation of gene expression, enzyme activities, and impact of genetic variation. Pharmacol. Ther. 2013, 138, 103–141. [Google Scholar] [CrossRef]
  143. Beck, T.C.; Beck, K.R.; Morningstar, J.; Benjamin, M.M.; Norris, R.A. Descriptors of Cytochrome Inhibitors and Useful Machine Learning Based Methods for the Design of Safer Drugs. Pharmaceuticals 2021, 14, 472. [Google Scholar] [CrossRef]
  144. Rostkowski, M.; Spjuth, O.; Rydberg, P. WhichCyp: Prediction of cytochromes P450 inhibition. Bioinformatics 2013, 29, 2051–2052. [Google Scholar] [CrossRef] [PubMed] [Green Version]
  145. Veith, H.; Southall, N.; Huang, R.; James, T.; Fayne, D.; Artemenko, N.; Shen, M.; Inglese, J.; Austin, C.P.; Lloyd, D.G.; et al. Comprehensive characterization of cytochrome P450 isozyme selectivity across chemical libraries. Nat. Biotechnol. 2009, 27, 1050–1055. [Google Scholar] [CrossRef] [PubMed] [Green Version]
  146. Cheng, F.; Yu, Y.; Shen, J.; Yang, L.; Li, W.; Liu, G.; Lee, P.W.; Tang, Y. Classification of cytochrome P450 inhibitors and noninhibitors using combined classifiers. J. Chem. Inf. Model. 2011, 51, 996–1011. [Google Scholar] [CrossRef] [PubMed]
  147. Kim, S.; Chen, J.; Cheng, T.; Gindulyte, A.; He, J.; He, S.; Li, Q.; Shoemaker, B.A.; Thiessen, P.A.; Yu, B.; et al. PubChem in 2021: New data content and improved web interfaces. Nucleic Acids Res. 2021, 49, D1388–D1395. [Google Scholar] [CrossRef]
  148. Durant, J.L.; Leland, B.A.; Henry, D.R.; Nourse, J.G. Reoptimization of MDL Keys for Use in Drug Discovery. J. Chem. Inf. Comput. Sci. 2002, 42, 1273–1280. [Google Scholar] [CrossRef] [Green Version]
  149. Da Silveira, C.H.; Pires, D.E.; Minardi, R.C.; Ribeiro, C.; Veloso, C.J.; Lopes, J.C.; Meira, W.; Neshich, G.; Ramos, C.H.I.; Habesch, R.; et al. Protein cutoff scanning: A comparative analysis of cutoff dependent and cutoff free methods for prospecting contacts in proteins. Proteins 2009, 74, 727–743. [Google Scholar] [CrossRef] [Green Version]
  150. Wang, Y.; Bryant, S.H.; Cheng, T.; Wang, J.; Gindulyte, A.; Shoemaker, B.A.; Thiessen, P.A.; He, S.; Zhang, J. PubChem BioAssay: 2017 update. Nucleic Acids Res. 2017, 45, D955–D963. [Google Scholar] [CrossRef]
  151. Preissner, S.; Kroll, K.; Dunkel, M.; Senger, C.; Goldsobel, G.; Kuzman, D.; Guenther, S.; Winnenburg, R.; Schroeder, M.; Preissner, R. SuperCYP: A comprehensive database on Cytochrome P450 enzymes including a tool for analysis of CYP-drug interactions. Nucleic Acids Res. 2010, 38, D237–D243. [Google Scholar] [CrossRef]
  152. Sansen, S.; Yano, J.K.; Reynald, R.L.; Schoch, G.A.; Griffin, K.J.; Stout, C.D.; Johnson, E.F. Adaptations for the oxidation of polycyclic aromatic hydrocarbons exhibited by the structure of human P450 1A2. J. Biol. Chem. 2007, 282, 14348–14355. [Google Scholar] [CrossRef] [Green Version]
  153. Williams, P.A.; Cosme, J.; Ward, A.; Angove, H.C.; Matak Vinković, D.; Jhoti, H. Crystal structure of human cytochrome P450 2C9 with bound warfarin. Nature 2003, 424, 464–468. [Google Scholar] [CrossRef]
  154. Reynald, R.L.; Sansen, S.; Stout, C.D.; Johnson, E.F. Structural characterization of human cytochrome P450 2C19: Active site differences between P450s 2C8, 2C9, and 2C19. J. Biol. Chem. 2012, 287, 44581–44591. [Google Scholar] [CrossRef] [PubMed] [Green Version]
  155. Wang, A.; Savas, U.; Hsu, M.H.; Stout, C.D.; Johnson, E.F. Crystal structure of human cytochrome P450 2D6 with prinomastat bound. J. Biol. Chem. 2012, 287, 10834–10843. [Google Scholar] [CrossRef] [PubMed] [Green Version]
  156. Williams, P.A.; Cosme, J.; Vinkovic, D.M.; Ward, A.; Angove, H.C.; Day, P.J.; Vonrhein, C.; Tickle, I.J.; Jhoti, H. Crystal structures of human cytochrome P450 3A4 bound to metyrapone and progesterone. Science 2004, 305, 683–686. [Google Scholar] [CrossRef] [PubMed]
  157. Carbon-Mangels, M.; Hutter, M.C. Selecting relevant descriptors for classification by bayesian estimates: A comparison with decision trees and support vector machines approaches for disparate data sets. Mol. Inf. 2011, 30, 885–895. [Google Scholar] [CrossRef]
  158. Zaretzki, J.; Matlock, M.; Swamidass, S.J. XenoSite: Accurately predicting CYP-mediated sites of metabolism with neural networks. J. Chem. Inform. Model. 2013, 53, 3373–3383. [Google Scholar] [CrossRef]
  159. Smith, D.A.; Beaumont, K.; Maurer, T.S.; Di, L. Clearance in Drug Design. J. Med. Chem. 2019, 62, 2245–2255. [Google Scholar] [CrossRef]
  160. Jansen, K.; Pou Casellas, C.; Groenink, L.; Wever, K.E.; Masereeuw, R. Humans are animals, but are animals human enough? A systematic review and meta-analysis on interspecies differences in renal drug clearance. Drug Discov. Today 2020, 25, 706–717. [Google Scholar] [CrossRef]
  161. Camenisch, G.; Riede, J.; Kunze, A.; Huwyler, J.; Poller, B.; Umehara, K. The extended clearance model and its use for the interpretation of hepatobiliary elimination data. ADMET DMPK 2015, 3, 1–14. [Google Scholar] [CrossRef] [Green Version]
  162. Yap, C.W.; Li, Z.R.; Chen, Y.Z. Quantitative structure-pharmacokinetic relationships for drug clearance by using statistical learning methods. J. Mol. Graph. Model. 2006, 24, 383–395. [Google Scholar] [CrossRef]
  163. Smith, D.A.; Beaumont, K.; Maurer, T.S.; Di, L. Relevance of Half-Life in Drug Design. J. Med. Chem. 2018, 61, 4273–4282. [Google Scholar] [CrossRef]
  164. Hua, S. Advances in Oral Drug Delivery for Regional Targeting in the Gastrointestinal Tract—Influence of Physiological, Pathophysiological and Pharmaceutical Factors. Front. Pharmacol. 2020, 11, 524. [Google Scholar] [CrossRef]
  165. Masuri, S.; Cadoni, E.; Cabiddu, M.G.; Isaia, F.; Demuru, M.G.; Moráň, L.; Buček, D.; Vaňhara, P.; Havel, J.; Pivetta, T. The first copper (II) complex with 1,10-phenanthroline and salubrinal with interesting biochemical properties. Metallomics 2020, 12, 891–901. [Google Scholar] [CrossRef] [PubMed]
  166. Kadioglu, O.; Efferth, T. A Machine Learning-Based Prediction Platform for P-Glycoprotein Modulators and Its Validation by Molecular Docking. Cells 2019, 8, 1286. [Google Scholar] [CrossRef] [Green Version]
  167. Poirier, A.; Cascais, A.C.; Bader, U.; Portmann, R.; Brun, M.E.; Walter, I.; Hillebrecht, A.; Ullah, M.; Funk, C. Calibration of in vitro multidrug resistance protein 1 substrate and inhibition assays as a basis to support the prediction of clinically relevant interactions in vivo. Drug Metab. Dispos. 2014, 42, 1411–1422. [Google Scholar] [CrossRef]
  168. Tian, Q.; Zhang, J.; Chan, S.Y.; Tan, T.M.; Duan, W.; Huang, M.; Zhu, Y.; Chan, E.; Yu, Q.; Nie, Y.; et al. Topotecan is a substrate for multidrug resistance associated protein 4. Curr. Drug Metab. 2006, 7, 105–118. [Google Scholar] [CrossRef]
  169. Silva, R.; Carmo, H.; Vilas-Boas, V.; Barbosa, D.J.; Palmeira, A.; Sousa, E.; Carvalho, F.; Bastos, M.D.L.; Remião, F. Colchicine effect on P-glycoprotein expression and activity: In silico and in vitro studies. Chem. Biol. Interact. 2014, 218, 50–62. [Google Scholar] [CrossRef]
  170. Nanayakkara, A.K.; Vogel, P.D.; Wise, J.G. Prolonged inhibition of P-glycoprotein after exposure to chemotherapeutics increases cell mortality in multidrug resistant cultured cancer cells. PLoS ONE 2019, 14, e0217940. [Google Scholar] [CrossRef]
  171. Nanayakkara, A.K.; Follit, C.A.; Chen, G.; Williams, N.S.; Vogel, P.D.; Wise, J.G. Targeted inhibitors of P-glycoprotein increase chemotherapeutic-induced mortality of multidrug resistant tumor cells. Sci. Rep. 2018, 8, 967. [Google Scholar] [CrossRef] [Green Version]
  172. Smith, S.A.; Waters, N.J. Pharmacokinetic and Pharmacodynamic Considerations for Drugs Binding to Alpha-1-Acid Glycoprotein. Pharm. Res. 2019, 36, 30. [Google Scholar] [CrossRef]
  173. Otagiri, M.; Maruyama, T.; Imai, T.; Suenaga, A.; Imamura, Y. A comparative study of the interaction of warfarin with human α1-acid glycoprotein and human albumin. J. Pharm. Pharmacol. 1987, 39, 416–420. [Google Scholar] [CrossRef]
  174. Petitpas, I.; Bhattacharya, A.A.; Twine, S.; East, M.; Curry, S. Crystal structure analysis of warfarin binding to human serum albumin: Anatomy of drug site I. J. Biol. Chem. 2001, 276, 22804–22809. [Google Scholar] [CrossRef] [PubMed] [Green Version]
  175. Senol, N.; Oguzoglu, A.S.; Erzurumlu, Y.; Ascı, H.; Savran, M.; Gulle, K.; Ilhan, I.; Sadef, M.; Hasseyid, N.; Goksel, H.M. Modulation of Salubrinal-mediated Endoplasmic Reticulum Stress in Experimental Subarachnoid Hemorrhage Model. World Neurosurg. 2021, 153, e488–e496. [Google Scholar] [CrossRef] [PubMed]
  176. Font-Belmonte, E.; Ugidos, I.F.; Santos-Galdiano, M.; González-Rodríguez, P.; Anuncibay-Soto, B.; Pérez-Rodríguez, D.; Gonzalo-Orden, J.M.; Fernández-López, A. Post-ischemic salubrinal administration reduces necroptosis in a rat model of global cerebral ischemia. J. Neurochem. 2019, 151, 777–794. [Google Scholar] [CrossRef]
  177. Devi, L.; Ohno, M. Phospho-eIF2α level is important for determining abilities of BACE1 reduction to rescue cholinergic neurodegeneration and memory defects in 5XFAD mice. PLoS ONE 2010, 5, e12974. [Google Scholar] [CrossRef] [Green Version]
  178. Shaik, A.N. Changing trends in use of hepatocytes and microsomes for evaluating metabolism studies in drug discovery. ADMET DMPK 2016, 4, 60–61. [Google Scholar] [CrossRef] [Green Version]
  179. Watanabe, Y.; Fukuyoshi, S.; Kato, K.; Hiratsuka, M.; Yamaotsu, N.; Hirono, S.; Gouda, H.; Oda, A. Investigation of substrate recognition for cytochrome P450 1A2 mediated by water molecules using docking and molecular dynamics simulations. J. Mol. Graph. Model. 2017, 74, 326–336. [Google Scholar] [CrossRef]
  180. Dutkiewicz, Z.; Mikstacka, R. Structure-Based Drug Design for Cytochrome P450 Family 1 Inhibitors. Bioinorg. Chem. Appl. 2018, 2018, 3924608. [Google Scholar] [CrossRef]
  181. Wang, L.; Hai, Y.; Huang, N.; Gao, X.; Liu, W.; He, X. Human cytochrome P450 enzyme inhibition profile of three flavonoids isolated from Psoralea corylifolia: In silico predictions and experimental validation. New J. Chem. 2018, 42, 10922–10934. [Google Scholar] [CrossRef]
  182. Yim, S.K.; Kim, K.; Chun, S.; Oh, T.; Jung, W.; Jung, K.; Yun, C.-H. Screening of Human CYP1A2 and CYP3A4 Inhibitors from Seaweed In Silico and In Vitro. Mar. Drugs 2020, 18, 603. [Google Scholar] [CrossRef]
  183. Kucwaj-Brysz, K.; Latacz, G.; Podlewska, S.; Żesławska, E.; Handzlik, J.; Lubelska, A.; Satała, G.; Nitek, W.; Handzlik, J. The relationship between stereochemical and both, pharmacological and ADME-Tox, properties of the potent hydantoin 5-HT7R antagonist MF-8. Bioorg. Chem. 2021, 106, 104466. [Google Scholar] [CrossRef]
  184. Hung, T.C.; Kuo, C.C.; Chen, C.Y. In Silico Investigation of Cytochrome P450 2C9 in relation to Aging Using Traditional Chinese Medicine. Evid. Based. Complement. Alternat. Med. 2014, 2014, 404505. [Google Scholar] [CrossRef] [PubMed] [Green Version]
  185. Prasad, G.S.; Srisailam, K.; Sashidhar, R.B. Metabolic inhibition of meloxicam by specific CYP2C9 inhibitors in Cunninghamella blakesleeana NCIM 687: In silico and in vitro studies. SpringerPlus 2016, 5, 166. [Google Scholar] [CrossRef] [Green Version]
  186. Salminen, K.A.; Rahnasto-Rilla, M.; Väänänen, R.; Imming, P.; Meyer, A.; Horling, A.; Poso, A.; Laitinen, T.; Raunio, H.; Lahtela-Kakkonen, M. Time-Dependent Inhibition of CYP2C19 by Isoquinoline Alkaloids: In Vitro and In Silico Analysis. Drug Metab. Dispos. 2015, 43, 1891–1904. [Google Scholar] [CrossRef] [Green Version]
  187. Špičáková, A.; Kraus, P.; Gucký, T.; Kryštof, V.; Strnad, M.; Bazgier, V.; Otyepka, M.; Kubíčková, V.; Poruba, M.; Racova, Z.; et al. In vitro and in silico studies of interaction of synthetic 2,6,9-trisubstituted purine kinase inhibitors BPA-302, BP-21 and BP-117 with liver drug-metabolizing cytochromes P450. Physiol. Res. 2020, 69, S627–S636. [Google Scholar] [CrossRef]
  188. Li, J.; Du, H.; Wu, Z.; Su, H.; Liu, G.; Tang, Y.; Li, W. Interactions of omeprazole-based analogues with cytochrome P450 2C19: A computational study. Mol. BioSyst. 2016, 12, 1913–1921. [Google Scholar] [CrossRef]
  189. Li, J.; Cai, J.; Su, H.; Du, H.; Zhang, J.; Ding, S.; Liu, G.; Tang, Y.; Li, W. Effects of protein flexibility and active site water molecules on the prediction of sites of metabolism for cytochrome P450 2C19 substrates. Mol. BioSyst. 2016, 12, 868–878. [Google Scholar] [CrossRef]
  190. Don, C.G.; Smieško, M. Out-compute drug side effects: Focus on cytochrome P450 2D6 modeling. Wiley Interdiscip. Rev. Comput. Mol. Sci. 2018, 8, e1366. [Google Scholar] [CrossRef]
  191. Don, C.G.; Smieško, M. In Silico Pharmacogenetics CYP2D6 Study Focused on the Pharmacovigilance of Herbal Antidepressants. Front. Pharmacol. 2020, 11, 683. [Google Scholar] [CrossRef]
  192. Martiny, V.Y.; Carbonell, P.; Chevillard, F.; Moroy, G.; Nicot, A.B.; Vayer, P.; Villoutreix, B.O.; Miteva, M.A. Integrated structure- and ligand-based in silico approach to predict inhibition of cytochrome P450 2D6. Bioinformatics 2015, 31, 3930–3937. [Google Scholar] [CrossRef] [Green Version]
  193. Zhou, X.; Wang, Y.; Or, P.M.; Wan, D.C.; Kwan, Y.W.; Yeung, J.H. Molecular docking and enzyme kinetic studies of dihydrotanshinone on metabolism of a model CYP2D6 probe substrate in human liver microsomes. Phytomedicine 2012, 19, 648–657. [Google Scholar] [CrossRef]
  194. Pang, X.; Zhang, B.; Mu, G.; Xia, J.; Xiang, Q.; Zhao, X.; Liu, A.; Du, G.; Cui, Y. Screening of cytochrome P450 3A4 inhibitors via in silico and in vitro approaches. RSC Adv. 2018, 8, 34783–34792. [Google Scholar] [CrossRef] [PubMed] [Green Version]
  195. Kiani, Y.S.; Ranaghan, K.E.; Jabeen, I.; Mulholland, A.J. Molecular Dynamics Simulation Framework to Probe the Binding Hypothesis of CYP3A4 Inhibitors. Int. J. Mol. Sci. 2019, 20, 4468. [Google Scholar] [CrossRef] [PubMed] [Green Version]
  196. Gong, E.C.; Chea, S.; Balupuri, A.; Kang, N.S.; Chin, Y.W.; Choi, Y.H. Enzyme Kinetics and Molecular Docking Studies on Cytochrome 2B6, 2C19, 2E1, and 3A4 Activities by Sauchinone. Molecules 2018, 23, 555. [Google Scholar] [CrossRef] [Green Version]
  197. Bibi, Z. Role of cytochrome P450 in drug interactions. Nutr. Metab. 2008, 5, 27. [Google Scholar] [CrossRef] [PubMed] [Green Version]
  198. Hisaka, A.; Ohno, Y.; Yamamoto, T.; Suzuki, H. Prediction of pharmacokinetic drug-drug interaction caused by changes in cytochrome P450 activity using in vivo information. Pharmacol. Ther. 2010, 125, 230–248. [Google Scholar] [CrossRef]
  199. Goud, T.; Maddi, S.; Devanna, N.; Prasad, T.R. Evaluationof pharmacokinetic and pharmacodynamic interaction between repaglinide and atazanavir in healthy, diabetic and hepatic impaired rats: Possible inhibition of CYP3A, OATP, and P-glycoprotein transporters. ADMET DMPK 2016, 4, 269–279. [Google Scholar] [CrossRef] [Green Version]
  200. Maideen, N.M.P. Drug interactions of non-dihydropyridine calcium channel blockers involving CYP3A enzymes and P-gp transporter protein. Biointerface Res. Appl. Chem. 2020, 10, 6026–6032. [Google Scholar] [CrossRef]
Figure 1. The structure of Salubinal and some of its analogues [28,61,62,63].
Futurepharmacol 02 00013 g001
Figure 2. Structures of the studied Salubrinal analogues containing a cinnamic acid residue (S2S40) or a quinoline ring (S41S55).
Futurepharmacol 02 00013 g002
Figure 3. The MLOGP, LogPConsensus and Mw values for Salubrinal (S1), Sal 003 (S27), N-(2,2,2-trichloro-1-(3-(2-chloro-5-(trifluoromethyl)phenyl)thioureido)ethyl)cinnamamide (S31) and N-(1-(3-(4-bromophenyl)thioureido)-2,2,2-trichloroethyl)cinnamamide (S50).
Futurepharmacol 02 00013 g003
Figure 4. The PSA values for two Salubrinal conformers, one of which contains an intramolecular hydrogen bond (a), and the other does not (b).
Futurepharmacol 02 00013 g004
Figure 5. Correlation of PSA calculation results obtained by the topological and 3D methods.
Futurepharmacol 02 00013 g005
Figure 6. Position of inhibitors (Zosuquidar and Mibefradil) and substrates (Topotecan and Colchicin) in the active site of P-gp according to the results of molecular docking. (a) Zosuquidar, ∆G = −11.3 kcal/mol. (b) Mibefradil, ∆G = −8.0 kcal/mol. (c) Topotecan, ∆G = −7.6 kcal/mol. (d) Colchicin, ∆G = −7.2 kcal/mol.
Futurepharmacol 02 00013 g006
Figure 7. Position of molecules N-(2,2,2-trichloro-1-(3-(quinolin-8-yl)thioureido)ethyl)-2-naphthamide (S52), N-(2,2,2-trichloro-1-(3-(naphthalen-1-yl)thioureido)ethyl)cinnamamide (S3), N-(2,2,2-trichloro-1-(3-(naphthalen-2-yl)thioureido)ethyl)cinnamamide (S4) and Salubrinal (S1) in the active site of P-gp based on the results of molecular docking. (a) S52, ∆G = −10.6 kcal/mol. (b) S3, ∆G = −10.2 kcal/mol. (c) S4, ∆G = −10.2 kcal/mol. (d) S1, ∆G = −9.3 kcal/mol.
Futurepharmacol 02 00013 g007
Figure 8. Results of molecular docking with HSA: (a) Position of the Warfarin molecule in site 1 (green, ∆G = −9.3 kcal/mol) and site 2 (red, ∆G = −8.9 kcal/mol); (b) Position of Salubrinal and its analogues (red) in the active site 2, the Warfarin molecule in site 1 (green); (c) Comparison of the ∆G values after docking of Salubrinal and its analogues with active site 1 (black) and active site 2 (red).
Futurepharmacol 02 00013 g008
Figure 9. Position of molecules N-(2,2,2-trichloro-1-(3-(quinolin-8-yl)thioureido)ethyl)-2-naphthamide (S52), N-(2,2,2-trichloro-1-(3-(naphthalen-2-yl)thioureido)ethyl)cinnamamide (S4), N-(2,2,2-trichloro-1-(3-(4-((E)-phenyldiazenyl)phenyl)thioureido)ethyl)cinnamamide (S33) and Salubrinal (S1) in active site 2 of HSA based on molecular docking results. (a) S52, ∆G = −10.7 kcal/mol. (b) S4, ∆G = −10.6 kcal/mol. (c) S33, ∆G = −10.6 kcal/mol. (d) S1, ∆G = −9.9 kcal/mol.
Futurepharmacol 02 00013 g009
Figure 10. Position of the Warfarin molecule in the active site of the AGP A variant (a) and F1*S variant (b) according to the results of molecular docking.
Futurepharmacol 02 00013 g010
Figure 11. Results of molecular docking with AGP: (a) Position of the Salubrinal molecule in the active site of variant A; (b) Comparison of the ∆G values after docking Salubrinal and its analogues with A (black) and F1*S (red) options.
Futurepharmacol 02 00013 g011
Figure 12. Position of molecules of the S48, S47, S49 compounds in the active site of the AGP A variant, and molecules of the S52, S4, S49 compounds in the active site of the AGP F1*S variant according to the results of molecular docking. (a) S48 in active site of AGP A variant ∆G = −10.8 kcal/mol. (b) S52 in active site of AGP F1*S variant ∆G = −10.3 kcal/mol. (c) S47 in active site of AGP A variant ∆G = −10.6 kcal/mol. (d) S4 in active site of AGP F1*S variant ∆G = −10.3 kcal/mol. (e) S49 in active site of AGP A variant ∆G = −10.6 kcal/mol. (f) S49 in active site of AGP F1*S variant ∆G = −9.9 kcal/mol.
Futurepharmacol 02 00013 g012
Figure 13. Results of molecular docking with CYP1A2: (a) linear correlation between binding energy (∆G, AutoDock Vina) and the experimental pAC50 value; (bf) position of the molecules of Sal 003 (S27, E1), S43, S42, S48 and Salubrinal (S1) in the active site of CYP1A2, respectively. Heme is depicted in pink. The calculated pAC50 value is given for Sal 003. (b) S27(E1), ∆G = −9.8 kcal/mol (pAC50 = 5.2). (c) S43, ∆G = −9.8 kcal/mol (pAC50 = 5.2). (d) S42, ∆G = −9.0 kcal/mol (pAC50 = 4.8). (e) S48, ∆G = −9.0 kcal/mol (pAC50 = 4.8). (f) S1, ∆G = −5.9 kcal/mol (pAC50 = 3.0).
Futurepharmacol 02 00013 g013
Figure 14. Results of molecular docking with CYP2C9: (a) linear correlation between binding energy (∆G, AutoDock Vina) and the experimental pAC50 value; (bf) position of the molecules of Sal 003 (S27, E1), S3, S4, Salubrinal (S1) and S2 in the active site of CYP2C9, respectively. Heme is depicted in pink. The calculated pAC50 value is given for Sal 003. (b) S27(E1), ∆G = −9.8 kcal/mol (pAC50 = 6.3). (c) S3, ∆G = −10.6 kcal/mol (pAC50 = 6.8). (d) S4, ∆G = −10.3 kcal/mol (pAC50 = 6.6). (e) S1, ∆G = −10.1 kcal/mol (pAC50 = 6.5). (f) S2, ∆G = −10.3 kcal/mol (pAC50 = 6.5).
Futurepharmacol 02 00013 g014aFuturepharmacol 02 00013 g014b
Figure 15. Results of molecular docking with CYP2C19: (a) linear correlation between binding energy (∆G, AutoDock Vina) and the experimental pAC50 value; (bf) position of the molecules of Sal 003 (S27, E1), S52, S48, S46 and S31 in the active site of CYP2C19, respectively. Heme is depicted in pink. The calculated pAC50 value is given for Sal 003. (b) S27(E1), ∆G = −8.2 kcal/mol (pAC50 = 5.6). (c) S52, ∆G = −11.0 kcal/mol (pAC50 = 7.3). (d) S48, ∆G = −10.6 kcal/mol (pAC50 = 7.0). (e) S46, ∆G = −10.3 kcal/mol (pAC50 = 6.9). (f) S31, ∆G = −10.3 kcal/mol (pAC50 = 6.9).
Futurepharmacol 02 00013 g015aFuturepharmacol 02 00013 g015b
Figure 16. Results of molecular docking with CYP2D6: (a) linear correlation between binding energy (∆G, AutoDock Vina) and the experimental pAC50 value; (bf) position of the molecules of Sal 003 (S27, E1), S1, S52, S3 and S48 in the active site of CYP2C19, respectively. Heme is depicted in pink. The calculated pAC50 value is given for Sal 003. (b) S27(E1), ∆G = −10.0 kcal/mol (pAC50 = 5.2). (c) S1, ∆G = −11.8 kcal/mol (pAC50 = 7.2). (d) S52, ∆G = −11.8 kcal/mol (pAC50 = 7.2). (e) S3, ∆G = −11.5 kcal/mol (pAC50 = 6.8). (f) S48, ∆G = −11.5 kcal/mol (pAC50 = 6.8).
Futurepharmacol 02 00013 g016
Figure 17. Results of molecular docking with CYP3A4: (a) linear correlation between binding energy (∆G, AutoDock Vina) and the experimental pAC50 value; (bf) position of the molecules of Sal 003 (S27, E1), S3, S47, S31 and S52 in the active site of CYP2C19, respectively. Heme is depicted in pink. The calculated pAC50 value is given for Sal 003. (b) S27(E1), ∆G = −9.7 kcal/mol (pAC50 = 5.3). (c) S3, ∆G = −10.8 kcal/mol (pAC50 = 5.6). (d) S47, ∆G = −10.6 kcal/mol (pAC50 = 5.6). (e) S31, ∆G = −10.5 kcal/mol (pAC50 = 5.6). (f) S52, ∆G = −10.5 kcal/mol (pAC50 = 5.6).
Futurepharmacol 02 00013 g017aFuturepharmacol 02 00013 g017b
Figure 18. Correlation of the CLtot values (mL/min/kg) for Salubrinal and its analogues calculated in ADMETLab and pkCSM.
Futurepharmacol 02 00013 g018
Publisher’s Note: MDPI stays neutral with regard to jurisdictional claims in published maps and institutional affiliations.

