Article

Virtual Screening of Adenylate Kinase 3 Inhibitors Employing Pharmacophoric Model, Molecular Docking, and Molecular Dynamics Simulations as Potential Therapeutic Target in Chronic Lymphocytic Leukemia

by
Bárbara Lima Fonseca Barbosa
1,
Tulio Resende Freitas
1,
Michell de Oliveira Almeida
2,
Sérgio Schusterschitz da Silva Araújo
3,
Ana Clara Andrade
1,
Geovana Gomes Dornelas
1,
Julyana Gayva Fiorotto
1,
Vinicius Gonçalves Maltarollo
4,* and
Adriano de Paula Sabino
1,*
1
Clinical and Toxicological Analysis Department, Faculty of Pharmacy, Federal University of Minas Gerais, Presidente Antônio Carlos Ave, Pampulha, Belo Horizonte 31270-901, Brazil
2
São Carlos Institute of Chemistry, University of São Paulo, Avenida Trabalhador São Carlense, Parque Arnold Schimidt, São Carlos 13566-590, Brazil
3
Clinical Hospital, Federal University of Minas Gerais, Presidente Antônio Carlos Ave, Pampulha, Belo Horizonte 31270-901, Brazil
4
Pharmaceutical Products Department, Faculty of Pharmacy, Federal University of Minas Gerais, Presidente Antônio Carlos Ave, Pampulha, Belo Horizonte 31270-901, Brazil
*
Authors to whom correspondence should be addressed.
Future Pharmacol. 2021, 1(1), 60-79; https://doi.org/10.3390/futurepharmacol1010006
Submission received: 27 July 2021 / Revised: 5 November 2021 / Accepted: 8 November 2021 / Published: 3 December 2021

Abstract

:
Adenylate kinase 3 (AK3) is an enzyme located in the mitochondrial matrix involved in purine homeostasis. This protein has been considered a potential therapeutic target in chronic lymphocytic leukemia (CLL), because the silencing of the AK3 gene has inhibited cell growth in CLL in vitro models. This study aimed to design potential AK3 inhibitors by applying molecular modeling techniques. Through the mapping of AK3 binding sites, essential interaction fields for pharmacophore design were identified. Online libraries were virtually screened by using a pharmacophore model, and 6891 compounds exhibited the functional groups for interaction with the target. These compounds underwent molecular docking simulations through Surflex and GOLD programs. After visual inspection, we selected 13 compounds for pharmacokinetic properties toxicology prediction via admetSAR and Protox web servers. Finally, six compounds were chosen for further analysis.

1. Introduction

The adenylate kinase (AK) isoenzyme family consists of proteins that catalyze a reversible high-energy phosphoryl transfer reaction between purine nucleotides [1]. AKs perform an important role in the level maintenance of adenine nucleotides, which are essential to cell metabolism, either as a source of chemical energy or as mediators of cell signaling pathways [2]. Adenylate kinase 3, also called GTP:AMP phosphotransferase, is located in the mitochondrial matrix and promotes the reversible transfer of a phosphate group from GTP to AMP, generating GDP and ADP [3]. Thus, AK3 promotes a GDP formation for the next acid citric cycle and substrate availability for ATP production.
AK3 levels are increased in peripheral blood mononuclear cells of chronic lymphocytic leukemia (CLL) patients [4]. CLL is the most common form of lymphoid malignancies in adults and is characterized by the progressive accumulation of small mature B cells in the peripheral blood and lymphoid organs. Conventional therapeutic options for CLL patients include chemoimmunotherapy, alkylating agents, and purine analogs [5]. High-risk patients are often resistant to first-line treatments, and therapeutic options for them include a tyrosine kinase inhibitor, ibrutinib or Bcl-2 inhibitor, and venetoclax [6,7]. However, these treatment approaches still have significant limitations, such as the occurrence of side effects due to high levels of toxicity, the selection of leukemia clones, and drug resistance [8,9,10].
Despite AK3’s role in leukemic cells, the relationship to the pathophysiology is still unknown, and the literature data have shown that AK3 gene silencing has inhibited immortalized CLL cell growth in vitro [4]. This finding suggests that AK3 could play an important role in CLL progression, as it is a potential therapeutic target for new therapeutic approaches.
The modern drug-discovery strategies include a wide range of computational techniques. When the structure of a biological target is available, methods can be applied to investigate whether or not a potential ligand can bind with high affinity to the active target site in order to inhibit or enhance its function. These structure-based drug design (SBDD) methods enable the identification of new lead compounds in time- and cost-effective manners, including such techniques as the virtual screening of ligand databases, pharmacophore modeling, and molecular docking [11,12].
The combined use of virtual screening through pharmacophore modeling and molecular docking has been used to find potential leads with high selectivity [13,14,15]. In this setting, while structure-based pharmacophore modeling is useful in selecting compounds with chemical and spatial complementarity, while molecular docking studies seek to predict the ligand position inside the target binding site and its intermolecular interactions in the region of interest [12,16].
Given the limitations of the available treatments, the rise of AK3 as a potential therapeutic target, and the lack of known AK3 ligands, this study aimed to design potential AK3 inhibitors through molecular modeling techniques.

2. Materials and Methods

2.1. Generation of the Structure-Based Pharmacophore Model

A three-dimensional (3D) crystallographic structure of AK3 (PDB ID: 1ZD8 [17]) was retrieved from the Protein Data Bank (www.rcsb.org (accessed on 27 June 2021)). FTSite [18] and FTMap [19] web servers were then employed to characterize hot spots and the potential binding site of an inhibitor. The obtained results were analyzed according to the frequency of predicted interactions per amino acid residue, using the BIOVIA Discovery Studio software [20], according to a previous study [21]. AutoGRID software was also employed to map the binding pocket of AK3, aiming to identify the most energetic favorable regions to perform H-bonds, Van der Waals, and ionic interactions [22,23,24]. The FTSite, FTMap, and AutoGRID results were then compared to knowledge from the literature about AK3 binding sites to guide the creation of the pharmacophore model.
Structure preparation was carried out by using the Sybyl X 2.1 Biopolymer module [25] by removing the water molecules, setting up the amino and carboxyl-terminal groups as charged, and adding the hydrogen atoms. The atomic charges were also calculated using the Merck Molecular Force Field (MMFF94) [26]. After energy optimization, the binding site spheres were defined based on chemical features (hydrophobic, H-donor, H-acceptor, and electrostatic favorable interaction amino acids), previously obtained from AK3 binding sites and hot-spot prediction analysis, employing FTSite and FTMap web servers and AutoGRID results. The structure-based pharmacophore model was then generated by using Unity Software that was implemented in the Sybyl X 2.1 computational package.

2.2. Pharmacophore-Based Virtual Screening of Compound Libraries

Four compound libraries were employed in this first virtual screening, using the pharmacophore model. The first was the Enamine REAL Drug-Like database (www.enamine.net (accessed on 15 February 2018)); however, to reduce computational processing time and costs, its content was refined, employing a filter of useful chemical and physical properties. The compounds were filtered, which showed up to 3 chiral centers, 1 to 5 H-bond donor groups, and 2 to 10 H-bond acceptor groups, as well as a formal charge between −1 and +1. As a result, the total number of ligands applied for virtual screening from the Enamine Real Drug-like Database declined from 5 million to 1,673,417 compounds. A preliminary version of the Brazilian Compound Library [27] was employed with the Drug-Bank FDA Approved Drugs [28] and the NuBBE Natural Products [29].
The ligand library included 1,678,724 compounds. Prior to the screening, the compounds’ ionization states were calculated, using the fixpka software; implemented in the QUACPAC computational package [30]; and followed by the calculation of the lowest energy conformer, using the OMEGA 2.5.1.4. software [31]. The ligands were then finally screened against the pharmacophore model, employing a 3D Flex Search mode. Only compounds able to fit the molecular features and their respective distances were considered hits. Furthermore, a fitting function QueryFit (Qfit) was calculated for each compound.

2.3. Molecular Docking Simulations

The pharmacophore-based filtering as an initial step of the virtual screening protocol allows for the exclusion of compounds that do not have the molecular requirements to bind the AK3 binding site. Therefore, to predict the binding mode of ligands, a docking study was applied by using the pharmacophore hits. Firstly, molecular docking calculations were performed by using the Surflex-Dock GeomX (SFXC) mode of Surflex Docking [32] software. For these simulations, a maximum of 20 poses by ligand, 12 rotations for each fragment, a maximum of 100 rotations per molecule, and up to 20 fragmented initial conformers were set up. The CScore scoring function was employed to rank the compounds with high binding affinity. The first 100 ligands with favorable binding energy were selected for visual inspection. The first 50 hits were also visually analyzed and ranked according to the QueryFit (Qfit) value, previously obtained in the pharmacophore screening step. Although the Unity Manual does not recommend the use of Qfit for compound ranking [25], its value was used in order to enrich the analyses. Moreover, a third form of ranking, denominated “Consensus”, was obtained by using the average value between the compounds’ ranking positions according to Cscore and Qfit. The top 50 ranked compounds in the consensus method were also visually inspected, with the intention of including hits with similar poses to both docking simulation and pharmacophore fitting. All of the visual analyzes were carried out by using the Sybyl X 2.1 [25] computational package.
The second docking study was performed by using the GOLD 5.1 software [33] with the hits that interacted with at least two residues from predicted hot spots in the previous analyses. Compounds that have similar pose/conformation in the consensus prediction were also included. One hundred poses per ligand were generated by using a genetic algorithm, and the compounds were then ranked by using two different scoring functions: ChemPLP and GOLDscore. In the visual inspection, the highest scored poses were compared according to ChemPLP and GOLDscore functions, as well as to the Surflex Docking. Finally, ligands with similar poses in the three applied docking simulations (using Cscore in Surflex Docking, and GOLDscore and ChemPLP in GOLD) were selected for in silico ADMET analysis.

2.4. In Silico ADMET Prediction

The compounds selected in the docking simulations were subjected to ADMET calculations. Parameters, such as aqueous solubility, human intestinal absorption, permeability through Caco-2 cells, cell distribution, hERG inhibition potential, carcinogenicity, and AMES toxicity, were all predicted through the admetSAR web server [34]. Moreover, toxicity class and LD50 were determined by using the ProTox web server [35].

2.5. Molecular Dynamics Simulations

The complexes obtained from docking studies were used for molecular dynamics simulations. Initially, the six ligands obtained by virtual screening were parameterized by calculating the charges, using the Restrained Electrostatic Potential (RESP) model and single-point calculations (retaining the atomic coordinates obtained by molecular docking simulations). The method for obtaining the partial atomic charges was the Hartree-Fock and 6-31G * basis set implemented in the Gaussian 09 software [36,37,38]. After calculating the atomic charges of the ligands, we used the Antechamber program for the parameterization of the compounds. The Tleap module (implemented in the Ambertools 18 program) was used [39] to prepare the structures of the complexes. Finally, a visual inspection was carried out by using the USCF Chimera 1.4 software [40].
The TIP3P water model (10 Å octahedral box) was used to construct the periodic coordinates (solvation boxes). After preparing the systems, the molecular dynamics simulations were performed in the Amber18 program, using the PMEMD parameters (Particle Mesh Ewald Molecular Dynamics) and force field 99SB (ff99SB) [41,42,43]. The enzyme’s structure in Apo form was also prepared to compare flexibility with simulations of the complexes. The six complexes and Apo form enzyme were subjected to seven minimization steps in triplicate, aiming to remove possible bad contacts from the molecular structures of the systems. In the first minimization, only the hydrogen atoms were minimized, while, in the second, all water molecules in the systems were minimized. The systems in their entirety were then minimized, following four steps (enzyme, water molecules, neutralizing ions, and ligands). Finally, in the seventh minimization step, the simulations were performed by using all degrees of freedom.
After minimization, all complexes were subjected to ten equilibrium stages with heating. These stages had temperature variations, in which, for each stage, the temperature increased by 25 K, until reaching the final equilibrium stage, where the temperature reached 300 K. These steps were carried out in a total time interval of 29 ns, where the first step was simulated with 1 ns, the following eight steps were calculated with three ns each, and the tenth and last step with 10 ns. These simulations were also carried out by using the Langevin thermostat (ntt = 3) and the Monte Carlo barostat. Finally, after the systems obtained thermodynamic equilibrium, the productions of the molecular dynamics were simulated in a timescale of 300 ns, with the same parameters used in the equilibrium steps.
At the end of all molecular dynamics simulations, the results were submitted to the CPPTRAJ module (implemented in Ambertools 18) to perform the RMSD (Root-Mean-Square Deviations) and RMSF (Root-Mean-Square Fluctuations) analyses. After that, the most stable sub-trajectories (with minor variations in the RMSD) were used to estimate the ΔG of enzyme binding in the presence of the ligands.

2.6. Free-Energy Calculations

The next step consisted of predicting the affinity of the six hits to the target by estimating the ΔG values by using the solvent interaction energy (SIE) method with the SIETRAJ program. This program performs the calculation of the Poisson–Boltzmann equation, using the Boundary Element Method (BEM). Through Equation (1), it is possible to verify the parameters used in this technique.
Δ G b i n d =   α   [ E i n t e r C o u l   ( D i n ) + Δ G d e s o l v R   ( D i n ) + E i n t e r v d W +   γ   ( ρ ,   D i n )   Δ M S A   ( ρ ) ] + C
where E i n t e r C o u l is Coulomb’s intermolecular energy, Δ G d e s o l v R is the free energy of desolvation, E i n t e r v d W is the van der Waals’s energy, Δ G d e s o l v n p is the non-polar free energy of desolvation, ρ is the derivation factor of Born’s atomic radius, Din is the inner dielectric constant of the solute, γ is the stress coefficient of the molecular surface, and ΔMSA is the molecular surface area of the solute on the bond [44,45].

2.7. Free-Energy Decomposition

Free-energy calculations by decomposition of residues were performed in order to obtain more information about AK3 and ligand predicted interactions. This method uses implicit solvation to estimate the decomposition of interaction energies between amino acid residues and ligands. These calculations were performed by using the MM-GBSA method, with a salt concentration at molarity equal to 0.100 M. Equation (2) shows the terms used to calculate free energy by decomposing residues [46,47,48].
  Δ G I R = Δ G v d W Δ G E l e Δ G G B  
where Δ G I R is the free energy of amino acid residues for ligands, Δ G v d W is the contribution of van der Waals, Δ G E l e is the electrostatic contribution, and Δ G G B is the solvent contribution calculated by the generalized Born method (GB). From the application of this method, it was possible to obtain the estimate of the free energy that each amino acid residue has for the interactions between AK3 and the studied ligands.

3. Results and Discussion

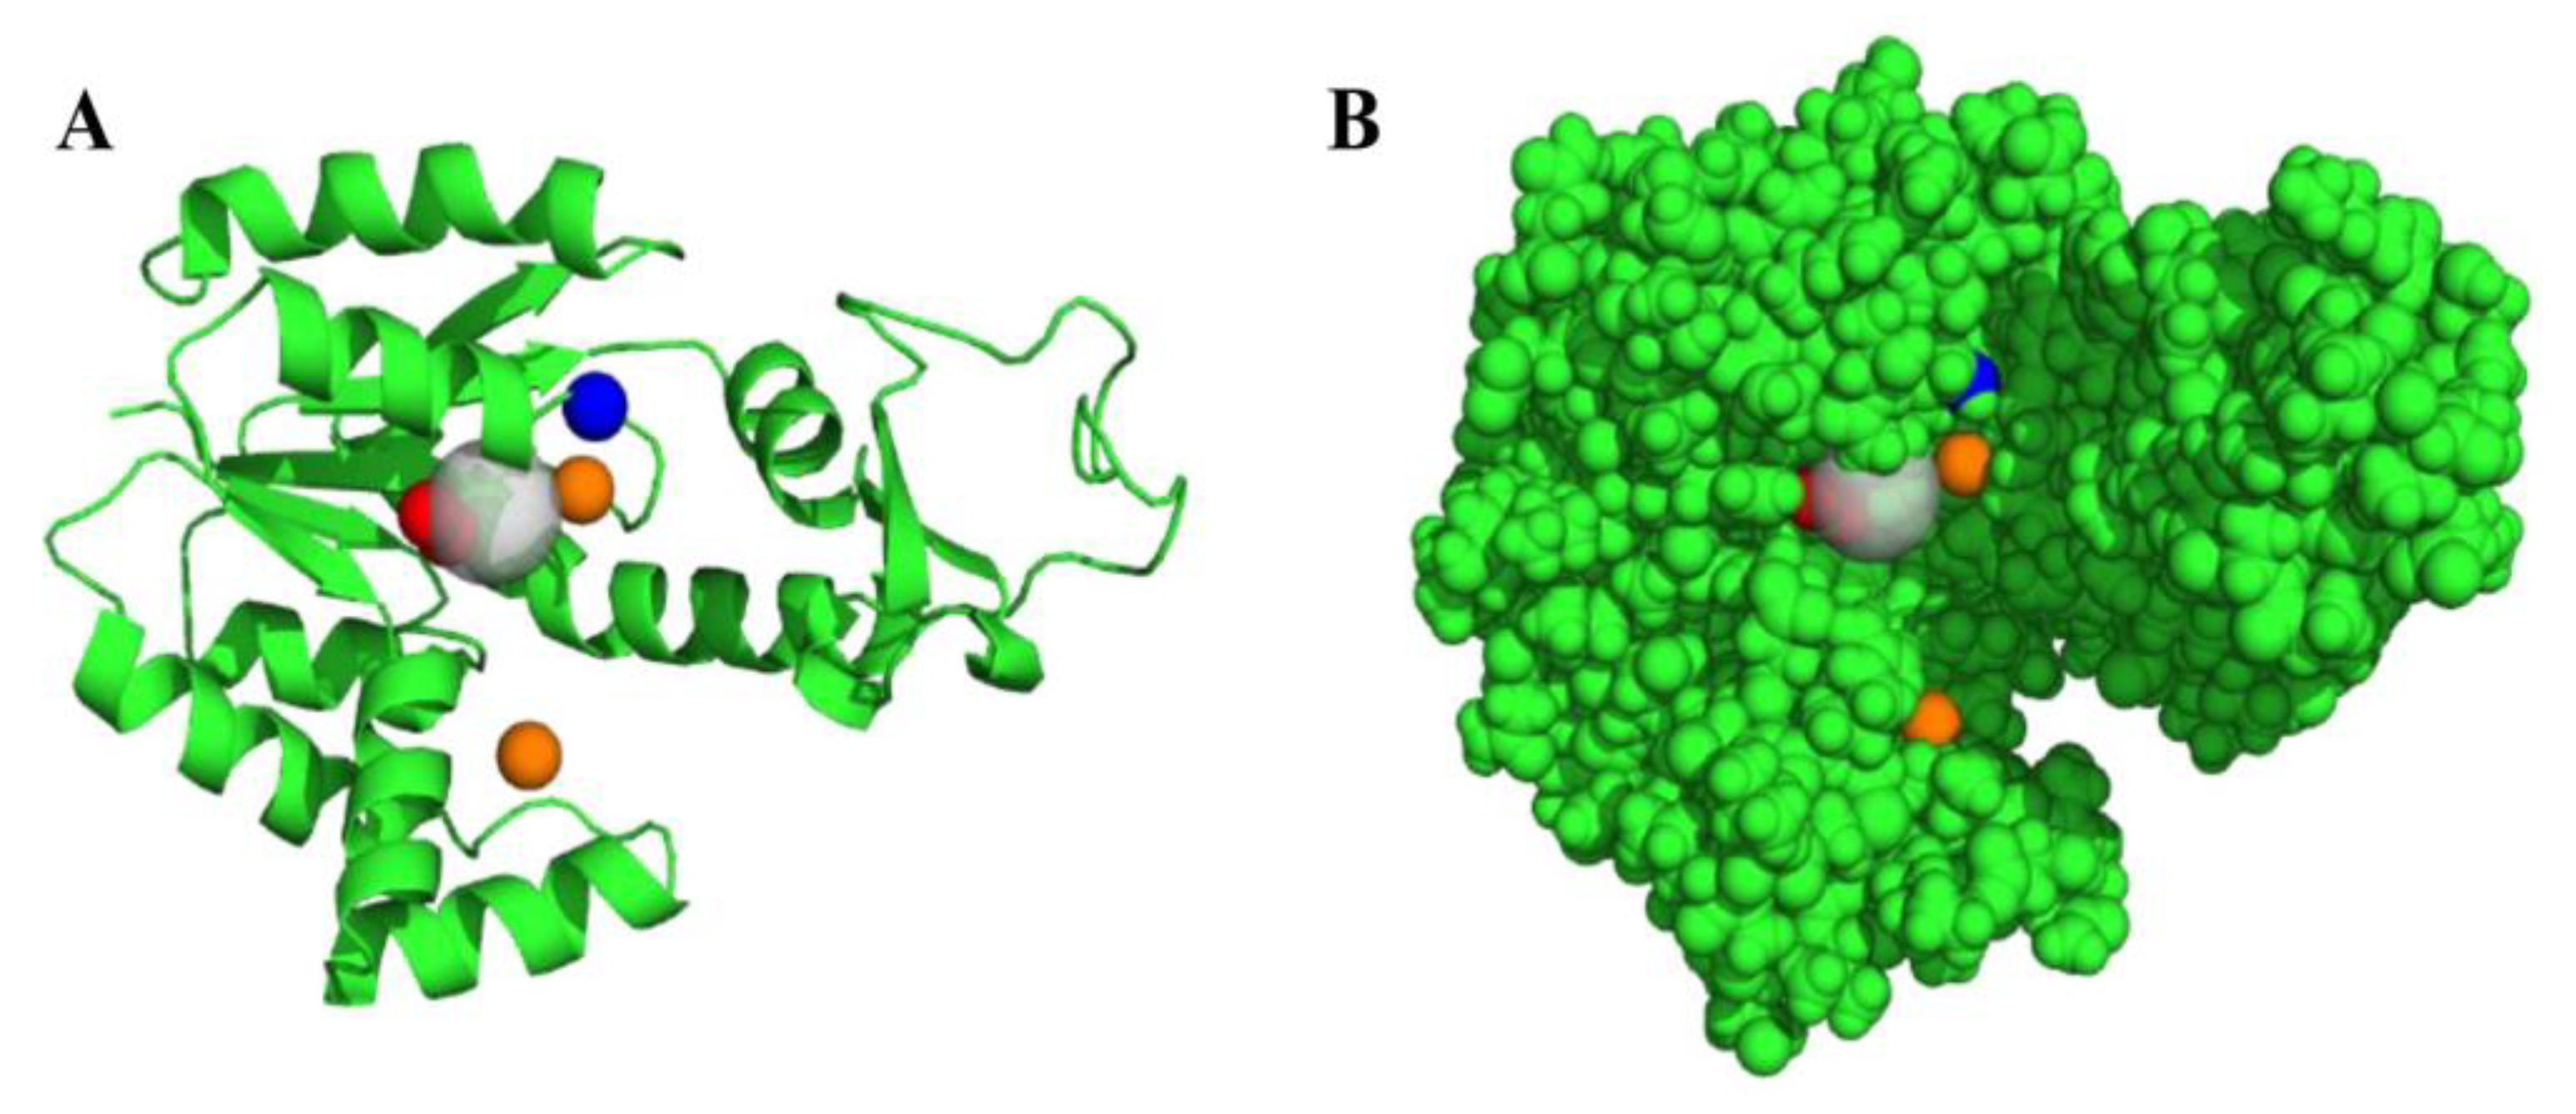
3.1. Mapping of AK3 Binding Sites and the Generation of a Pharmacophoric Model

As a prerequisite to the human AK3 binding site mapping, the only structure available is the PBD (PDB ID: 1ZD8 [17]); resolutions equal to 1.48Å and R-factor and R-free were 0.24 and 0.224, respectively, elucidated by the X-ray diffraction method, which was selected for this study. In view of the analysis of the main features of the model, the AK3 crystallographic structure was considered reliable and suitable for this study [49]. The obtained structure corresponds to the open conformation of AK3, that is, its conformation in the absence of interaction with the substrate/inhibitor. The use of the open structure allows for the design of a ligand that binds to the active site and prevents the necessary conformational changes for the catalytic activity [2]. In addition, the crystallographic structure related to the closed conformation, as well as the structure corresponding to the interaction of the enzyme with a ligand, is not available.
From the FTSite results, three favorable regions were predicted for interaction with a ligand (Figure 1A). The FTMap predicted seven clusters of molecular probes, indicating that there are different hot spots for interaction with a ligand (Figure 1B). The clusters were identified from 0 to 6, and the results obtained by the two web servers were compared visually.
The favorable sites for interaction with a ligand found in both prediction studies agree with the binding sites for AK3 substrates: GTP and AMP. According to Reference [17], the GTP-binding region is a glycine-rich region that comprises the following residues: Gly16, Ser17, Gly18, Lys19, Gly20, and Thr21 (Figure 1D). The AMP-binding regions include the following residues: Lys63, Leu64, and Ile65, as well as Gly-90, Phe91, Pro92, and Arg93 (Figure 1D). It was also possible to notice that the active site predicted by the simulations is located inside a cavity. This fact was already expected, since the enzyme binding sites are normally located in protruding areas or in cavitary regions [49].
From the analysis of the predicted interactions, only 20 amino acid residues are involved in at least one type of intermolecular bonding. The residues that contributed most to intermolecular interactions were Ser17, Gly18, Lys19, Ser37, Ile65, and Asp89. The region comprising the Ser17, Gly18, and Lys19 residues corresponds to the GTP-binding site, and both Ser37 and Ile65 are in the AMP-binding domain (also called NMP). Asp89, on the other hand, is not located in any known binding site of the enzyme, but it is adjacent to one of the AMP binding sites. Moreover, the volume occupied by the AK3 binding cavity predicted by the CASTp 3.0 server [50] is equal to 652.427 Å3.
From FTMap results, the calculated interactions between molecular probes and AK3 were quantified in order to predict the most favorable amino acid residues that could interact with an inhibitor. Hydrogen bonds make up 80.46% of the predicted interactions, while the hydrophobic and electrostatic bonds correspond to 14.94% and 4.60%, respectively. Among the hydrogen bonds, the molecular probes which acted as donors (HBDs) and as acceptors (HBAs) were equal to 62.86% and 37.14%, respectively. Asp89 was the predominant residue that interacted with HBD probes (26.92%), and Gly18 residue was present in 20.45% of the interactions with HBA probes (Figure 2A,B).
The frequency of participation of residues in hydrophobic interactions was also evaluated (Figure 2C). Ile59 and Lys19 were the residues that contributed most to interactions of this type and were responsible for 30.77% and 23.08% of all hydrophobic bonds, respectively. Regarding electrostatic interactions, only the Asp39 and Asp89 residues participated in the connections (Figure 2D), with the Asp89 residue being the main contributor to this type of interaction.
Energetically favorable regions for hydrophobic interactions were predicted close to Lys19 and Ile59 residues (Figure 3C). An energetically favorable region for a ligand to act as HBD has been mapped around Asp89 (Figure 3A). The molecular field close to Ala14 was analyzed and discarded for the following steps (construction of the pharmacophoric model). Although this residue has contributed significantly to the intermolecular interactions predicted by the FTMap, its region of interaction conflicts with the region of hydrophobic interaction with Lys19. Two more regions of interest were also found: one close to Gly18, with a fragmented aspect and favorable for a ligand to behave similar to HBA (Figure 3B); and another around Asp89, conducive to electrostatic interactions (Figure 3D).
Using the information obtained in the previous steps, we generated a pharmacophoric model by using the structure of the biological target for screening libraries of molecules. The favorable regions for hydrophobic interactions around residues Lys19 and Ile59 were selected as regions for the identification of hydrophobes. In addition to being located inside the enzymatic cavity, these residues were those that most contributed to the hydrophobic bonds in the prediction studies of the AK3 active site. The energetically favorable spaces for hydrogen bonds were also considered in the elaboration of the model. The area close to the Gly18 residue was chosen as the region to identify a hydrogen bond acceptor. The region around Asp89 was selected to identify a hydrogen bonding donor and/or a cation. Gly18 and Asp89 are also located in the enzyme cavity and contributed considerably to the hydrogen bonds in the mapping simulations of the protein binding site. The spatial arrangement of the interaction sites was established manually, from the determination of coordinates in the target’s three-dimensional structure (Figure 4).

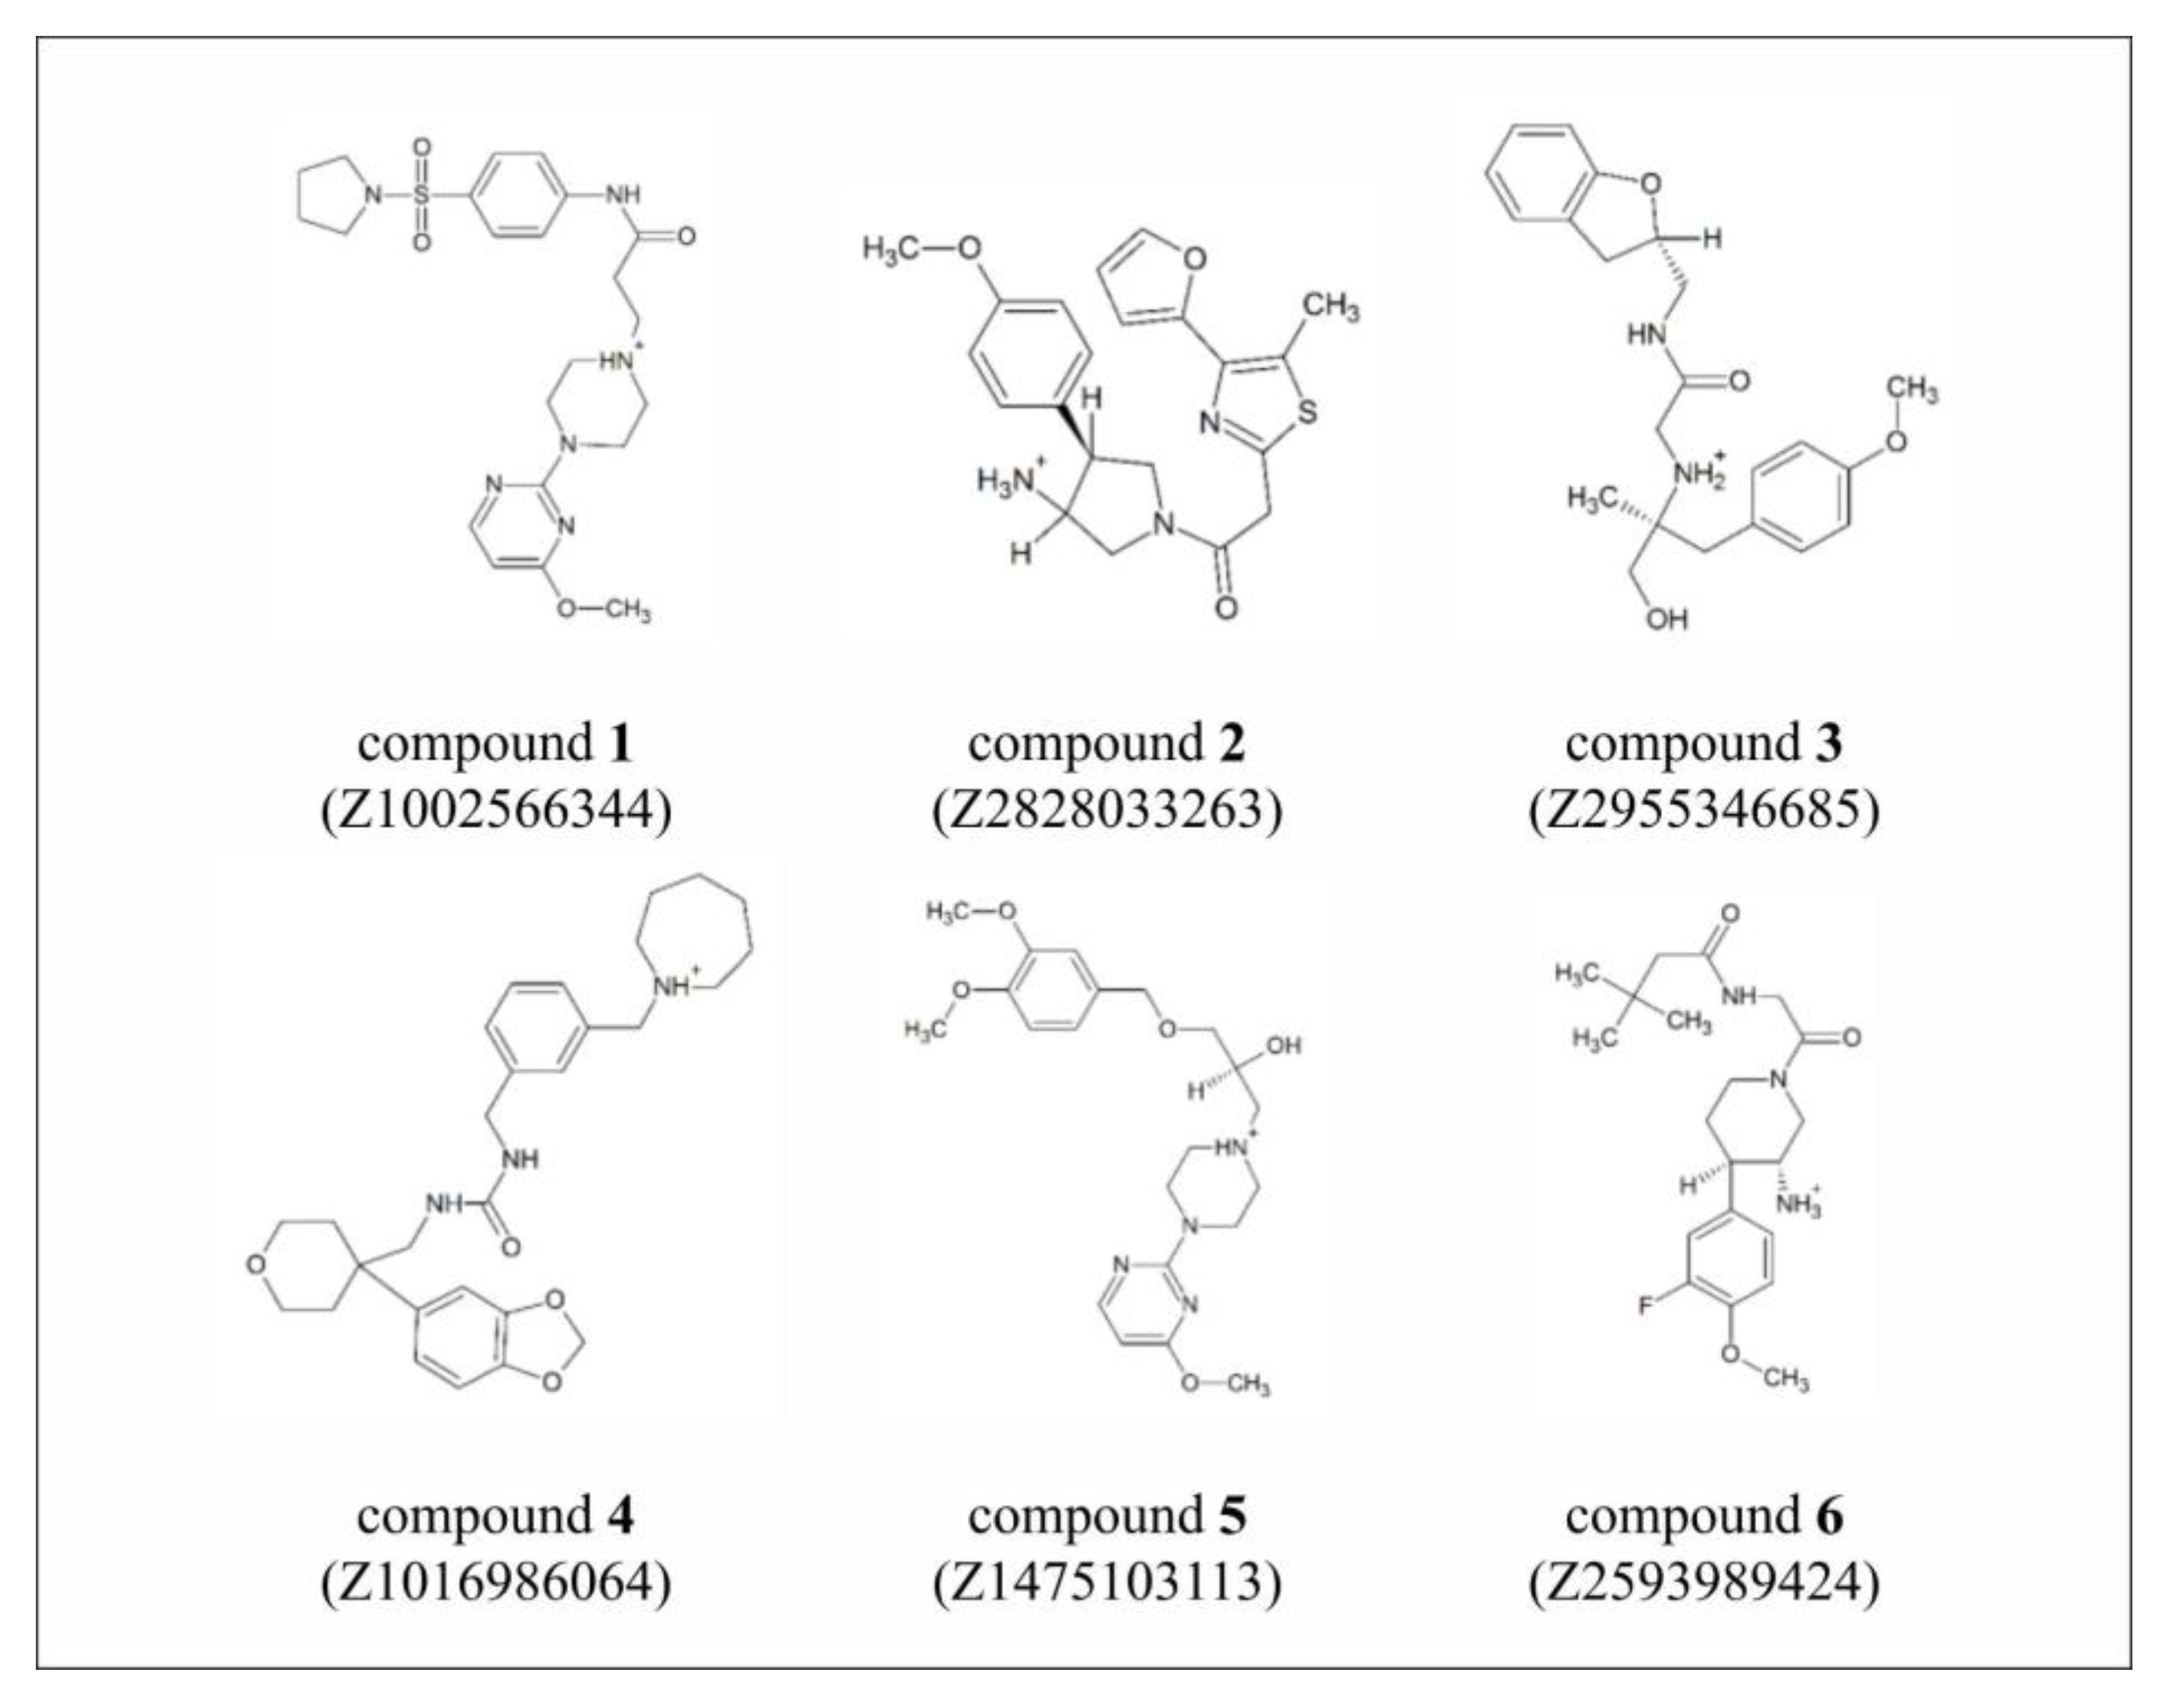
3.2. Virtual Screening

From the 1,678,724 compounds subjected to screening, only 6891 remained after pharmacophoric search due to having the necessary chemical features. After the first docking analysis, 11 top-ranked compounds interacted with two or more residues of interest (Gly18, Lys19, Ile59, and Asp89); 35 compounds were also chosen, which presented a pose similar to the pharmacophore fitting and formed at least one interaction with the residues of interest. Thus, 46 compounds were submitted to molecular docking by the GOLD 5.1 software.
A visual analysis of the poses of the compounds was performed, examining the interactions between the ligands and the protein. In addition, the poses of the compounds ranked according to the ChemPLP and GOLD Score functions were compared. The predicted binding mode of each ligand in each score function was also evaluated in relation to the previous docking study, which was carried out in the Surflex program. Compounds that did not interact with the residuals of interest and that were predicted to bind in a completely different manner, using ChemPLP, GOLD Score, and Cscore (Surflex) scoring functions, were discarded. After visual inspection, 13 compounds were considered promising, among which six presented remarkably similar poses in the three docking runs, using different scoring functions, and, for this reason, they are here discussed (Figure 5).
All six compounds that showed a high pose similarity in molecular docking studies came from the Enamine repository. The best ranked pose of Compound 1 (Figure 6), according to the ChemPLP scoring function, was rescored and ranked as most favorable by using the GOLD Score function. This ligand has several heteroatoms in its structure (electronegative regions), which is predicted to interact with positive polar regions of the target (Figure 6), such as the methoxy group attached to the pyrimidine ring and the NH group of the amide. In addition, the hydrogen of the amine function is suggested to have a favorable orientation and distance to form an ionic interaction with Asp89. There is also a hydrophobic interaction between the benzene ring and the lipophilic cavity (Figure 7). The volume occupied by this ligand is 420.3558 Å3.
Compound 2 has several points of interaction, such as the ionic interaction between the amine and Asp89. In addition, the methoxy group attached to the aromatic ring in a positive polar region can also be noted, possibly acting as an acceptor for the hydrogen of Gly18 (Figure 6). Hydrophobic interactions have also been identified between the methyl group and the furan ring with a highly lipophilic region, which corresponds to the region occupied by Ile59 (Figure 7). The volume occupied by this ligand is 358.6428 Å3.
The docking simulation suggests that Compound 3 forms a hydrogen bond with Asp89. This residue also appears to form an ionic interaction with the amine. In addition, the oxygen atom from the ether and the ring are in positively charged regions, suggesting polar interactions (Figure 6). Finally, the 2,3-dihydro-benzofuran ring is predicted to fit in a hydrophobic cavity, which favors the occurrence of hydrophobic interactions between the ligand and the target (Figure 7). The volume occupied by this binder is 370.2162 Å3.
Compound 4 has several rings and therefore has more affinity for non-polar regions. It is possible to notice two regions of hydrophobic interactions between the ligand and the target: one involving the aromatic ring and the other related to the seven-membered aliphatic ring containing the amine (Figure 6). Both predicted interactions occur at strongly hydrophobic sites. A polar interaction point can also be identified, involving oxygen from one of the structure’s rings (Figure 7). The volume occupied by this ligand is 460.2759 Å3.
Compound 5 and the Asp89 residue are predicted to form two types of interaction, namely an ionic interaction with the amine and a hydrogen bond, when they behave as acceptors of the hydroxyl H. Furthermore, it is possible to notice the electron pair of the oxygen of the methoxy group predicted to bind in a positively charged cavity, which favors polar interaction between this region of the ligand and the target (Figure 6). There is also a hydrophobic interaction between the aromatic ring and the lipophilic region that covers Ile59 (Figure 7). The volume occupied by this ligand is 386.3404 Å3.
Finally, the docking suggests that Compound 6 forms an ionic interaction with Asp89. The oxygen in one of the amide functions and fluorine are in positively charged regions, thus favoring the occurrence of polar bonds (Figure 6). Regarding non-polar interactions, the probable interaction between the methyl groups and the highly hydrophobic region corresponding to Ile59 was observed (Figure 7). The volume occupied by this ligand is 372.4277 Å3.

3.3. Pharmacokinetic and Toxicity Predictions

The selected compounds were submitted to the admetSAR and ProTox servers to predict pharmacokinetic and toxicity properties (Table 1). All selected molecules had a LogS value between −4 and −2, indicating a satisfactory aqueous solubility for bioavailability and renal excretion [51,52]. The compound’s oral availability was analyzed by using predictions of the permeability in Caco-2 cells [53] and the human intestinal absorption [54]. The ability of drugs to penetrate through membranes is an important feature to be evaluated in drug planning, since it influences the absorption and bioavailability of the active principle. Only Compound 2 was predicted to be permeable in both Caco-2 cells and intestinal cells. All other compounds showed disagreement between the two models of prediction of permeability: compounds predicted to have good intestinal absorption were not predicted to be permeable in Caco-2 cells and vice versa. The predicted permeabilities in Caco-2 presented low confidence predictions (P) compared to the predicted intestinal absorption values, suggesting that perhaps the intestinal absorption predictions are more accurate. Nevertheless, as there was no agreement between the prediction models for most compounds, more in silico and in vitro studies related to permeability are needed to predict oral absorption more accurately. In addition, the compounds from the Enamine library are substances in agreement with the drug-like rules proposed by Lipinski and Veber, with a lipophilic profile that is theoretically optimal for oral bioavailability [55,56,57]. In addition, there are good examples of anticancer drugs administered by administration routes other than oral, including intravenous and intramuscular [58], and there are several formulations designed to improve oral bioavailability, for example, pharmaceutical nanotechnology solutions such as prodrugs, nanoemulsions, dendrimers, micelles, liposomes, solid lipid nanoparticles, and nanoparticles of biodegradable polymers [59]. Furthermore, all of the analyzed compounds were predicted to have an affinity for mitochondria. This result was satisfactory, since the biological target is located in the mitochondrial matrix [3].
Toxicity was assessed by predicting the toxicity class, LD50 [60], and the inhibition potential of the hERG protein, which used two different models [61]. According to the Globally Harmonized System of Classification and Labeling of Chemicals (GHS), the toxicity class and LD50 are parameters that correlate, and both are related to acute oral toxicity (Table 1). To check the reliability of the model, drugs already commercially available were submitted to the server. Nimesulide and paracetamol, for example, showed LD50 values identical to those deposited in the DrugBank [62]. However, one should bear in mind that such drugs may have been used for the construction of the prediction model. Concurrent values were also found for venetoclax. According to the LD50, the toxicity class, and the AMES test [43], all compounds were predicted to be of low toxicity. The carcinogenicity was also assessed by the prediction model used by the server and all compounds were predicted as non-carcinogenic [63]. This property is essential, since an inhibitor of potential therapeutic effect in leukemia is planned. Therefore, it is not desirable for such an inhibitor to be able to promote additional mutations.
Finally, the potential for inhibition of the hERG protein was predicted through two models. The hERG protein is a potassium channel that plays an important role in cardiac repolarization; therefore, its dysfunction can cause arrhythmias and sudden death [64]. All compounds were predicted to be weak hERG-1 inhibitors, and only Compound 3 was predicted to be a hERG-2 non-inhibitor. Additionally, a search was performed in the ChEMBL database [65], and none of the six selected compounds has known experimental data.

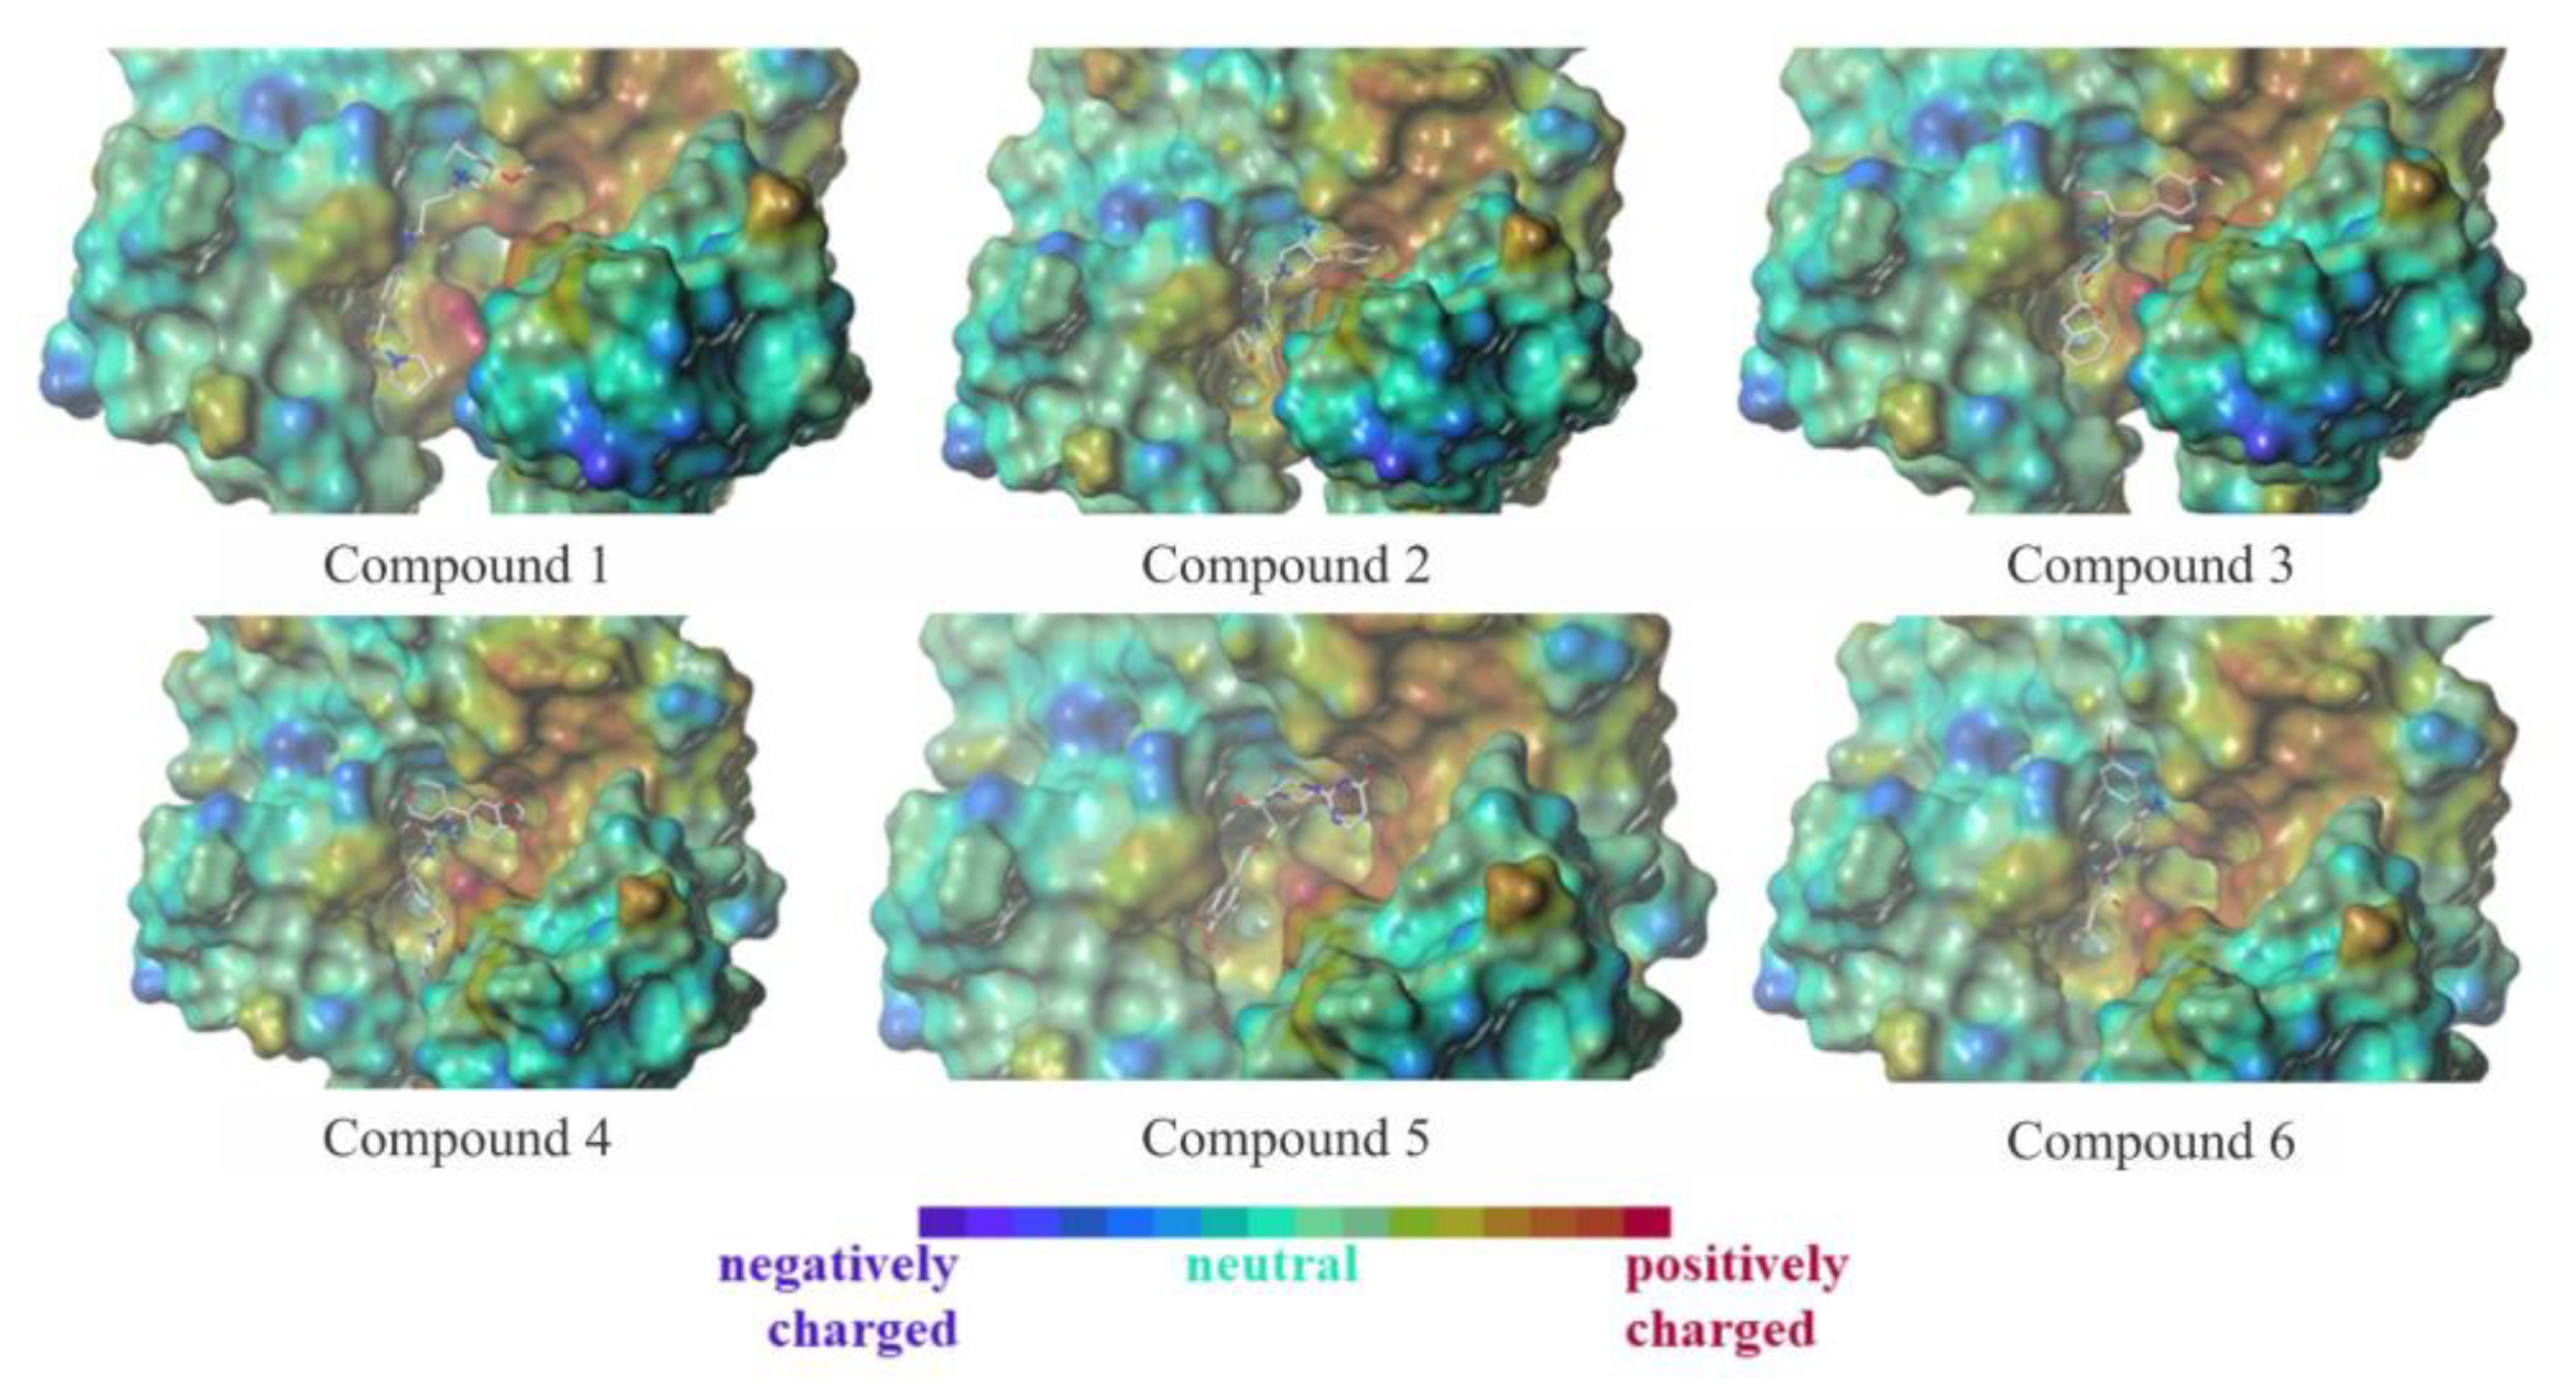
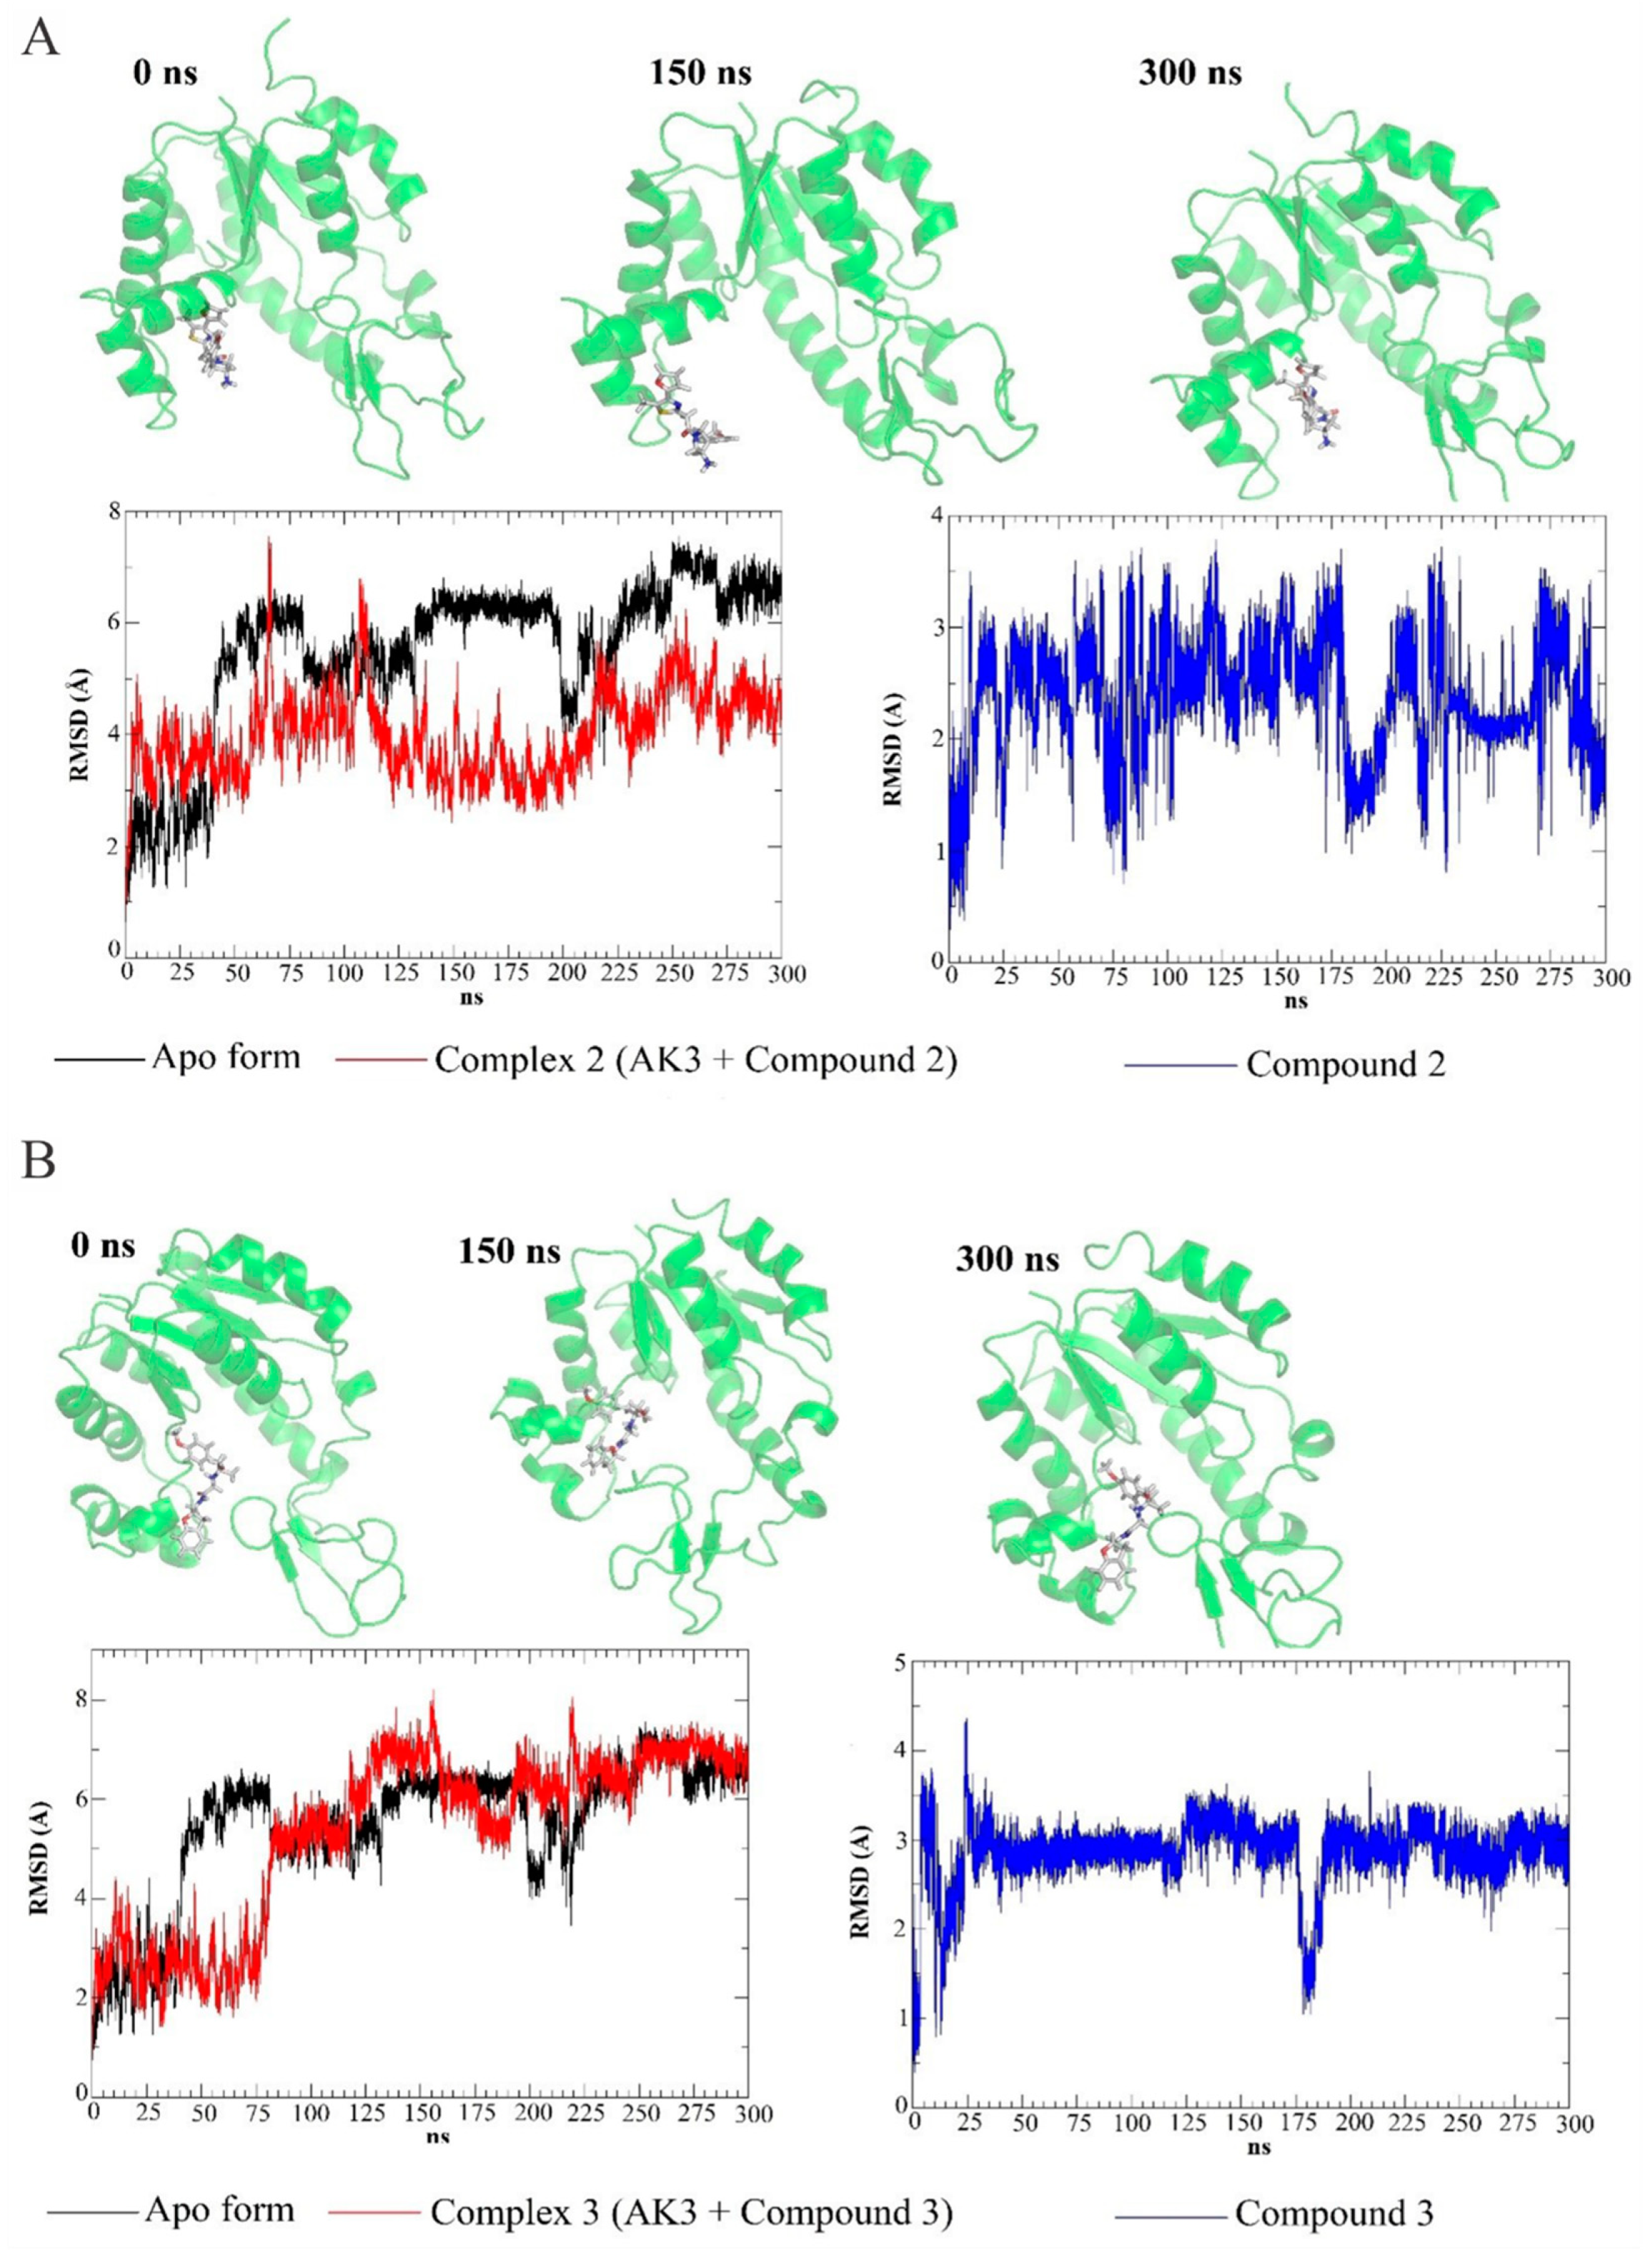
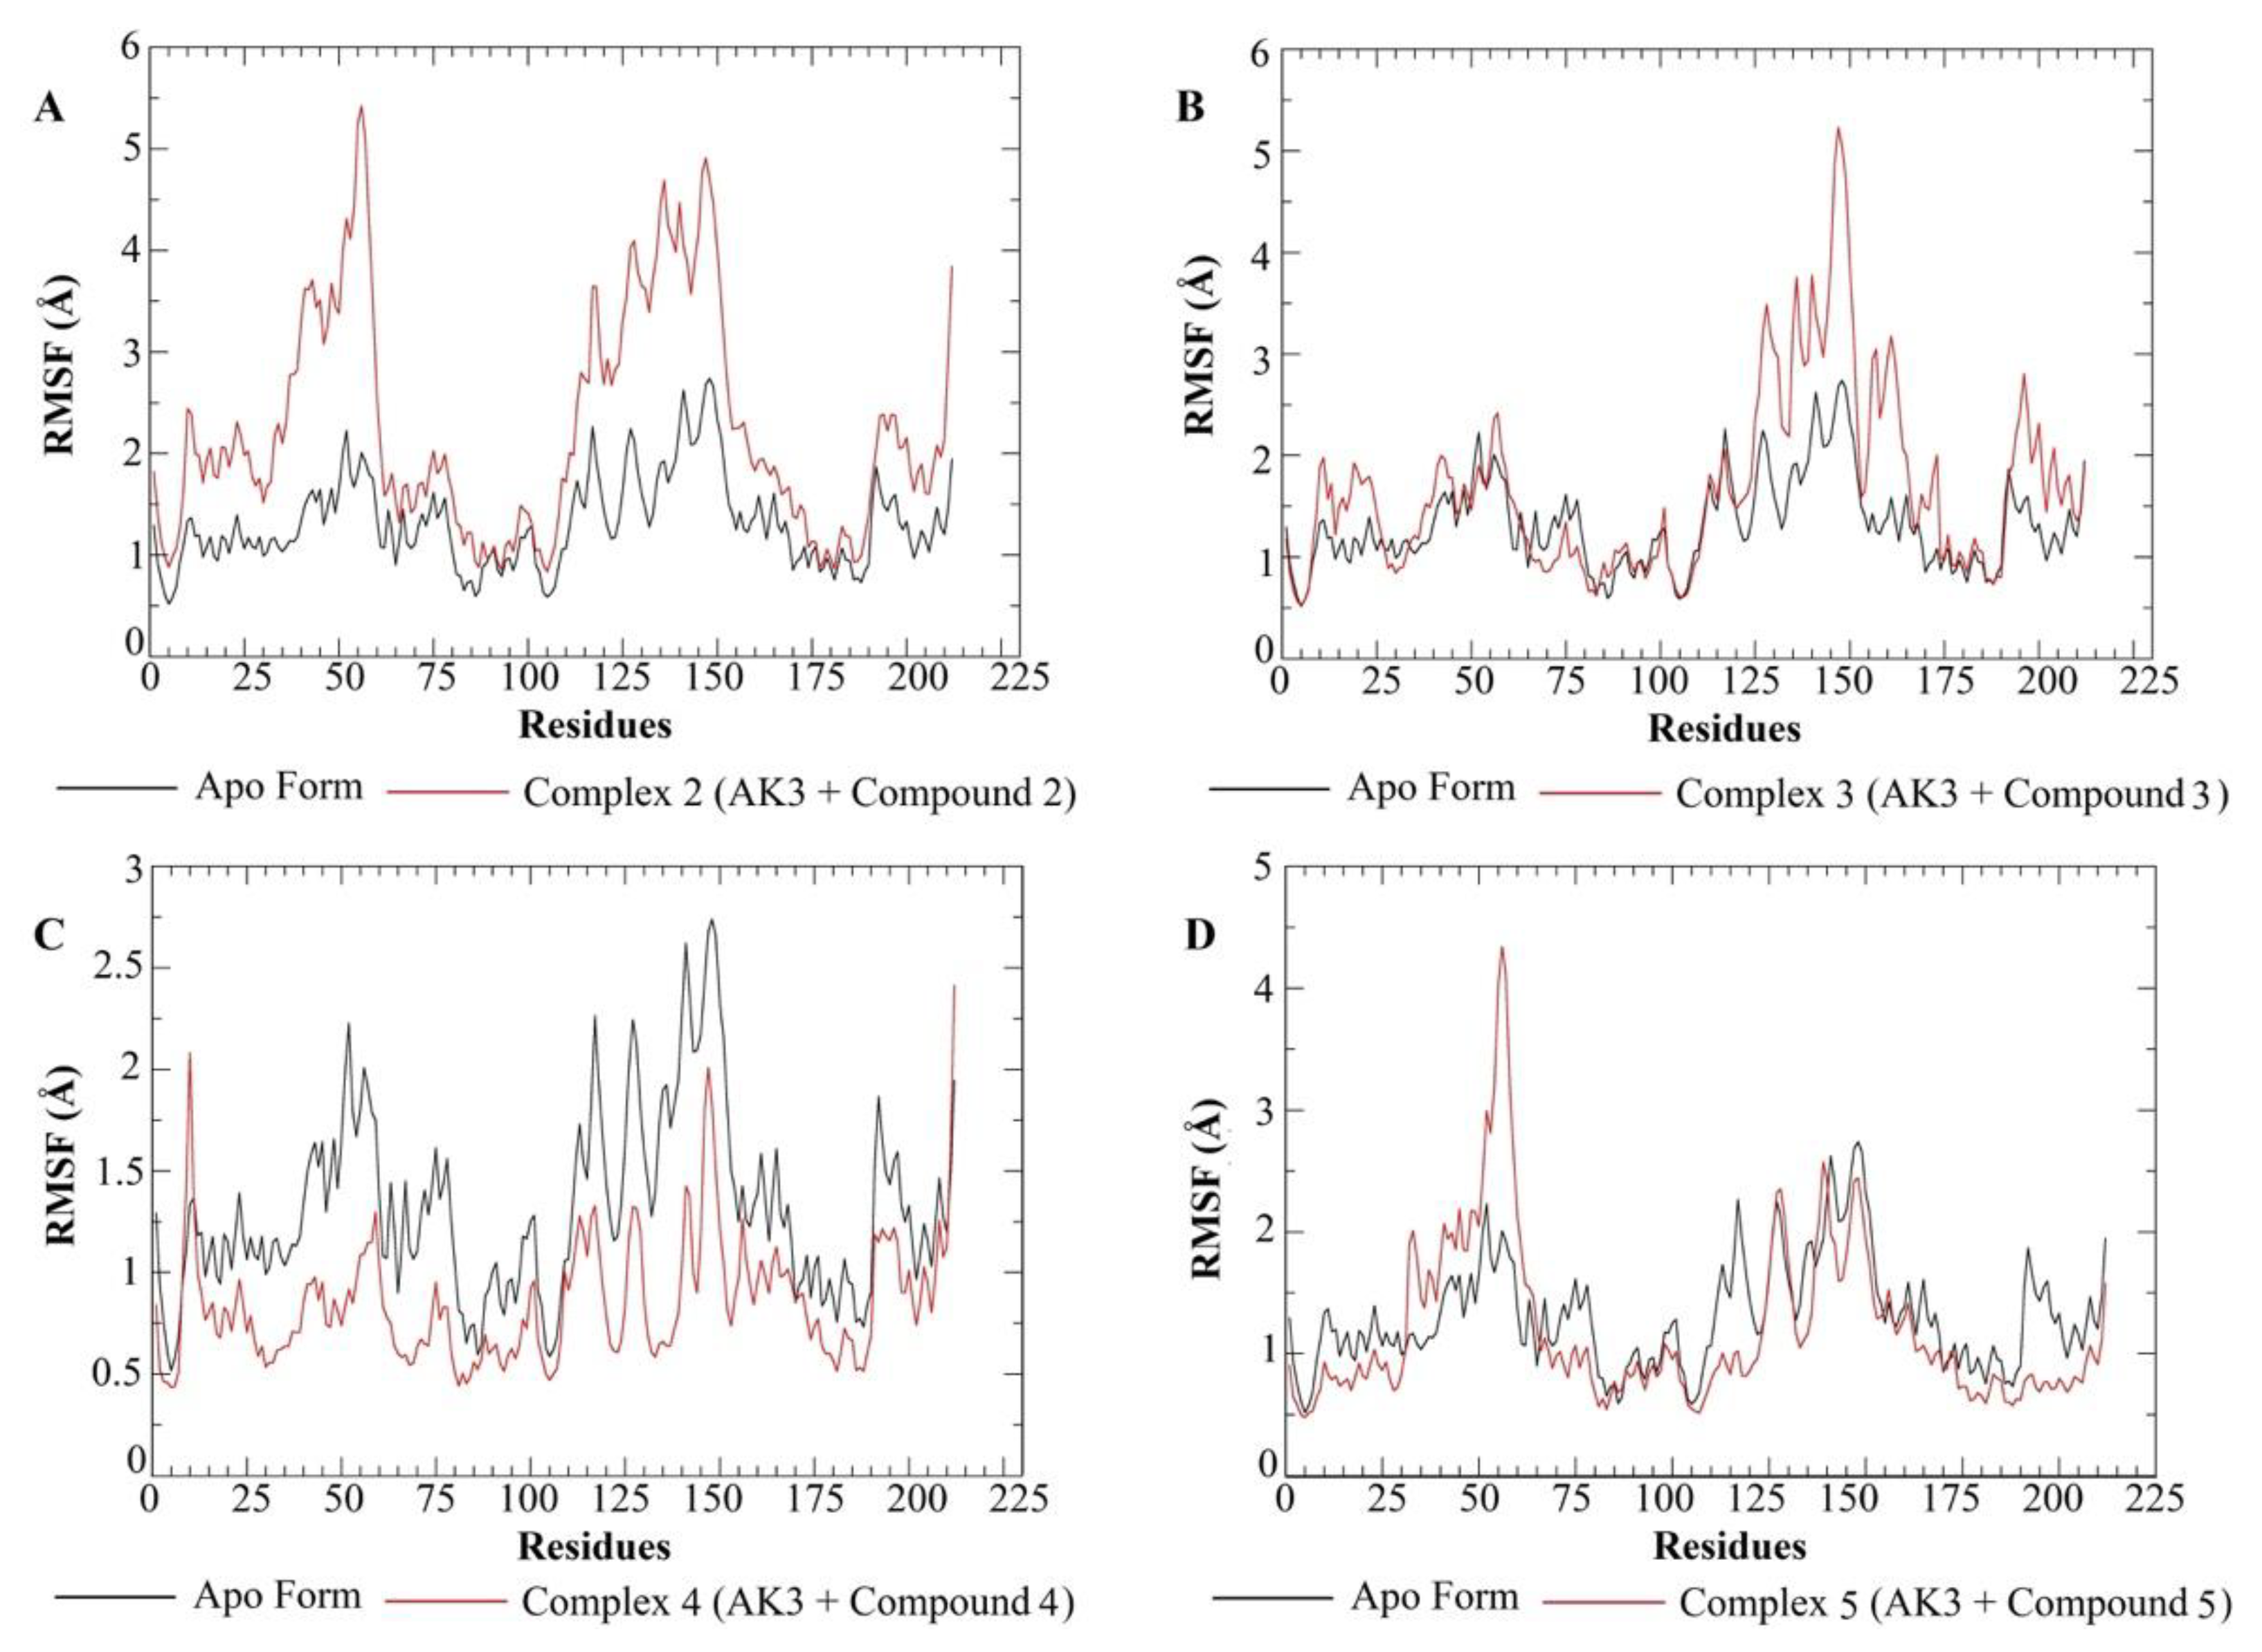
3.4. Molecular Dynamics Simulations

After obtaining the conformations of the six ligands at the AK3 binding site obtained by virtual screening, the molecular dynamics simulations performed throughout the 300 ns, we constructed the RMSD plots of the trajectories (Apo form and complexes), and the conformations of the complexes at 150 and 300 ns are presented in Figure 8 and Figure 9.
Initially, it was possible to obtain the RMSD plots of the complexes (AK3–ligand). In Figure 8 and Figure 9, four graphs are shown, verifying that Compounds 1 and 6 did not stay in the region of the AK3 binding site. These molecules left the active site region in the equilibrium step. The RMSD plots (with the indication of the time the molecules left the site) of these molecules can be seen in the Supplementary Figure S1. Several procedures have been carried out, and the non-permanence of these ligands in the active site suggests that they may be inactive or have low biological activity against the AK3 target.
The RMSD plots show higher flexibility of the AK3–ligand complexes; when the ligands are docked at the AK3 binding site, the target has greater mobility because the target performs conformational changes to couple the ligands at their binding site. Furthermore, Teague [66] shows that the importance of the flexibilization of targets related to drugs is shown, since, from the flexibility of the targets, it can achieve a greater affinity between target and ligand. In this way, it is possible to verify that the four complexes present greater flexibility (mainly the AK3–Compound 2 complex) about the Apo form of the AK3 target. From the four presented RMSD plots (Figure 8 and Figure 9), MD results suggest that the simulated complexes with Compounds 3 and 4 reached structural stability when compared to the Apo enzyme simulation. By comparing ligand RMSD values along the trajectories, we see that Compounds 2 and 5 showed high fluctuations, while Compounds 3 and 4 presented a more consistent positioning when compared to the initial conformations. However, Compound 3’s RMSD profile showed lower variations around 3Å.
Another essential piece of information to be discussed is that the RMSD variations shown in the graphs are high due to the long loop regions presented in the molecular structure of the AK3 target. RMSF plots were also formulated to better understand enzyme mobility, and the data are presented in Figure 10.
The RMSF graphs shown in Figure 10 show the fluctuations of the amino acid residues of AK3 in Apo form and ligands. It is possible to verify that the loop regions present significant movement, possibly showing why the variations of RMSD and RMSF are high. It is also possible to notice that, as shown in the RMSF graphs, the residues between 25 and 75 positions present lower or equal mobility than Apo form when it forms complexes with Compounds 3 and 4. However, both complexes (AK3 and Compounds 3 and 4), which were suggested to have reached structural stability, showed similar RMSF profiles, specifically by reducing the overall movement of amino acids at the 20–30 sequence positions, which were important to ligand binding calculated with the FTMap/GRID analyses.
Thus, from the results obtained by the molecular dynamics simulations, it was possible to verify the mobility of the AK3 target in the presence of the ligands, but these data are not sufficient to suggest which of the ligands may have better interaction with the target. Therefore, an analysis of the intermolecular interactions of ligands in the active site of AK3 was performed. This analysis was made from a stable conformation obtained by RMSD analysis for each complex (the same structures used in the free-energy calculations of binding) and was performed in the Discovery Studio Visualizer program [20]. The results of this analysis are presented in Figure 11.
The results presented in Figure 11 show the intermolecular interactions of the four complexes in the most stable trajectories obtained by the molecular dynamics simulations. These results show the distances and intermolecular interactions of the types: hydrogen bonds; attractive electrostatic interactions and π–cation; and Alkyl, π–Alkyl, and π–π–Alkyl stacked hydrophobic interactions. From Figure 3, it is possible to observe that Compounds 2 and 3, and the most important interactions, are hydrophobic interactions (including Alkyl and π types). In addition, Compound 3 forms a π–cation interaction that is stronger than the others, suggesting a high affinity to AK3.
The analysis of intermolecular interactions corroborates the analysis of the RMSF graphs shown in Figure 10. In these results, it is possible to verify that Compounds 2 and 3 have intermolecular interactions with the Ile59 and Ile65 residues, which most likely contribute to stabilizing the enzyme in these complexes. AK3 and Compound 5 interacts with the Asp89 residue, and the RMSF plot shows that this residue is more stable in the presence of this ligand than in the Apo form. Thus, these data suggest that these compounds are promising for AK3 inhibition. Some interactions shown in the docking results do not appear in the molecular dynamics simulation results, possibly because the ligands are a function of time, and the enzyme, due to the long loops, has great mobility.
Compounds 4 and 5 form ionic interactions with Asp157 and Asp84, respectively. In this sense, the ionic interaction predicted by FTMap and GRID analyses were confirmed by MD analysis from these two compounds. Hence, these compounds potentially inhibit the AK3 enzyme, as the predicted binding mode is similar to that expected during the binding site’s mapping step. Thus, for a better understanding of the activity of the ligands under study, the binding free energy values were estimated by the SIE method.

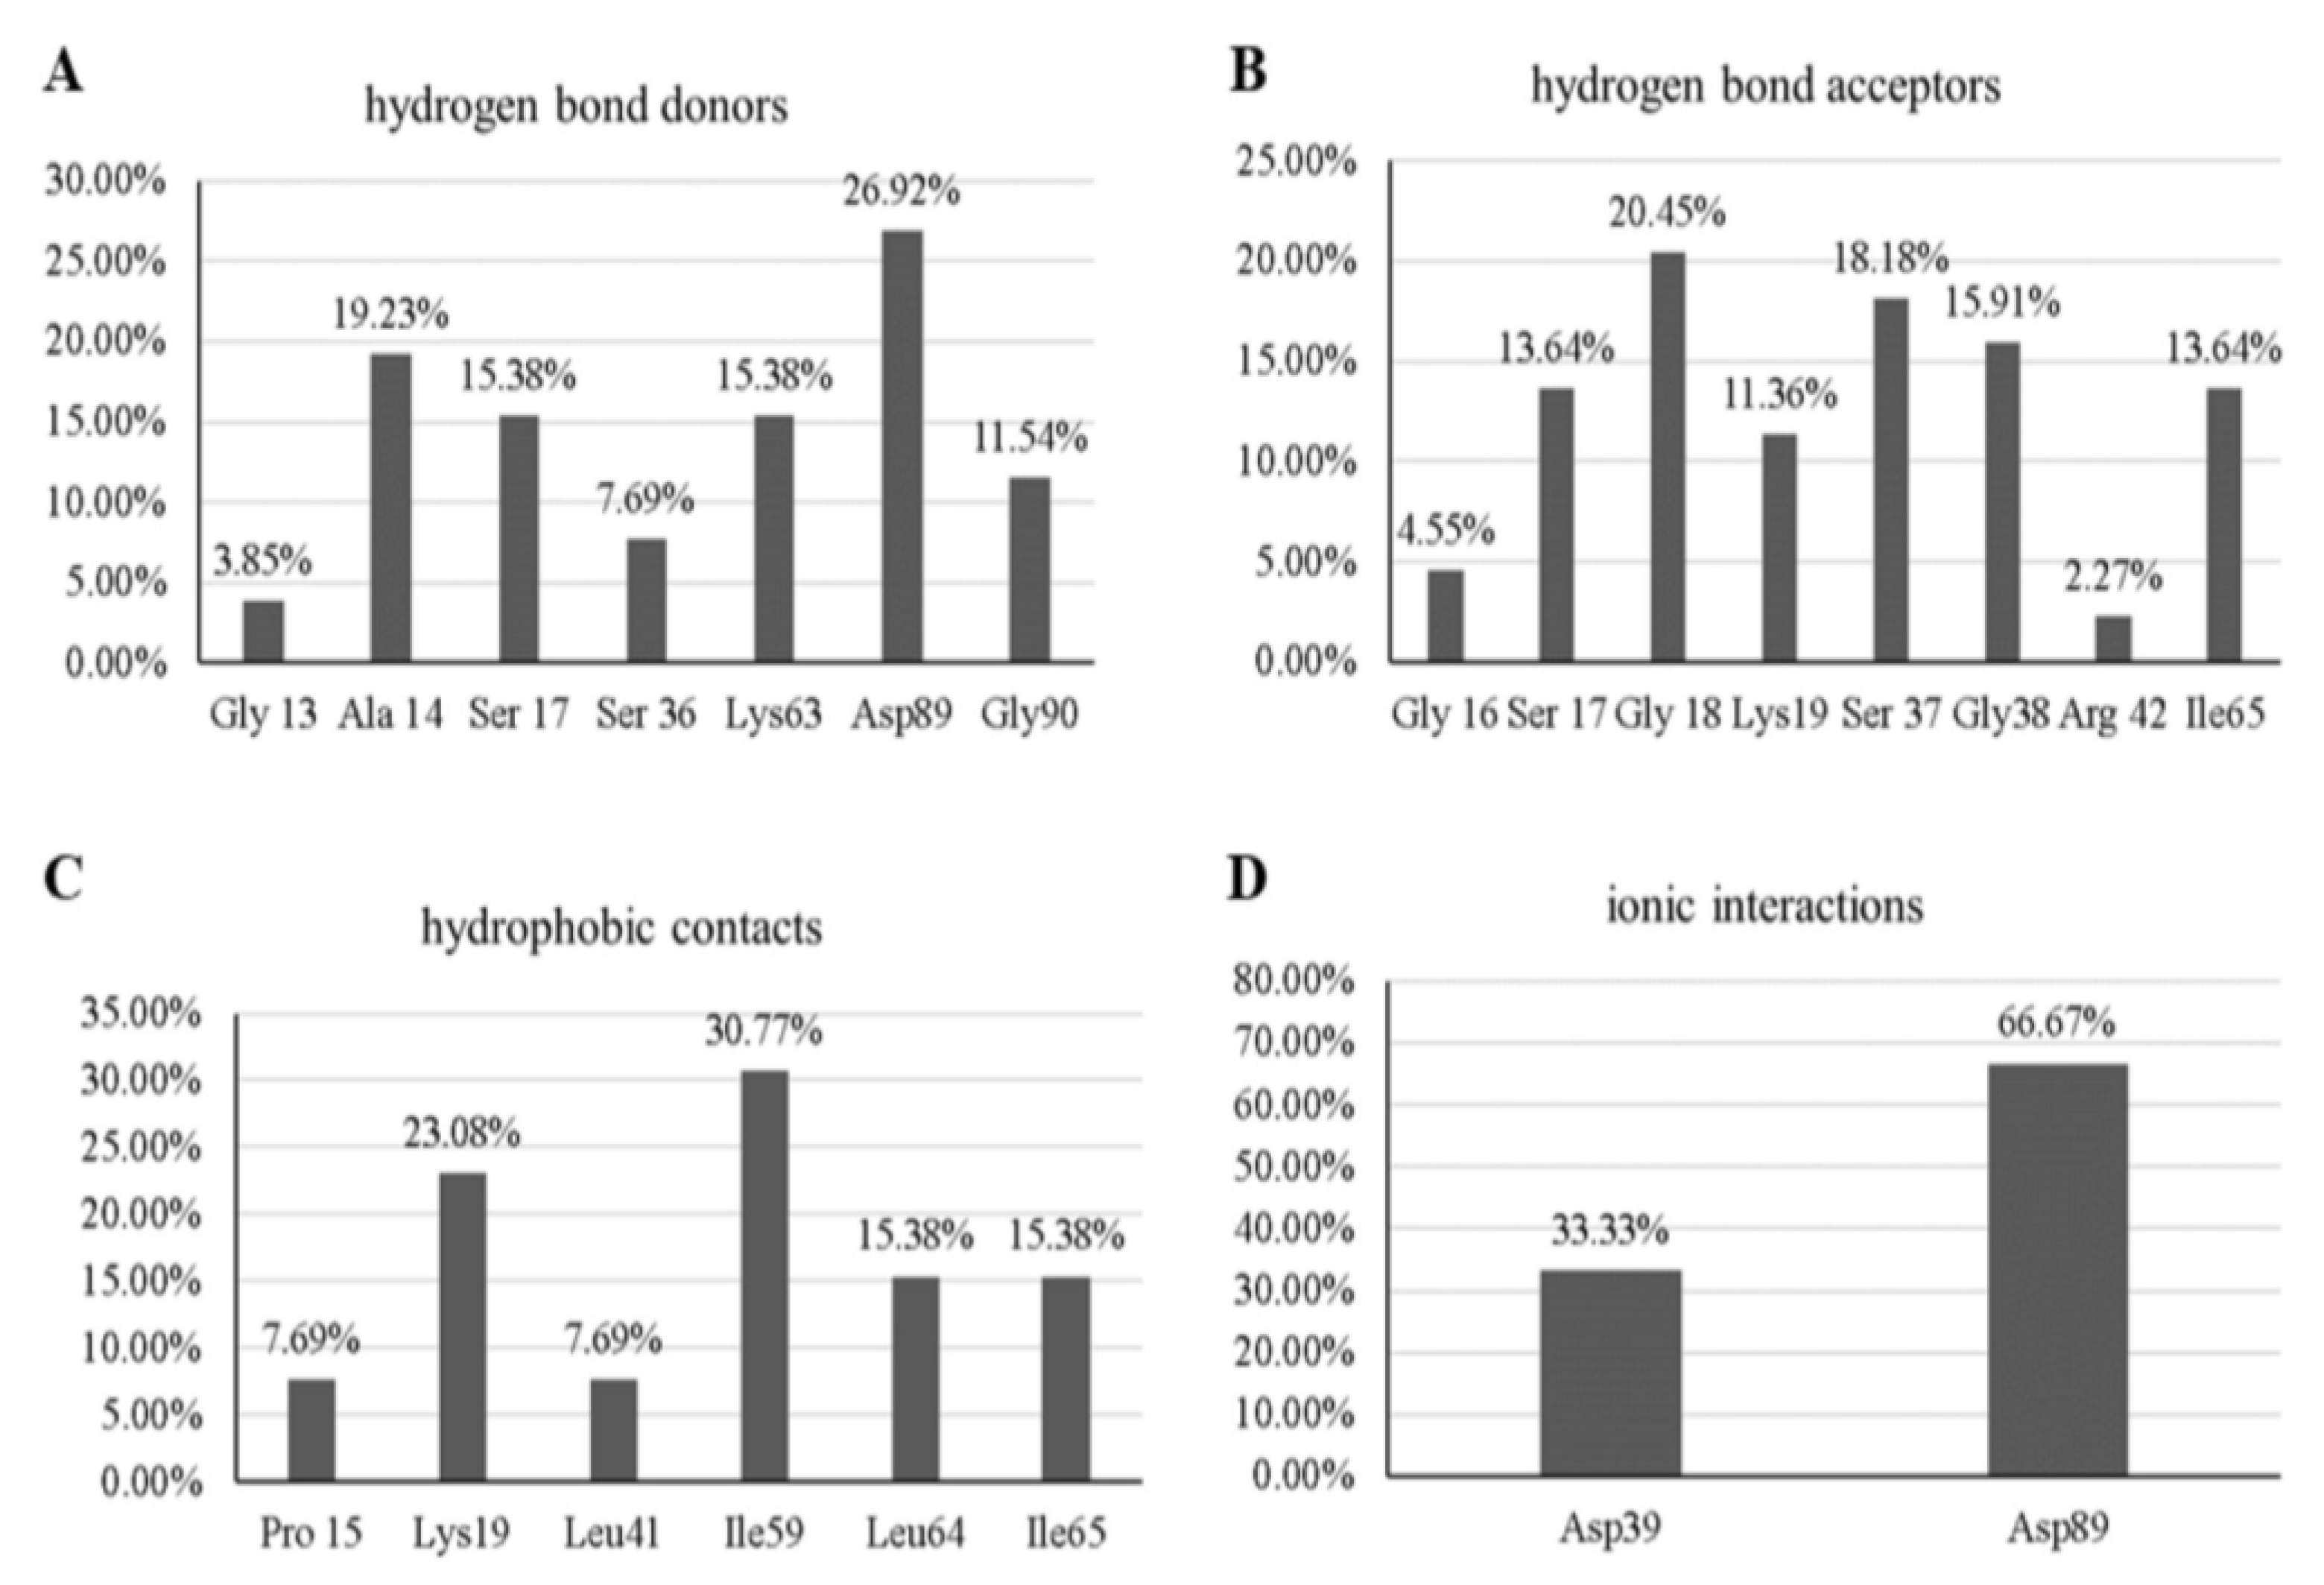
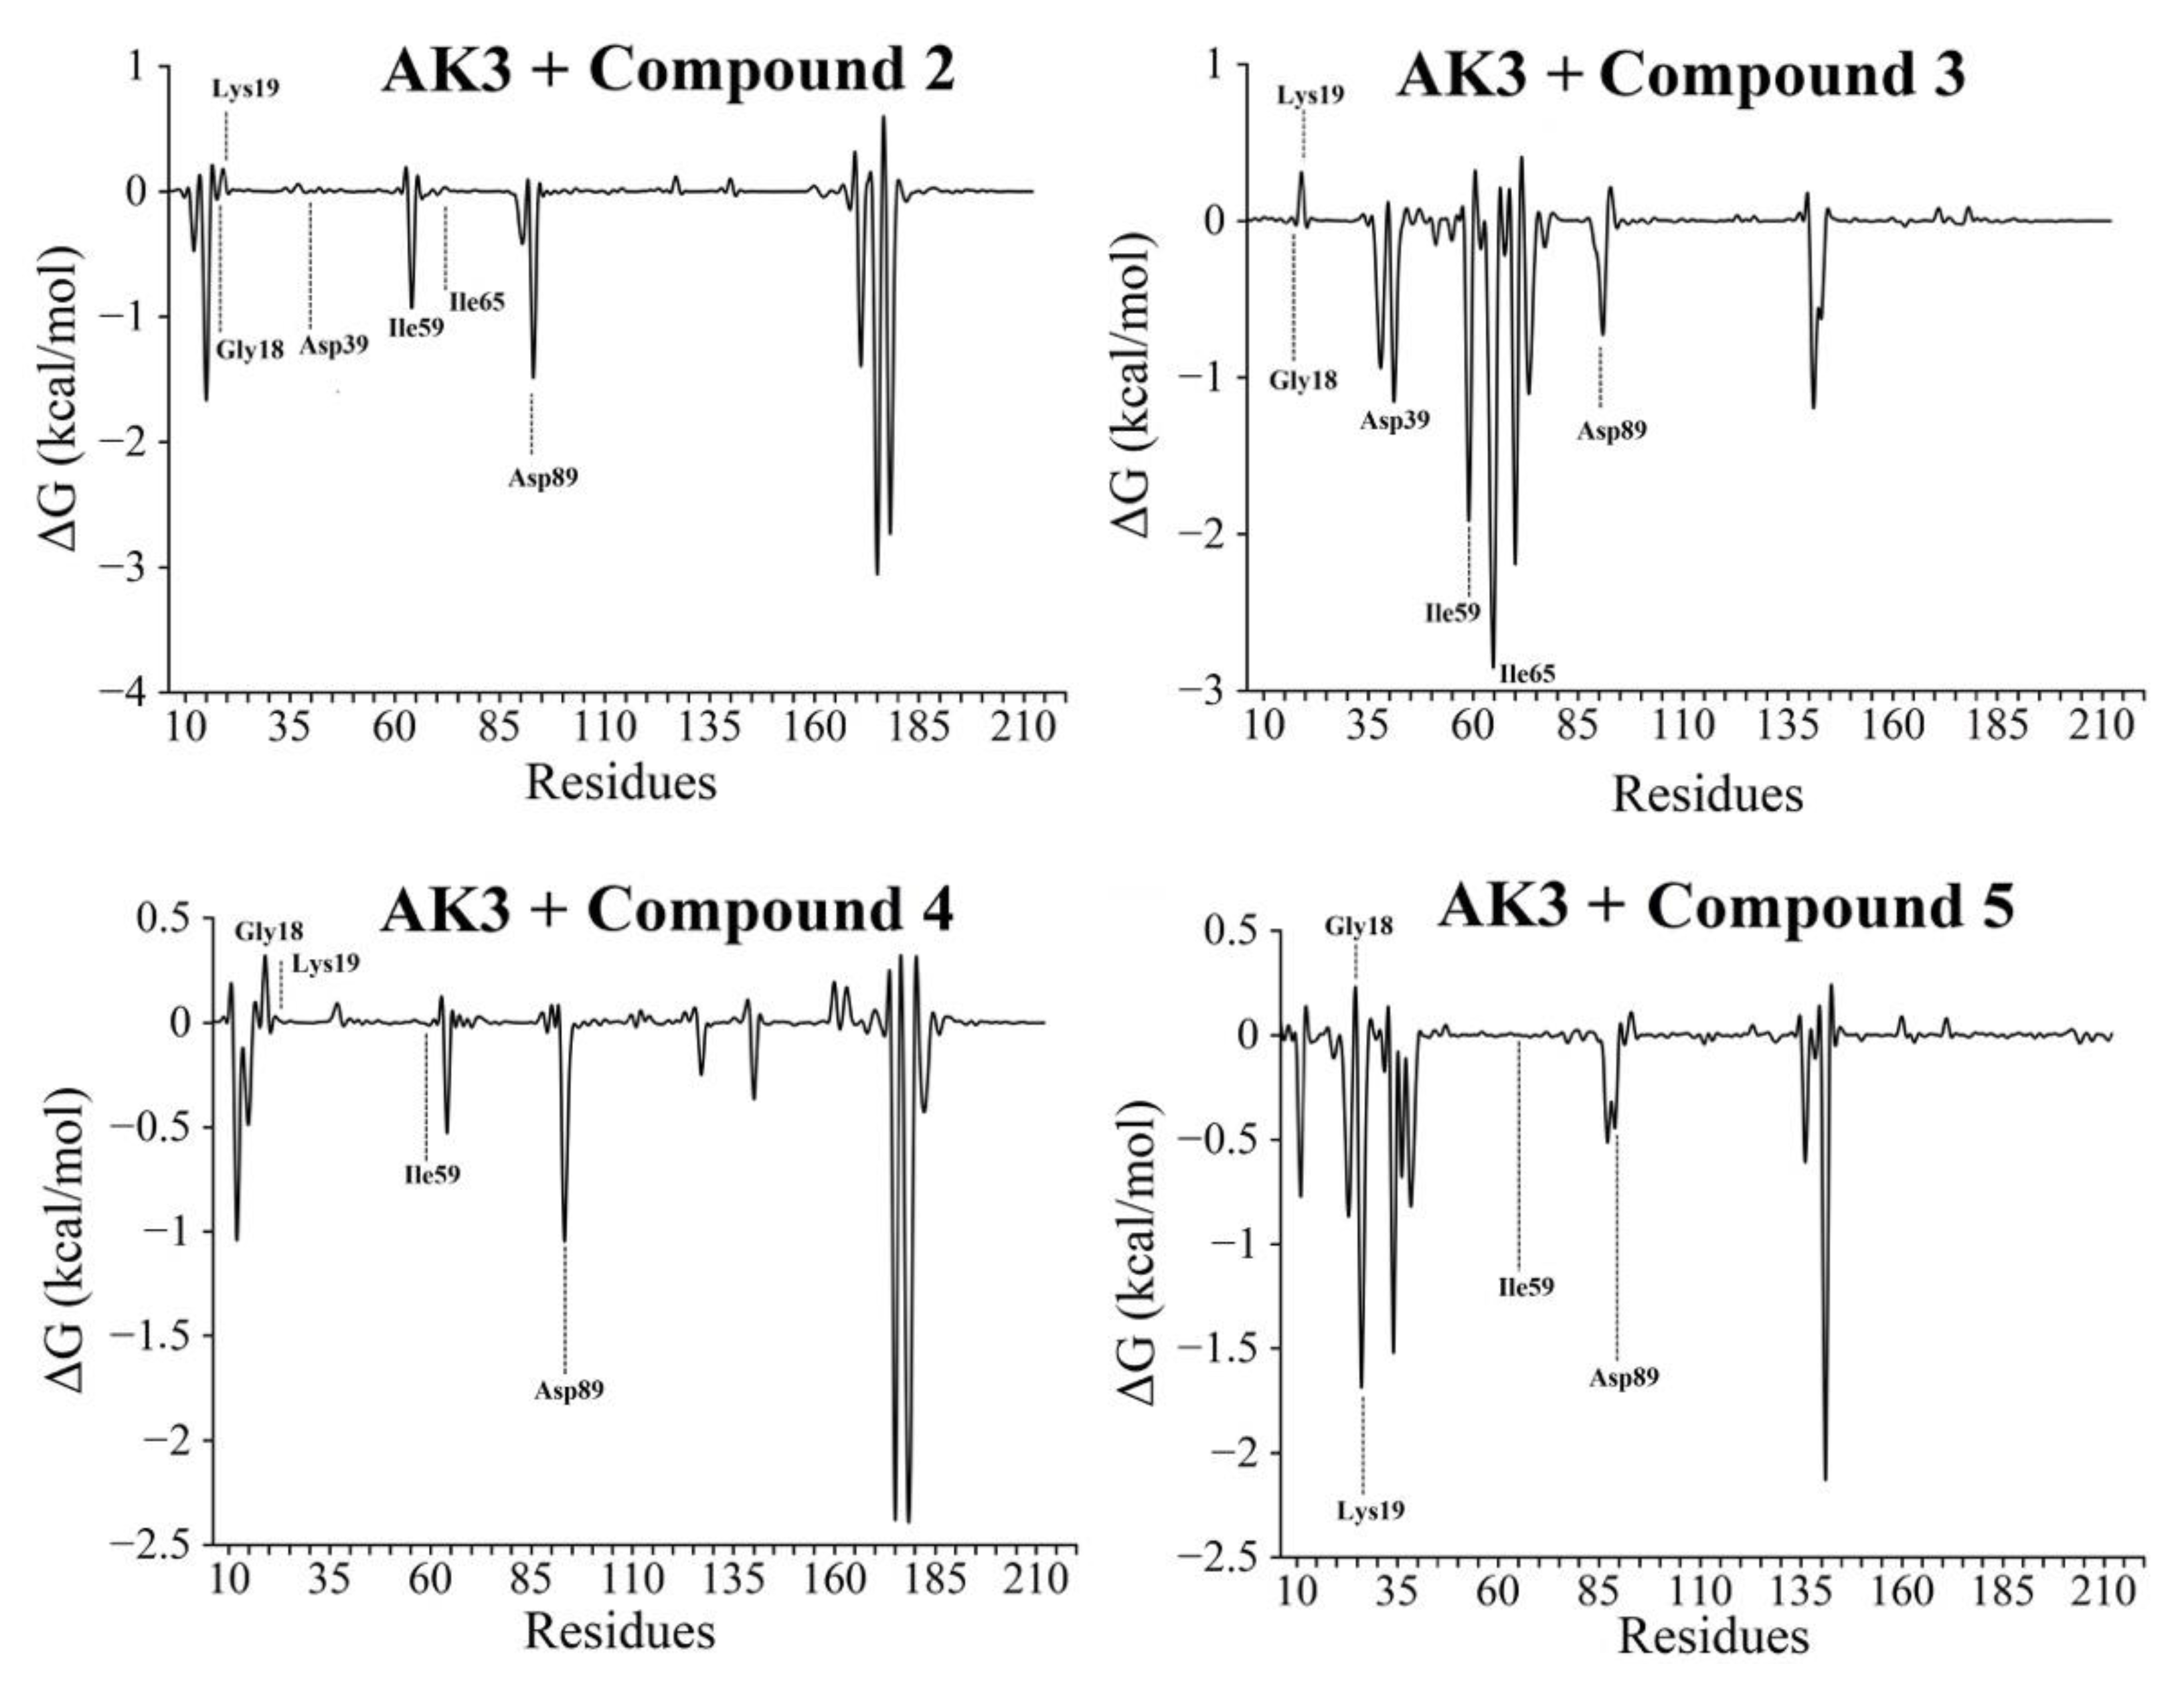
3.5. Free-Energy Calculations

After obtaining the trajectories of AK3 and the complexes of virtual screening hits, the final 200 ns (the sub-trajectory of stable complexes) were employed to calculate the binding free energies, using the SIE method. The obtained values are presented in Table 2.
From Table 2, it is possible to verify the estimated free-energy values for the four studied ligands. The values obtained by the SIE method show that the four ligands may act on the target AK3, and the results obtained suggest that Compounds 3, 4, and 5 have a higher affinity for the AK3 target. However, the difference of energy is relatively small (around 1 kcal/moL). Thus, the estimate of free energy between AK3 and ligands presented in this work suggests that both molecules can inhibit the biological target. After the SIE calculations, free-energy-by-residue-decomposition calculations were performed for a better understanding of the interactions between AK3 and the ligands.
The more stable trajectories used in the SIE calculations were also used to estimate the values of free energy by residue decomposition. Thus, from Figure 12, it is possible to verify the attractive and repulsive contributions of each amino acid residue about the studied ligands.
From the graphs shown in Figure 12, it is possible to verify the behavior of AK3 residues in the presence of ligands in their active site. The results show that, for the essential residues shown in the molecular docking simulations, the Asp89 residues present attractive contributions to the ligands in all cases, while the Ile59 presented an attractive interaction with Compounds 2 and 3. For the Lys19 residue, it is possible to verify that the contribution is attractive only for Compound 5. These results corroborate those obtained by the SIE method, as these two ligands present a more significant number of attractive contributions concerning essential residues. Therefore, from the free-energy calculations (SIE and decomposition by residues), it was possible to estimate the action of the ligands under study regarding the AK3 target.
Finally, computer-aided drug-planning methodologies, including approaches based on the structure of the molecular target, are widely used in the process of discovering compounds with biological activity. The availability of the three-dimensional structure of the biological target and the absence of known inhibitors were facts that led to the choice of an SBDD strategy. In this work, the crystallographic structure of the AK3 enzyme was used as a starting point in the search for ligands with the potential to inhibit it. This protein has recently been associated with CLL, and, although its role in the progression of the disease has not yet been fully elucidated, experimental evidence places it as a potential target for the development of therapies.
Molecular modeling techniques, such as virtual screening employing a pharmacophoric model and molecular docking studies, have been successfully conducted in the search for compounds with the potential to bind to the AK3 active site. The use of more than one docking program was of great importance in predicting the pose of the ligands at the receptor site, since it enabled the selection of compounds with the same theoretical binding mode predicted by different methods.
By predicting pharmacokinetic and toxicity properties, 11 compounds have shown promise for future tests. Among them, six compounds were chosen for acquisition or synthesis, as they satisfy the criteria established by docking studies and satisfactory pharmacokinetic properties. Compound 3 was considered the most promising in this study. In addition to interacting with the residues of interest in the predicted binding site of AK3 and presenting similar poses in all docking simulations, this compound has good oral absorption properties and low toxicity, according to the prediction models.

4. Limitations Section

The first limitation is that our work is an in silico pipeline, and, naturally, it requires experimental validation of the findings. Of course, we employed several stages of predictions (binding site mapping, pharmacophore search, three different docking protocols, molecular dynamics, and binding energy calculations) to decrease, as much as possible, the intrinsic error of the virtual screening campaign. The second limitation is that there is no known AK3 ligand to perform any kind of comparison in molecular docking and molecular dynamics simulations which led us to use filters and visual inspection solely based on empirical findings from computational studies.

5. Conclusions

The AK3 enzyme has been considered an important target to the chronic lymphocytic leukemia treatment. Therefore, the mapping of the most important amino acid residues to interact with a potential inhibitor was performed, followed by a pharmacophore model construction. After, a virtual screening campaign was carried out that combined a pharmacophore search, docking studies, pharmacokinetic and toxicity profile predictions, and molecular dynamics simulations. From the selected hits, Compound 3 was predicted to have the highest affinity according to free energy calculations, as well as the most suitable profile against hERG inhibition. Since the CLL is considered an incurable disease and evidence in the literature points to the therapeutic potential of the AK3 enzyme, continued research on the role of this enzyme and its potential target for the development of CLL therapies looks promising.

Supplementary Materials

The following are available online at https://www.mdpi.com/article/10.3390/futurepharmacol1010006/s1. Figure S1: RMSD graphs of the equilibration steps of ligands 1 and 6 in the AK3 biding site.

Author Contributions

Conceptualization, V.G.M., and A.d.P.S.; methodology, V.G.M., A.d.P.S., and B.L.F.B.; software, V.G.M., M.d.O.A., and B.L.F.B.; validation, B.L.F.B.; formal analysis, V.G.M., and A.d.P.S.; investigation, B.L.F.B., A.C.A., J.G.F., and G.G.D.; resources, V.G.M., A.d.P.S., and S.S.d.S.A.; data curation, B.L.F.B. and T.R.F.; writing—original draft preparation, B.L.F.B. and T.R.F.; writing—review and editing, V.G.M. and A.d.P.S.; visualization, A.d.P.S.; supervision, V.G.M. and A.d.P.S.; project administration, A.d.P.S.; funding acquisition, V.G.M. and A.d.P.S. All authors have read and agreed to the published version of the manuscript.

Funding

This work was supported by the Conselho Nacional de Desenvolvimento Científico e Tecnológico (CNPq), Fundação de Amparo à Pesquisa do Estado de Minas Gerais (FAPEMIG) and Coordenação de Aperfeiçoamento de Pessoal de Nível Superior (CAPES).

Acknowledgments

The authors would like to thank OpenEye Scientific Software for the OMEGA and QUACPAC academic licenses.

Conflicts of Interest

The authors declare no conflict of interest.

References

  1. Noma, T. Dynamics of nucleotide metabolism as a supporter of life phenomena. J. Med. Investig. 2005, 52, 127–136. [Google Scholar] [CrossRef] [Green Version]
  2. Panayiotou, C.; Solaroli, N.; Karlsson, A. The many isoforms of human adenylate kinases. Int. J. Biochem. Cell Biol. 2014, 49, 75–83. [Google Scholar] [CrossRef]
  3. Noma, T.; Fujisawa, K.; Yamashiro, Y.; Shinohara, M.; Nakazawa, A.; Gondo, T.; Ishihara, T.; Yoshinobu, K. Structure and expression of human mitochondrial adenylate kinase targeted to the mitochondrial matrix. Biochem. J. 2001, 358, 225–232. [Google Scholar] [CrossRef] [PubMed]
  4. Admoni-Elisha, L.; Nakdimon, I.; Shteinfer, A.; Prezma, T.; Arif, T.; Arbel, N.; Melkov, A.; Zelichov, O.; Levi, I.; Shoshan-Barmatz, V. Novel Biomarker Proteins in Chronic Lymphocytic Leukemia: Impact on Diagnosis, Prognosis and Treatment. PLoS ONE 2016, 11, e0148500. [Google Scholar] [CrossRef] [PubMed] [Green Version]
  5. Heraly, B.; Morrison, V.A. How I treat chronic lymphocytic leukemia in older patients. J. Geriatr. Oncol. 2015, 6, 333–340. [Google Scholar] [CrossRef]
  6. Sharma, S.; Rai, K.R. Chronic lymphocytic leukemia (CLL) treatment: So many choices, such great options. Cancer 2019, 125, 1432–1440. [Google Scholar] [CrossRef] [PubMed]
  7. Hallek, M.; Cheson, B.D.; Catovsky, D.; Caligaris-Cappio, F.; Dighiero, G.; Döhner, H.; Hillmen, P.; Keating, M.; Montserrat, E.; Chiorazzi, N.; et al. iwCLL guidelines for diagnosis, indications for treatment, response assessment, and supportive management of CLL. Blood 2018, 131, 2745–2760. [Google Scholar] [CrossRef] [Green Version]
  8. Hallek, M.; Fischer, K.; Fingerle-Rowson, G.; Fink, A.; Busch, R.; Mayer, J.; Hensel, M.; Hopfinger, G.; Hess, G.; von Grünhagen, U.; et al. Addition of rituximab to fludarabine and cyclophosphamide in patients with chronic lymphocytic leukaemia: A randomised, open-label, phase 3 trial. Lancet 2010, 376, 1164–1174. [Google Scholar] [CrossRef]
  9. Tam, C.S.; O’Brien, S.; Wierda, W.; Kantarjian, H.; Wen, S.; Do, K.-A.; Thomas, D.A.; Cortes, J.; Lerner, S.; Keating, M.J. Long-term results of the fludarabine, cyclophosphamide, and rituximab regimen as initial therapy of chronic lymphocytic leukemia. Blood 2008, 112, 975–980. [Google Scholar] [CrossRef] [PubMed] [Green Version]
  10. Owen, C.; Assouline, S.; Kuruvilla, J.; Uchida, C.; Bellingham, C.; Sehn, L. Novel Therapies for Chronic Lymphocytic Leukemia: A Canadian Perspective. Clin. Lymphoma Myeloma Leuk. 2015, 15, 627–634. [Google Scholar] [CrossRef] [PubMed]
  11. Arockianathan, P.M.; Rajalakshmi, K.; Nagappan, P. Proximate composition, phytochemicals, minerals and antioxidant activities of Vigna mungo L. seed coat. Bioinformation 2019, 15, 579–585. [Google Scholar] [CrossRef] [PubMed] [Green Version]
  12. Prada-Gracia, D.; Huerta-Yépez, S.; Moreno-Vargas, L.M. Application of computational methods for anticancer drug discovery, design, and optimization. Boletín Médico Del Hosp. Infant. De México (Engl. Ed.) 2016, 73, 411–423. [Google Scholar] [CrossRef]
  13. Xu, G.; Chen, Y.; Shen, K.; Wang, X.; Li, F.; He, Y. The Discovery of Potentially Selective Human Neuronal Nitric Oxide Synthase (nNOS) Inhibitors: A Combination of Pharmacophore Modelling, CoMFA, Virtual Screening and Molecular Docking Studies. Int. J. Mol. Sci. 2014, 15, 8553–8569. [Google Scholar] [CrossRef] [PubMed] [Green Version]
  14. Peach, M.L.; Nicklaus, M.C. Combining docking with pharmacophore filtering for improved virtual screening. J. Chemin 2009, 1, 6. [Google Scholar] [CrossRef] [Green Version]
  15. Tian, S.; Sun, H.; Li, Y.; Pan, P.; Li, D.; Hou, T. Development and Evaluation of an Integrated Virtual Screening Strategy by Combining Molecular Docking and Pharmacophore Searching Based on Multiple Protein Structures. J. Chem. Inf. Model. 2013, 53, 2743–2756. [Google Scholar] [CrossRef] [PubMed]
  16. Kitchen, D.; Decornez, H.; Furr, J.R.; Bajorath, J. Docking and scoring in virtual screening for drug discovery: Methods and applications. Nat. Rev. Drug Discov. 2004, 3, 935–949. [Google Scholar] [CrossRef]
  17. RCSB PDB—1ZD8, Structure of Human Adenylate Kinase 3 Like 1. Available online: https://www.rcsb.org/structure/1ZD8 (accessed on 27 June 2021).
  18. Ngan, C.-H.; Hall, D.R.; Zerbe, B.S.; Grove, L.E.; Kozakov, D.; Vajda, S. FTSite: High accuracy detection of ligand binding sites on unbound protein structures. Bioinformatics 2011, 28, 286–287. [Google Scholar] [CrossRef]
  19. Ngan, C.H.; Bohnuud, T.; Mottarella, S.E.; Beglov, D.; Villar, E.A.; Hall, D.R.; Kozakov, D.; Vajda, S. FTMAP: Extended protein mapping with user-selected probe molecules. Nucleic Acids Res. 2012, 40, W271–W275. [Google Scholar] [CrossRef] [PubMed]
  20. Dassault Systèmes Biovia. Discovery Studio Modeling Environment; Dassault Systèmes: San Diego, CA, USA, 2017. [Google Scholar]
  21. Pantaleão, S.Q.; Philot, E.A.; De Resende-Lara, P.T.; Lima, A.N.; Perahia, D.; Miteva, M.A.; Scott, A.L.; Honorio, K.M. Structural Dynamics of DPP-4 and Its Influence on the Projection of Bioactive Ligands. Molecules 2018, 23, 490. [Google Scholar] [CrossRef] [Green Version]
  22. Seeliger, D.; De Groot, B.L. Ligand docking and binding site analysis with PyMOL and Autodock/Vina. J. Comput. Mol. Des. 2010, 24, 417–422. [Google Scholar] [CrossRef] [Green Version]
  23. Kronenberger, T.; Asse, L.R.J.; Wrenger, C.; Trossini, G.H.G.; Honorio, K.M.; Maltarollo, V.G. Studies of Staphylococcus aureus FabI inhibitors: Fragment-Based approach based on holographic structure–activity relationship analyses. Future Med. Chem. 2017, 9, 135–151. [Google Scholar] [CrossRef]
  24. Maltarollo, V.G.; Araujo, S.C.; Trossini, G.H.G.; Honorio, K.M. Understanding PPAR-δ affinity and selectivity using hologram quantitative structure–activity modeling, molecular docking and GRID calculations. Future Med. Chem. 2016, 8, 1913–1926. [Google Scholar] [CrossRef] [PubMed]
  25. Sybyl 2.1; Tripos: St Louis, MO, USA, 2008.
  26. Halgren, T.A. Merck molecular force field. V. Extension of MMFF94 using experimental data, additional computational data, and empirical rules. J. Comput. Chem. 1996, 17, 616–641. [Google Scholar] [CrossRef]
  27. Veríssimo, G.C.; dos Santos Junior, V.S.; de Almeida, I.A.D.R.; Ruas, M.S.A.M.; Coutinho, L.G.; de Oliveira, R.B.; Maltarollo, V. The Brazilian Compound Library (BraCoLi) database, a Brazilian repository of chemical and biological information for drug design. Biol. Med. Chem. 2021, 1, 1–17. [Google Scholar]
  28. Wishart, D.S.; Feunang, Y.D.; Guo, A.C.; Lo, E.J.; Marcu, A.; Grant, J.R.; Sajed, T.; Johnson, D.; Li, C.; Sayeeda, Z.; et al. DrugBank 5.0: A Major Update to the DrugBank Database for 2018. Nucleic Acids Res. 2018, 46, D1074–D1082. [Google Scholar] [CrossRef]
  29. Pilon, A.; Valli, M.; Dametto, A.C.; Pinto, M.E.F.; Freire, R.T.; Castro-Gamboa, I.; Andricopulo, A.D.; Bolzani, V.S. NuBBEDB: An updated database to uncover chemical and biological information from Brazilian biodiversity. Sci. Rep. 2017, 7, 1–12. [Google Scholar] [CrossRef]
  30. Quacpac. Software Openeye Scientific Inc., Santa Fe, NM, USA. Available online: http://www.eyesopen.com/news/quacpac-v150-released (accessed on 27 November 2020).
  31. Hawkins, P.C.D.; Skillman, A.G.; Warren, G.L.; Ellingson, B.A.; Stahl, M.T. OMEGA 2.5.1.4, OpenEye Scientific Software, Santa Fe, NM, USA. Available online: http://www.eyesopen.com (accessed on 15 February 2018).
  32. Spitzer, R.; Jain, A.N. Surflex-Dock: Docking benchmarks and real-world application. J. Comput. Aided Mol. Des. 2012, 26, 687–699. [Google Scholar] [CrossRef] [PubMed]
  33. Verdonk, M.L.; Cole, J.C.; Hartshorn, M.J.; Murray, C.W.; Taylor, R.D. Improved protein-ligand docking using GOLD. Proteins Struct. Funct. Bioinform. 2003, 52, 609–623. [Google Scholar] [CrossRef]
  34. Yang, H.; Lou, C.; Sun, L.; Li, J.; Cai, Y.; Wang, Z.; Li, W.; Liu, G.; Tang, Y. admetSAR 2.0: Web-service for prediction and optimization of chemical ADMET properties. Bioinformatics 2018, 35, 1067–1069. [Google Scholar] [CrossRef]
  35. Banerjee, P.; O Eckert, A.; Schrey, A.K.; Preissner, R. ProTox-II: A webserver for the prediction of toxicity of chemicals. Nucleic Acids Res. 2018, 46, W257–W263. [Google Scholar] [CrossRef] [PubMed] [Green Version]
  36. Echenique, P.; Alonso, J.L.; Echenique-Robba, P. A mathematical and computational review of Hartree–Fock SCF methods in quantum chemistry. Mol. Phys. 2007, 105, 3057–3098. [Google Scholar] [CrossRef] [Green Version]
  37. Ditchfield, R.; Hehre, W.J.; Pople, J.A. Self-Consistent Molecular-Orbital Methods. IX. An Extended Gaussian-Type Basis for Molecular-Orbital Studies of Organic Molecules. J. Chem. Phys. 1971, 54, 724–728. [Google Scholar] [CrossRef]
  38. Frisch, M.J.; Trucks, G.W.; Schlegel, H.B.; Scuseria, G.E.; Robb, M.A.; Cheeseman, J.R.; Scalmani, G.; Barone, V.; Mennucci, B.; Petersson, G.A. Gaussian 09, Revision a. 1; Gaussian. Inc.: Wallingford, CT, USA, 2009. [Google Scholar]
  39. Case IYB-S, D.A.; Brozell, S.R.; Cerutti, D.S.; Cheatham, T.E.; Cruzeiro, V.W.D., III; Darden, T.A.; Duke, R.E.; Gilson, M.K.; Gohlke, H.; Goetz, A.W.; et al. AMBER 2018; University of California: San Francisco, CA, USA, 2018. [Google Scholar]
  40. Pettersen, E.F.; Goddard, T.D.; Huang, C.C.; Couch, G.S.; Greenblatt, D.M.; Meng, E.C.; Ferrin, T. UCSF Chimera?A visualization system for exploratory research and analysis. J. Comput. Chem. 2004, 25, 1605–1612. [Google Scholar] [CrossRef] [PubMed] [Green Version]
  41. Case, D.A.; Cheatham, T.E.; Darden, T.; Gohlke, H.; Luo, R.; Merz, K.M.; Onufriev, A.; Simmerling, C.; Wang, B.; Woods, R.J. The Amber biomolecular simulation programs. J. Comput. Chem. 2005, 26, 1668–1688. [Google Scholar] [CrossRef] [PubMed] [Green Version]
  42. Hornak, V.; Abel, R.; Okur, A.; Strockbine, B.; Roitberg, A.; Simmerling, C. Comparison of multiple Amber force fields and development of improved protein backbone parameters. Proteins Struct. Funct. Bioinform. 2006, 65, 712–725. [Google Scholar] [CrossRef] [Green Version]
  43. Lindorff-Larsen, K.; Piana, S.; Palmo, K.; Maragakis, P.; Klepeis, J.L.; Dror, R.O.; Shaw, D.E. Improved side-chain torsion potentials for the Amber ff99SB protein force field. Proteins: Struct. Funct. Bioinform. 2010, 78, 1950–1958. [Google Scholar] [CrossRef] [PubMed] [Green Version]
  44. Naïm, M.; Bhat, S.; Rankin, K.N.; Dennis, S.; Chowdhury, S.F.; Siddiqi, I.; Drabik, P.; Sulea, T.; Bayly, C.I.; Jakalian, A.; et al. Solvated Interaction Energy (SIE) for Scoring Protein−Ligand Binding Affinities. 1. Exploring the Parameter Space. J. Chem. Inf. Model. 2007, 47, 122–133. [Google Scholar] [CrossRef]
  45. Lill, M.A.; Thompson, J.J. Solvent Interaction Energy Calculations on Molecular Dynamics Trajectories: Increasing the Efficiency Using Systematic Frame Selection. J. Chem. Inf. Model. 2011, 51, 2680–2689. [Google Scholar] [CrossRef] [Green Version]
  46. Zoete, V.; Irving, M.B.; Michielin, O. MM-GBSA binding free energy decomposition and T cell receptor engineering. J. Mol. Recognit. 2010, 23, 142–152. [Google Scholar] [CrossRef] [PubMed]
  47. Mark, A.; Van Gunsteren, W.F. Decomposition of the Free Energy of a System in Terms of Specific Interactions: Implications for Theoretical and Experimental Studies. J. Mol. Biol. 1994, 240, 167–176. [Google Scholar] [CrossRef]
  48. Silva, J.R.A.; Bishai, W.R.; Govender, T.; Lamichhane, G.; Maguire, G.E.; Kruger, H.G.; Lameira, J.; Alves, C.N. Targeting the cell wall of Mycobacterium tuberculosis: A molecular modelling investigation of the interaction of imipenem and meropenem with L, D -transpeptidase 2. J. Biomol. Struct. Dyn. 2015, 34, 1–34. [Google Scholar] [CrossRef]
  49. Anderson, A.C. The Process of Structure-Based Drug Design. Chem. Biol. 2003, 10, 787–797. [Google Scholar] [CrossRef] [PubMed] [Green Version]
  50. Tian, W.; Chen, C.; Lei, X.; Zhao, J.; Liang, J. CASTp 3.0: Computed atlas of surface topography of proteins. Nucleic Acids Res. 2018, 46, W363–W367. [Google Scholar] [CrossRef] [PubMed] [Green Version]
  51. Wang, J.; Krudy, G.; Hou, T.; Zhang, W.; Holland, G.; Xu, X. Development of Reliable Aqueous Solubility Models and Their Application in Druglike Analysis. J. Chem. Inf. Model. 2007, 47, 1395–1404. [Google Scholar] [CrossRef] [PubMed] [Green Version]
  52. Gabrio, T.; Böhme, M.; Hack, U.; Miljanic, T.; Weidner, U. Ambrosia—Eine Ursache für die Zunahme von Allergien? Allergologie 2009, 32, 453–461. [Google Scholar] [CrossRef]
  53. Pham-The, H.; González-Álvarez, I.; Bermejo, M.; Sanjuan, V.M.; Centelles, I.; Garrigues, T.M.; Cabrera-Pérez, M. Ángel In Silico Prediction of Caco-2 Cell Permeability by a Classification QSAR Approach. Mol. Inform. 2011, 30, 376–385. [Google Scholar] [CrossRef]
  54. Shen, J.; Cheng, F.; Xu, Y.; Li, W.; Tang, Y. Estimation of ADME Properties with Substructure Pattern Recognition. J. Chem. Inf. Model. 2010, 50, 1034–1041. [Google Scholar] [CrossRef] [PubMed]
  55. Lipinski, C.A.; Lombardo, F.; Dominy, B.W.; Feeney, P.J. Experimental and computational approaches to estimate solubility and permeability in drug discovery and development settings. Adv. Drug Deliv. Rev. 1997, 23, 2–25. [Google Scholar] [CrossRef]
  56. Veber, D.F.; Johnson, S.R.; Cheng, H.; Smith, B.R.; Ward, K.W.; Kopple, K.D. Molecular Properties That Influence the Oral Bioavailability of Drug Candidates. J. Med. Chem. 2002, 45, 2615–2623. [Google Scholar] [CrossRef] [PubMed]
  57. Protti, Í.F.; Rodrigues, D.R.; Fonseca, S.K.; Alves, R.J.; de Oliveira, R.B.; Maltarollo, V.G. Do Drug-likeness Rules Apply to Oral Prodrugs? ChemMedChem 2021, 16, 1446–1456. [Google Scholar] [CrossRef] [PubMed]
  58. Corrie, P.G. Cytotoxic chemotherapy: Clinical aspects. Medicine 2011, 39, 717–722. [Google Scholar] [CrossRef]
  59. Mei, L.; Zhang, Z.; Zhao, L.; Huang, L.; Yang, X.-L.; Tang, J.; Feng, S.-S. Pharmaceutical nanotechnology for oral delivery of anticancer drugs. Adv. Drug Deliv. Rev. 2013, 65, 880–890. [Google Scholar] [CrossRef] [PubMed]
  60. Drwal, M.N.; Banerjee, P.; Dunkel, M.; Wettig, M.R.; Preissner, R. ProTox: A web server for the in silico prediction of rodent oral toxicity. Nucleic Acids Res. 2014, 42, W53–W58. [Google Scholar] [CrossRef] [Green Version]
  61. Robinson, R.L.M.; Glen, R.C.; Mitchell, J.B. Winnow based identification of potent hERG inhibitors in silico: Comparative assessment on different datasets. J. Chemin. 2012, 4, O6. [Google Scholar] [CrossRef]
  62. Law, V.; Knox, C.; Djoumbou, Y.; Jewison, T.; Guo, A.C.; Liu, Y.; Maciejewski, A.; Arndt, D.; Wilson, M.; Neveu, V.; et al. DrugBank 4.0: Shedding new light on drug metabolism. Nucleic Acids Res. 2014, 42, D1091–D1097. [Google Scholar] [CrossRef] [Green Version]
  63. Li, X.; Du, Z.; Wang, J.; Wu, Z.; Li, W.; Liu, G.; Shen, X.; Tang, Y. In Silico Estimation of Chemical Carcinogenicity with Binary and Ternary Classification Methods. Mol. Inform. 2015, 34, 228–235. [Google Scholar] [CrossRef]
  64. Lamothe, S.; Guo, J.; Li, W.; Yang, T.; Zhang, S. The Human Ether-a-go-go-related Gene (hERG) Potassium Channel Represents an Unusual Target for Protease-mediated Damage. J. Biol. Chem. 2016, 291, 20387–20401. [Google Scholar] [CrossRef] [Green Version]
  65. Gaulton, A.; Hersey, A.; Nowotka, M.; Bento, A.P.; Chambers, J.; Mendez, D.; Mutowo, P.; Atkinson, F.; Bellis, L.J.; Cibrián-Uhalte, E.; et al. The ChEMBL database in 2017. Nucleic Acids Res. 2017, 45, D945–D954. [Google Scholar] [CrossRef]
  66. Teague, S.J. Implications of protein flexibility for drug discovery. Nat. Rev. Drug Discov. 2003, 2, 527–541. [Google Scholar] [CrossRef] [PubMed]
Figure 1. Results obtained from FTSite (A) and FTMap (B), as well as the predicted binding sites overlapped with the molecular probes clusters (C). Structure of AK3 with GTP and ATP binding sites highlighted in cyan and red, respectively (D). AK3 cartoon representation is colored in dark grey; the three predicted sites by FTsite are colored in salmon, blue, and green (A,C); and FTmap predicted clusters are colored in yellow, orange, purple, blue, cyan, and green sticks (B,C).
Futurepharmacol 01 00006 g001
Figure 2. Frequency of hydrogen bond donors (A) and acceptors (B), hydrophobic interactions (C), and ionic interactions (D) per amino acid residue from the analysis of FTMap calculations.
Futurepharmacol 01 00006 g002
Figure 3. Molecular interaction fields of the HBA (blue contours, (A)), HBD (yellow contours, (B)), hydrophobic (orange contours, (C)), and electrostatic (transparent purple contours, (D)) probes calculated with AutoGRID software.
Futurepharmacol 01 00006 g003
Figure 4. Representation of constructed pharmacophore model in the AK3 represented as cartoon style (A) and vdW-scaled spheres atoms (B). Gray sphere represents a cation, red spheres represent HBA, blue sphere represents HBD, and orange spheres represent hydrophobic groups.
Futurepharmacol 01 00006 g004
Figure 5. Structure of the 6 selected compounds from pharmacophore and docking screenings.
Futurepharmacol 01 00006 g005
Figure 6. Poses of the six hits with the AK-3 enzyme displayed in surface colored by electrostatic potential.
Futurepharmacol 01 00006 g006
Figure 7. Poses of the six hits with the AK-3 enzyme displayed in surface colored by lipophilic potential.
Futurepharmacol 01 00006 g007
Figure 8. RMSD plots of the two complex (AK3–ligands) (red and black) and ligands (blue) at the AK3 binding site, as well as representative snapshots of the complexes at 0, 150, and 300 ns: (A) Compound 2 and (B) Compound 3.
Futurepharmacol 01 00006 g008
Figure 9. RMSD plots of the two complex (AK3–ligands) (red and black) and ligands (blue) at the AK3 binding site, as well as representative snapshots of the complexes at 0, 75, and 150 ns: (A) Compound 4 and (B) Compound 5.
Futurepharmacol 01 00006 g009
Figure 10. RMSF plots of the four complex (AK3+ligands, in red) and the AK3 without ligand (in black): (A) Compound 2, (B) Compound 3, (C) Compound 4, and (D) Compound 5. All RMSF plots were calculated by using the trajectory of the stabilized system: Apo structure and complexes with Compound 2 and Compound 5 used the trajectory from 100 to 200 ns; AK3 + Compound 3 complex used the trajectory from 200 to 300 ns; and the AK3 + Compound 4 complex used the trajectory from 150 to 300 ns.
Futurepharmacol 01 00006 g010
Figure 11. Analysis of intermolecular interactions of Compounds 2, 3, 4, and 5 with the AK3 binding site.
Futurepharmacol 01 00006 g011
Figure 12. Free-energy plot by decomposition of AK3 residues in the presence of the four ligands.
Futurepharmacol 01 00006 g012
Table 1. Prediction of pharmacokinetic and toxicity endpoints for the six hits.
Compound 1Compound 2Compound 3Compound 4Compound 5Compound 6
Z1002566344Z2828033263Z2955346685Z1016986064Z1475103113Z2593989424
pharmacokinetics predictions
LogS−3.7449−2.4312−3.2553−3.4296−2.9741−3.6493
HIA (P) a+(0.9828)+(0.8411)+(0.7078)+(0.7093)−(0.6149)+(0.8960)
Caco-2 permeability (P) b−0.6692)+(0.5649)−(0.6844)−(0.6379)+(0.5409)−(0.5473)
Cellular distributionmitochondriamitochondriamitochondriamitochondriamitochondriamitochondria
toxicity predictions
hERG-1 inhibition (P) cWI (0.7073)WI (0.9693)WI (0.9899)WI (0.9047)WI (0.6851)WI (0.9120)
hERG-2 inhibition (P) dI (0.7353)I (0.5564)NI (0.6431)I (0.7064)I (0.8003)I (0.8882)
AMES (P) eNT (0.6134)NT (0.6926)NT (0.6807)NT (0.6069)NT (0.6774)NT (0.7279)
Carcinogenicity (P) fNC (0.7627)NC (0.8482)NC (0.9053)NC (0.9079)NC (0.8816)NC (0.7699)
LD50729 mg/Kg3000 mg/Kg840 mg/Kg980 mg/Kg800 mg/Kg1000 mg/Kg
Toxicity class g454444
Note: a +, absorbed; −, not absorbed; b +, permeable; −, not permeable; c WI, weak inhibitor; d I, inhibitor; NI, non-inhibitor; e NT, not toxic; f NC, non-carcinogenic; g 4, >300–2000 mg/kg; 5, >2000–5000 mg/kg.
Table 2. Values of free energy of binding (ΔG in kcal/moL) obtained for AK3 with four ligands.
CompoundSIE
2−6.53
3−7.55
4−6.95
5−6.71
SIE: solvent interaction energy.
Publisher’s Note: MDPI stays neutral with regard to jurisdictional claims in published maps and institutional affiliations.

