Article

Comparison of Oxygen Electrode Chronoamperometry and Spectrophotometry for Determination of Catalase Activity

by
Michal Szczepanczyk
1,2,3,
Lea Paul
1,2,
Tautgirdas Ruzgas
1,2 and
Sebastian Björklund
1,2,*
1
Department of Biomedical Science, Malmö University, 214 32 Malmö, Sweden
2
Biofilms-Research Center for Biointerfaces, Malmö University, 214 32 Malmö, Sweden
3
Simris Alg AB, 276 50 Hammenhög, Sweden
*
Author to whom correspondence should be addressed.
Oxygen 2023, 3(1), 77-89; https://doi.org/10.3390/oxygen3010006
Submission received: 19 December 2022 / Revised: 17 January 2023 / Accepted: 31 January 2023 / Published: 3 February 2023

Abstract

:
Catalase is a key antioxidative enzyme, and a deficiency or malfunction of catalase is hypothesized to be related to various diseases. To investigate catalase activity, it is important to use reliable methods and experimental protocols enabling consistent fallouts. One major problem, however, is that the activity values obtained with different techniques and procedures can vary to a large extent. The aim of this work was to identify experimental conditions that provide similar catalase activity values with two different methods based on either spectrophotometry or chronoamperometry. The investigated parameters include the concentration of catalase and its substrate (H2O2), as well as the effect of deoxygenation of the catalase medium by nitrogen (N2). Within the frame of investigated conditions, we show that spectrophotometry is strongly affected by the catalase concentration, whereas chronoamperometry is shown to be more dependent on the substrate concentration. Deoxygenation leads to elevated catalase activity values in the case of chronoamperometry, whereas it shows no influence on the results obtained with spectrophotometry. In particular, in the case of low substrate concentrations (i.e., low catalase reaction rates), higher and more accurate results are obtained with deoxygenation in the case of chronoamperometry measurements due to minimized oxygen escape. The effect of deoxygenation, giving rise to elevated catalase activity values, however, is not statistically significant at high substrate concentrations, implying that the protocol can be simplified by excluding this step as long as the other parameters are optimized. Finally, by comparing the two methods at different experimental conditions, we identified protocols resulting in similar results, i.e., 10 mM H2O2 and catalase activity of 4–5 U/mL. Based on this work, improved consistency of catalase activity data obtained with different methodologies and in different labs is expected.

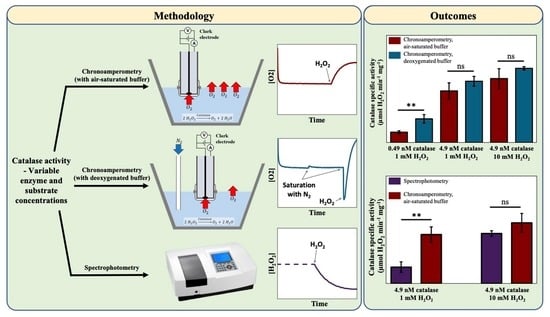
Graphical Abstract

1. Introduction

Oxygen is essential for life, but it is also a primary source of reactive oxygen species (ROS), which are produced as byproducts of oxidative metabolic processes by proteins and enzymes residing in various cell compartments. These compartments include the cell membrane, the cytoplasm, and the various organelles (i.e., endoplasmic reticulum, peroxisome, and mitochondria) [1,2]. Mitochondria, in particular, represent the primary compartment where most ROS are generated (around 90% of cellular ROS is estimated to originate from here) [1,2]. Of the total amount of molecular oxygen (O2) consumed by mitochondria, about 0.2–2.0% is reduced to superoxide anions (O2•−), which are the most abundant ROS in mitochondria. Further on, the superoxide anions are converted into other ROS, such as hydrogen peroxide (H2O2) and hydroxyl ions (OH) and radicals (OH) [2].
In addition to their capacity to induce damage, ROS have been shown to function as signaling molecules and have versatile roles in the antimicrobial immune defense system where macrophages produce ROS upon encountering bacteria [3,4]. However, elevated ROS concentrations above physiological levels denote an adverse state associated with the failure of basic cellular processes due to ROS-induced damage of biomolecules such as DNA, proteins, and lipids (often referred to as oxidative stress) [5]. Prolonged oxidative stress affects the function of tissues and organs of the body and may eventually contribute to the development of various diseases, including Alzheimer’s disease, Parkinson’s disease, cancer, diabetes, skin diseases, and atherosclerosis [6,7].
On a cellular basis, superoxide anion and hydrogen peroxide represent the most abundant species [4]. Notably, hydrogen peroxide possesses the ability to cross biological membranes via aquaporin homologues and to induce damage in various cellular compartments [8]. Considering this, and the fact that this ROS is relatively stable, hydrogen peroxide is particularly relevant as a candidate for quantifying oxidative stress [9]. In addition, hydrogen peroxide has been increasingly recognized as a key molecule for redox signaling, with several metabolically and biochemically relevant roles [10].
The primary line of defense against unphysiologically high levels of ROS in aerobic organisms relies on antioxidants, which are compounds able to scavenge ROS or prevent their formation. Physiological antioxidants consist of enzymes and a wide range of non-enzymatic compounds, such as polyphenols, carotenoids, vitamins, or glutathione, which constitute an interconnected antioxidant defense system [11,12,13]. Antioxidant enzymes are particularly efficient scavengers of ROS and include, among others, glutathione peroxidase, superoxide dismutase, and catalase.
Catalase, which is the focus of this study, is a heme-containing tetramer that is found in aerobically respiring organisms, whereas anaerobic bacteria generally do not express this enzyme [14]. The main reaction of catalase is the decomposition of cellular hydrogen peroxide to water and oxygen according to the following equation (Equation (1)):
H 2 O 2 + H 2 O 2 C a t a l a s e 2 H 2 O + O 2
In addition to this reaction (i.e., Equation (1)), catalase can accommodate peroxidase-type reactions by oxidizing suitable hydrogen donors, such as polyphenols or alcohols [15,16,17]. The human catalase is expressed in every organ, and the highest levels of activity are measured in the liver, the kidney, and red blood cells [14]. Catalase is primarily located in peroxisomes within the cell [14,15,16]. However, the existence of a cytosolic catalase has been reported [18], as well as catalase bound to cytosolic proteins that are linked to the cell membrane [19]. It has also been shown that active catalase is present in the outermost layer of the skin organ (i.e., the stratum corneum) [20,21,22,23], which primarily consists of non-viable cells (i.e., corneocytes) embedded in a solid-like extracellular lipid matrix (i.e., a very different environment as compared to, e.g., the peroxisomal milieu) [24].
Deviation from standard catalase levels has been linked to several diseases [14], which implies that the assessment of catalase activity may serve as a relevant clinical diagnostic test (although not yet officially listed as one). For instance, the measurement of the catalase activity level in the serum has been proposed as a rapid method for acute pancreatitis diagnosis, particularly in the early stage of this medical condition [25]. Further, several studies have suggested that abnormal catalase levels can be linked to malignant diseases. For example, pancreatic carcinoma and basal cell carcinoma showed downregulation of catalase [26,27], whereas the opposite trend has been reported for melanoma and gastric adenocarcinoma cells, in which catalase was found to be overexpressed [28,29]. Interestingly, reduced expression of catalase in skin has been associated with skin diseases, such as vitiligo, which affects 0.5–4% of the world population [30]. Considering this, a proposed solution to treat vitiligo, which has been evaluated clinically, is topical treatment with a catalase substitute (i.e., a complex of bis-manganese III-EDTA-(HCO3)2), which is activated by UVB, enabling the epidermal reduction of elevated H2O2 levels [30].
The most common assays for catalase activity measurements rely on UV spectrophotometry, where the change of absorbance at 240 nm is monitored at relatively high concentrations of H2O2. Notably, high levels of H2O2 may lead to the inhibition of catalase, which is a limitation [14]. Additionally, methods that allow for the continuous assessment of low catalase activity against high background levels of absorbance are highly desired due to the fact that many matrix constituents (e.g., proteins, DNA, RNA, etc.) may exhibit intense UV absorption at 240 nm. Due to this, various modifications have been proposed based on the formation of stable complexes involving unreacted substrate species, which possess enhanced absorbance [31,32,33]. Still, spectrophotometric assays are often burdened by time-consuming purification steps and/or complexation reactions in order to perform the final measurement. By employing the oxygen electrode (i.e., the Clark electrode [34]) for direct monitoring of the oxygen concentration, these time-consuming steps can be avoided. The method has previously been proven to be fast, accurate, and compatible with complex biological samples [22,35]. Another modification of this method, referred to as the skin-covered oxygen electrode (SCOE), allows for monitoring native catalase activity in excised skin samples [23,36,37]. Oxygen is, however, relatively poorly soluble in water, and any rapid elevation of its concentration in a solution at equilibrium with atmospheric oxygen is accompanied by oversaturation and subsequent oxygen escape from the measurement vessel [38]. This may lead to an underestimation of the actual catalase activity recorded by the oxygen electrode, considering that the measurement relies strictly on the amount of oxygen produced by the enzyme (see Equation (1)). Thus, by performing deoxygenation of the reaction mixture prior to the measurement, the generated oxygen occurs well below the solubility concentration, which is expected to attenuate the influence of oxygen escape and improve the accuracy of the measurement. This is most frequently achieved by saturating the reaction mixture with nitrogen (N2) gas [17,35]. However, the influence of the deoxygenation process on the actual obtained values of the catalase activity is not well characterized, and recent reports normally skip this procedure [22,36,37,38,39,40].
Taken together, the wide variety of methodologies used to measure the catalase activity may lead to unnecessary discrepancies between the results obtained in different laboratories and with various methods. Due to the important role of catalase as a key enzyme preventing oxidative stress, as well as the numerous reported deviations in catalase regulation associated with serious diseases, there is a clear need for standardization of the measurement protocols. Considering this, this work aims at identifying suitable experimental conditions that provide similar catalase activity values with two different methods based on either spectrophotometry or oxygen electrode chronoamperometry. A comparison between the methods is performed by investigating the influence of the following key parameters: enzyme concentration, substrate concentration, and deoxygenation of reaction mixture. In conclusion, this work highlights the influence of different experimental conditions on catalase activity measurements with spectrophotometry and oxygen electrode chronoamperometry. Further, the results emphasize the experimental conditions that should be avoided, giving rise to large disagreements between the methods. Based on this study, it is expected that unnecessary discrepancies between measured catalase activity values can be minimized.

2. Materials and Methods

2.1. Materials

Catalase from bovine liver (EC1.11.1.6, 2000–5000 U/mg protein), hydrogen peroxide (H2O2, 35%), tablets for preparing phosphate-buffered saline (PBS, 10 mM, pH 7.5), potassium chloride (KCl), and sodium azide (NaN3) were purchased from Sigma Aldrich (Stockholm, Sweden). All solutions were prepared from water with a resistivity of 18.2 Ωcm, purified by the Milli-Q system (Merck Millipore, Billerica, MA, USA).

2.2. Spectrophotometry Measurements of Catalase Activity

The spectrophotometric assay was performed as previously described [41]. In brief, the decrease in absorbance at 240 nm was monitored for 3 min using a Shimadzu UV-1800 spectrophotometer (Shimadzu Scientific Instruments, Columbia, MD, USA). PBS solution not containing H2O2 was used as blank. To determine a reference value of the catalase activity, the measurements were performed according to the protocol provided by Sigma Aldrich, in which 6.67 U/mL (corresponding to 3.3 µg/mL or 13.8 nM) catalase was used with an initial substrate concentration of 12 mM. In this analysis, the linear part of the curve, within H2O2 concentrations of 10.3–9.2 mM (corresponding to absorbance values of 0.40–0.45), was used to calculate the velocity of the substrate consumption, v H 2 O 2 . Based on this protocol, the reference value of the catalase activity was determined to be 2250 ± 90 µmol H2O2 min−1 mg−1 (n = 3). However, considering that the chronoamperometric method relies on the initial velocity of the enzymatic reaction ( v H 2 O 2 ), it was decided to employ a similar protocol also for the spectrophotometric method to enable a more consistent comparison. This was achieved by determining the slope of the initial 10 s, where a linear decrease of the absorbance was observed, which represents the maximum rate of the H2O2 consumption (occurring immediately upon substrate addition). Further, in the spectrophotometry measurements, 0.1 mL of catalase solution (3.3 µg/mL for 0.46 nM and 33.0 µg/mL for 4.6 nM) was added to 2.9 mL of 10 mM H2O2 in PBS (i.e., identical protocol as for chronoamperometry). Finally, a control experiment was performed to investigate the effect of deoxygenation, showing no effect in the case of spectrophotometry measurements of the decreasing H2O2 absorbance curve. Based on this observation, the employment of deoxygenation in the case of spectrophotometric measurements was not further considered as relevant.

2.3. Preparation of the Oxygen Electrode

The oxygen electrode was supplied by Optronika, Vilnius, Lithuania. The surface of the platinum cathode of the oxygen electrode was polished with alumina suspension (Buehler, Lake Bluff, IL, USA; 1 µm diameter) and rinsed with deionized water. The gas-permeable membrane, used to separate any electrolytes from the buffer solution, consisted of a 5 µm-thick Teflon membrane. The body of the electrode was filled with saturated KCl. Before each measurement, the electrode was rinsed with deionized water.

2.4. Chronoamperometry Meaurements of Catalase Activity

The oxygen electrode was employed to perform chronoamperometry measurements of the catalase activity following the protocol previously described [22], with the following modifications. In brief, as shown in Figure 1, the oxygen electrode was inserted into an electrochemical cell filled with 2.9 mL of PBS solution. For all measurements, 0.1 mL of catalase solution (3.3 µg/mL and 33.0 µg/mL for 0.46 nM and 4.6 nM, respectively) was added to the PBS solution after reaching a stable baseline and prior to N2 purging. Further, all experiments were conducted at room temperature (22 °C), and the solution was stirred with a magnetic steering bar at 400 rpm. The cell was equipped with a syringe needle for supplying N2 into the buffer in the case of deoxygenation experiments. The current of the oxygen electrode was recorded with an Emstat3 Blue potentiostat (PalmSens, Bellefonte, PA, USA). The electrode was coupled in a two-electrode configuration by applying −0.7 V, vs Ag/AgCl/KCl(sat), on the Pt cathode. After the baseline current was stabilized (in the presence of added catalase), a defined amount of H2O2 was pipetted into the measurement cell. Immediately, the catalase reaction (Equation (1)) converted H2O2 into O2, resulting in an increased reduction current of the oxygen electrode. For experiments that were performed in deoxygenated buffer, N2 was supplied after baseline stabilization in the presence of catalase. Simultaneously, the oxygen electrode was raised above the surface of the reaction medium to avoid adsorption of N2 gas bubbles onto the Teflon membrane. After several minutes, the N2 stream was stopped, and the oxygen electrode was instantly immersed back into the buffer, followed by the addition of a defined amount of H2O2. The reason for initiating the measurement immediately after N2 purging and performing relatively short readings (<30 s), in the case of deoxygenation of the reaction medium, was to minimize the influence of O2 reentering the measurement cell from the atmosphere.

2.5. Calculation of Specific Catalase Activity

One unit of catalase activity ( U ) is defined as the amount of catalase able to decompose 1 µmol of H2O2 per one minute. The current values measured by the oxygen electrode were recalculated to O2 concentration, based on the assumption that PBS solution in equilibrium with atmospheric oxygen contains 0.26 mM (or 8.3 mg/L) at T = 22 °C and 1 atm [38]. The calculation of the initial velocity of the enzymatic reaction ( v H 2 O 2 ) was based on a 10 s linear part of the current trace, which represents the maximum change of the O2 concentration (occurring immediately upon substrate addition). Considering the stoichiometry of the catalase reaction (see Equation (1)), the initial velocity (in mM/s) of the substrate consumption v H 2 O 2 was calculated according to Equation (2):
v H 2 O 2 = 2 v O 2
For spectrophotometry measurements, the value of v H 2 O 2 was directly calculated from the change in absorbance obtained after pipetting H2O2 into the quartz cuvette and after manual mixing of the reaction medium. For this, an extinction coefficient of ( ε H 2 O 2 ) equal to 43.6 M−1cm−1 was used [42].
After the rates of H2O2 breakdown were experimentally determined, the catalase activity was calculated based on following equation (Equation (3)):
U = v H 2 O 2 × α
The coefficient α is a conversion factor equal to 180 (L × s/min), arising from conversion from units of mM/s to units of µmol/min, taking into consideration the volume of the electrochemical reaction vessel or quartz cuvette (equal to 3 mL in both cases). Finally, the specific catalase activity was calculated by dividing the value of U with the mass of catalase employed in the individual measurement.

2.6. Statistics

An unpaired t-test was used to compare the results obtained with oxygen electrode chronoamperometry with and without deoxygenation, as well as the results obtained either with chronoamperometry or spectrophotometry. All statistical analyses were performed using the software MatLab 2019b. The significance levels were established at * p < 0.05, ** p < 0.01, and *** p < 0.001, whereas p > 0.05 was used as the level for not statistically significant (ns) differences. All experimental data used for statistical analysis are reported as mean ± standard deviation (SD) based on three replicates (n = 3).

3. Results

The aim of this work was to identify suitable experimental conditions that provide similar catalase activity values with two different methods based on either spectrophotometry or oxygen electrode chronoamperometry. First, we investigated the influence of deoxygenation on the catalase activity measurements based on chronoamperometry. Here, it can be pointed out that the measurements based on spectrophotometry, with and without deoxygenation, generated virtually identical absorbance curves of the H2O2 decomposition by catalase, which is the reason for not including deoxygenation in the spectrophotometry protocols. Finally, we compared the results obtained with chronoamperometry with a method based on spectrophotometry.

3.1. The Effect of Deoxygenation on Chronoamperometry Meaurements of Catalase Activity

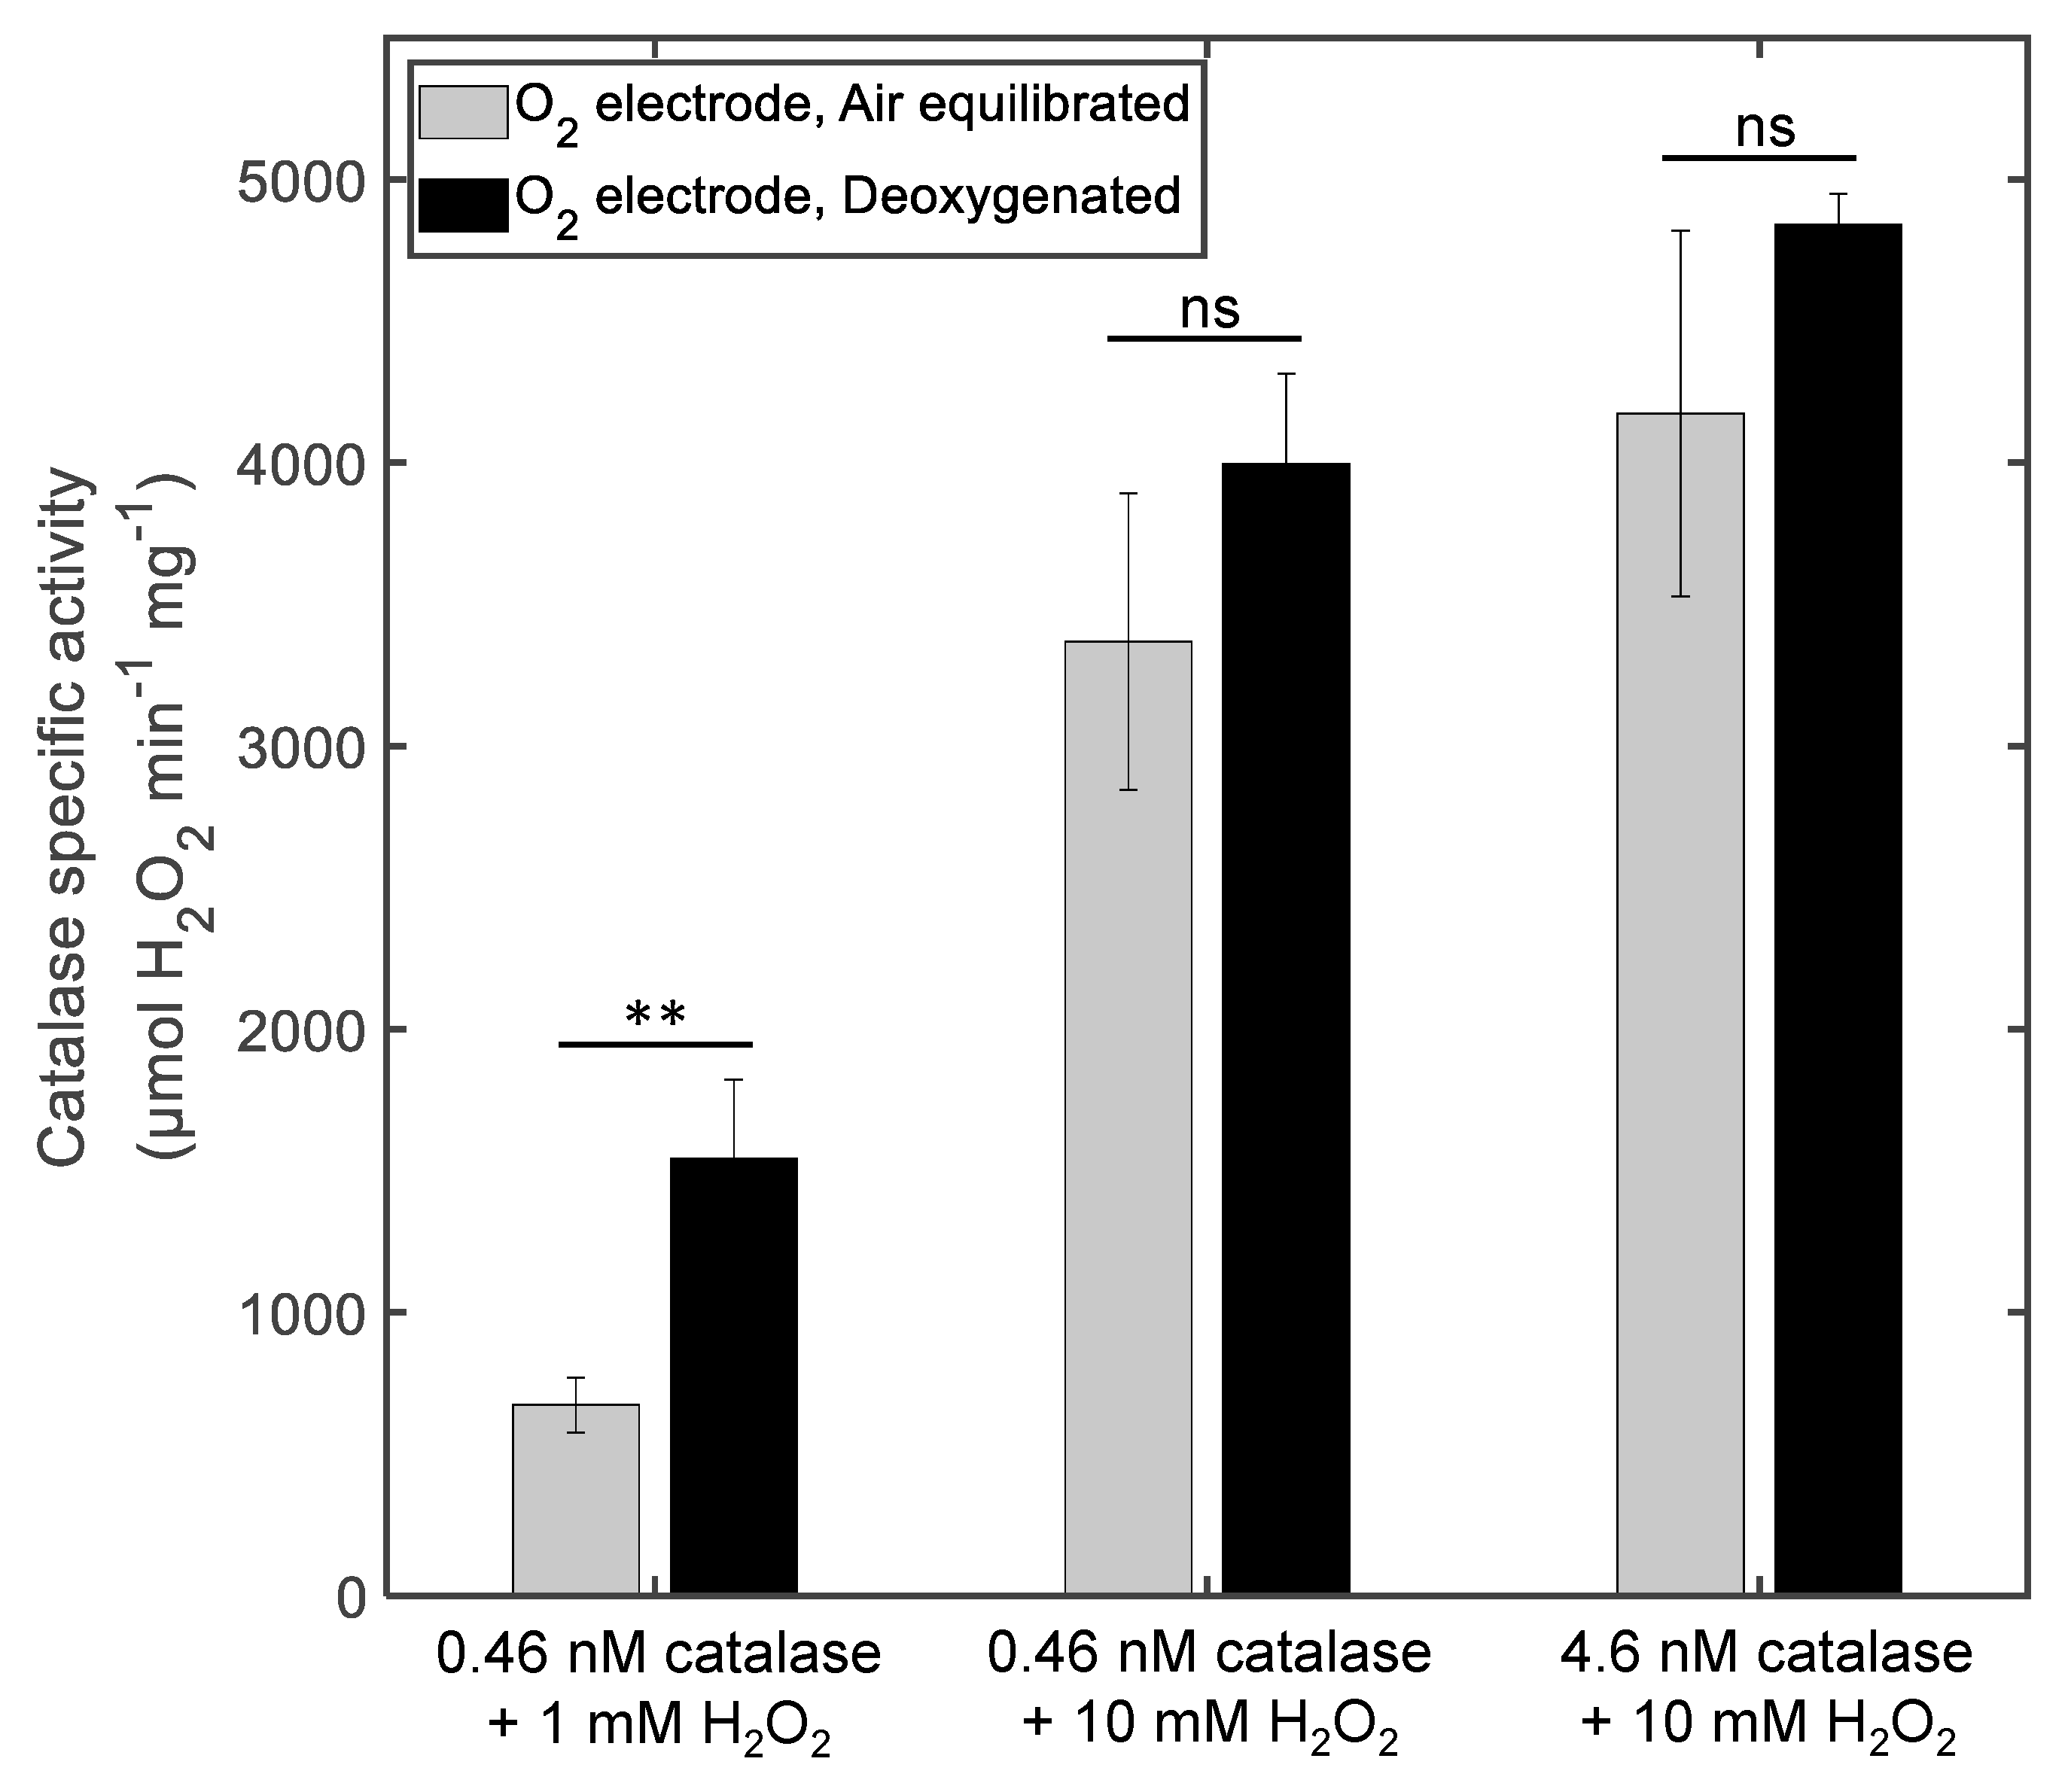
In several previous reports, deoxygenation has been employed in the case of oxygen electrode chronoamperometry measurements of the catalase activity. The influence of having O2 present or absent in the reaction mixture during the measurement is, however, seldom discussed in detail. Instead, reports usually conclude that the application of a deoxygenation step translates into an improvement in the sensitivity of the measurement [40,43]. In an attempt to examine this issue in more detail, we conducted experiments aiming at investigating the influence of deoxygenation on the results obtained with chronoamperometry. For this, the concentrations of both catalase (0.46 nM or 4.6 nM) and its substrate (1 mM and 10 mM) were varied, with or without deoxygenation (see Figure 2). It was expected that the deoxygenation step by N2 purging, prior to H2O2 injection, should increase the catalase activity values determined by the oxygen electrode method, since the measurement occurs well below the solubility limit of O2, effectively reducing O2 escape.
A first conclusion based on the results in Figure 2 is that the activity of catalase is strongly influenced by the experimental conditions. For example, in the case of the lowest tested concentrations of catalase and H2O2 (i.e., 0.46 nM and 1 mM, respectively), the deoxygenation step caused a significant increase (p = 0.0069). The catalase activity was determined to be 670 ± 90 µmol H2O2 min−1 mg−1 in the case of employing PBS buffer in equilibrium with atmospheric O2, and a value of 1540 ± 280 µmol H2O2 min−1 mg−1 was obtained after deoxygenation, corresponding to an increase of 130%. In both cases, i.e., without or with deoxygenation, a notable increase in the catalase activity was observed when the substrate concentration was increased from 1 to 10 mM, reaching values of 3370 ± 520 and 4000 ± 320 µmol H2O2 min−1 mg−1, respectively. Further, by increasing the concentration of catalase ten times (i.e., to 4.6 nM), while keeping the substrate concentration at 10 mM, an additional increase in the activity was observed in both cases. However, the catalase activities obtained with or without deoxygenation were not significantly different when a substrate concentration of 10 mM was employed, either with 0.46 nM or 4.6 nM of catalase (p = 0.15 in both cases). Nevertheless, under these experimental conditions, deoxygenation results in consistently higher catalase activity values, which are also associated with improved precision.
In conclusion, deoxygenation has a significant effect on the obtained catalase activity value when the substrate concentration is low (i.e., 1 mM H2O2), leading to a prominent discrepancy. This discrepancy is, however, attenuated when the substrate concentration is increased to 10 mM H2O2, resulting in notably elevated and similar results, irrespective of deoxygenation (i.e., not statistically significant differences). The results of catalase reaction rate v and specific catalase activity are summarized in Table 1.

3.2. Comparison between Chronoamperometry and Spectrophotometry Measuerments of Catalase Activity

In order to compare the results determined with oxygen electrode chronoamperometry with the results obtained with a standard method, we employed spectrophotometry as a control method. To enable this comparison, experiments were performed with matching experimental conditions. In other words, the same volume of PBS (i.e., 3 mL) and similar catalase concentrations (i.e., either 0.46 nM or 4.6 nM) were used. In addition, all calculations of enzyme activity were based on the highest linear H2O2 consumption rate (i.e., absorbance decrease), which in all cases was obtained immediately upon substrate addition to the reaction mixture. Here, three points should also be considered. First, based on initial control experiments, deoxygenation of the reaction medium in the case of spectrophotometry measurements was concluded to not influence the absorbance curves of the H2O2 decomposition; consequently, the spectrophotometry measurements were only performed without deoxygenation. Second, the spectrophotometry measurements were performed without stirring during the absorbance recording (only initial stirring of the reaction medium). Third, by performing the spectrophotometry measurement according to the standard protocol provided by the manufacturer of the catalase activity kit, the catalase activity was determined to be 2250 ± 90 µmol H2O2 min−1 mg−1 (n = 3).
The results in Figure 3 show that the measured catalase activity with a lower concentration of the enzyme (i.e., 0.46 nM) varies greatly depending on the method employed. For example, the activity of catalase obtained with spectrophotometry reached merely 1130 ± 260 µmol H2O2 min−1 mg−1 (see Table 1). This should be compared to the catalase activity levels obtained with chronoamperometry under identical enzyme and substrate concentrations, without and with deoxygenation, which were around 200% (p = 0.014) and 250% (p = 0.0025) higher, respectively. However, by increasing the catalase concentration to 4.6 nM, more consistent results were obtained (Figure 3). The catalase activity determined with spectrophotometry (3440 ± 190 µmol H2O2 min−1 mg−1) was found to be not significantly different (p = 0.13), as compared with the activity measured with chronoamperometry without deoxygenation (4170 ± 650 µmol H2O2 min−1 mg−1), whereas deoxygenation gave rise to significantly (p = 0.00036) higher and more precise activity values (4840 ± 110 µmol H2O2 min−1 mg−1). Notably, the catalase activity determined with spectrophotometry is consistently lower compared to the results obtained with chronoamperometry. One reasonable explanation for this is that the latter method involves continuous stirring of the reaction medium, whereas the reaction medium in the case of spectrophotometry is only stirred initially (i.e., prior to inserting the cuvette into the spectrophotometer). Thus, it is possible that the substrate is diffusion limited in terms of reaching the catalytic site of catalase during spectrophotometry measurements, effectively leading to somewhat lower values. Finally, it can be concluded that the present spectrophotometry protocol, with 4.6 nM catalase and 10 mM H2O2, resulted in significantly higher (p = 0.00056) values as compared to the standard protocol employing 13.8 nM catalase and 12 mM H2O2 (2250 ± 90 µmol H2O2 min−1 mg−1). The reason for this divergence is that the standard protocol involves calculation of the catalase activity based on the absorbance decrease corresponding to H2O2 concentrations of 10.3–9.2 mM, while the present protocol involves determination of the activity based on the highest decomposition rate of H2O2 to enable comparison with chronoamperometry results. This discrepancy further highlights the complexity of comparing catalase activity values obtained with different protocols and calls for careful consideration of both experimental conditions as well as analytical procedures during the data evaluation.

4. Discussion

4.1. The Influence of Deoxygenation in the Case of Chronoamperometry Meaurements of Catalase Activity

The results obtained with oxygen electrode chronoamperometry, employing 0.46 nM catalase and 1 mM H2O2 (Figure 2), show a noticeable increase in the determined enzyme activity following deoxygenation, as compared to the case without. In both cases, the highest reaction rate was recorded about 2–4 s after adding the substrate to the reaction mixture, which implies that the increase in O2 concentration results from the same process (i.e., consumption of H2O2 and release of O2 by catalase). However, it is likely that the measurements without deoxygenation, in which the initial O2 concentration is in equilibrium with atmospheric O2 (i.e., 0.26 mM), lead to the oversaturation of O2. Essentially, this is expected to increase the impact of the concomitant O2 escape from the reaction mixture (i.e., the O2 escape is relatively large in comparison to the amount of O2 probed by the electrode). Saturating the buffer solution with N2 prior to adding H2O2 reduces the initial O2 concentration and therefore decreases the possibility of reaching oversaturation, which is likely to decrease the influence of the O2 escape occurring in parallel. Effectively, this results in increased values of the determined catalase activity in the case of deoxygenation (Figure 2).
Additional improvements in terms of increased catalase activity values were obtained by increasing the substrate and enzyme concentrations, although the relative increase following deoxygenation is notably reduced and concluded to be not statistically significant (Figure 2). Still, under these experimental conditions, deoxygenation is shown to result in higher and more precise catalase activity values (i.e., reduced standard deviations). In fact, deoxygenation by N2 purging resulted in consistently higher catalase activity values (about 723 ± 129 µmol H2O2 min−1 mg−1 higher values in average), irrespective of the protocol used, as compared to the case without deoxygenation (Table 1). Based on this systematic deviation, it can be concluded that O2 escape is always present; however, its influence is less concerning as long as the substrate concentration is adequately high to enable sufficient O2 production by catalase. This finding may be important for more realistic samples in which O2 is, and should be, naturally present. For these types of samples, it is possible to employ chronoamperometry without deoxygenation as long as the substrate concentration is sufficient (i.e., 10 mM H2O2).

4.2. Comparison between Chronoamperometry and Spectrophotometry Measurements of Catalase Activity

To validate the method based on oxygen electrode chronoamperometry, a comparison was made with a UV spectrophotometry method. However, a limitation of spectrophotometry is that it is not compatible with low substrate concentrations (e.g., 1 mM H2O2) due to low substrate absorbance with respect to the background noise. For this reason, the comparison was made with 10 mM H2O2, either with low or high catalase concentrations. Here, it may also be noted that the issue of O2 escape does not influence spectrophotometry, which measures the disappearance of H2O2 in the measurement cell. As shown in Figure 3, the catalase activity values varied greatly between the methods when low catalase concentrations were used (i.e., 0.46 nM). Irrespective of deoxygenation, oxygen electrode chronoamperometry resulted in about 200–250% higher catalase activity values at this enzyme concentration. However, when higher catalase concentrations were employed (i.e., 4.6 nM), comparable results were obtained with specific activity values ranging between 3400–4800 (Figure 3). These values correspond to 4–5 U (based on a catalase molecular weight of 240 kDa).
Nevertheless, the spectrophotometric method resulted in consistently lower catalase activity values, as compared to the activities obtained with chronoamperometry (i.e., 21% and 41% lower values without and with deoxygenation, respectively, see Table 1). A reasonable explanation for this discrepancy is due to limited diffusion of H2O2 to the active site of catalase, resulting in somewhat reduced activity values in the case of the static spectrophotometry measurements. Here, it should be pointed out that stirring is required for the chronoamperometry measurements in order to minimize the O2 diffusion layer at the Teflon membrane and enable adequate O2 transport from the bulk to the cathode. However, to estimate the variation in catalase activity values obtained with either stirring or at static conditions, in the case of chronoamperometry measurements, we performed control experiments. Based on these experiments, chronoamperometry without stirring resulted in 73% lower catalase activity values (n = 3) as compared to conditions with stirring at 400 rpm (n = 3). This discrepancy can be rationalized by diffusion limitation of both O2 (from the bulk, across the Teflon membrane, to the cathode), as well as of H2O2 (to the active site of catalase), in the case of static chronoamperometry measurements (i.e., no stirring). On the other hand, spectrophotometry (without stirring) is only influenced by the latter issue (i.e., limited substrate diffusion to the active site of catalase), which results in about 20–40% lower values, as compared to chronoamperometry (irrespective of deoxygenation or not). Thus, it can be expected that spectrophotometry employing stirring (not used here), as well as matching enzyme and substrate concentrations, should minimize any diffusion limitations of H2O2 to the active site of catalase, effectively resulting in slightly elevated catalase activity values.

5. Conclusions

In this work, we highlight some experimental parameters that influence the determination of catalase activity values using oxygen electrode chronoamperometry and UV spectrophotometry. The present findings illustrate the significance of considering the concentrations of catalase and its substrate employed during the measurement process and highlight the concentrations at which both methods give comparable activity values (Table 1). Importantly, at some experimental conditions investigated here, the results obtained by the different methods diverge greatly from each other, emphasizing conditions that should be avoided. Further, the experimental conditions affect the outcome of the methods differently. In particular, spectrophotometry is shown to be strongly affected by the catalase concentration in the reaction medium, whereas chronoamperometry is shown to be more dependent on the substrate concentration and less sensitive towards the catalase concentration.
Taken together, the results of the present study illustrate that any comparisons between catalase activity results that are obtained with different methodologies should be made with care. However, the results compiled in Table 1 are helpful to identify experimental conditions that provide similar catalase activity levels, irrespective of using spectrophotometry or oxygen electrode chronoamperometry. In particular, 10 mM H2O2 and catalase activity of 4–5 U represent suitable conditions for comparing results obtained with the different methods, especially between spectrophotometry and chronoamperometry without deoxygenation (i.e., not statistically different catalase activity values). Based on this study, improved consistency of catalase activity determination employing different methodologies and in different labs is expected.

Author Contributions

Conceptualization, M.S., T.R., and S.B.; methodology, M.S., T.R., and S.B.; validation, M.S. and L.P.; formal analysis, M.S., L.P., T.R., and S.B.; investigation, M.S. and LP; writing—original draft preparation, M.S. and L.P.; writing—review and editing, T.R. and S.B.; supervision, T.R. and S.B.; project administration, T.R. and S.B.; funding acquisition, S.B. All authors have read and agreed to the published version of the manuscript.

Funding

This work was conducted within ComBine—The Industrial Graduate School of Biofilms and Biointerfaces (grant number 20180114) and Biobarriers—Health, Disorders and Healing (grant number 20190010), both funded by the Knowledge Foundation (Sweden).

Institutional Review Board Statement

Not applicable.

Informed Consent Statement

Not applicable.

Data Availability Statement

All of the data is contained within the article.

Conflicts of Interest

The authors declare no conflict of interest.

References

  1. Balaban, R.S.; Nemoto, S.; Finkel, T. Mitochondria, Oxidants, and Aging. Cell 2005, 120, 483–495. [Google Scholar] [CrossRef]
  2. Tirichen, H.; Yaigoub, H.; Xu, W.; Wu, C.; Li, R.; Li, Y. Mitochondrial Reactive Oxygen Species and Their Contribution in Chronic Kidney Disease Progression Through Oxidative Stress. Front. Physiol. 2021, 12, 627837. [Google Scholar] [CrossRef] [PubMed]
  3. D’Autréaux, B.; Toledano, M.B. ROS as signalling molecules: Mechanisms that generate specificity in ROS homeostasis. Nat. Rev. Mol. Cell Biol. 2007, 8, 813–824. [Google Scholar] [CrossRef] [PubMed]
  4. Herb, M.; Schramm, M. Functions of ROS in Macrophages and Antimicrobial Immunity. Antioxidants 2021, 10, 313. [Google Scholar] [CrossRef]
  5. Zhang, J.; Wang, X.; Vikash, V.; Ye, Q.; Wu, D.; Liu, Y.; Dong, W. ROS and ROS-Mediated Cellular Signaling. Oxidative Med. Cell. Longev. 2016, 2016, 4350965. [Google Scholar] [CrossRef] [PubMed]
  6. Butterfield, D.A.; Halliwell, B. Oxidative stress, dysfunctional glucose metabolism and Alzheimer disease. Nat. Rev. Neurosci. 2019, 20, 148–160. [Google Scholar] [CrossRef]
  7. Yang, X.; Li, Y.; Li, Y.; Ren, X.; Zhang, X.; Hu, D.; Gao, Y.; Xing, Y.; Shang, H. Oxidative Stress-Mediated Atherosclerosis: Mechanisms and Therapies. Front. Physiol. 2017, 8, 600. [Google Scholar] [CrossRef]
  8. Bienert, G.P.; Schjoerring, J.K.; Jahn, T.P. Membrane transport of hydrogen peroxide. Biochim. Biophys. Acta 2006, 1758, 994–1003. [Google Scholar] [CrossRef]
  9. Patella, B.; Vincenzo, S.D.; Zanca, C.; Bollaci, L.; Ferraro, M.; Giuffrè, M.R.; Cipollina, C.; Bruno, M.G.; Aiello, G.; Russo, M.; et al. Electrochemical Quantification of H2O2 Released by Airway Cells Growing in Different Culture Media. Micromachines 2022, 13, 1762. [Google Scholar] [CrossRef]
  10. Sies, H. Hydrogen peroxide as a central redox signaling molecule in physiological oxidative stress: Oxidative eustress. Redox Biol. 2017, 11, 613–619. [Google Scholar] [CrossRef]
  11. Ighodaro, O.M.; Akinloye, O.A. First line defence antioxidants-superoxide dismutase (SOD), catalase (CAT) and glutathione peroxidase (GPX): Their fundamental role in the entire antioxidant defence grid. Alex. J. Med. 2018, 54, 287–293. [Google Scholar] [CrossRef]
  12. Mirończuk-Chodakowska, I.; Witkowska, A.M.; Zujko, M.E. Endogenous non-enzymatic antioxidants in the human body. Adv. Med. Sci. 2018, 63, 68–78. [Google Scholar] [CrossRef]
  13. Nimse, S.B.; Pal, D. Free radicals, natural antioxidants, and their reaction mechanisms. RSC Adv. 2015, 5, 27986–28006. [Google Scholar] [CrossRef]
  14. Glorieux, C.; Calderon, P.B. Catalase, a remarkable enzyme: Targeting the oldest antioxidant enzyme to find a new cancer treatment approach. Biol. Chem. 2017, 398, 1095–1108. [Google Scholar] [CrossRef]
  15. Kirkman, H.N.; Gaetani, G.F. Mammalian catalase: A venerable enzyme with new mysteries. Trends Biochem. Sci. 2007, 32, 44–50. [Google Scholar] [CrossRef]
  16. Rojkind, M.; Domínguez-Rosales, J.-A.; Nieto, N.; Greenwel, P. Role of hydrogen peroxide and oxidative stress in healing responses. Cell. Mol. Life Sci. 2002, 59, 1872–1891. [Google Scholar] [CrossRef] [PubMed]
  17. Aragon, C.M.G.; Rogan, F.; Amit, Z. Ethanol metabolism in rat brain homogenates by a catalase-H2O2 system. Biochem. Pharmacol. 1992, 44, 93–98. [Google Scholar] [CrossRef]
  18. Middelkoop, E.; Wiemer, E.A.C.; Schoenmaker, D.E.T.; Strijland, A.; Tager, J.M. Topology of catalase assembly in human skin fibroblasts. Biochim. Et Biophys. Acta (BBA)—Mol. Cell Res. 1993, 1220, 15–20. [Google Scholar] [CrossRef]
  19. Yano, S.; Arroyo, N.; Yano, N. SHP2 binds catalase and acquires a hydrogen peroxide-resistant phosphatase activity via integrin-signaling. FEBS Lett. 2004, 577, 327–332. [Google Scholar] [CrossRef]
  20. Hellemans, L.; Corstjens, H.; Neven, A.; Declercq, L.; Maes, D. Antioxidant enzyme activity in human stratum corneum shows seasonal variation with an age-dependent recovery. J. Investig. Dermatol. 2003, 120, 434–439. [Google Scholar] [CrossRef] [Green Version]
  21. Guarrera, M.; Ferrari, P.; Rebora, A. Catalase in the stratum corneum of patients with polymorphic light eruption. Acta Derm.-Venereol. 1998, 78, 335–336. [Google Scholar] [CrossRef]
  22. Szczepanczyk, M.; Ruzgas, T.; Gullfot, F.; Gustafsson, A.; Björklund, S. Catalase Activity in Keratinocytes, Stratum Corneum, and Defatted Algae Biomass as a Potential Skin Care Ingredient. Biomedicines 2021, 9, 1868. [Google Scholar] [CrossRef] [PubMed]
  23. Hernández, A.R.; Boutonnet, M.; Svensson, B.; Butler, E.; Lood, R.; Blom, K.; Vallejo, B.; Anderson, C.; Engblom, J.; Ruzgas, T.; et al. New concepts for transdermal delivery of oxygen based on catalase biochemical reactions studied by oxygen electrode amperometry. J. Control. Release 2019, 306, 121–129. [Google Scholar] [CrossRef] [PubMed]
  24. Björklund, S.; Nowacka, A.; Bouwstra, J.A.; Sparr, E.; Topgaard, D. Characterization of stratum corneum molecular dynamics by natural-abundance 13C solid-state NMR. PLoS ONE 2013, 8, e61889. [Google Scholar] [CrossRef] [PubMed]
  25. Fukui, M.; Kanoh, M.; Takamatsu, Y.; Arakawa, Y. Analysis of serum catalase activities in pancreatic diseases. J. Gastroenterol. 2004, 39, 469–474. [Google Scholar] [CrossRef]
  26. Cullen, J.J.; Mitros, F.A.; Oberley, L.W. Expression of Antioxidant Enzymes in Diseases of the Human Pancreas: Another Link Between Chronic Pancreatitis and Pancreatic Cancer. Pancreas 2003, 26, 23–27. [Google Scholar] [CrossRef]
  27. Sander, C.S.; Hamm, F.; Elsner, P.; Thiele, J.J. Oxidative stress in malignant melanoma and non-melanoma skin cancer. Br. J. Dermatol. 2003, 148, 913–922. [Google Scholar] [CrossRef]
  28. Carvalho, L.A.C.; Queijo, R.G.; Baccaro, A.L.B.; Siena, Á.D.D.; Silva, W.A.; Rodrigues, T.; Maria-Engler, S.S. Redox-Related Proteins in Melanoma Progression. Antioxidants 2022, 11, 438. [Google Scholar] [CrossRef]
  29. Hwang, T.S.; Choi, H.K.; Han, H.S. Differential expression of manganese superoxide dismutase, copper/zinc superoxide dismutase, and catalase in gastric adenocarcinoma and normal gastric mucosa. Eur. J. Surg. Oncol. (EJSO) 2007, 33, 474–479. [Google Scholar] [CrossRef]
  30. Schallreuter, K.U.; Moore, J.; Wood, J.M.; Beazley, W.D.; Gaze, D.C.; Tobin, D.J.; Marshall, H.S.; Panske, A.; Panzig, E.; Hibberts, N.A. In vivo and in vitro evidence for hydrogen peroxide (H2O2) accumulation in the epidermis of patients with vitiligo and its successful removal by a UVB-activated pseudocatalase. J. Investig. Dermatol. Symp. Proc. 1999, 4, 91–96. [Google Scholar] [CrossRef] [Green Version]
  31. Hadwan, M.H. Simple spectrophotometric assay for measuring catalase activity in biological tissues. BMC Biochem. 2018, 19, 7. [Google Scholar] [CrossRef]
  32. Jiang, Z.Y.; Woollard, A.C.; Wolff, S.P. Hydrogen peroxide production during experimental protein glycation. FEBS Lett. 1990, 268, 69–71. [Google Scholar] [CrossRef]
  33. Ou, P.; Wolff, S.P. A discontinuous method for catalase determination at ‘near physiological’ concentrations of H2O2 and its application to the study of H2O2 fluxes within cells. J. Biochem. Biophys. Methods 1996, 31, 59–67. [Google Scholar] [CrossRef]
  34. Clark, L.C.J.; Lyons, C. Electrode systems for continuous monitoring in cardiovascular surgery. Ann. New York Acad. Sci. 1962, 102, 29–45. [Google Scholar] [CrossRef] [PubMed]
  35. del Río, L.A.; Ortega, M.G.; López, A.L.; Gorgé, J.L. A more sensitive modification of the catalase assay with the Clark oxygen electrode: Application to the kinetic study of the pea leaf enzyme. Anal. Biochem. 1977, 80, 409–415. [Google Scholar] [CrossRef] [PubMed]
  36. Nocchi, S.; Björklund, S.; Svensson, B.; Engblom, J.; Ruzgas, T. Electrochemical monitoring of native catalase activity in skin using skin covered oxygen electrode. Biosens. Bioelectron. 2017, 93, 9–13. [Google Scholar] [CrossRef]
  37. Eskandari, M.; Rembiesa, J.; Startaite, L.; Holefors, A.; Valanciute, A.; Faridbod, F.; Ganjali, M.R.; Engblom, J.; Ruzgas, T. Polyphenol-hydrogen peroxide reactions in skin: In vitro model relevant to study ROS reactions at inflammation. Anal. Chim. Acta 2019, 1075, 91–97. [Google Scholar] [CrossRef]
  38. Truesdale, G.A.; Downing, A.L.; Lowden, G. The solubility of oxygen in pure water and sea-water. J. Chem. Technol. Biotechnol. 2007, 5, 53–62. [Google Scholar] [CrossRef]
  39. Scaglione, C.N.; Xu, Q.; Ramanujan, V.K. Direct measurement of catalase activity in living cells and tissue biopsies. Biochem. Biophys. Res. Commun. 2016, 470, 192–196. [Google Scholar] [CrossRef] [PubMed]
  40. Tomassetti, M.; Pezzilli, R.; Prestopino, G.; Di Biagio, F.; Di Natale, C.; Medaglia, P.G. A New Clark-Type Layered Double Hydroxides-Enzyme Biosensor for H2O2 Determination in Highly Diluted Real Matrices: Milk and Cosmetics. Processes 2021, 9, 1878. [Google Scholar] [CrossRef]
  41. Beers, R.F.; Sizer, I.W. A spectrophotometric method for measuring the breakdown of hydrogen peroxide by catalase. J. Biol. Chem. 1952, 195, 133–140. [Google Scholar] [CrossRef] [PubMed]
  42. Mumby, S.; Block, R.; Petros, A.J.; Gutteridge, J.M.C. Hydrogen peroxide and catalase are inversely related in adult patients undergoing cardiopulmonary bypass: Implications for antioxidant protection. Redox Rep. 1999, 4, 49–52. [Google Scholar] [CrossRef] [PubMed]
  43. Ueno, S.; Iwasaka, M. Catalytic activity of catalase under strong magnetic fields of up to 8 T. J. Appl. Phys. 1996, 79, 4705. [Google Scholar] [CrossRef]
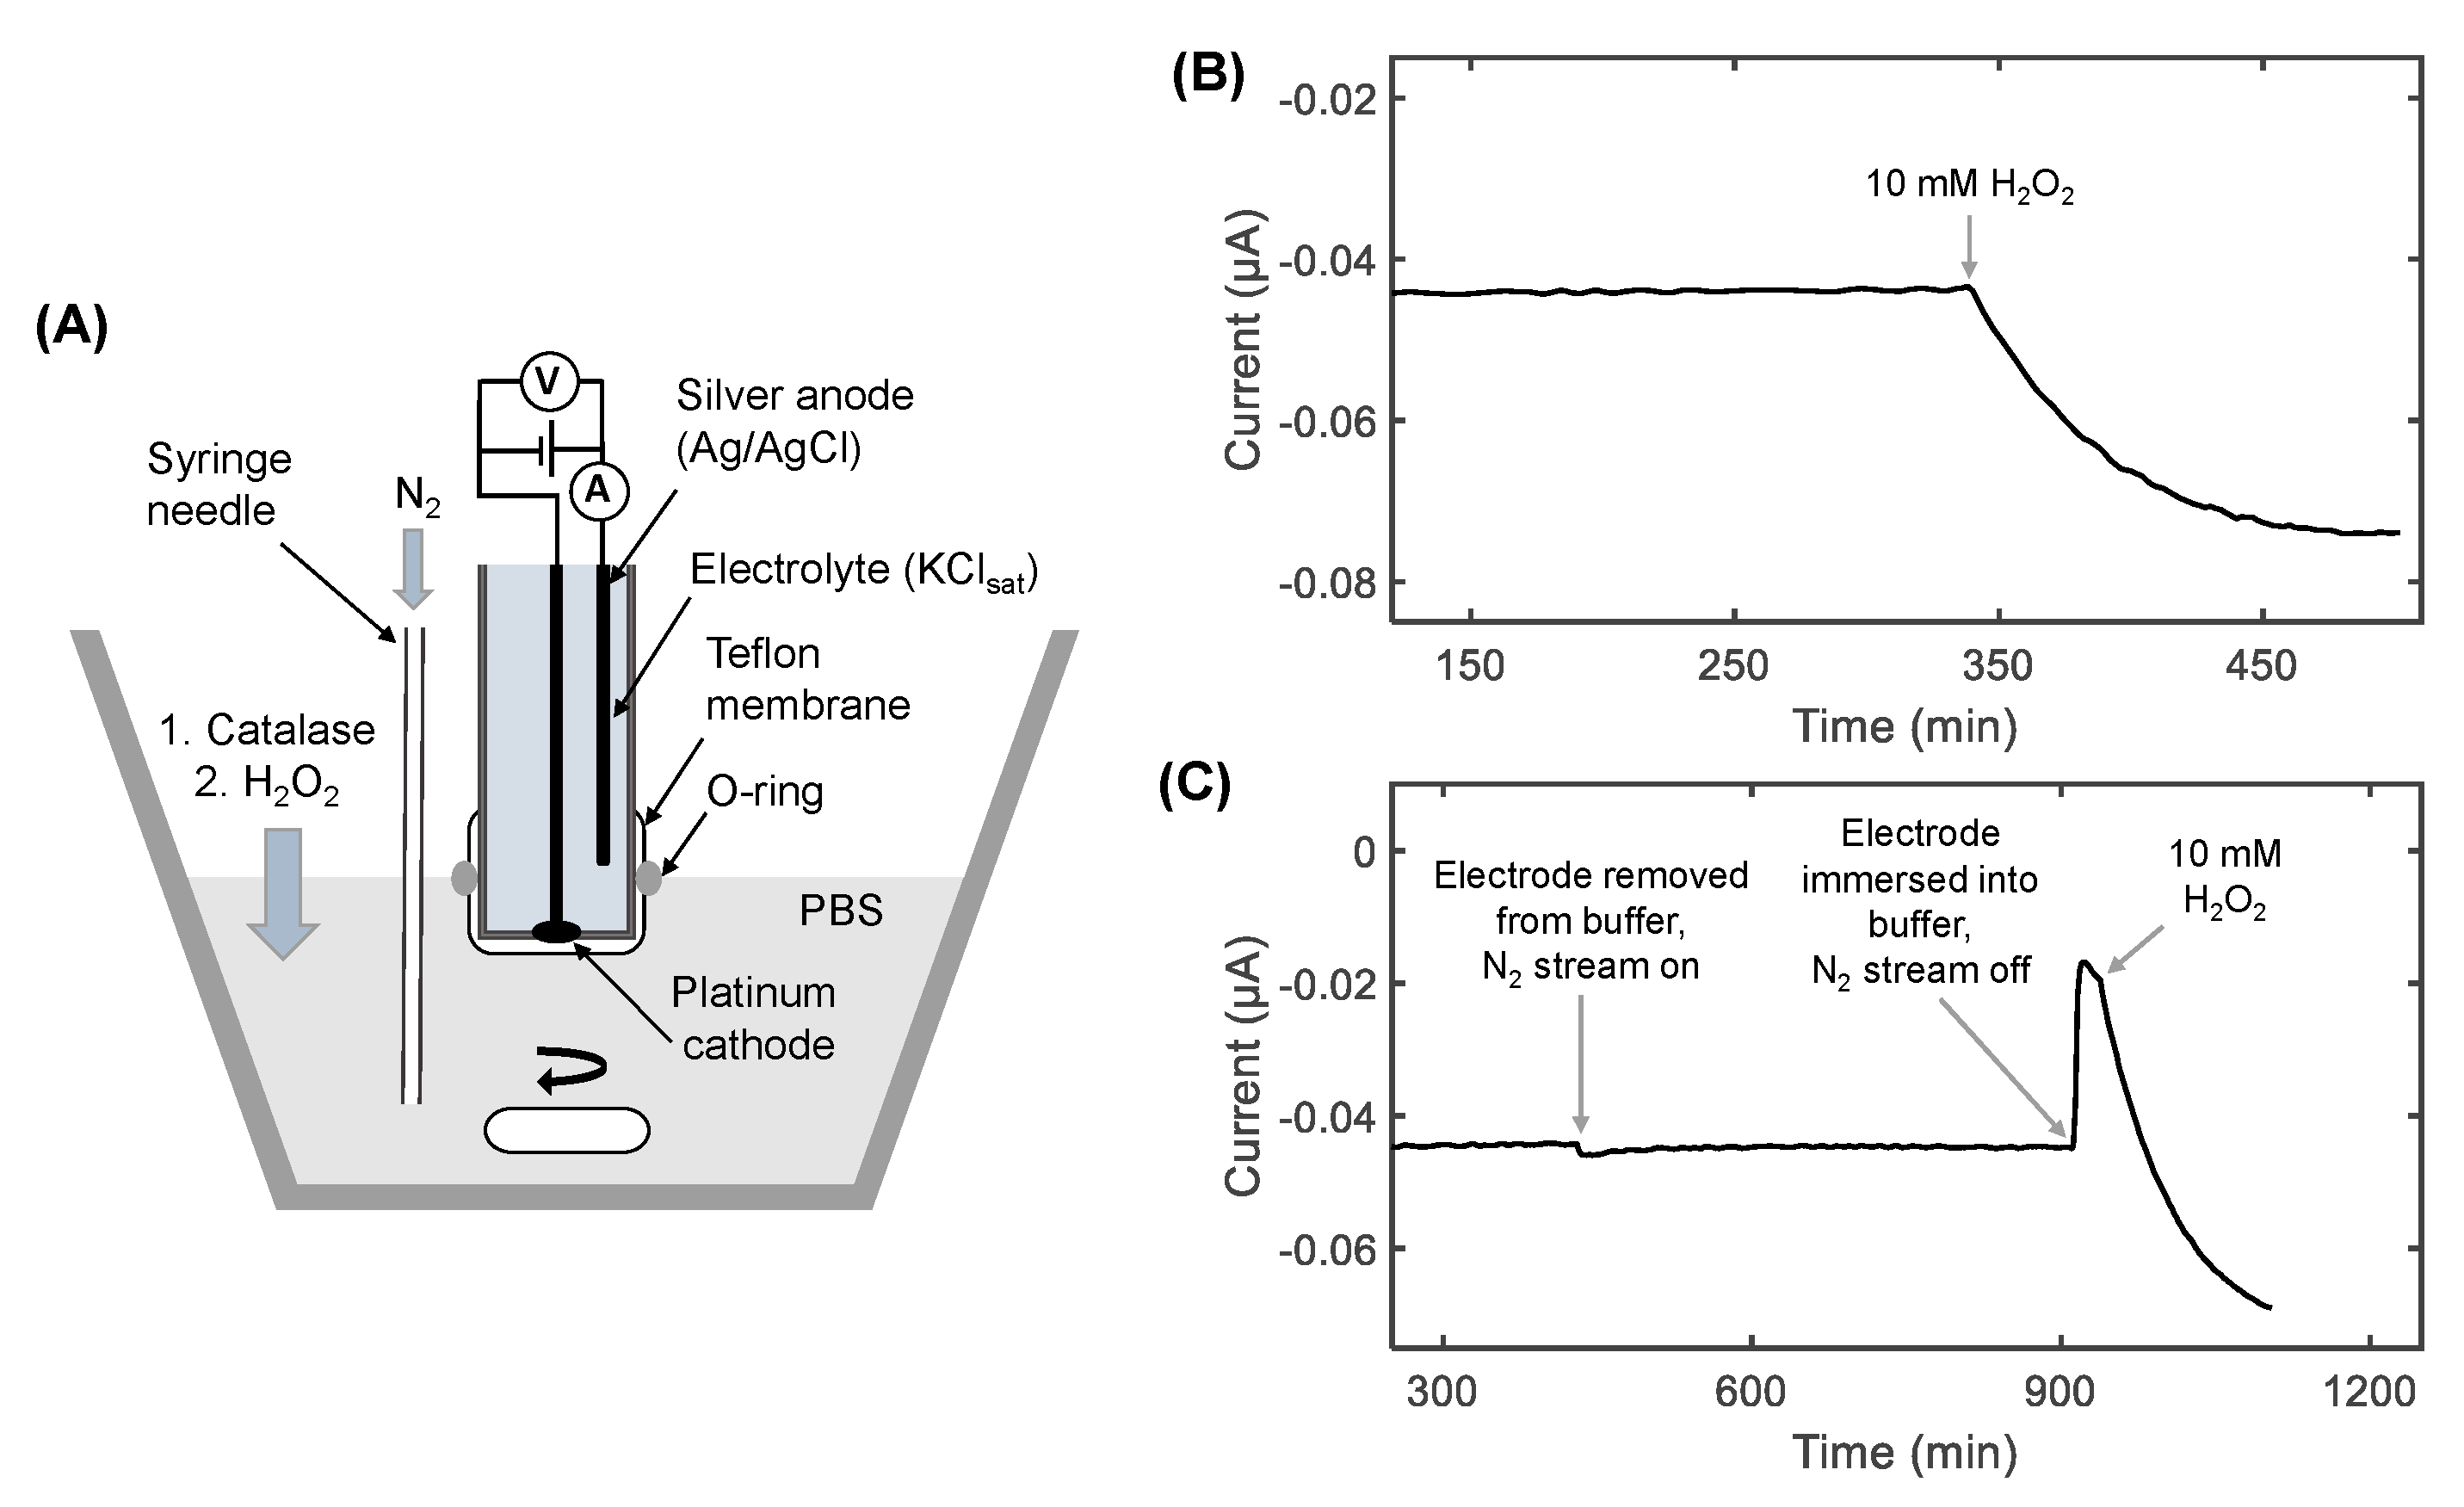
Figure 1. (A) Shows a schematic presentation of the setup used to determine catalase activity using oxygen electrode chronoamperometry. Catalase is kept in the measuring cell (added after reaching a stable baseline and prior to N2 purging). (B,C) show raw data from chronoamperometry, where (B) is without and (C) is with deoxygenation prior to addition of H2O2. In (B), the initial O2 concentration is in equilibrium with the atmospheric O2, after which H2O2 is added (around 340 s), resulting in an increase in the reduction current due to production of O2. In (C), the electrode was removed from the buffer (around 400 s), which was purged with N2 for several minutes, effectively removing O2 before adding H2O2.
Oxygen 03 00006 g001
Figure 2. The effect of deoxygenation and substrate concentration on the catalase activity obtained with oxygen electrode chronoamperometry. Experiments were conducted in PBS in equilibrium with atmospheric O2 (i.e., air equilibrated, black bars) or in deoxygenated PBS (grey bars). All experiments were conducted in triplicates (n = 3, mean ± SD) and with pH 7.4. ** p < 0.01 and ns = p > 0.05.
Oxygen 03 00006 g002
Figure 3. Comparison of catalase activity values obtained with UV spectrophotometry (white bars) and oxygen (O2) electrode chronoamperometry (grey and black bars). White and grey bars show data obtained with PBS in equilibrium with atmospheric buffer (i.e., air equilibrated), while black bars show data obtained with deoxygenated PBS. The concentration of catalase used in these experiments was either 0.46 nM or 4.6 nM. A fixed concentration of 10 mM H2O2 was used in all cases. All experiments were conducted in triplicate (n = 3, mean ± SD), in PBS with pH 7.4. * p < 0.05, ** p < 0.01, *** p < 0.001 and ns = p > 0.05.
Oxygen 03 00006 g003
Table 1. Catalase reaction rate v and specific catalase activity determined with either oxygen (O2) electrode chronoamperometry or spectrophotometry (UV) under different conditions (e.g., variable catalase and substrate concentrations, and in PBS in equilibrium with atmospheric O2 or deoxygenated with N2).
MethodCatalase (nM)H2O2 (mM)Protocolv (µM O2 s−1)Specific Activity
(µmol H2O2 min−1 mg−1)
O2 electrode0.461Air equilibrated0.62 ± 0.088670 ± 100
0.461Deoxygenated1.4 ± 0.261540 ± 280
0.4610Air equilibrated3.1 ± 0.483370 ± 520
0.4610Deoxygenated4.7 ± 0.294000 ± 320
4.610Air equilibrated38 ± 5.94170 ± 650
4.610Deoxygenated44 ± 0.104840 ± 110
UV assay0.4610Air equilibrated1.0 ± 0.231130 ± 360
4.610Air equilibrated32 ± 1.73440 ± 190
Disclaimer/Publisher’s Note: The statements, opinions and data contained in all publications are solely those of the individual author(s) and contributor(s) and not of MDPI and/or the editor(s). MDPI and/or the editor(s) disclaim responsibility for any injury to people or property resulting from any ideas, methods, instructions or products referred to in the content.