
Sixteen Years of Measurements of Ozone over Athens, Greece with a Brewer Spectrophotometer


Abstract
:1. Introduction
2. Data Sources and Methods
3. Results and Discussion
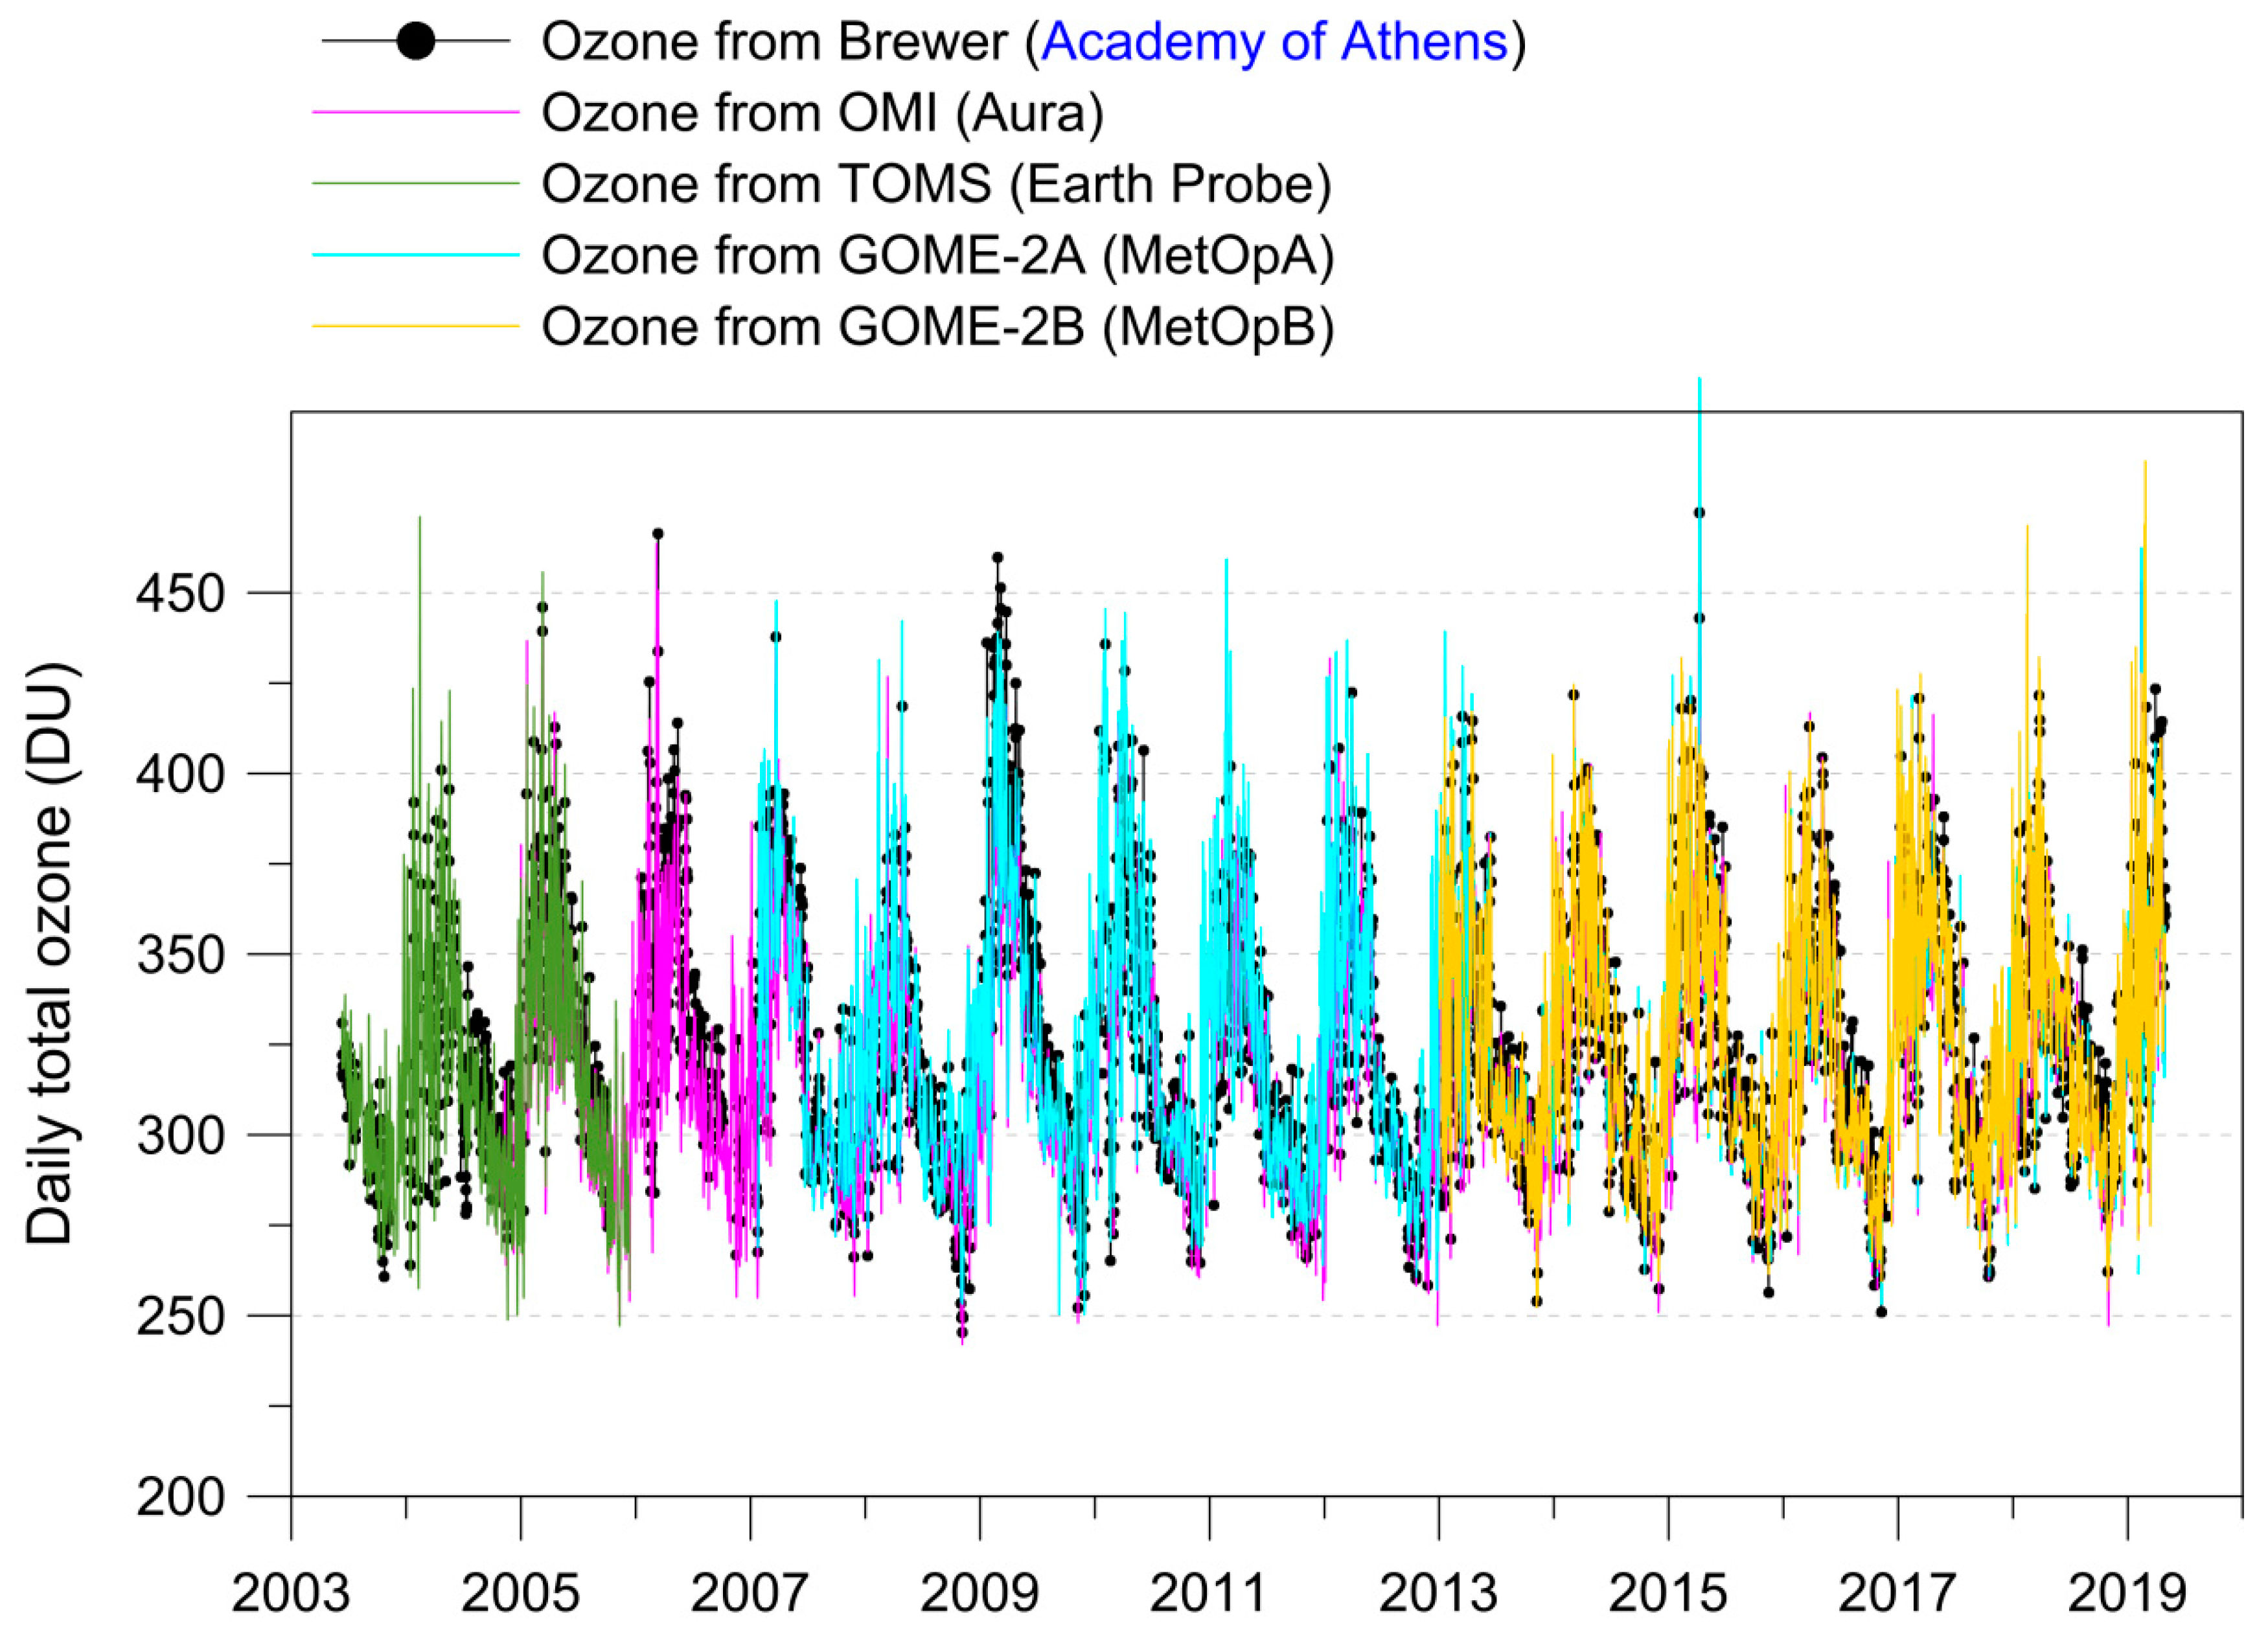
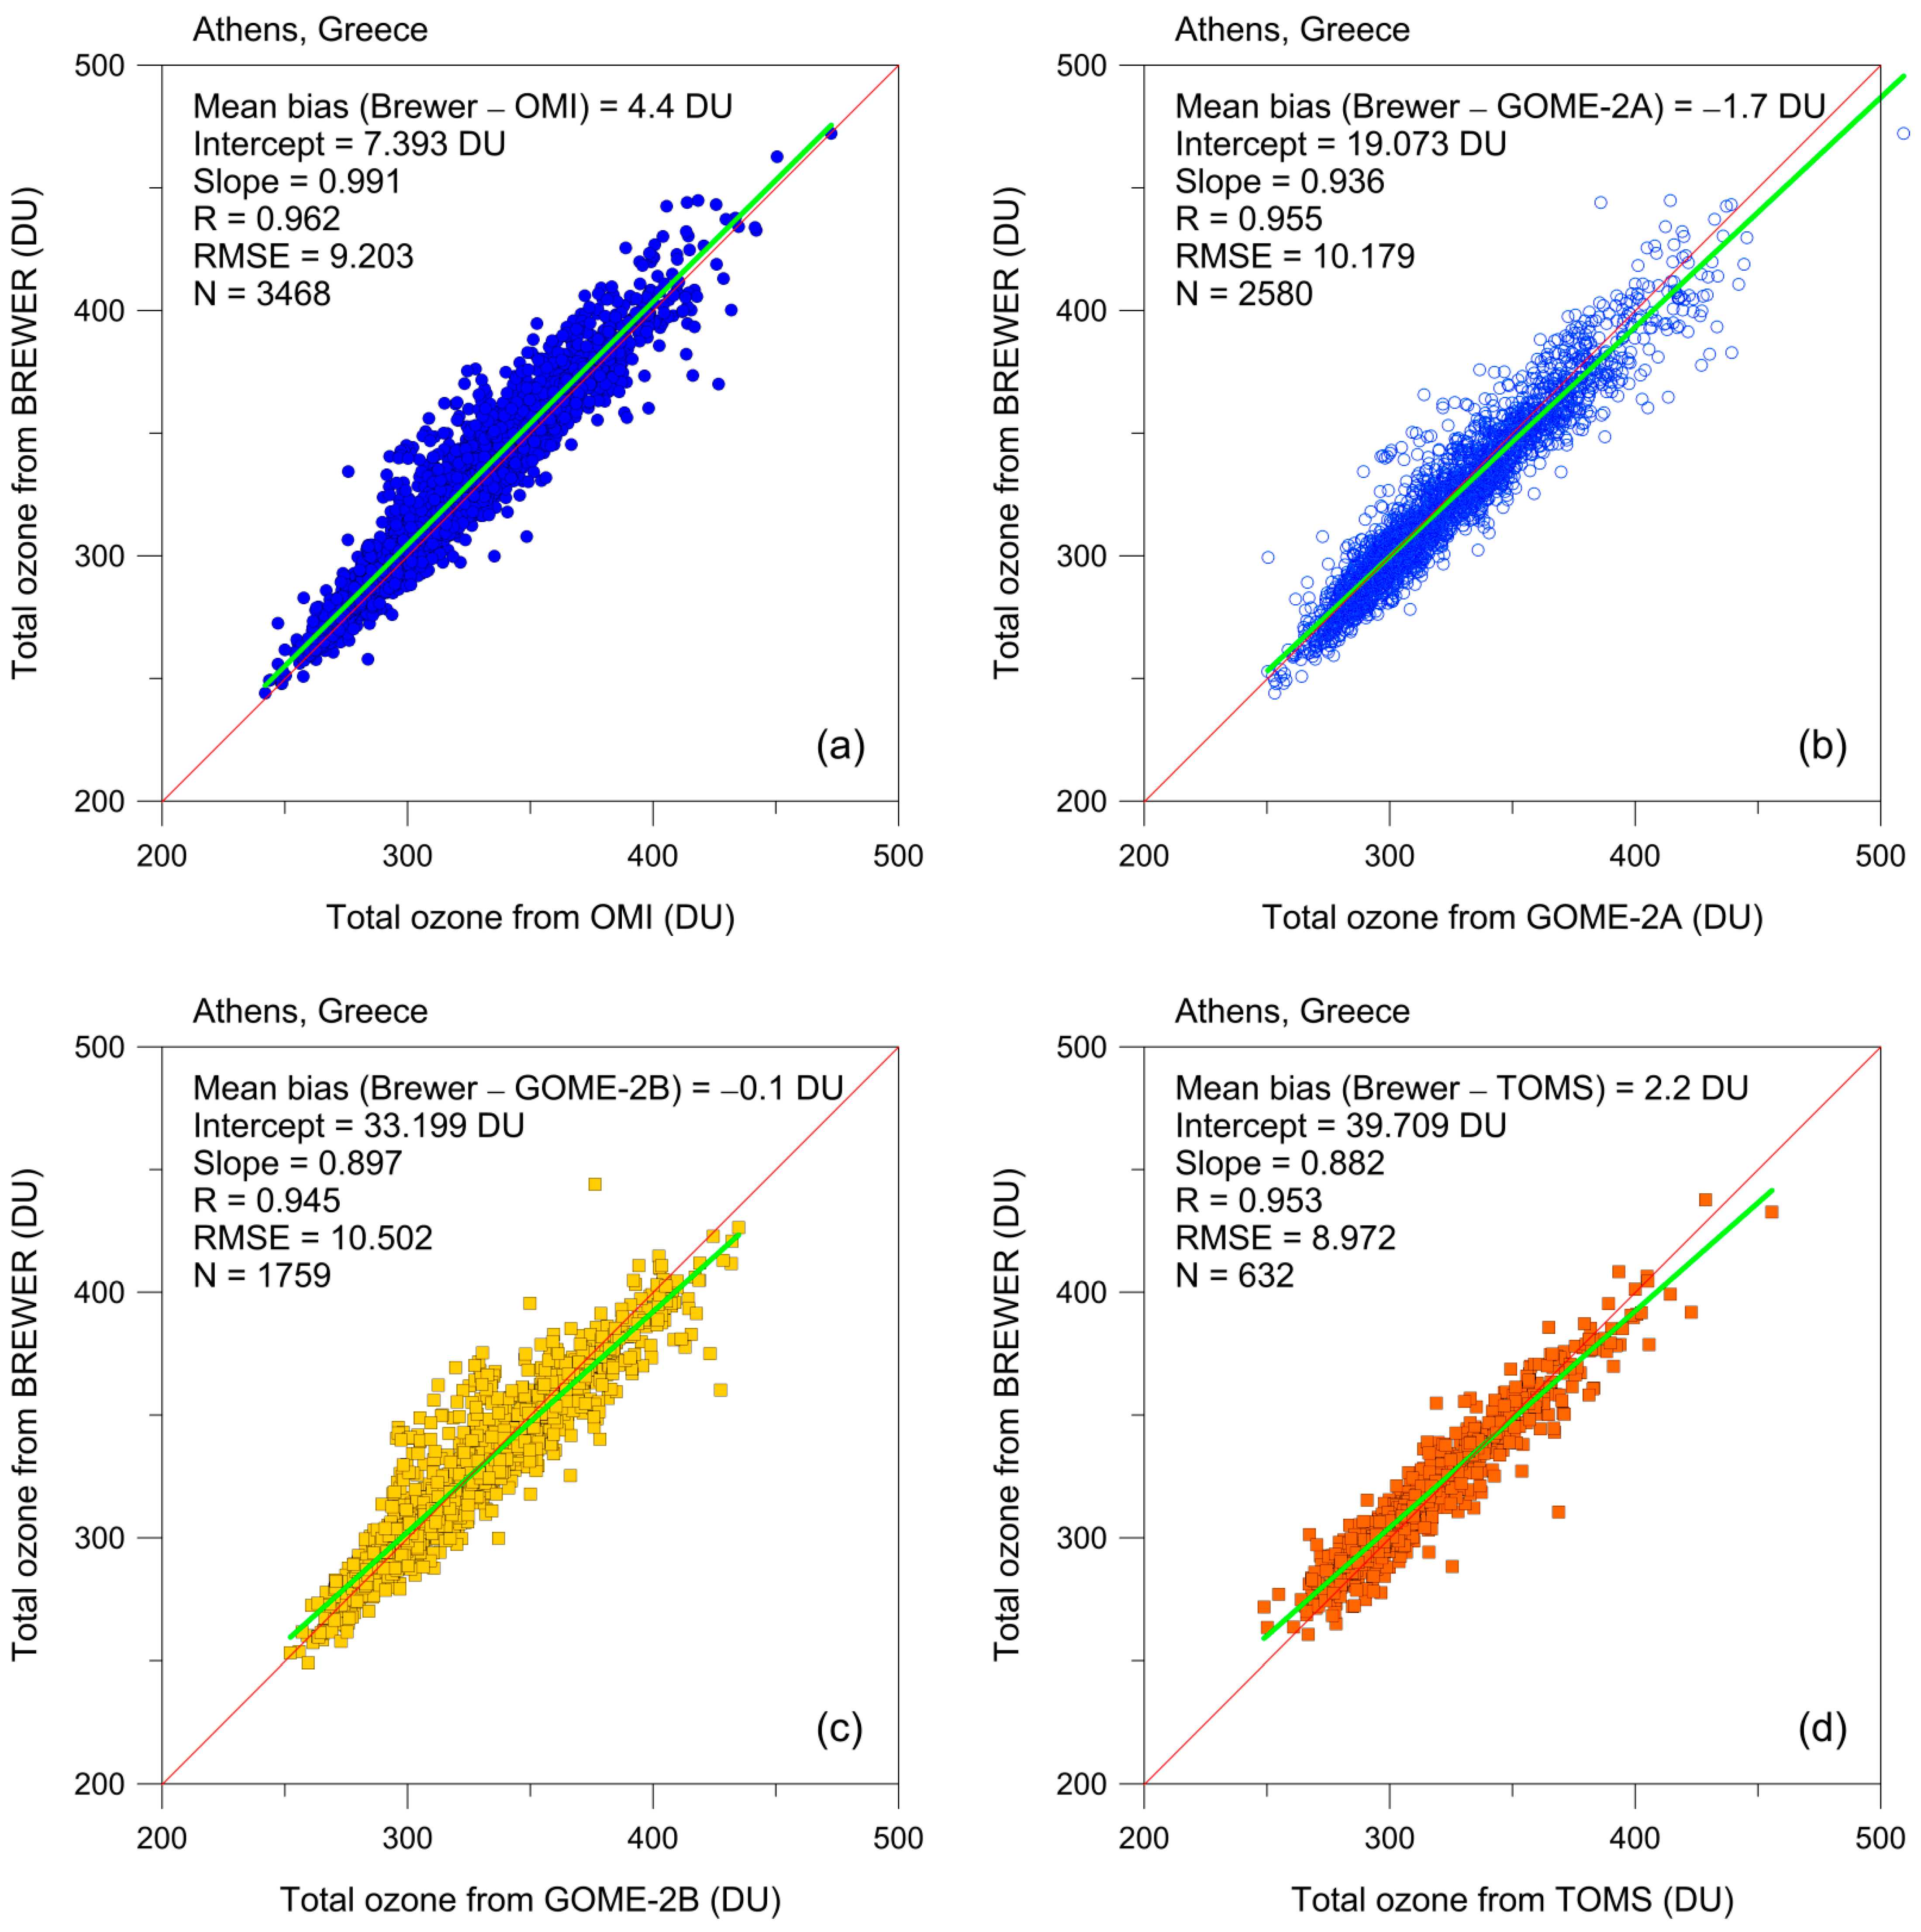
3.1. Daily Values and Correlations
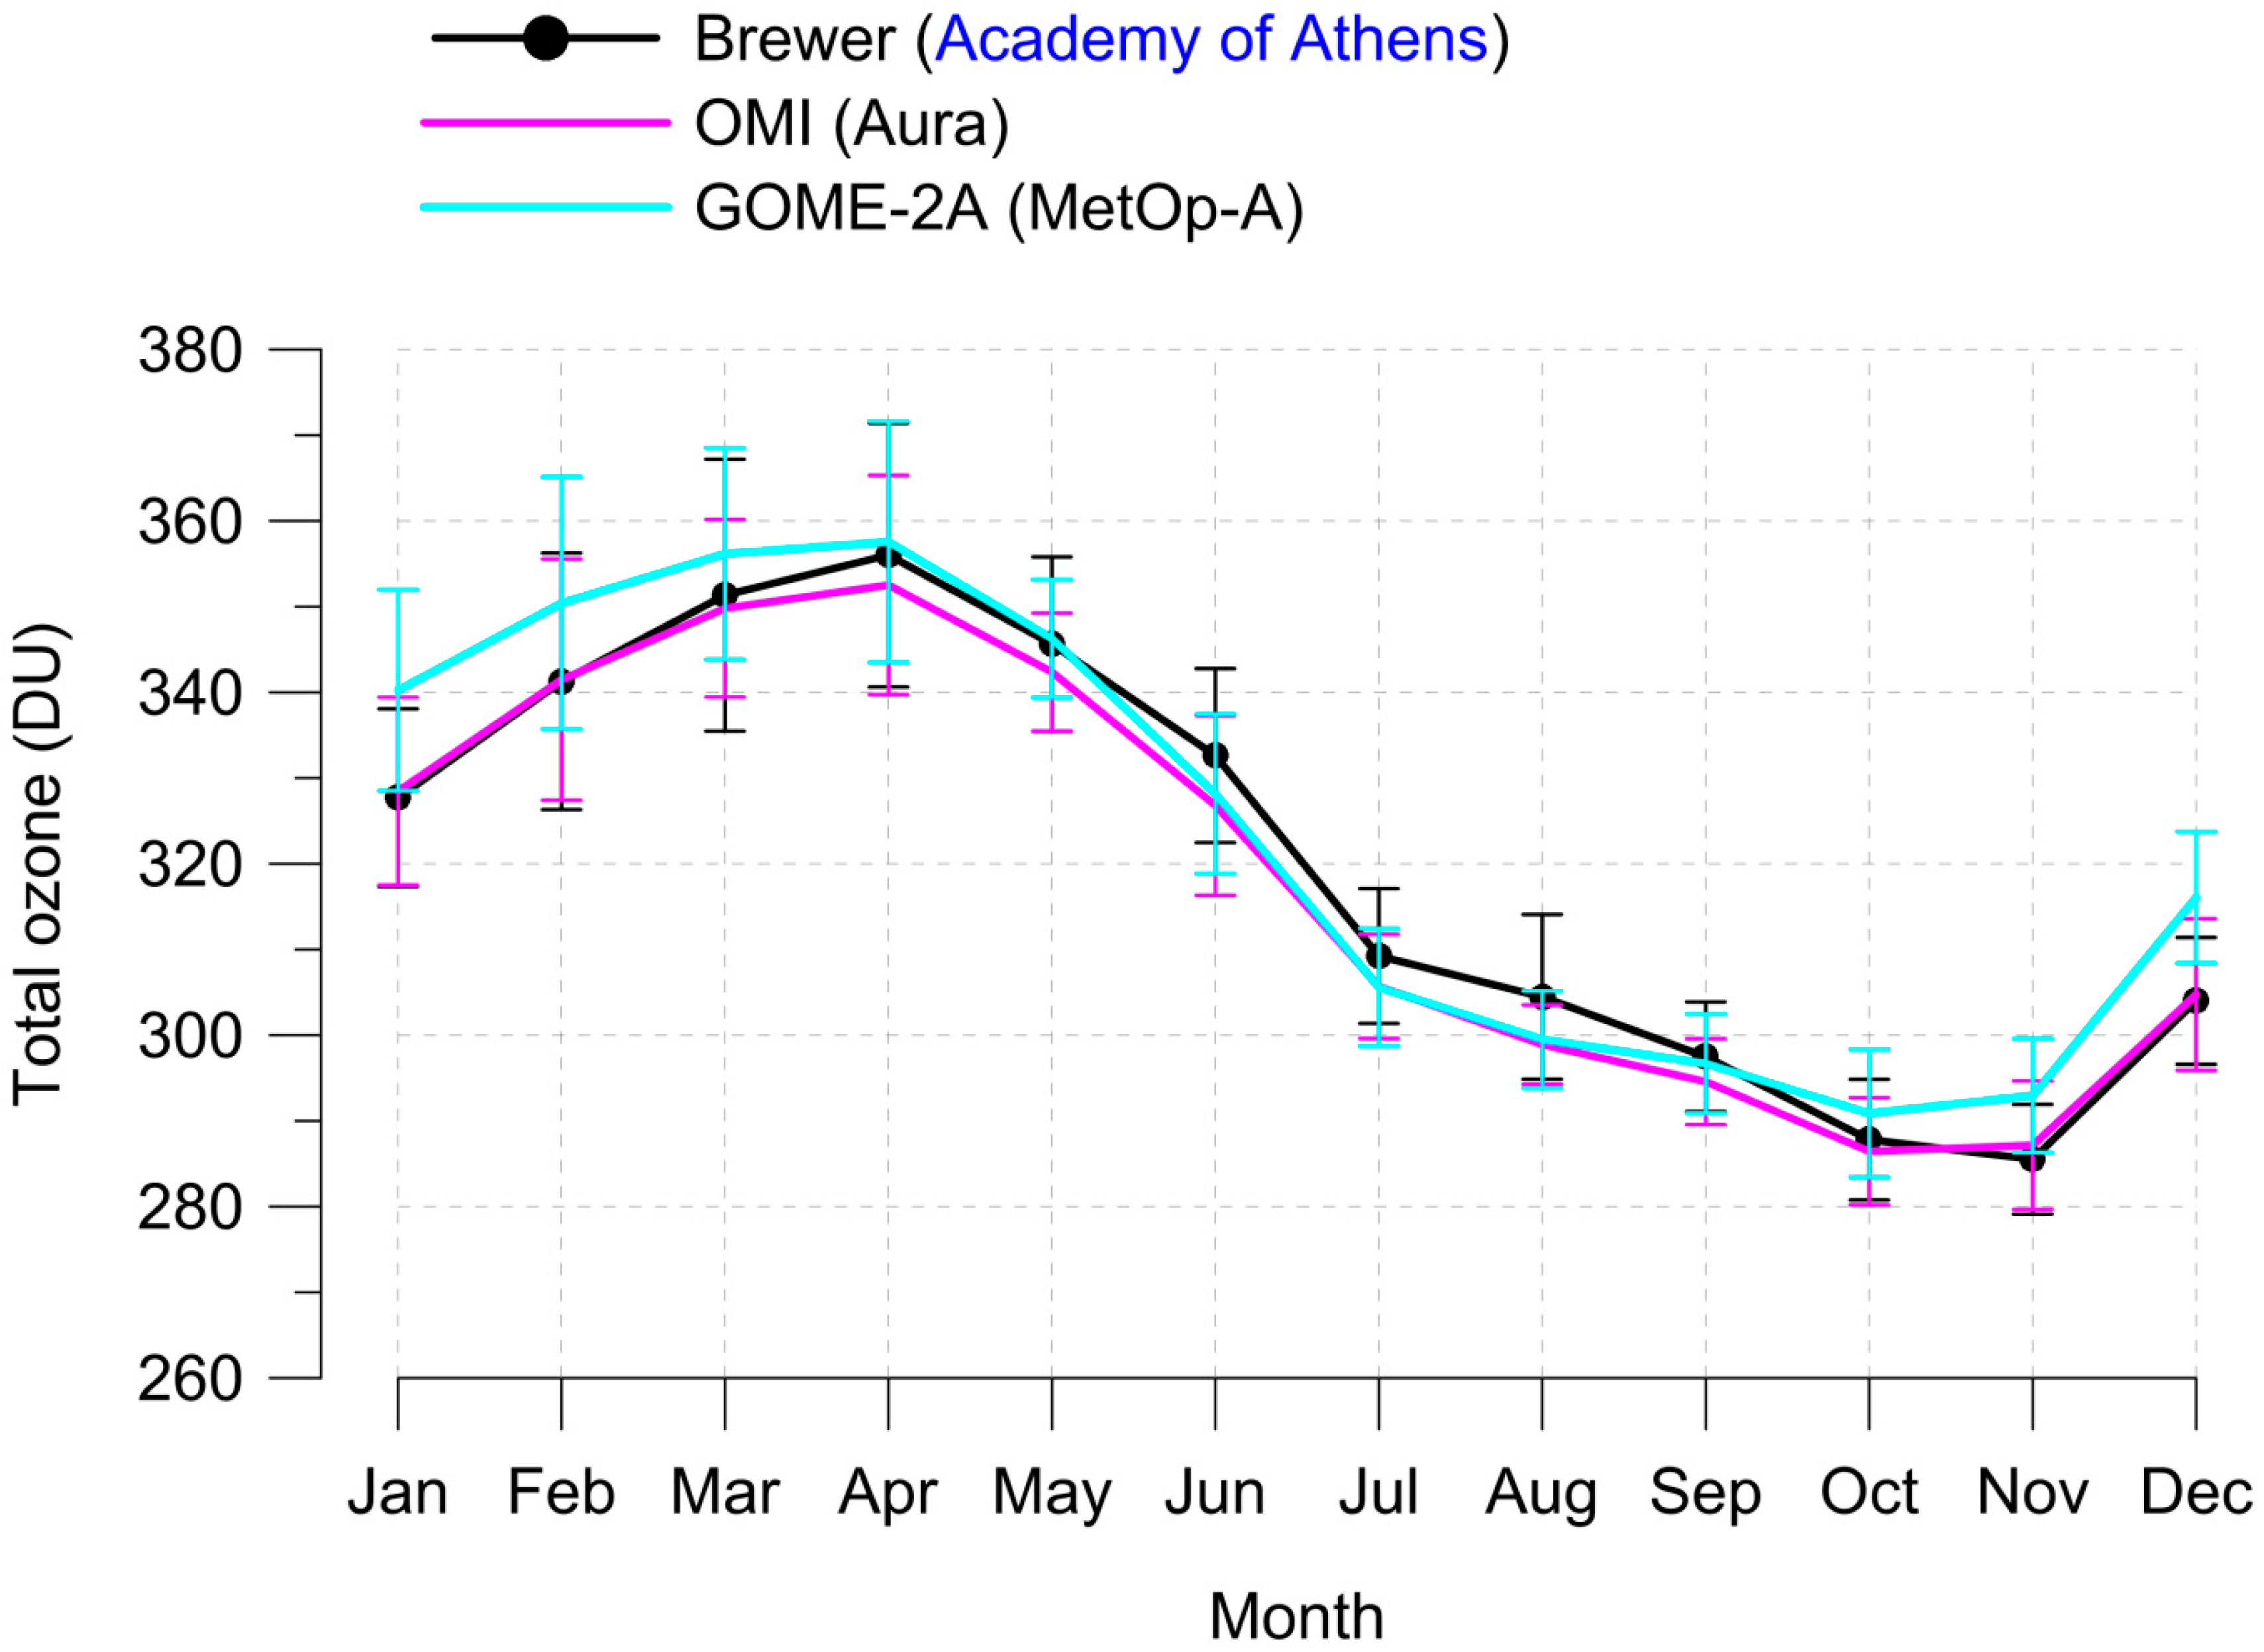
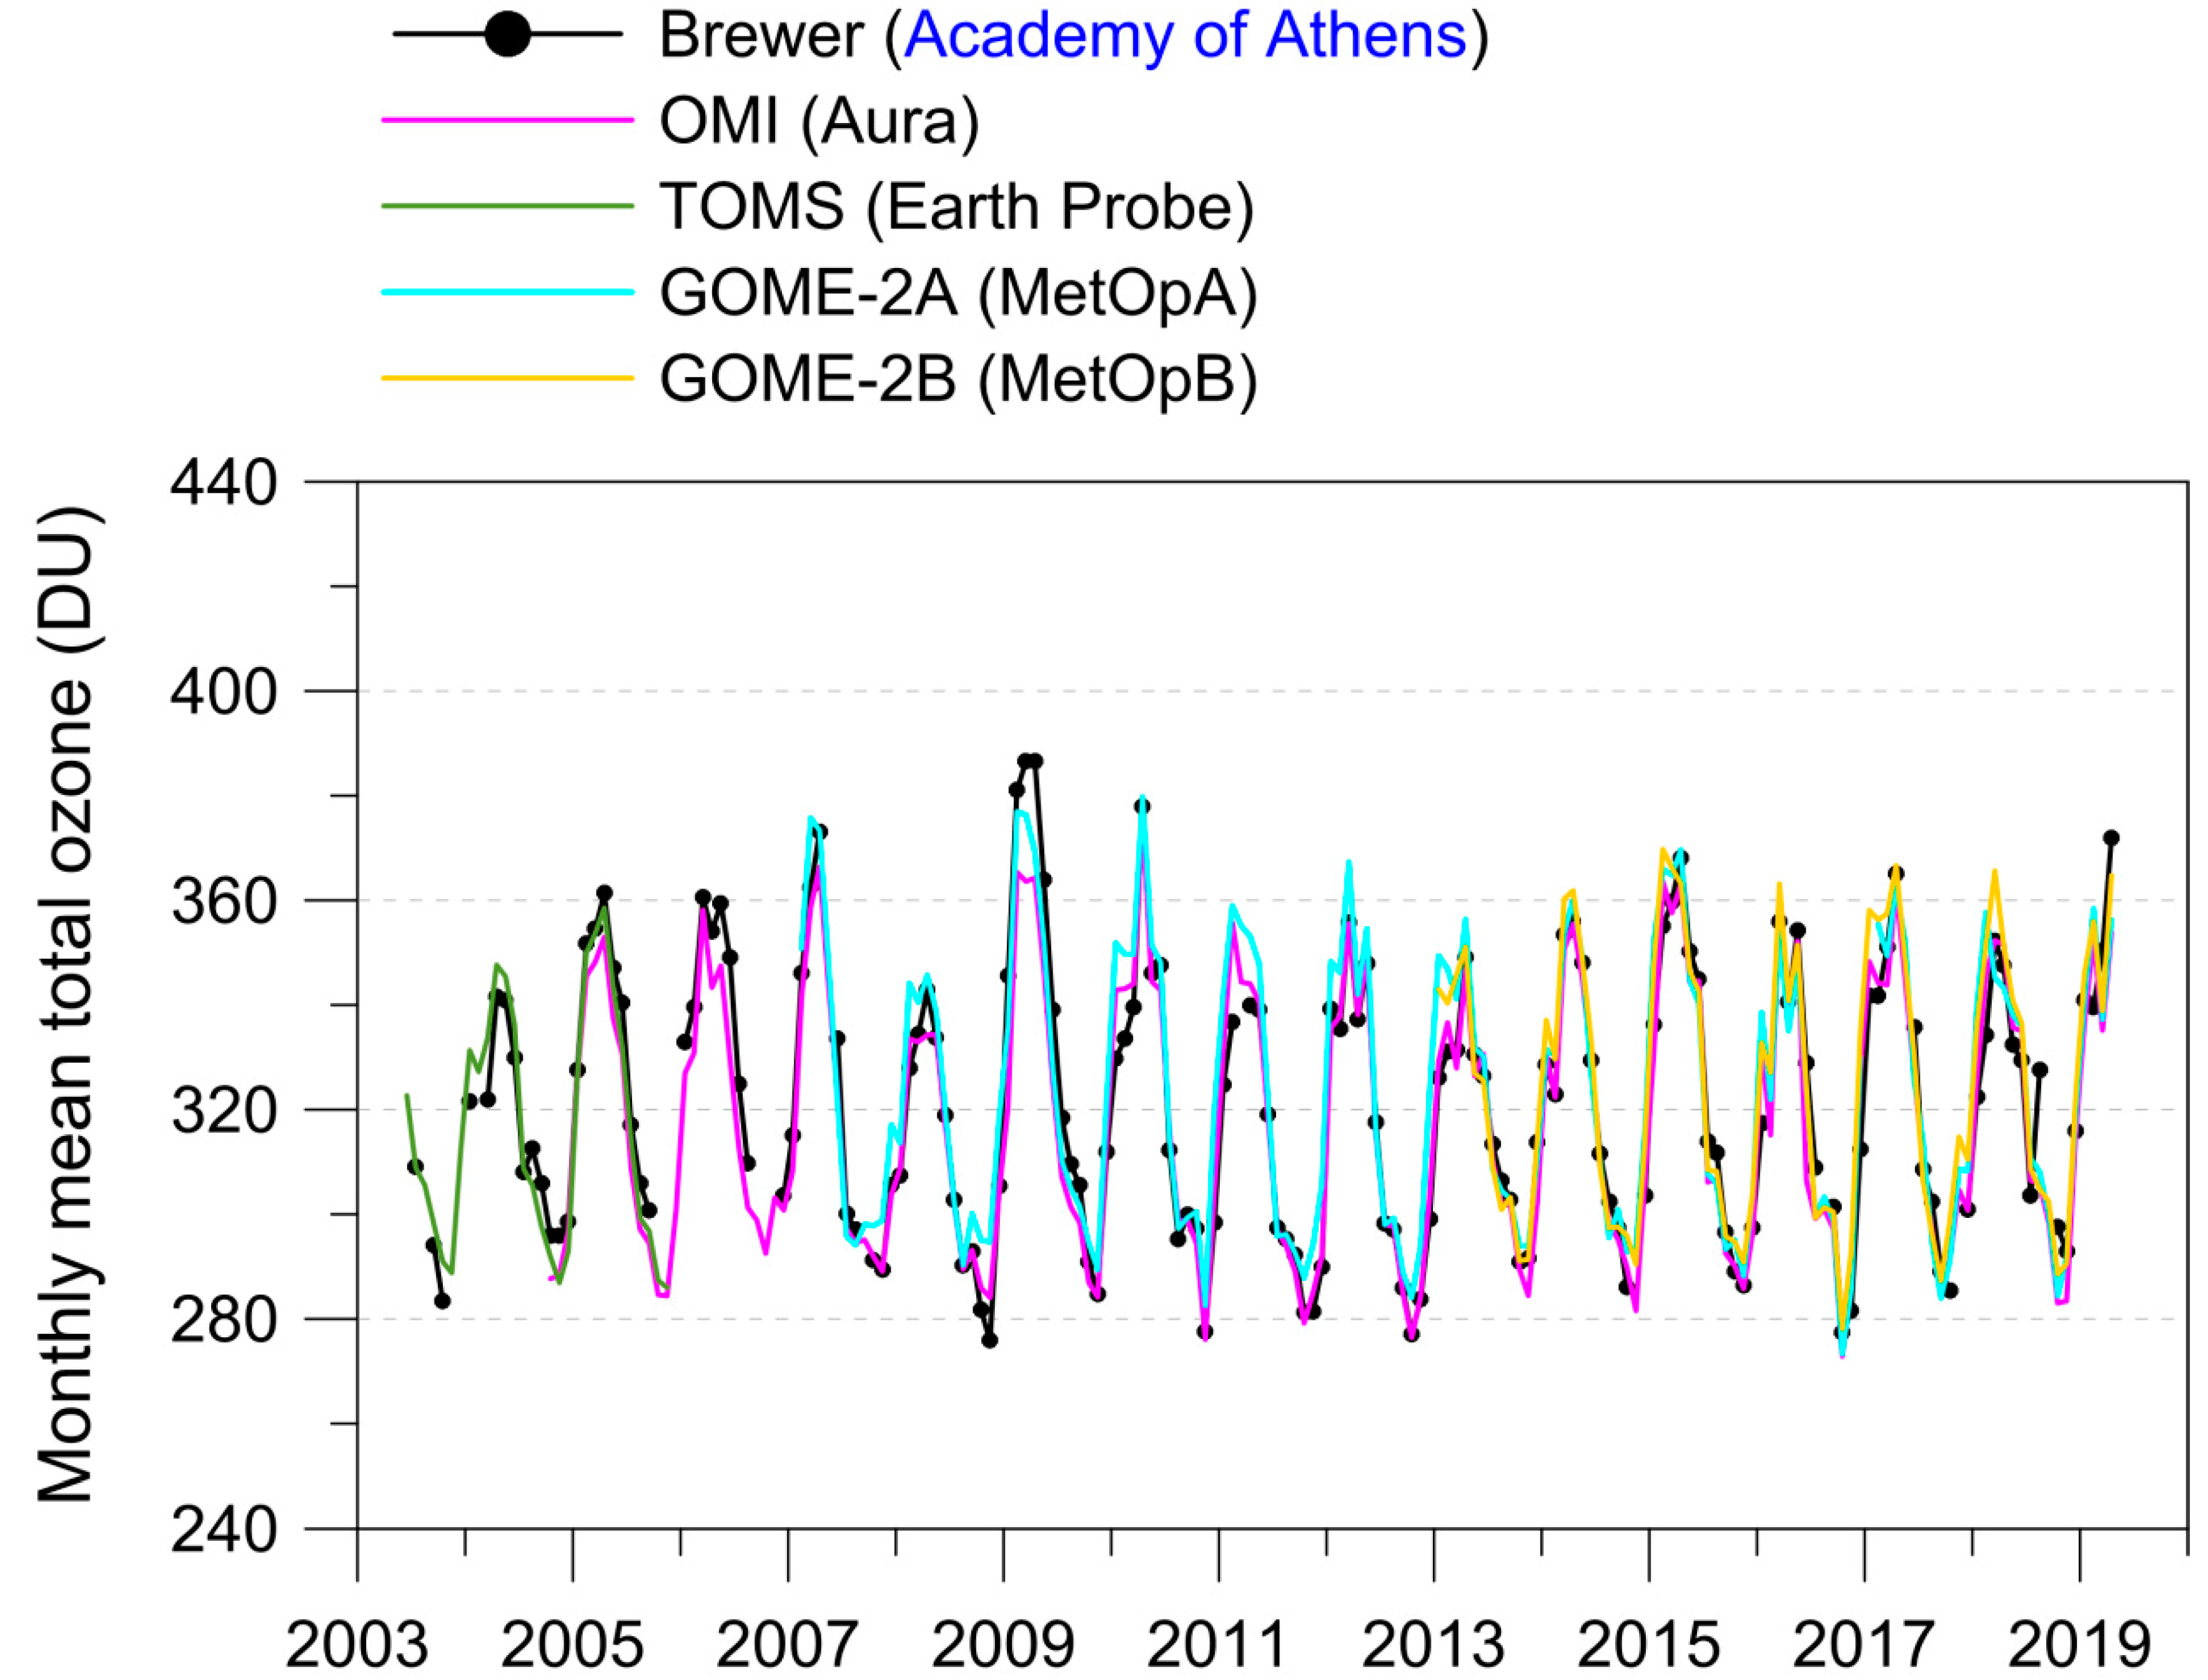
3.2. Monthly Means and Annual Cycle
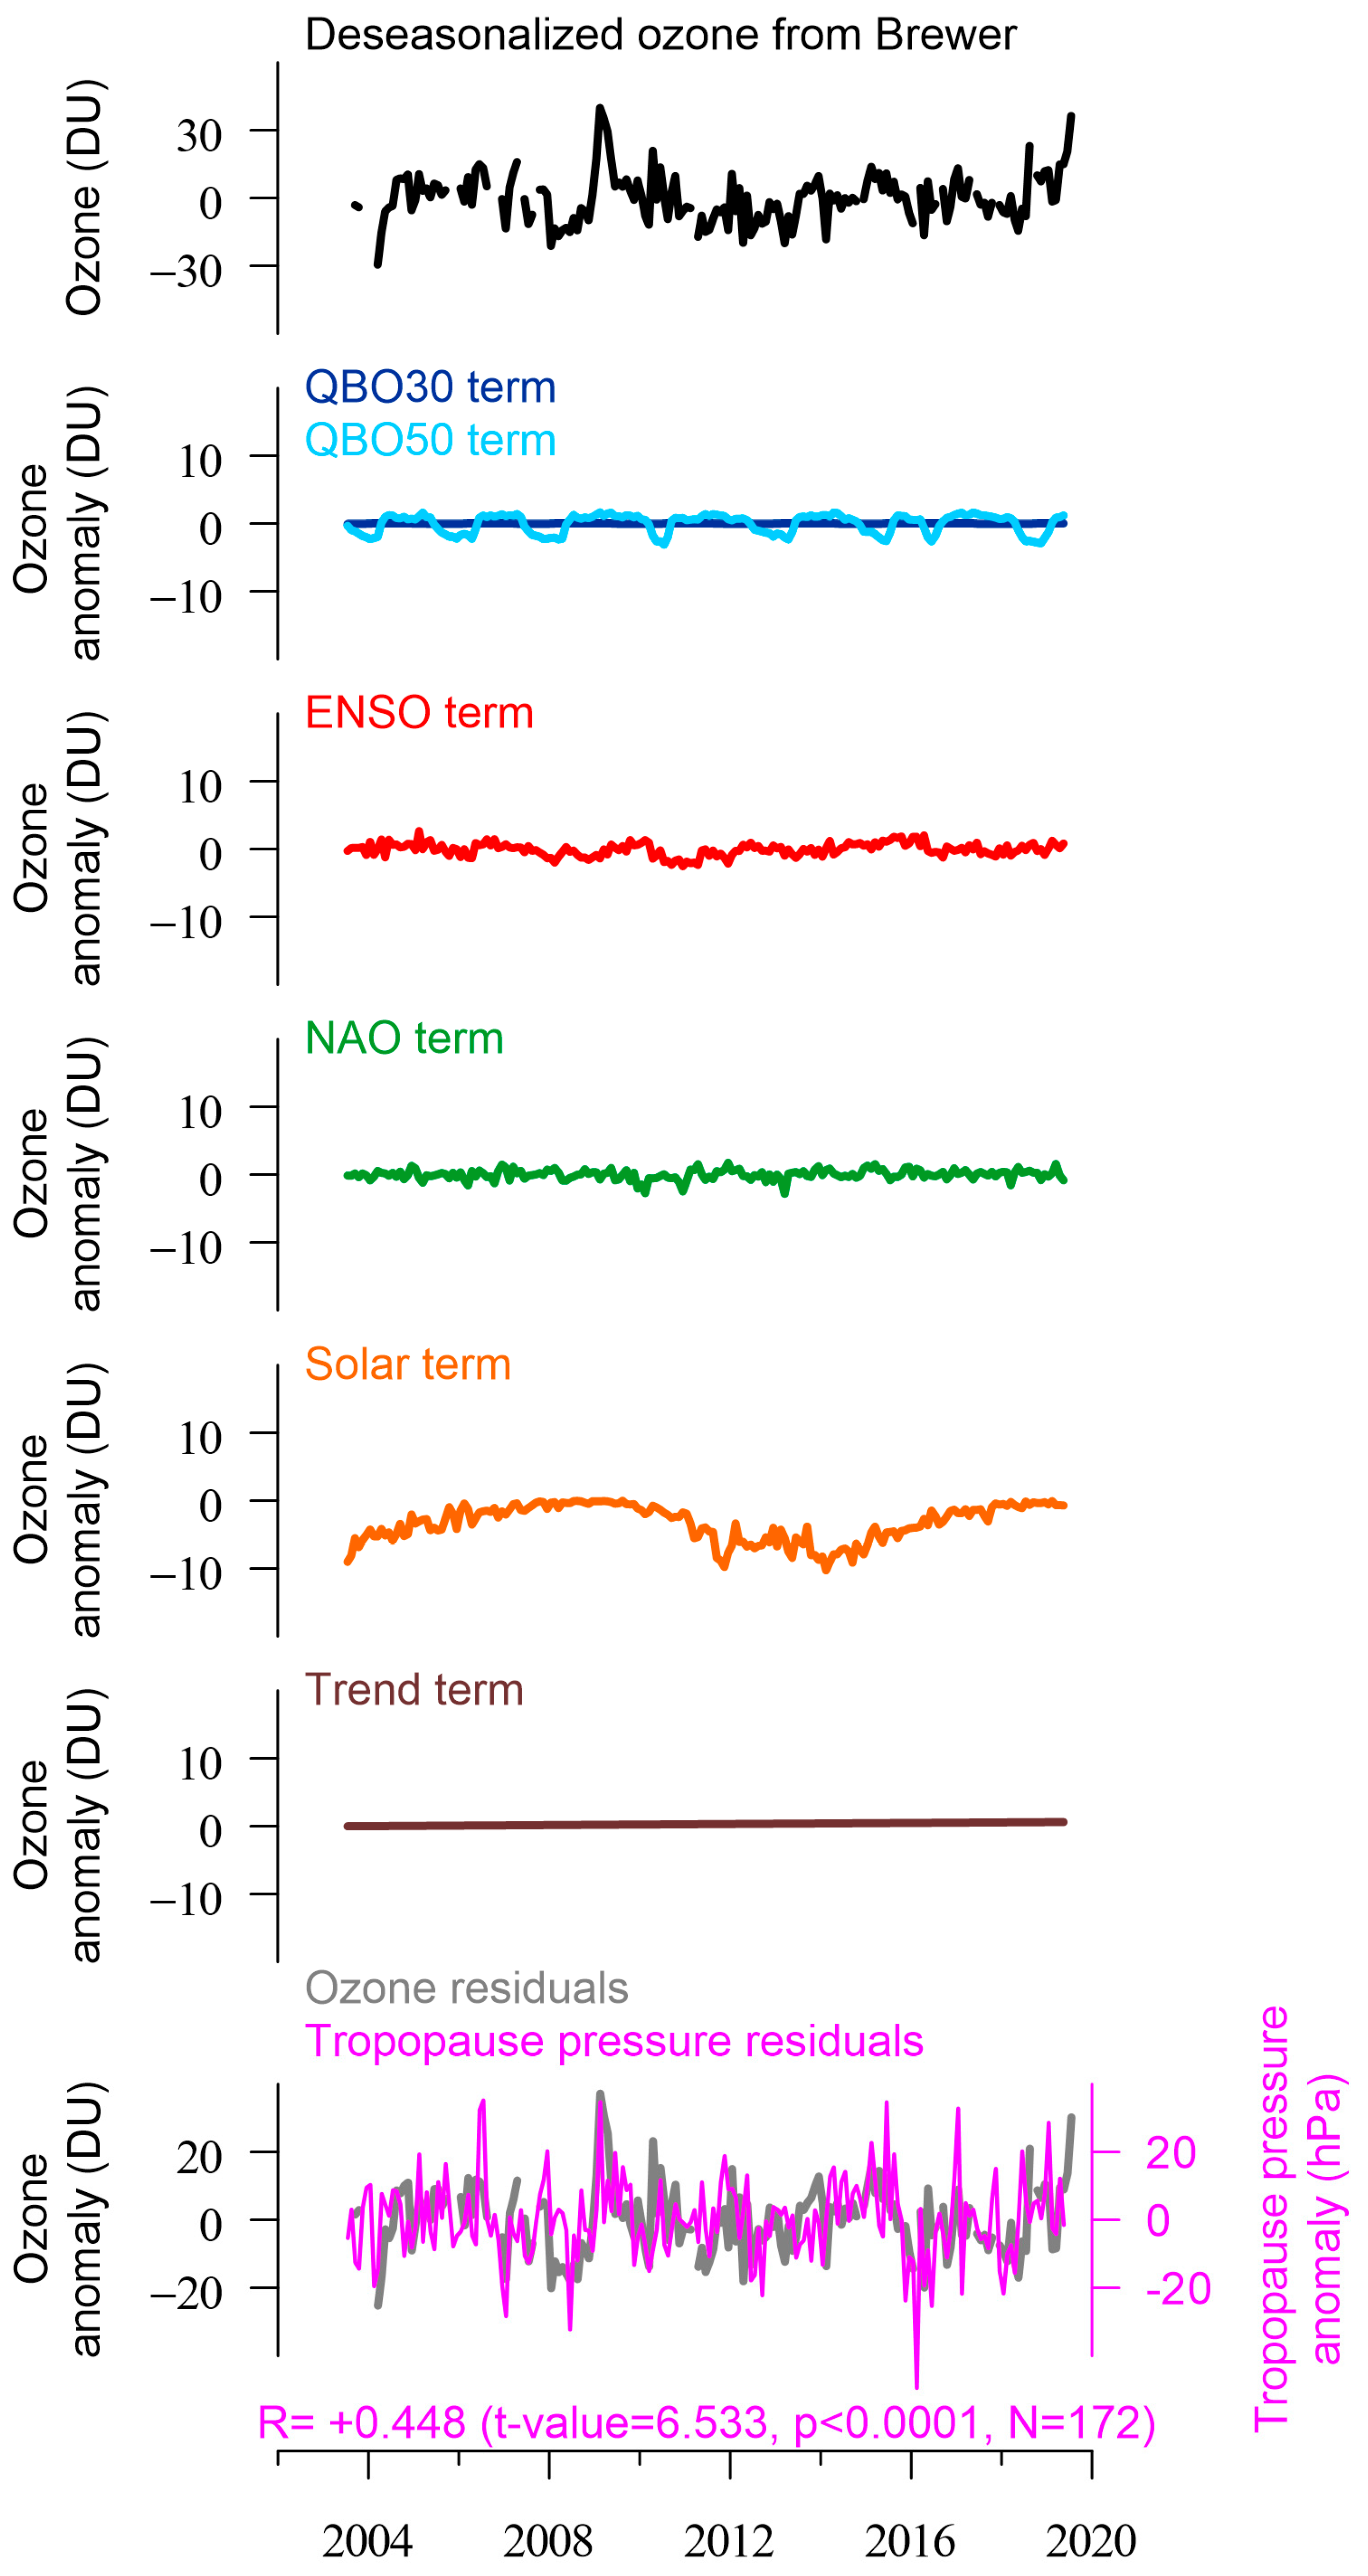
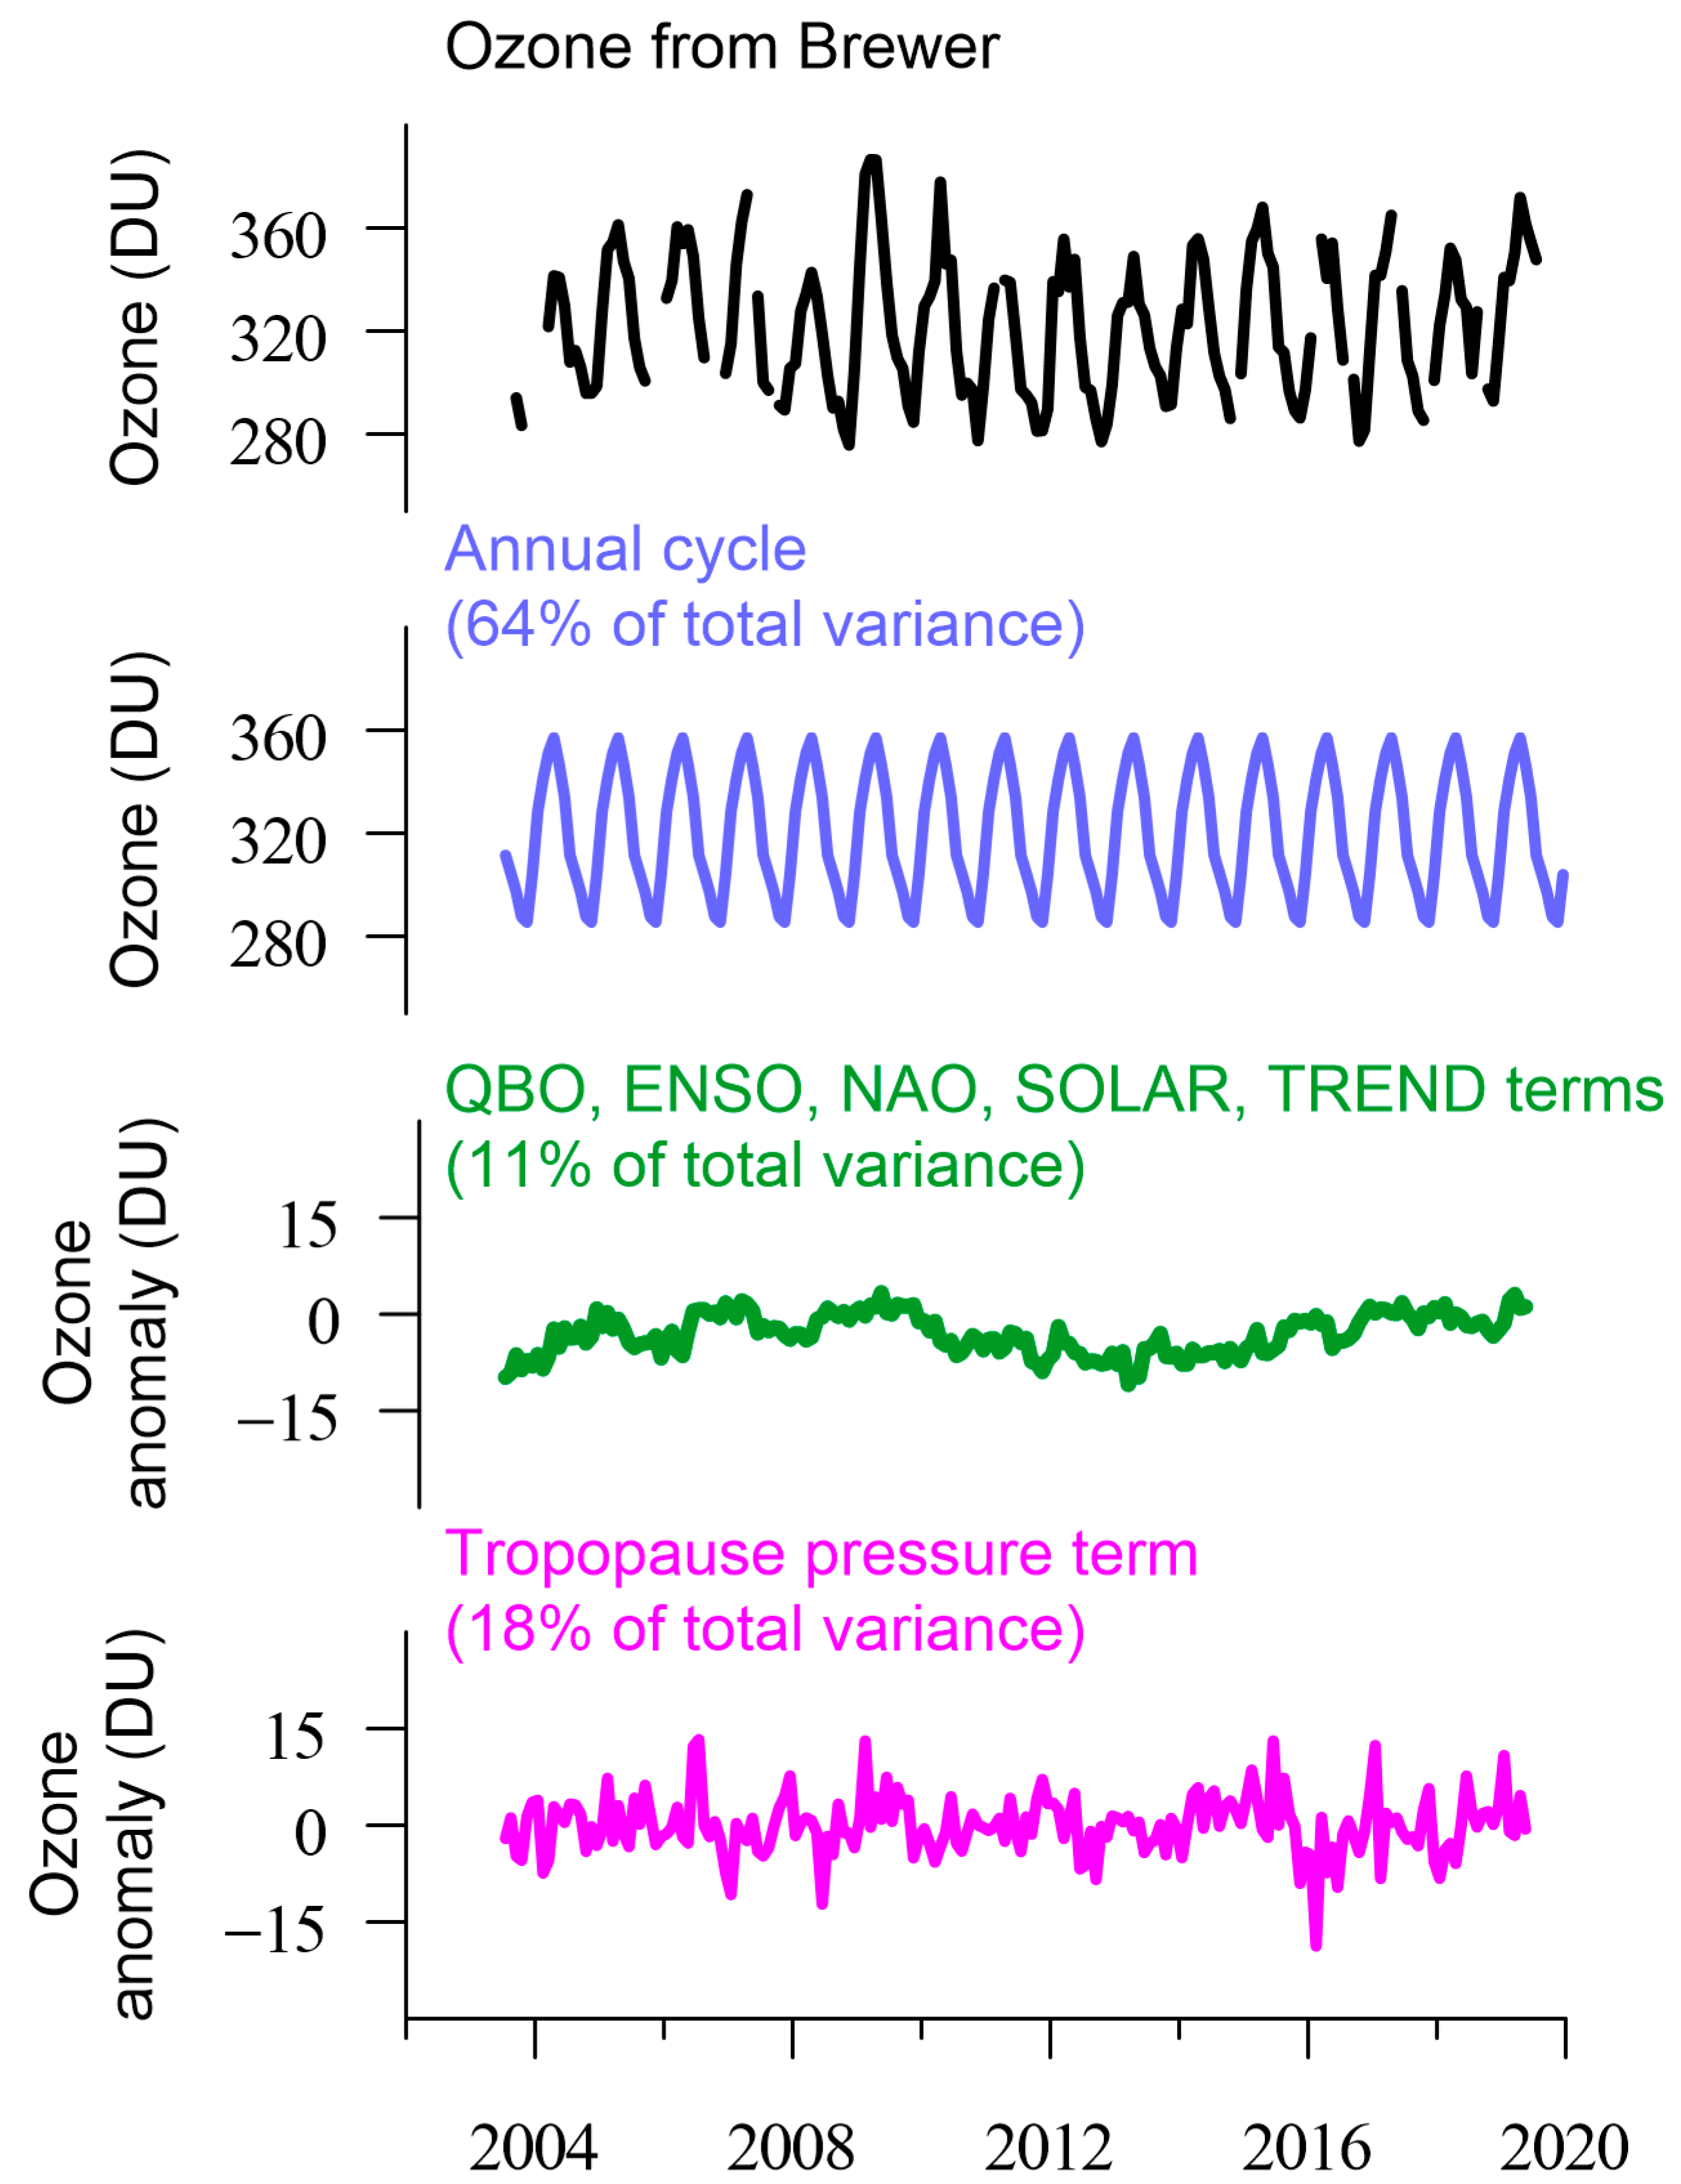
3.3. Ozone Variability
4. Conclusions
- There are strong correlations between total ozone from the Brewer spectrophotometer and total ozone from the OMI, TOMS, GOME-2A and GOME-2B satellite instruments greater than 0.9.
- The main contribution to ozone variability comes from the seasonal cycle. We estimate that the seasonal variability explains about 64% of the variability in total ozone over Athens.
- Natural fluctuations (QBO, ENSO, NAO, solar cycle trend) together explain about 11% of total ozone variability. Adding the variability related to the tropopause pressure, the multiple linear regression model explains about 27% of ozone fluctuations.
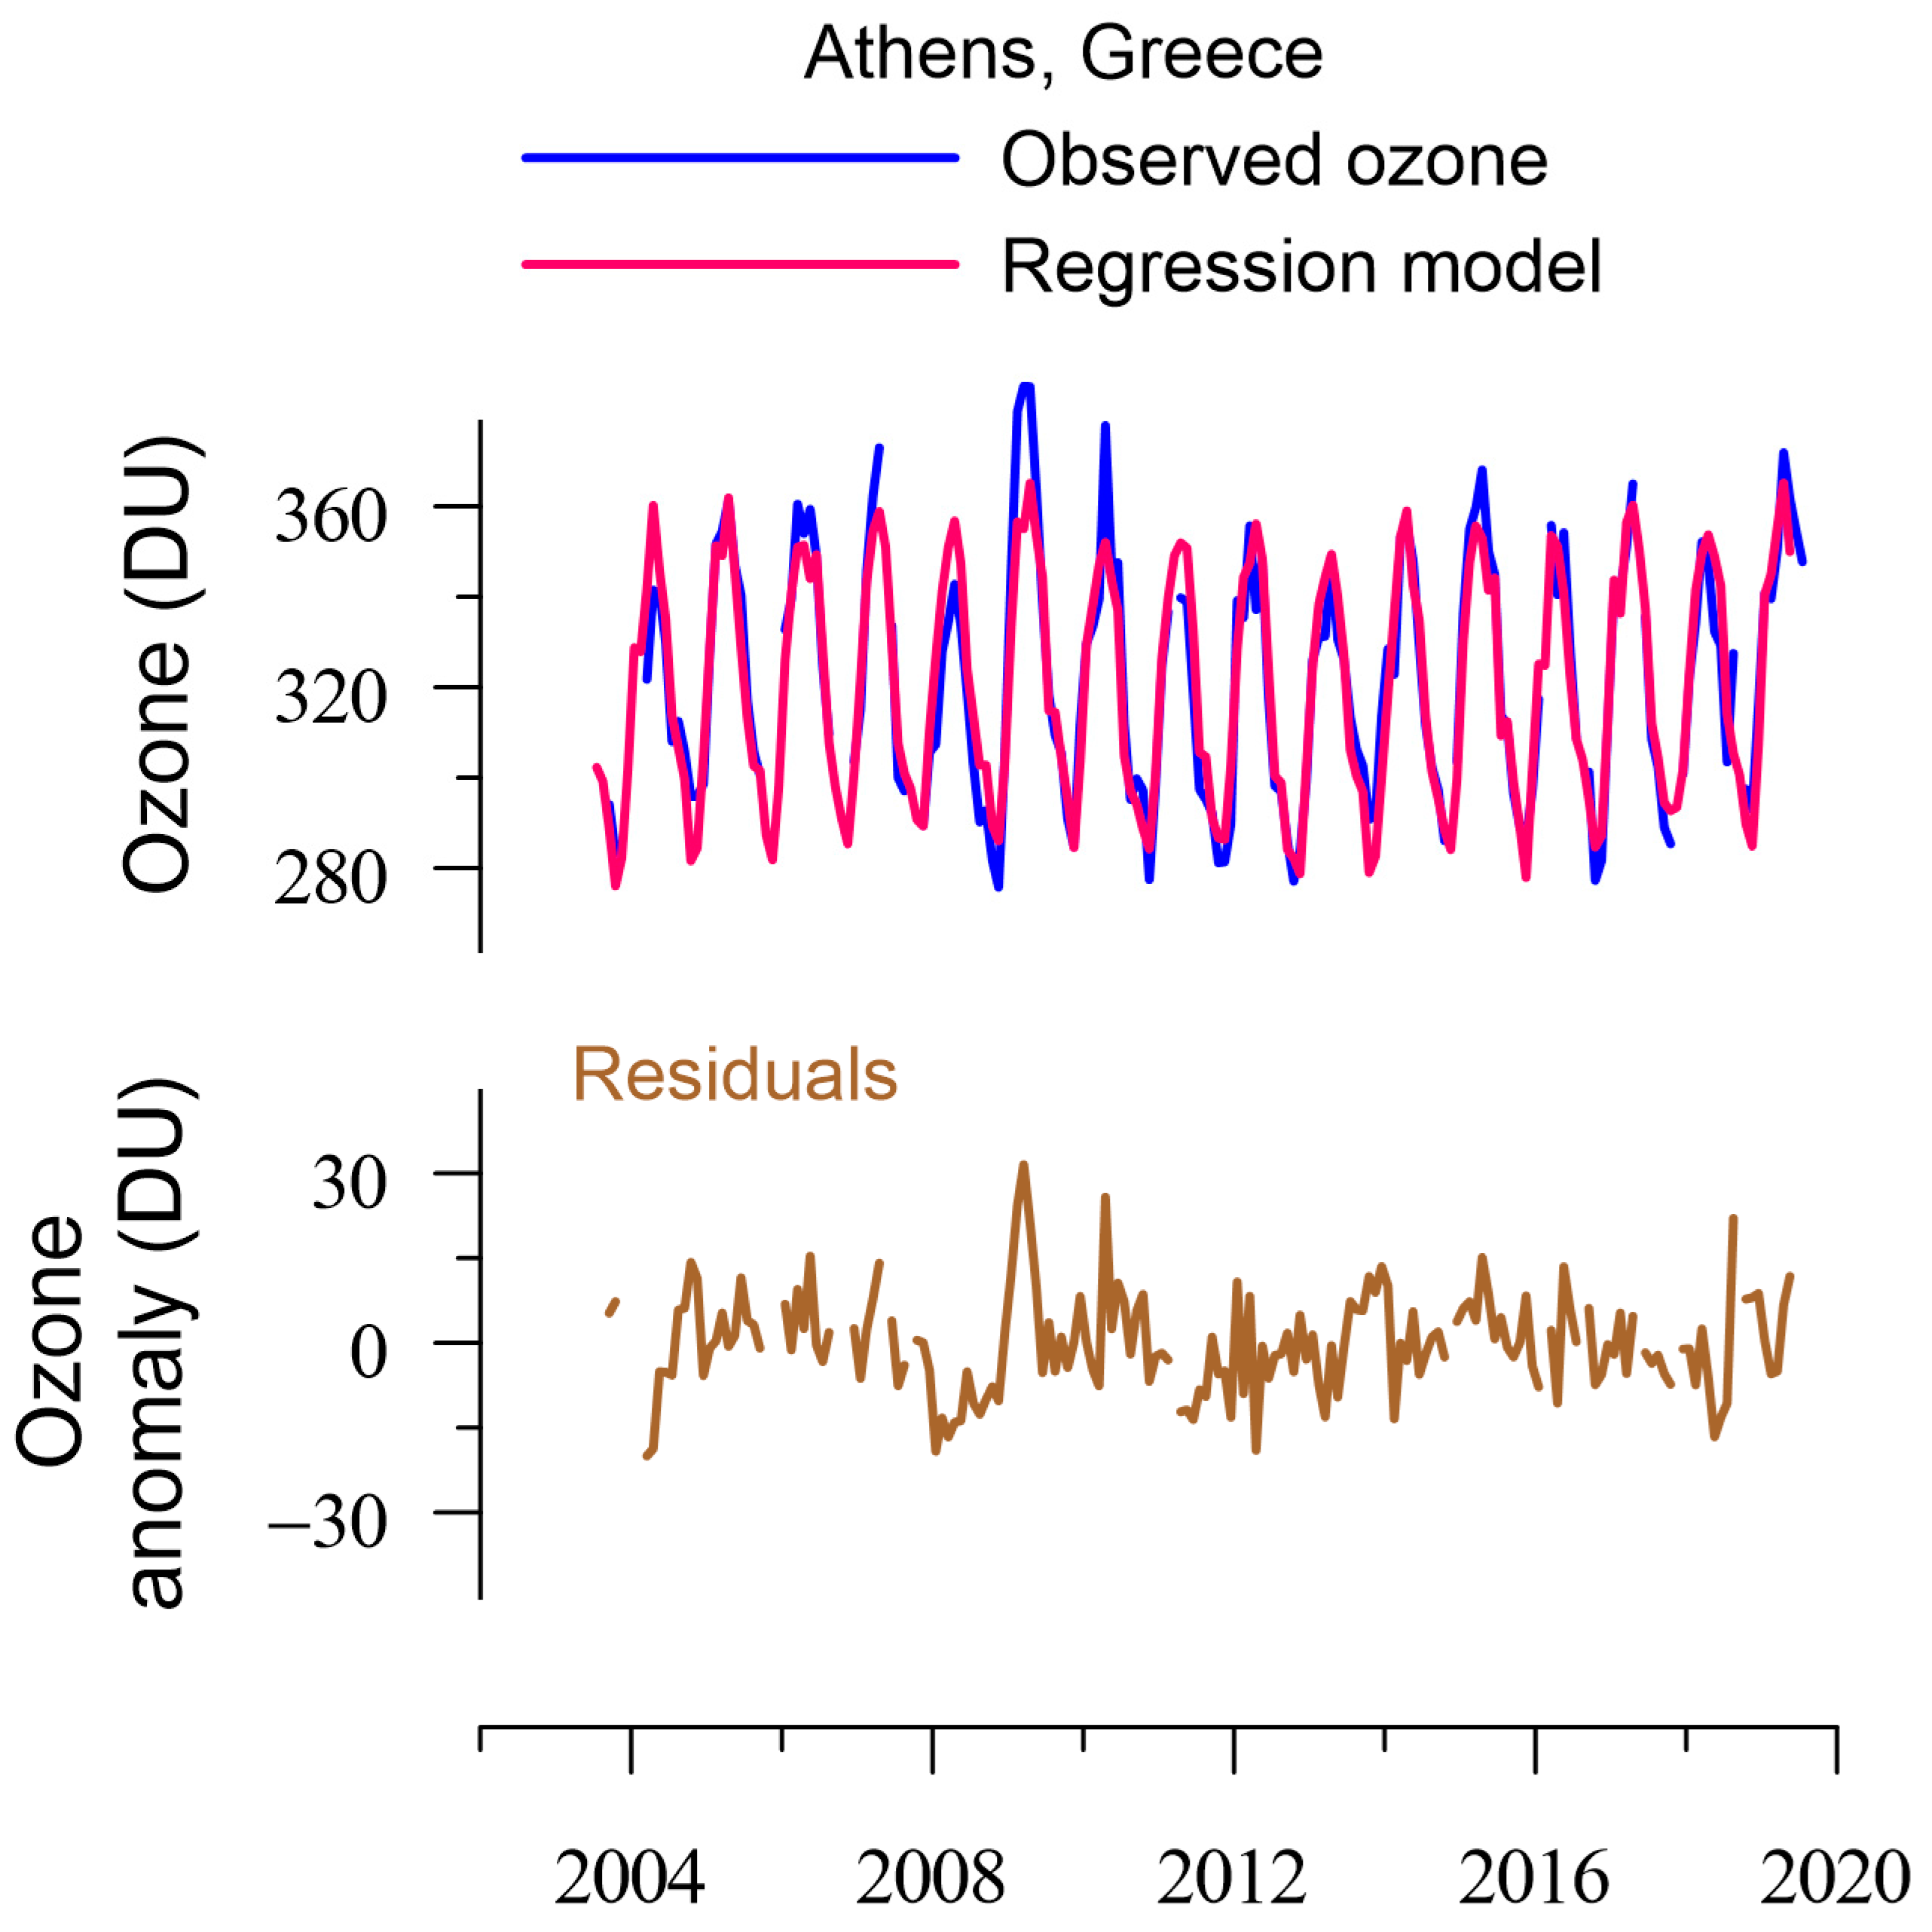
- Accounting for seasonal, solar cycle, and tropopause pressure variability in a statistical regression model, we can simulate the variability of total ozone over Athens quite well.
- We estimate a small, insignificant change in total ozone over Athens, Greece, during the period 2003–2019 of 0.6 ± 4.9 DU (change ±2 standard error limits).
Supplementary Materials
Author Contributions
Funding
Institutional Review Board Statement
Informed Consent Statement
Data Availability Statement
Acknowledgments
Conflicts of Interest
References
- Langematz, U. Stratospheric ozone: Down and up through the anthropocene. ChemTexts 2019, 5, 8. [Google Scholar] [CrossRef] [Green Version]
- Salawitch, R.J.; Fahey, D.W.; Hegglin, M.I.; McBride, L.A.; Tribett, W.R.; Doherty, S.J. Twenty Questions and Answers About the Ozone Layer: 2018 Update, Scientific Assessment of Ozone Depletion: 2018; World Meteorological Organization: Geneva, Switzerland, 2019; p. 84. [Google Scholar]
- Bais, A.F.; Bernhard, G.; McKenzie, R.L.; Aucamp, P.J.; Young, P.J.; Ilyas, M.; Jöckel, P.; Deushi, M. Ozone–climate interactions and effects on solar ultraviolet radiation. Photochem. Photobiol. Sci. 2019, 18, 602–640. [Google Scholar] [CrossRef] [PubMed] [Green Version]
- Bais, A.F.; McKenzie, R.L.; Bernhard, G.; Aucamp, P.J.; Ilyas, M.; Madronich, S.; Tourpali, K. Ozone depletion and climate change: Impacts on UV radiation. Photochem. Photobiol. Sci. 2014, 14, 19–52. [Google Scholar] [CrossRef] [PubMed]
- Varotsos, C.A.; Cracknell, A.P. Three years of total ozone measurements over Athens obtained using the remote sensing technique of a Dobson spectrophotometer. Int. J. Remote Sens. 1994, 15, 1519–1524. [Google Scholar] [CrossRef]
- Varotsos, C.A. Total ozone measurements over Athens: Intercomparison between Dobson, TOMS (version 6) and SBUV measurements. Int. J. Remote Sens. 1998, 19, 3327–3333. [Google Scholar] [CrossRef]
- Fragkos, K.; Taylor, M.; Bais, A.F.; Fountoulakis, I.; Tourpali, K.; Meleti, C.; Zempila, M.M. Multi-decadal Trend Analysis of Total Columnar Ozone Over Thessaloniki. In Perspectives on Atmospheric Sciences; Karacostas, T.S., Bais, A.F., Nastos, P.T., Eds.; Springer Atmospheric Sciences, Springer International Publishing: Cham, Switzerland, 2017; pp. 983–988. [Google Scholar] [CrossRef]
- World Meteorological Organization. Scientific Assessment of Ozone Depletion: 2010; Report No. 52; Global Ozone Research and Monitoring Project: Geneva, Switzerland, 2011; p. 516. [Google Scholar]
- Zerefos Lab. Available online: http://www.bioacademy.gr/lab/zerefos (accessed on 25 June 2021).
- Gerasopoulos, E.; Kokkalis, P.; Amiridis, V.; Liakakou, E.; Perez, C.; Haustein, K.; Eleftheratos, K.; Andreae, M.; Andreae, T.W.; Zerefos, C.S.; et al. Dust specific extinction cross-sections over the Eastern Mediterranean using the BSC-DREAM model and sun photometer data: The case of urban environments. Ann. Geophys. 2009, 27, 2903–2912. [Google Scholar] [CrossRef] [Green Version]
- Kerr, J.B.; McElroy, C.T.; Olafson, R.A. Measurements of ozone with the Brewer ozone spectrophotometer. In Proceedings of the Quadrennial Ozone Symposium, Boulder, CO, USA, 4–9 August 1981; London, J., Ed.; National Center for Atmospheric Research: Boulder, CO, USA, 1980; pp. 74–79. [Google Scholar]
- Kerr, J.B. The Brewer Spectrophotometer. In UV Radiation in Global Climate Change; Gao, W., Schmoldt, D.L., Slusser, J.R., Eds.; Springer: Berlin/Heidelberg, Germany, 2010; pp. 160–191. [Google Scholar] [CrossRef]
- Software for Ozone Spectrophotometers. Available online: http://www.o3soft.eu/o3brewer.html (accessed on 30 April 2021).
- Kazantzidis, A.; Bais, A.F.; Zempila, M.M.; Meleti, C.; Eleftheratos, K.; Zerefos, C.S. Evaluation of ozone column measurements over Greece with NILU-UV multi-channel radiometers. Int. J. Remote Sens. 2009, 30, 4273–4281. [Google Scholar] [CrossRef]
- Raptis, P.I.; Kazadzis, S.; Eleftheratos, K.; Kosmopoulos, P.; Amiridis, V.; Helmis, C.; Zerefos, C. Total ozone column measurements using an ultraviolet multi-filter radiometer. Int. J. Remote Sens. 2015, 36, 4469–4482. [Google Scholar] [CrossRef]
- Fioletov, V.E.; Kerr, J.B.; Wardle, D.I.; Wu, E. Correction of stray light for the Brewer single monochromator. In Atmospheric Ozone, Proceedings of the Quadrennial Ozone Symposium, Hokkaido University, Sapporo, Japan, 3–8 July 2000; Shibasaki, K., Bojkov, R.D., Eds.; Hokkaido University: Sapporo, Japan, 2000; pp. 371–372. [Google Scholar]
- Weatherhead, E.; Theisen, D.; Stevermer, A.; Enagonio, J.; Rabinovitch, B.; Disterhoft, P.; Lantz, K.; Meltzer, R.; DeLuisi, J.; Rives, J.; et al. Temperature dependence of the Brewer ultraviolet data. J. Geophys. Res. Space Phys. 2001, 106, 34121–34129. [Google Scholar] [CrossRef]
- Zanjani, Z.V.; Moeini, O.; McElroy, T.; Barton, D.; Savastiouk, V. A calibration procedure which accounts for non-linearity in single-monochromator Brewer ozone spectrophotometer measurements. Atmos. Meas. Tech. 2019, 12, 271–279. [Google Scholar] [CrossRef] [Green Version]
- Naujokat, B. An Update of the Observed Quasi-Biennial Oscillation of the Stratospheric Winds over the Tropics. J. Atmospheric Sci. 1986, 43, 1873–1877. [Google Scholar] [CrossRef] [Green Version]
- Dameris, M.; Nodorp, D.; Sausen, R. Correlation between Tropopause Height Pressure and TOMS-Data for the EASOE-Winter 1991/1992. Beitr. Phys. Atmos. 1995, 68, 227–232. [Google Scholar]
- Hoinka, K.P.; Claude, H.; Köhler, U. On the correlation between tropopause pressure and ozone above central Europe. Geophys. Res. Lett. 1996, 23, 1753–1756. [Google Scholar] [CrossRef]
- Steinbrecht, W.; Claude, H.; Köhler, U.; Hoinka, K.P. Correlations between tropopause height and total ozone: Implications for long-term changes. J. Geophys. Res. Space Phys. 1998, 103, 19183–19192. [Google Scholar] [CrossRef]
- Kalnay, E.; Kanamitsu, M.; Kistler, R.; Collins, W.; Deaven, D.; Gandin, L.; Iredell, M.; Saha, S.; White, G.; Woollen, J.; et al. The NCEP/NCAR 40-year reanalysis project. Bull. Am. Meteorol. Soc. 1996, 77, 437–472. [Google Scholar] [CrossRef] [Green Version]
- Zerefos, C.; Kapsomenakis, J.; Eleftheratos, K.; Tourpali, K.; Petropavlovskikh, I.; Hubert, D.; Godin-Beekmann, S.; Steinbrecht, W.; Frith, S.; Sofieva, V.; et al. Representativeness of single lidar stations for zonally averaged ozone profiles, their trends and attribution to proxies. Atmos. Chem. Phys. Discuss. 2018, 18, 6427–6440. [Google Scholar] [CrossRef] [Green Version]
- Eleftheratos, K.; Kapsomenakis, J.; Zerefos, C.S.; Bais, A.F.; Fountoulakis, I.; Dameris, M.; Jöckel, P.; Haslerud, A.S.; Godin-Beekmann, S.; Steinbrecht, W.; et al. Possible Effects of Greenhouse Gases to Ozone Profiles and DNA Active UV-B Irradiance at Ground Level. Atmosphere 2020, 11, 228. [Google Scholar] [CrossRef] [Green Version]
- Tzanis, C. Total ozone observations at Athens, Greece by satellite-borne and ground-based instrumentation. Int. J. Remote Sens. 2009, 30, 6023–6033. [Google Scholar] [CrossRef]
- Kim, S.; Park, S.-J.; Lee, H.; Ahn, D.; Jung, Y.; Choi, T.; Lee, B.; Kim, S.-J.; Koo, J.-H. Evaluation of Total Ozone Column from Multiple Satellite Measurements in the Antarctic Using the Brewer Spectrophotometer. Remote Sens. 2021, 13, 1594. [Google Scholar] [CrossRef]
- von Storch, H.; Zwiers, F.W. Statistical Analysis in Climate Research; Cambridge University Press: Cambridge, UK, 1999; 484p, ISBN 0521450713. [Google Scholar]


| Data Pair | R | Intercept (DU) | Slope | Error | t-Value | p-Value | RMSE | N |
|---|---|---|---|---|---|---|---|---|
| Brewer vs. OMI | +0.962 | 7.393 | 0.991 | 0.005 | 208.733 | <0.0001 | 9.203 | 3468 |
| Brewer vs. GOME-2A | +0.955 | 19.073 | 0.936 | 0.006 | 163.474 | <0.0001 | 10.179 | 2580 |
| Brewer vs. GOME-2B | +0.945 | 33.199 | 0.897 | 0.007 | 120.840 | <0.0001 | 10.502 | 1759 |
| Brewer vs. TOMS | +0.953 | 39.709 | 0.882 | 0.011 | 79.359 | <0.0001 | 8.972 | 632 |
| OMI vs. GOME-2A | +0.972 | 20.026 | 0.922 | 0.004 | 210.739 | <0.0001 | 7.824 | 2600 |
| OMI vs. GOME-2B | +0.972 | 20.283 | 0.923 | 0.005 | 169.102 | <0.0001 | 7.593 | 1668 |
| OMI vs. TOMS | +0.972 | 25.869 | 0.909 | 0.011 | 83.520 | <0.0001 | 7.736 | 405 |
| GOME-2A vs. GOME-2B | +0.988 | 2.591 | 0.987 | 0.005 | 218.776 | <0.0001 | 5.158 | 1122 |
| Brewer—OMI | Brewer—GOME-2A | GOME-2A—OMI | |
|---|---|---|---|
| January | −0.2% (−1 DU) | −3.7% (−13 DU) | 3.6% (12 DU) |
| February | −0.1% (0 DU) | −2.6% (−9 DU) | 2.6% (9 DU) |
| March | 0.4% (2 DU) | −1.4% (−5 DU) | 1.8% (6 DU) |
| April | 1.0% (3 DU) | −0.4% (−2 DU) | 1.4% (5 DU) |
| May | 1.0% (3 DU) | −0.2% (−1 DU) | 1.1% (4 DU) |
| June | 1.8% (6 DU) | 1.4% (4 DU) | 0.4% (1 DU) |
| July | 1.2% (4 DU) | 1.2% (4 DU) | 0.0% (0 DU) |
| August | 1.9% (6 DU) | 1.7% (5 DU) | 0.2% (1 DU) |
| September | 1.0% (3 DU) | 0.3% (1 DU) | 0.7% (2 DU) |
| October | 0.5% (1 DU) | −1.1% (−3 DU) | 1.5% (4 DU) |
| November | −0.6% (−2 DU) | −2.5% (−7 DU) | 2.0% (6 DU) |
| December | −0.2% (−1 DU) | −3.8% (−12DU) | 3.7% (11 DU) |
| MEAN | 0.6% (2 DU) | −0.9% (−3 DU) | 1.6% (5 DU) |
| MLR Regression Statistics | Coefficient | Error | t-Value | p-Value |
|---|---|---|---|---|
| Intercept | 2.623 | 1.683 | 1.556 | 0.12102 |
| QBO at 30 hPa | 0.002 | 0.039 | 0.047 | 0.96233 |
| QBO at 50 hPa | 0.111 | 0.059 | 1.874 | 0.06272 |
| ENSO | −0.093 | 0.069 | −1.348 | 0.17953 |
| NAO | 0.678 | 0.632 | 1.073 | 0.28472 |
| SOLAR | −0.070 | 0.018 | −3.853 | 0.00017 |
| TREND | 0.003 | 0.013 | 0.249 | 0.80335 |
| TROPOPAUSE | 0.378 | 0.059 | 6.459 | 1.15 × 10⁹ |
Publisher’s Note: MDPI stays neutral with regard to jurisdictional claims in published maps and institutional affiliations. |
© 2021 by the authors. Licensee MDPI, Basel, Switzerland. This article is an open access article distributed under the terms and conditions of the Creative Commons Attribution (CC BY) license (https://creativecommons.org/licenses/by/4.0/).
Share and Cite
Eleftheratos, K.; Kouklaki, D.; Zerefos, C. Sixteen Years of Measurements of Ozone over Athens, Greece with a Brewer Spectrophotometer. Oxygen 2021, 1, 32-45. https://doi.org/10.3390/oxygen1010005
Eleftheratos K, Kouklaki D, Zerefos C. Sixteen Years of Measurements of Ozone over Athens, Greece with a Brewer Spectrophotometer. Oxygen. 2021; 1(1):32-45. https://doi.org/10.3390/oxygen1010005
Chicago/Turabian StyleEleftheratos, Kostas, Dimitra Kouklaki, and Christos Zerefos. 2021. "Sixteen Years of Measurements of Ozone over Athens, Greece with a Brewer Spectrophotometer" Oxygen 1, no. 1: 32-45. https://doi.org/10.3390/oxygen1010005
APA StyleEleftheratos, K., Kouklaki, D., & Zerefos, C. (2021). Sixteen Years of Measurements of Ozone over Athens, Greece with a Brewer Spectrophotometer. Oxygen, 1(1), 32-45. https://doi.org/10.3390/oxygen1010005