Article

Influence of Major Hurricanes “Helene” and “Milton” in 2024 on EVA of the Long Ocean Water Level Record at Key West, USA

Honorary Research Fellow, US Coastal Education and Research Foundation, Lawrence, KS 66044, USA
Coasts 2025, 5(4), 41; https://doi.org/10.3390/coasts5040041
Submission received: 24 June 2025 / Revised: 5 August 2025 / Accepted: 13 October 2025 / Published: 1 November 2025

Abstract

This paper investigates the influence of back-to-back major hurricanes “Helene” and “Milton” which devastated south-eastern regions of the USA in 2024, and the extent to which associated storm surges influenced Extreme Value Analysis (EVA) of the long ocean water level record at Key West, Florida dating back to 1913. The highest recorded storm surge of 890 mm was recorded during a major hurricane event in October 1944, approximately 56 mm higher than the peak of the surge recorded at Key West during hurricane “Wilma” in 2005. Reanalysis of 2023 published EVA results for Key West indicate that despite the devastation of “Helene” and “Milton”, the super-elevation of the ocean water surface above Mean Sea Level (MSL) recorded at the Key West tidal facility during these hurricanes were at or below that which would be expected around once per annum. The timing and location of the peak of the storm surge with high predicted tides is no more than coincidental but remain the governing factors behind realizing record-breaking water levels over the historical record.

1. Introduction

A detailed Extreme Value Analysis (EVA) of the long ocean tide gauge record at Key West, Florida was published in August 2023 [1], some 12 months prior to the devastating impacts of back-to-back major hurricanes “Helene” and “Milton” during the Atlantic hurricane season of 2024.
Hurricane “Helene” made landfall in the Florida Big Bend region on 26 September 2024 as a category 4 hurricane (on the Saffir–Simpson Hurricane Wind Scale). The storm brought catastrophic inland flooding, extreme winds, deadly storm surge, and numerous tornadoes that devastated portions of the south-eastern United States and southern Appalachians. “Helene” is responsible for at least 250 fatalities in the United States (including at least 176 direct deaths), making it the deadliest hurricane in the contiguous U.S. since “Katrina” in 2005 [2].
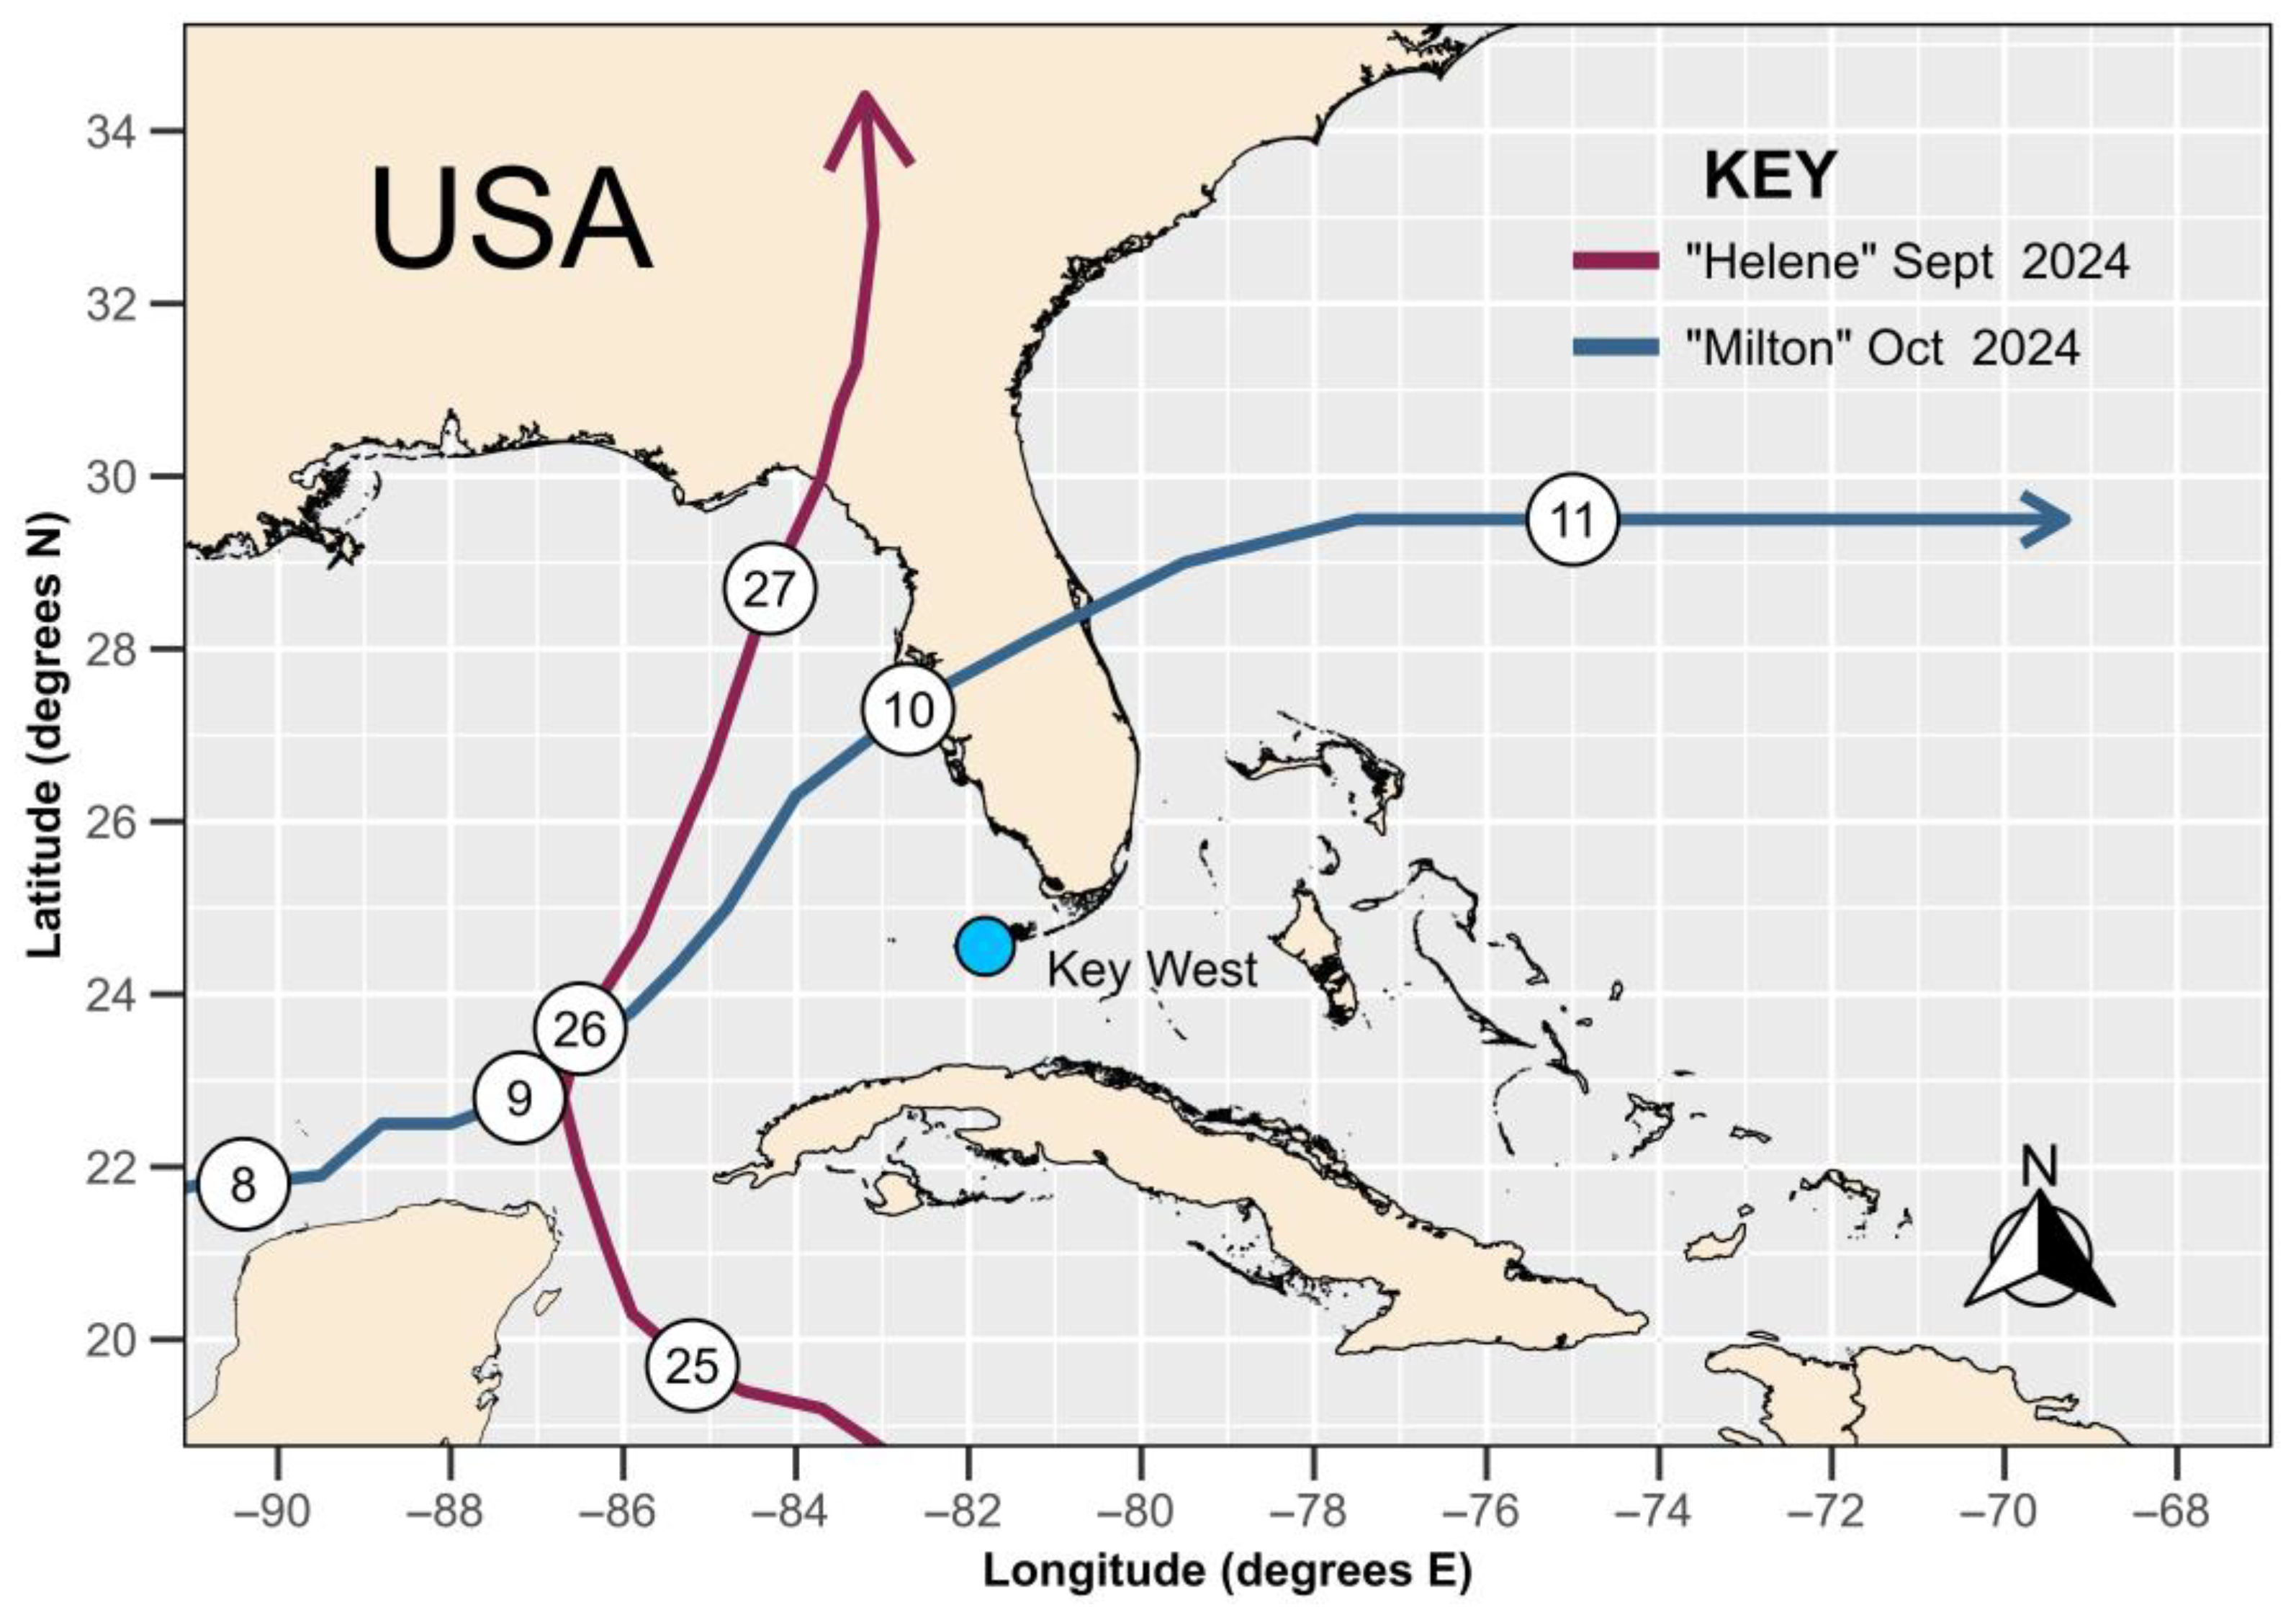
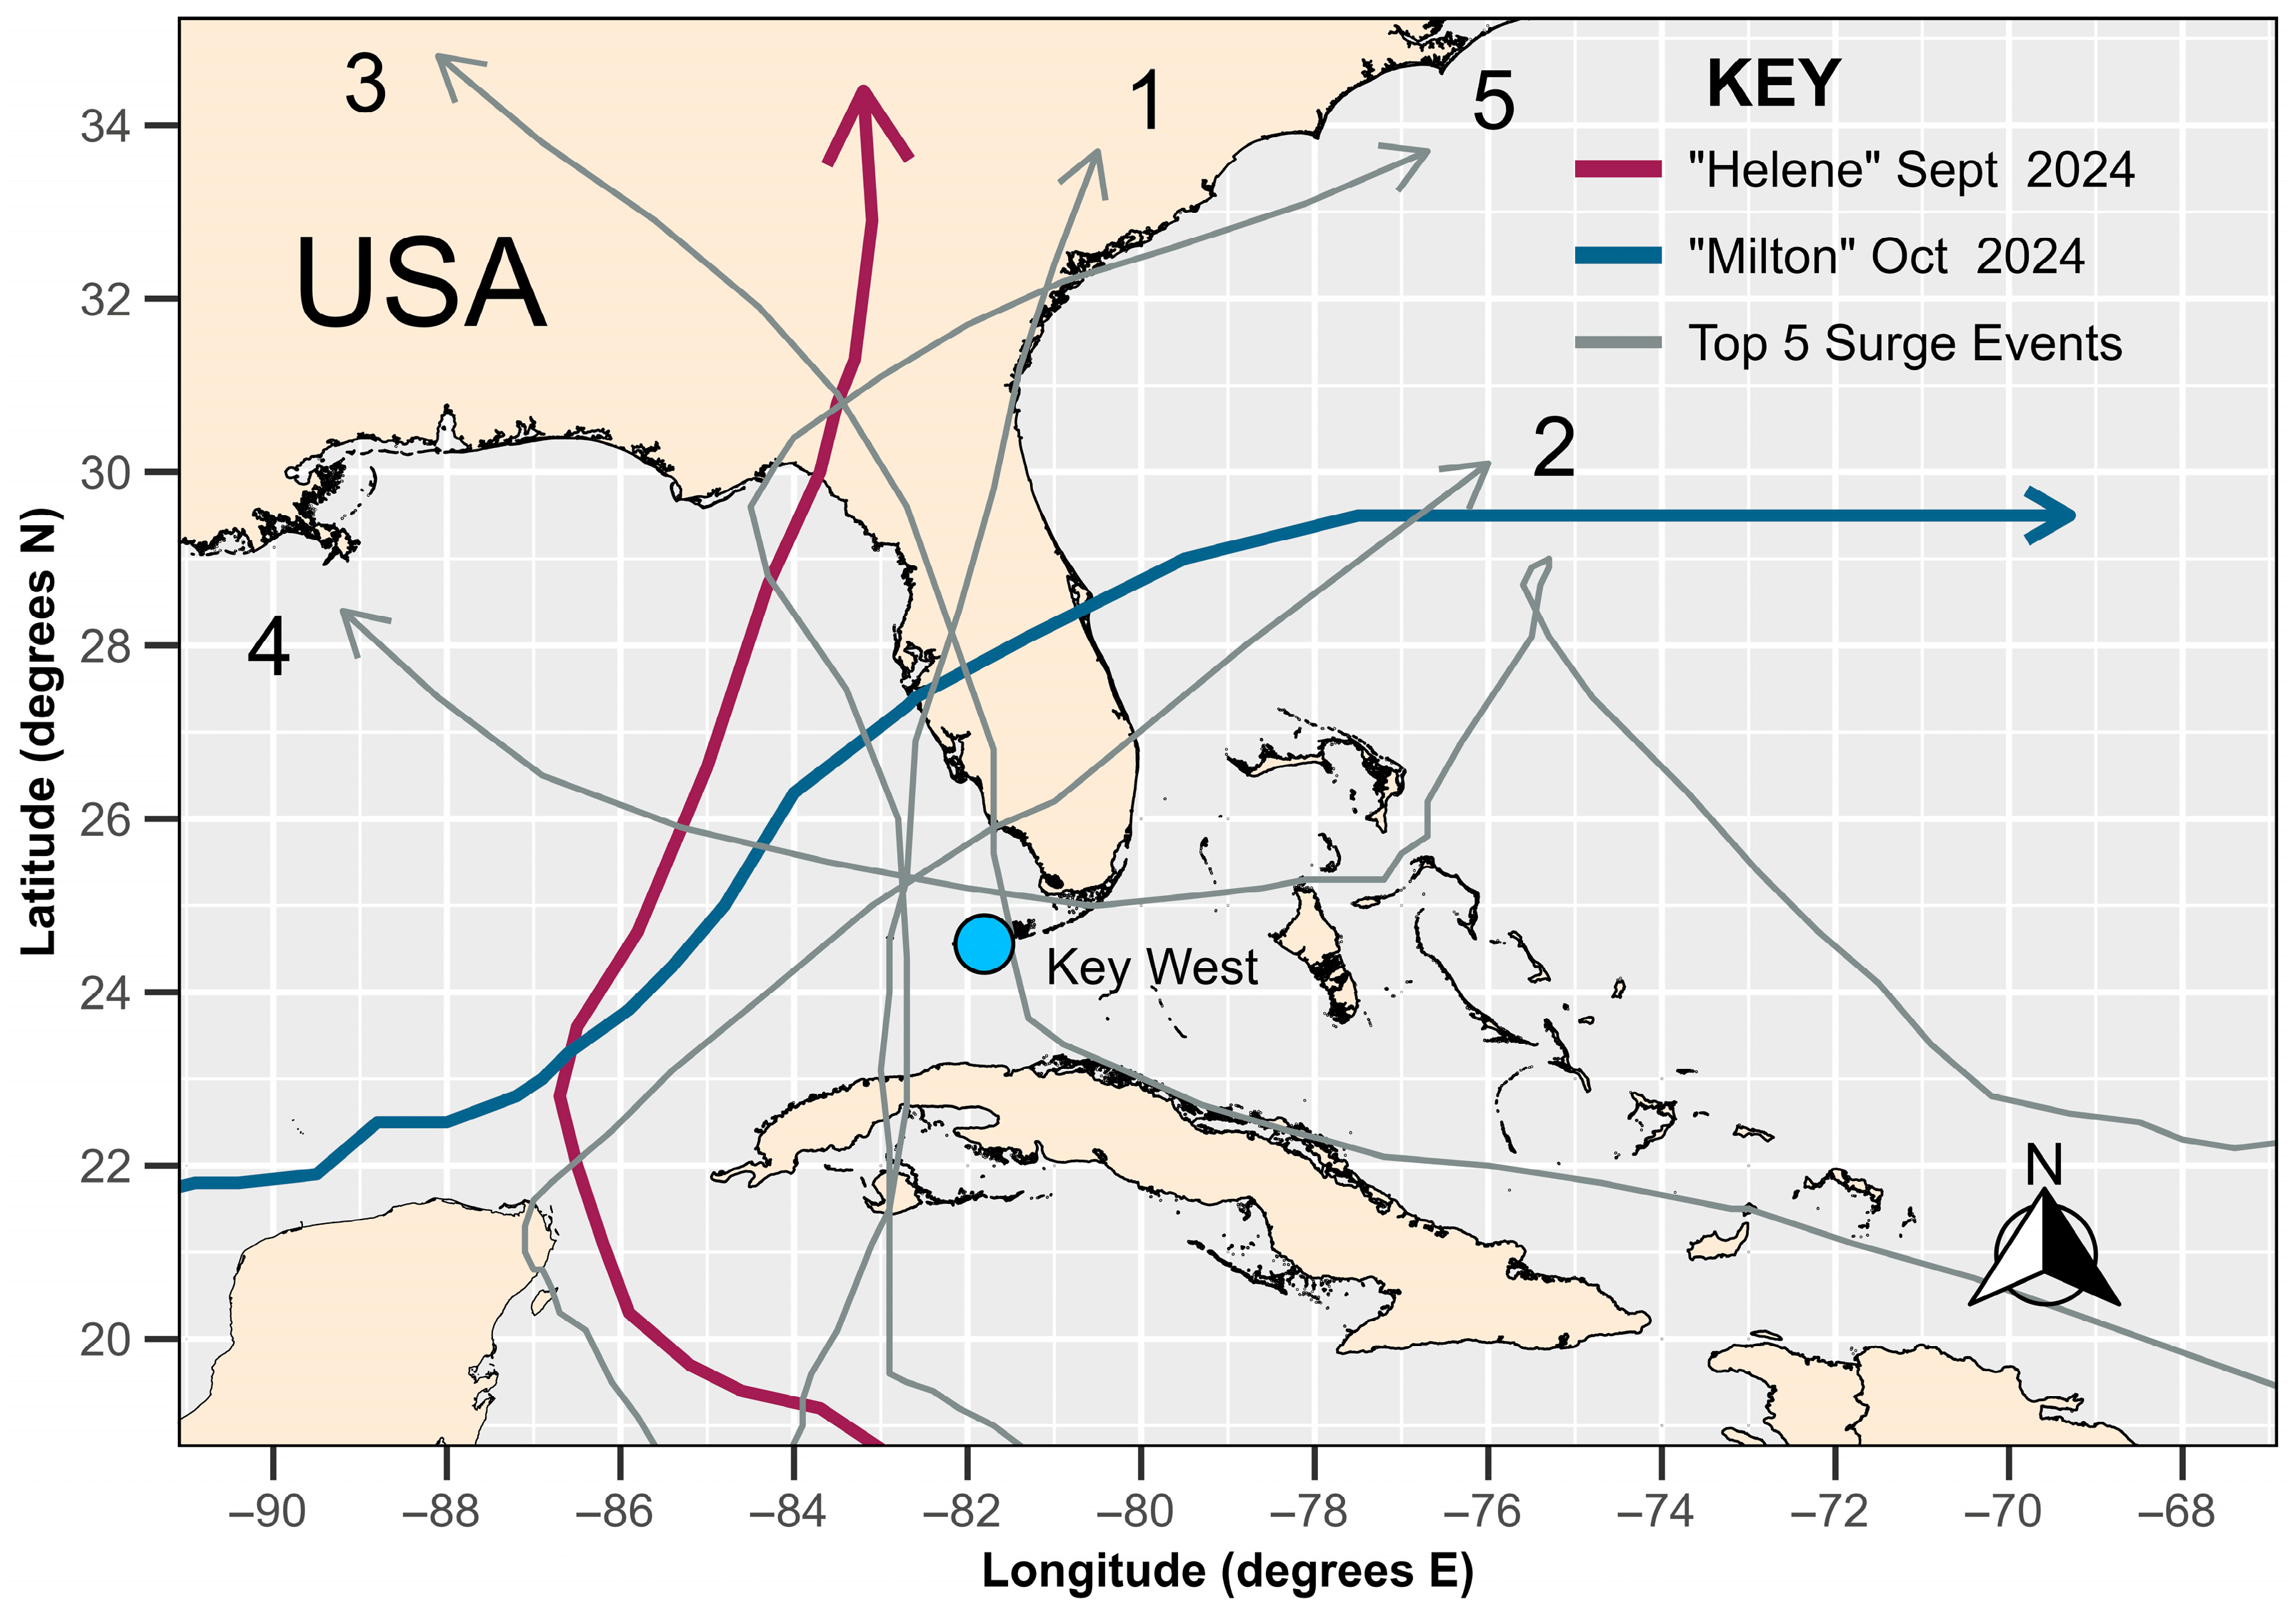
Hurricane “Milton” made landfall near Siesta Key on Florida’s west coast on 9 October 2024 as a category 3 hurricane. Occurring closely after “Helene”, “Milton” was one of the strongest hurricanes on record in the Atlantic basin, reaching category 5 intensity with a minimum central pressure below 900 mb [3]. The track paths of both hurricanes are depicted in Figure 1.
Of key interest in this study is the very high frequency component of the water level measured above MSL which results ostensibly from hurricane-driven storm surges and co-incident high tides. The highest hourly water level measured above MSL at the Key West facility (dating back to 1913) was recorded during the hurricane “Wilma” event in 2005 (1155 mm), dominating the measured records, and sitting almost 200 mm higher than the second largest event [1]. The statistical and mathematical basis of EVA is well grounded in the literature (e.g., Refs. [4,5]) permitting the prediction and extrapolation of probability distribution functions that predict highly extreme (or rare) estimates of phenomena beyond the boundary of data capture [6]. From such analyses, design water levels can be estimated to guide risk management, strategic planning and associated coastal engineering responses. The coastal zone within the State of Florida is well recognized as highly vulnerable to flooding from rainfall events, high tides and storm surges [7,8].
The current analysis updates the previously published work of Watson (2023) [1] based on the availability of an additional 2 years of hourly data to 31 December 2024. New analysis includes the addition of a storm surge assessment at the Key West tidal facility across the entire record. This paper provides an analysis of the extreme water levels and storm surges associated with these (and other) key events to assess whether such events materially affect the previously published extreme water levels used for planning and engineering purposes based on the Key West tidal record.
The paper is structured with a short summary of the applied analytical methodology and the data used (Section 2), followed by the results of the current updated analysis (Section 3), a discussion section (Section 4), and, finally, conclusions (Section 5).
Figure 1. Locality diagram depicting the Key West tidal recording facility and track paths for hurricanes “Helene” and “Milton”. Numbered circles indicate the date along the hurricane track (zero h). Track data sourced from the National Hurricane Center [9].
Coasts 05 00041 g001

2. Materials and Methods

The data sources and methodological approach applied are detailed in the following sections.

2.1. Data Sources

Different data sets are used to facilitate separate parts of the analysis. Firstly annual average sea level time series data for Key West have been sourced from the Permanent Service for Mean Sea Level (PSMSL, Station ID = 188) [10,11] in order to undertake MSL analysis for the period spanning 1913 to 2024 (inclusive).
To facilitate EVA of high frequency observations, hourly recordings from the Key West tidal facility have been sourced from NOAA’s Center for Operational Oceanographic Products and Services (CO-OPS) [12] spanning the period from 19 January 1913 (0600 h) to 31 December 2024 (2300 h).
Hurricane track data were sourced from the US National Hurricane Center [9].

2.2. Methodology

The methodological steps used in the analysis herein are identical to those espoused previously in Watson (2023) [1] with the addition of a further 2 years of data. The EVA is based on the Peaks-Over-Threshold (POT) technique which has been keenly developed in the literature for modeling extremal phenomena [4,5,13] utilizing more recent recommendations which optimize the technique specifically for EVA applied to ocean water level recordings [1]. For the current analysis, the key measurement of interest is the very high instantaneous water levels above MSL reached during extreme weather phenomena. For completeness, a broad summary of key elements of the methodology is provided in the following. To avoid unnecessary duplication, readers are referred to this prior publication for a more detailed step by step explanation of the underpinning analytical procedures and relevant references.
Step 1: Isolation of MSL trend. To perform EVA on the upper portion of the high measured water levels above MSL, the measured hourly recordings at the tide gauge must first have the MSL component removed. As the MSL component represents an increasing trend over time, its removal from the hourly measurements is imperative to enable the residual data time series to be stationary, which is a key prerequisite for application of the Generalized Pareto Distribution (GPD) [4,14,15,16] for the POT analysis.
The MSL trend is determined by applying 1D-Singular Spectrum Analysis [17,18,19] which has been specifically optimized for application to annual PSMSL time series data [20,21] for Key West. The MSL trend extracted from the annual time series is then converted into the same datum as the hourly NOAA data for Key West.
Step 2: Detrending of the hourly tide gauge measurements. The MSL trend derived from the annual time series data in Step 1 is then converted into an hourly time series to match the NOAA data via straightforward application of a cubic smoothing spline [22,23,24] using base code within the R Project for Statistical Computing [25]. The projected hourly trend (of MSL) is then subtracted from the hourly NOAA tide gauge measurements producing a time series for Key West which represents hourly measurements above/below MSL. The detrended time series now satisfies the stationarity requirements for application of POT/GPD for EVA.
Step 3: Producing statistically independent hourly input data. Along with stationarity, the hourly input data must also comprise statistically independent events for fitting a GPD for estimating extremes. Standard declustering procedures (i.e., using the single highest exceedance within a cluster of measured samples around an event) ensure the effects of dependence are avoided in applications of the POT approach. Detailed studies have previously determined that the effects of dependence are mitigated with hourly ocean water level data sets when the span between extreme events is >24 h [6,26]. The current study utilizes the “extRemes” extension package in the R Project for Statistical Computing [25,27] to decluster the detrended hourly data set (Step 2) with the minimum time frame between event peaks above a notional threshold set at 25 h.
Step 4: EVA. Having completed Steps 2 and 3, the input hourly data time series is now suitable for application of POT/EVA. The principle element with the POT technique involves selection of a suitable threshold level above which a GPD model can be trained and fitted which balances limiting variance and bias constraints [28]. It is imperative that the GPD is relevantly modeled only on the portion of a data set which approximates the excess distribution [29]. In the circumstance where the threshold selection value is too low, the fitted GPD will be biased by an increasing number of measured observations which are not considered to reside in the extremal portion of the data set. Similarly, with a threshold value set too high, there are limited measured observations against which to fit a GPD resulting in large variances for the fitted model and lower utility in its application.
However, the literature contains extensive guidance on threshold selection for POT which is based predominately on a range of commonly applied graphical and diagnostic treatments [4]. The selection of an appropriate threshold level and fitted GPD for this study follow the recommended diagnostic procedures espoused specifically for hourly ocean water level data sets and detailed in Watson (2023) [1]. For completeness, these diagnostic procedures were re-evaluated in this study following the addition of a further 2 years of hourly data, confirming the original settings (threshold value of 560 mm above MSL and a Bayesian estimation approach for the selection of the unknown GDP parameters) remain valid and appropriate.
Similarly, the “fevd” function in the “extRemes” package [25,27] was used to estimate the GPD model fit and to produce return interval outputs used in the analysis.
Step 5: Storm Surge Analysis. Storm surge is considered the abnormal rise in seawater level during a storm, measured as the height of the water above the normal predicted astronomical tide [30]. The principal contributory factors to storm surge are high winds piling water against the coastline and low barometric pressures (known as the “inverse barometer effect”) [31]. For this portion of the analysis, storm surge has been simply considered as the difference between the measured water level and the predicted tide at the Key West recording station. Both components are advised for each hourly time step in the NOAA data for Key West.

3. Results

Results can best be summarized under the following subsections.

3.1. MSL and Hourly Tide Gauge Record

Figure 2 provides a summary of the detrended hourly tide gauge measurements spanning the timeframe from 19 January 1913 (0600 h) to 31 December 2024 (2300 h). Over this timeframe, there are 961,156 hourly records available for analysis with only 20,528 missing values (2.1%). This current analysis increases the data coverage of Watson (2023) [1] by a further 17,544 hourly data records.
The top panel of Figure 2 highlights the relative MSL analysis providing a clear pictorial representation of rising MSL over the course of the historical records available. The later portion of the record (post ≈ 2010) indicates the highest rate of rise in relative MSL over the record available in general accordance with climate change hypotheses [32,33,34].
The bottom panel highlights the top 5 measured extreme events above MSL with events 3 and 4 alternating from the prior (2023) analysis due to small changes in the revised MSL trend signal with 2 years of additional data (refer to Discussion, Section 4.1). Table 1 highlights the top 10 measured events following reanalysis with ranked events 3/4 and 8/9 alternating in position from the previous (2023) analysis. The highest recorded water level above MSL which occurred during hurricane “Wilma” in 2005, remains unchanged (1154 mm), dominating all measurements recorded at this station. From the additional years of data analysis (2023–2024 inclusive), the highest measured water level above MSL was 722 mm recorded on 17 December 2023 (0600 h), ranking 11th on the highest declustered events over the historical record.
During hurricane “Helene” the largest measured water level above MSL was 578 mm, some 47 mm above the Highest Astronomical Tide (HAT) for Key West (531 mm above MSL [12]), ranking 93rd on the list of declustered extremes measured at this site. For comparison, the largest measured water level above MSL during hurricane “Milton” was only 473 mm, well below HAT.

3.2. Extreme Value Analysis

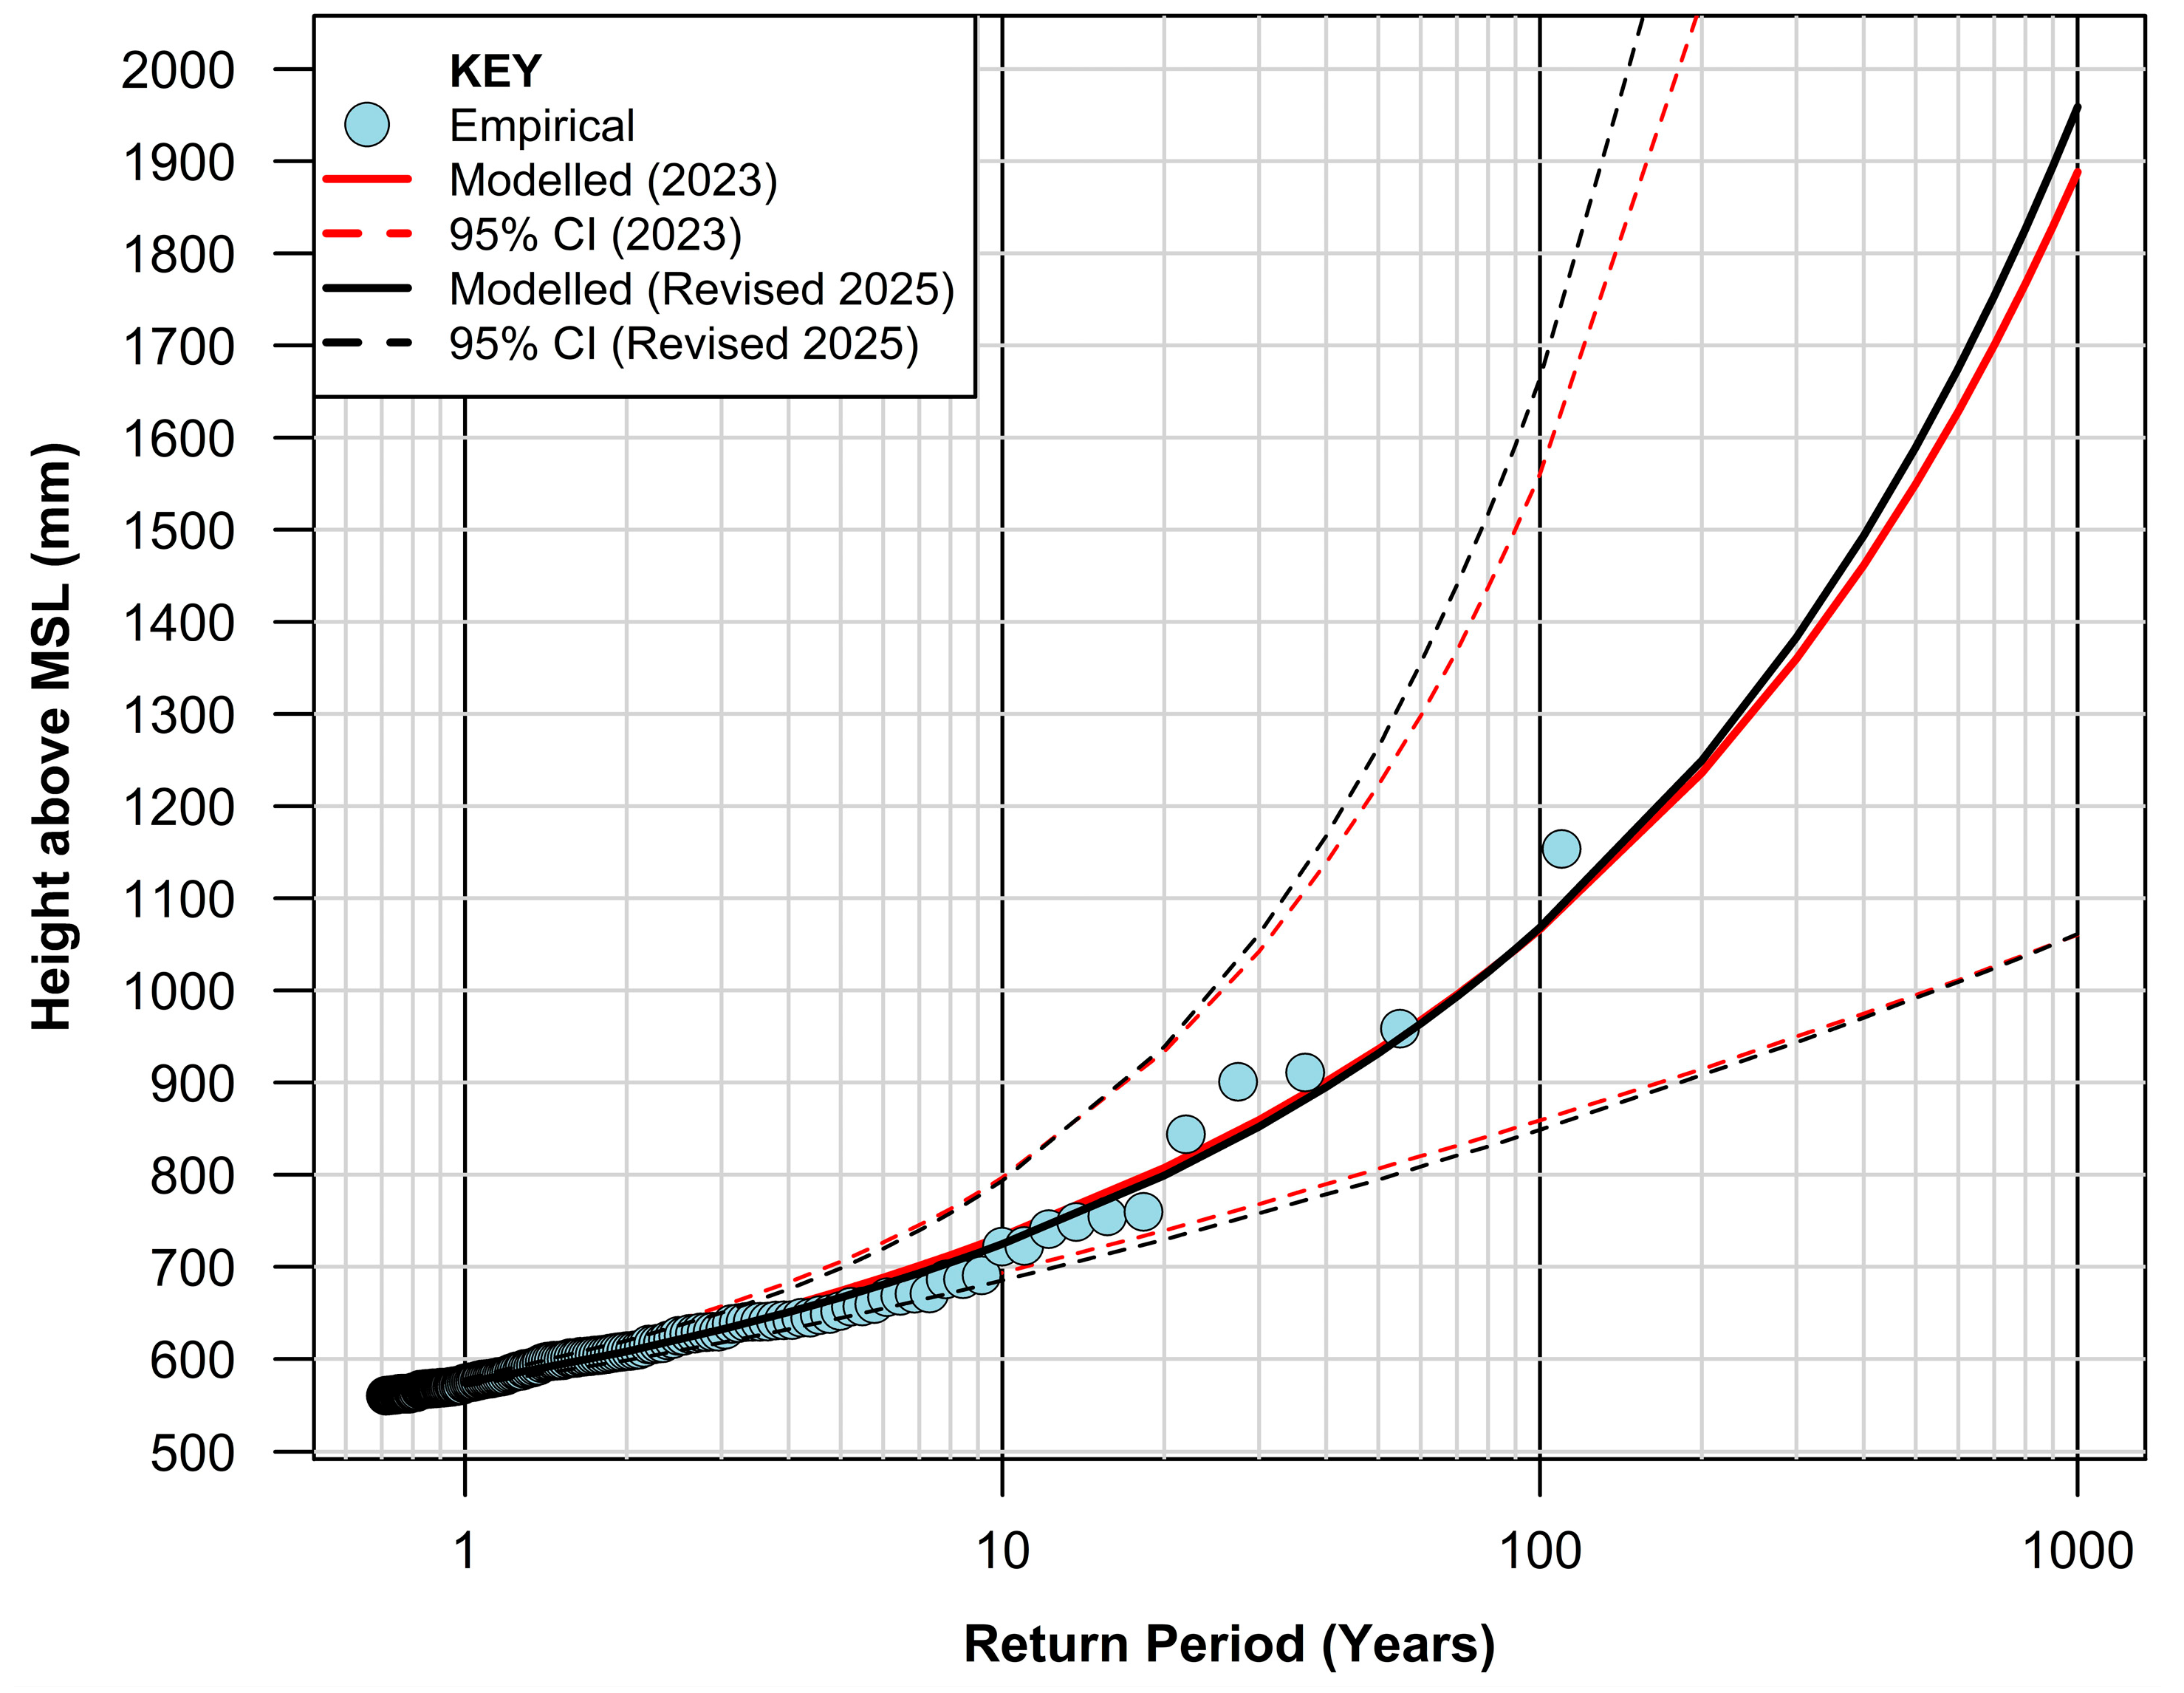
The optimization process advocated for still water levels from long tide gauge records (Section 4.5, Watson (2023) [1]) was applied with the addition of the further 2 years of hourly data, confirming that the recommended threshold level (560 mm) and Bayesian parameter estimation for GPD model fit remain unchanged for the Key West data set. Figure 3 provides a graphical representation of updated design return periods for extreme hourly heights above MSL for Key West, Florida.
What is immediately evident is that the revised return period chart remains largely unaltered with the addition of the hourly records for 2023–2024. The difference between the respective predictive charts for a 100 yr return interval is a mere 1 mm (refer Table 2).
From the additional 2 years of data (2023–2024), a further 6 declustered events above the threshold level of 560 mm above MSL permit improved Bayesian optimization of parameters for model fitting of the GPD. These additional events are, however, all located at the lower end of the extreme spectrum for Key West with the highest event of 722 mm (recorded on 17 December 2023) having a return period estimated at 9.7 years.
Changes to the revised return period chart are more evident beyond the 100 yr return interval with predicted extremes above MSL increasing by around 71 mm at the 1000 yr level. In turn, this results in the predicted return interval of the largest measured extreme above MSL (1154 mm during hurricane “Wilma”) reducing slightly from 147 to 142 years.
The largest measured extreme above MSL during hurricane “Helene” was measured at 578 mm, corresponding to an estimated return period of ≈1.1 years. As previously indicated, the largest measured extreme above MSL during hurricane “Milton” was a mere 473 mm, some 58 mm lower than HAT at the Key West tidal facility.

3.3. Storm Surge Analysis

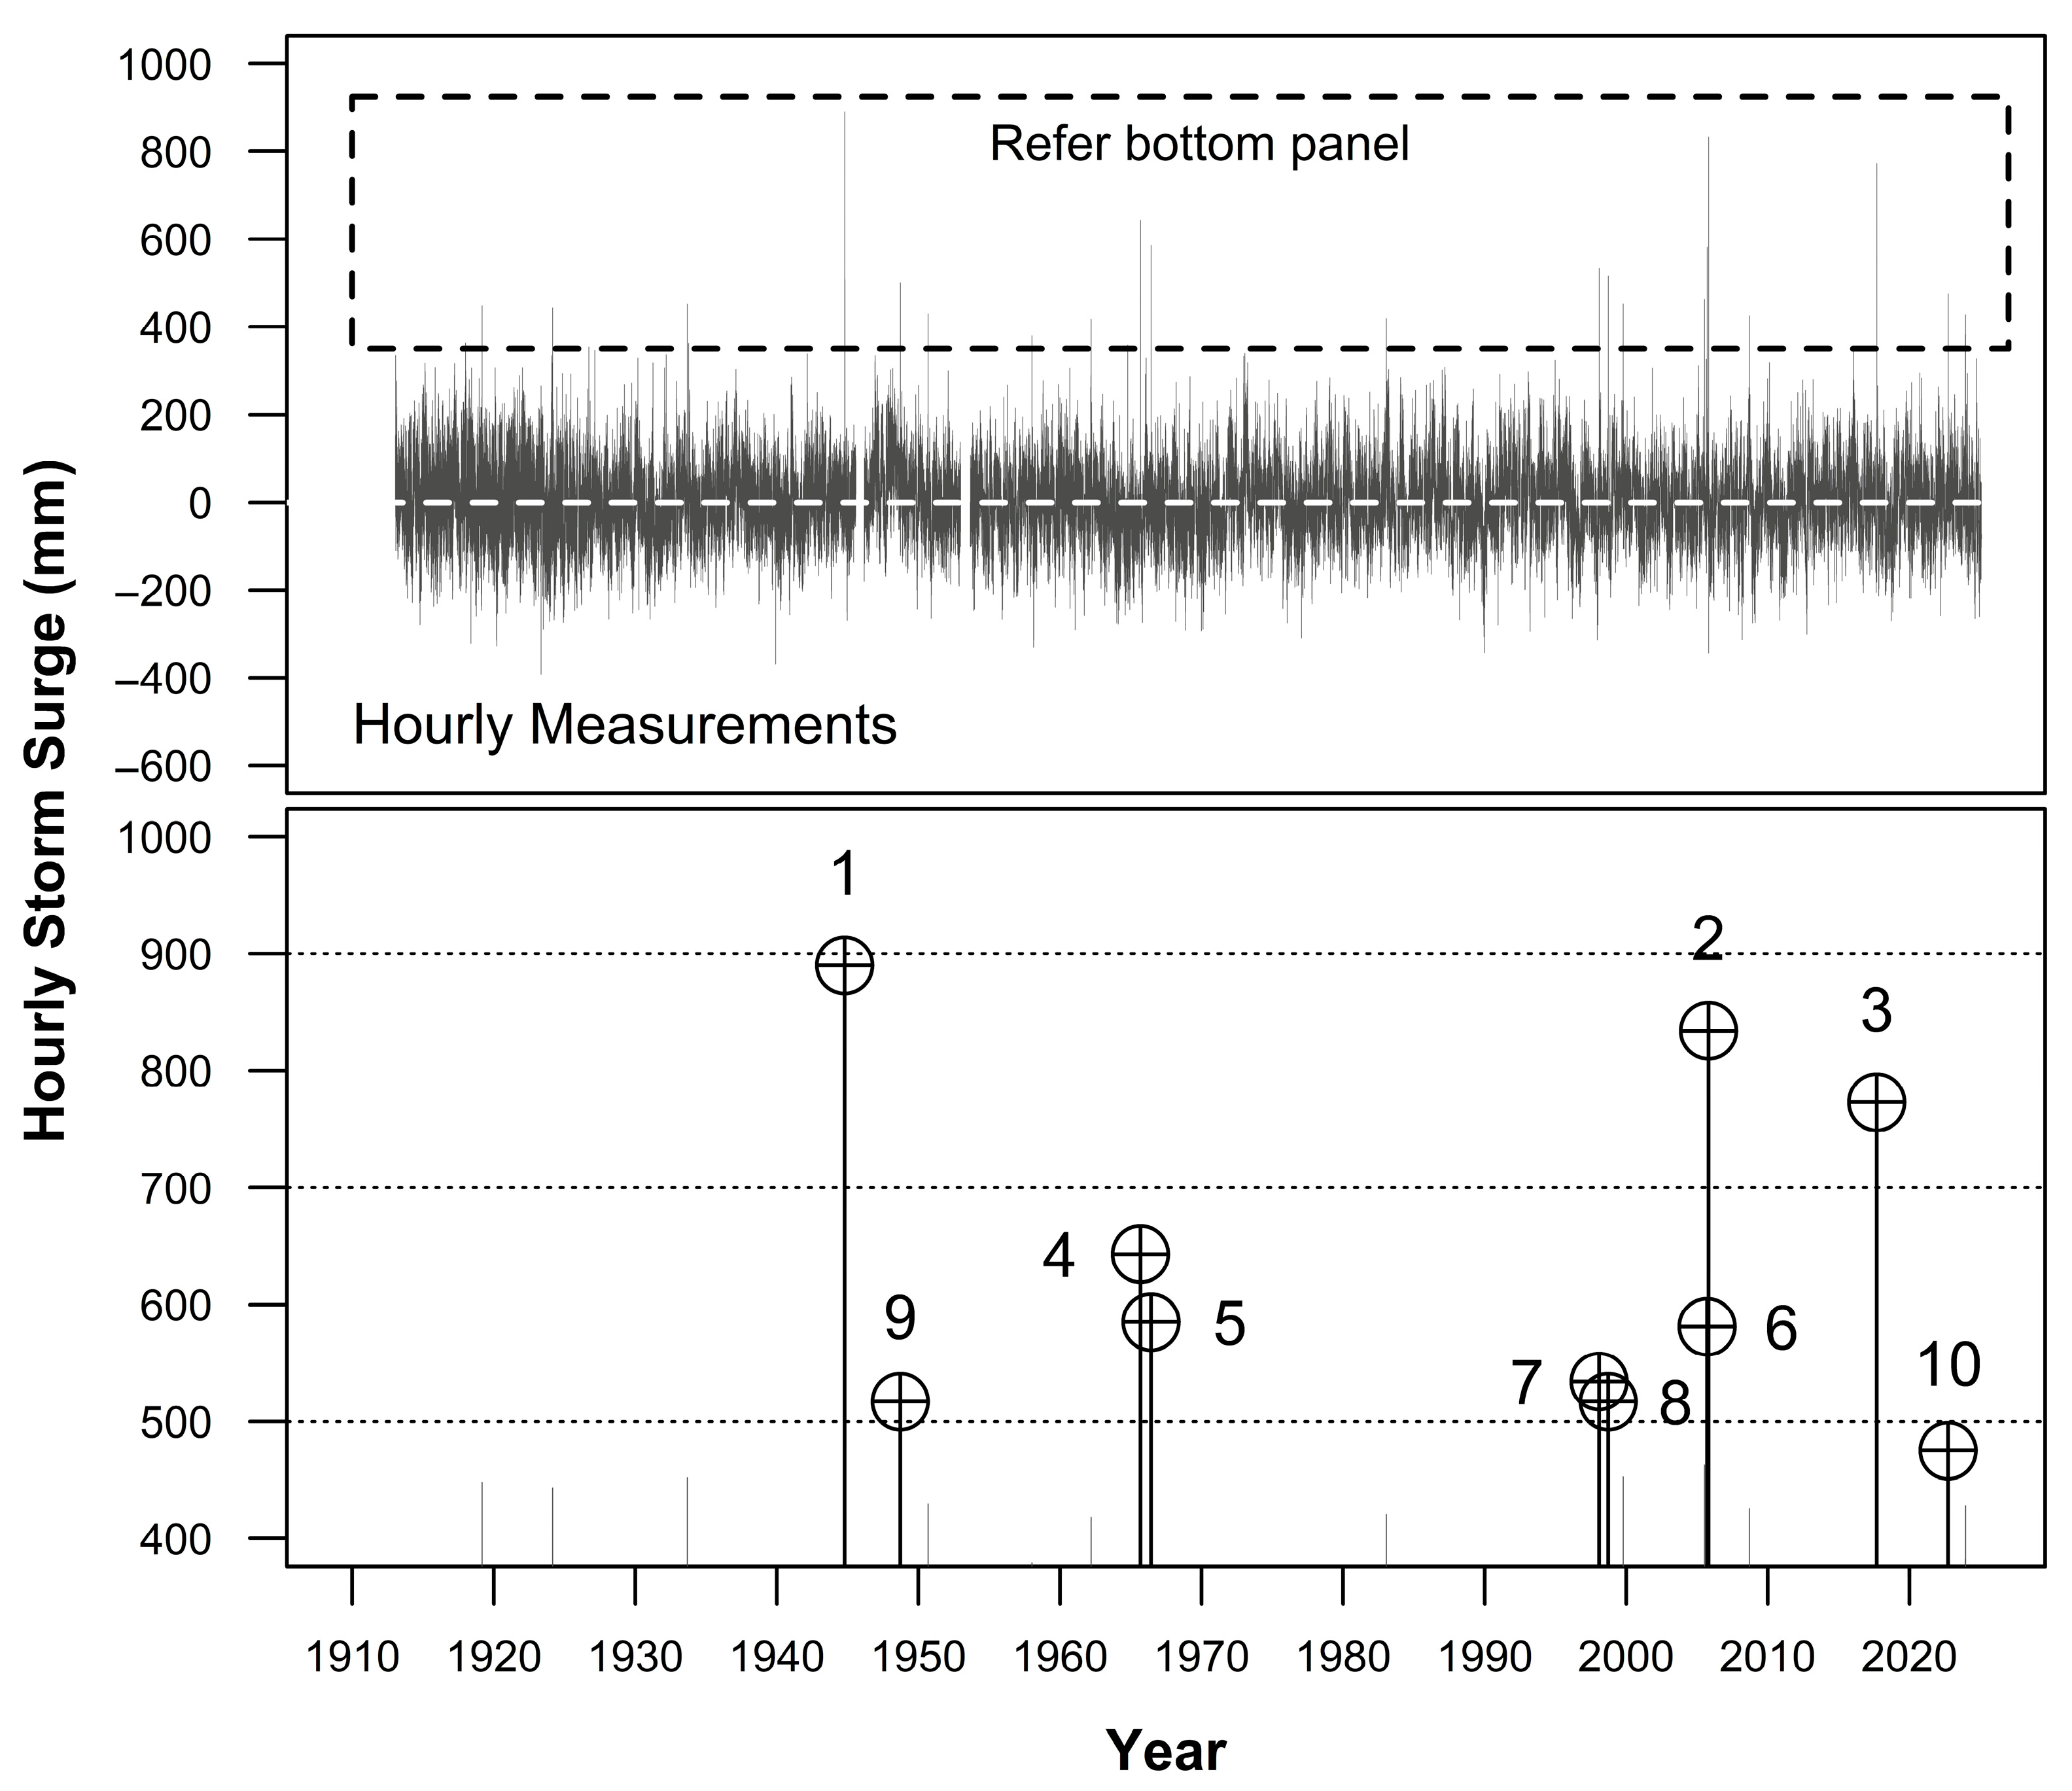
Figure 4 provides a summary depicting the difference between the predicted tide and the measured hourly water level (or “storm surge”) recorded at the Key West facility across the data record available (1913 to 2024 inclusive). At any given point in time and location, the measured water level will be a complex composite of short duration (highly dynamic) meteorological influences (resulting principally from storms or other atmospheric weather patterns), and oceanographic influences superimposed on largely predictable astronomical tides. Thus, the difference between the predicted astronomical tide and the measured water level can be either positive or negative (see top panel, Figure 4).
The larger positive differences driving extreme water levels are the focus of this analysis, those resulting ostensibly from hurricane-driven storm surges (bottom panel, Figure 4 and Table 3). From the ≈111 yr record, there are 20 declustered (or statistically independent events) where the positive difference above the predicted tide exceeds 400 mm, with 4 events exceeding 600 mm.
The height of the surge at a particular location resulting from the impacts of a major hurricane will be a function of several factors. The surge height is a complex phenomenon that is sensitive to small changes in storm intensity, forward speed, size (radius of maximum winds) and the shape and characteristics of the coastline being impacted [35]. The surge is typically of short duration, rising and falling over a period ≈ 24 to 36 h.
The largest event recorded at 890 mm (18 October 1944) represents the largest anomaly experienced at Key West due to the influence of major hurricanes. None of the events in the top 4 represent the peak storm surge coinciding with a very high tide. The top and third ranked surge events (1944, 2017) had the peak of the surge coinciding with low and mid-tide, respectively. Had either surge event coincided with the largest tide of the respective year (≈480 mm above MSL), the resultant increase in the water surface above MSL would have significantly eclipsed the record superelevation experienced during hurricane “Wilma” (1154 mm, Table 1).
It is worth noting that of the 10 highest storm surge events recorded at the Key West tidal facility, the 7th largest measured event, which occurred on 2 February 1998 was not the result of hurricane forcings. The storm surge recorded on this date resulted from severe thunderstorms which formed in the warm sector over the southeast Gulf of Mexico and moved into the lower Keys beginning around mid-afternoon on Monday, 2 February 1998, spreading to the southeast Florida coast by evening. The area of severe thunderstorms produced four confirmed tornado paths in south Florida with the highest wind measured during the event at close to 120 mph [36].

4. Discussion

The reanalysis of Watson (2023) [1] with 2 years additional hourly data gives rise to various discussion points, highlighted in the following sections.

4.1. Determination of MSL and Its Influence over Results

The determination of MSL is a pivotal part of the analytical procedure applied. The utility of techniques to estimate the trend of MSL from tide gauge records has been the subject of considerable debate in the literature over time (e.g., [37,38,39,40,41,42,43,44]), with techniques varying widely between simple linear applications through to more advanced “data adaptive” analytics, in particular, Singular Spectrum Analysis (SSA) [17,18,19] and multi-resolution wavelet decomposition [45,46,47,48].
Estimating the trend signal of relative MSL from tide gauge measurements is no trivial task. At any given point in time what is measured at a fixed tidal recorder will be a complex composite of numerous dynamic influences of largely oceanographic, atmospheric or gravitational origins operating on differing temporal and spatial scales, superimposed on a comparatively low amplitude signal of sea level rise driven by climate change influences [49] and any vertical land motion experienced at the facility.
In 2016, the largest body of time series analysis testing for MSL research was undertaken, involving some 29 million individual time series analyses [50]. This research specifically developed a complex synthetic data set to test a wide range of time series methodologies for their utility to isolate a known non-linear, non-stationary mean sea level signal concluding that SSA and multi-resolution decomposition using short length wavelets to be the most robust, consistent methods for isolating the trend signal across all length data sets tested. SSA offered more opportunity for further refinements through parameter optimization to improve temporal resolution of the MSL (or trend) signal from long ocean water level data sets and was subsequently developed further into a powerful tool for sea level research via the “TrendSLR” extension package in the R statistical programming language [25,51] and used for a wide range of regional MSL/SLR studies (e.g., Europe, USA, Australia, Korea) and used in both studies to estimate MSL at Key West. Despite the increased sophistication in isolating the MSL signal, all time series analysis techniques provide no more than an estimate of the true trend (within the limits of their capabilities) and suffer from the ubiquity of end effects.
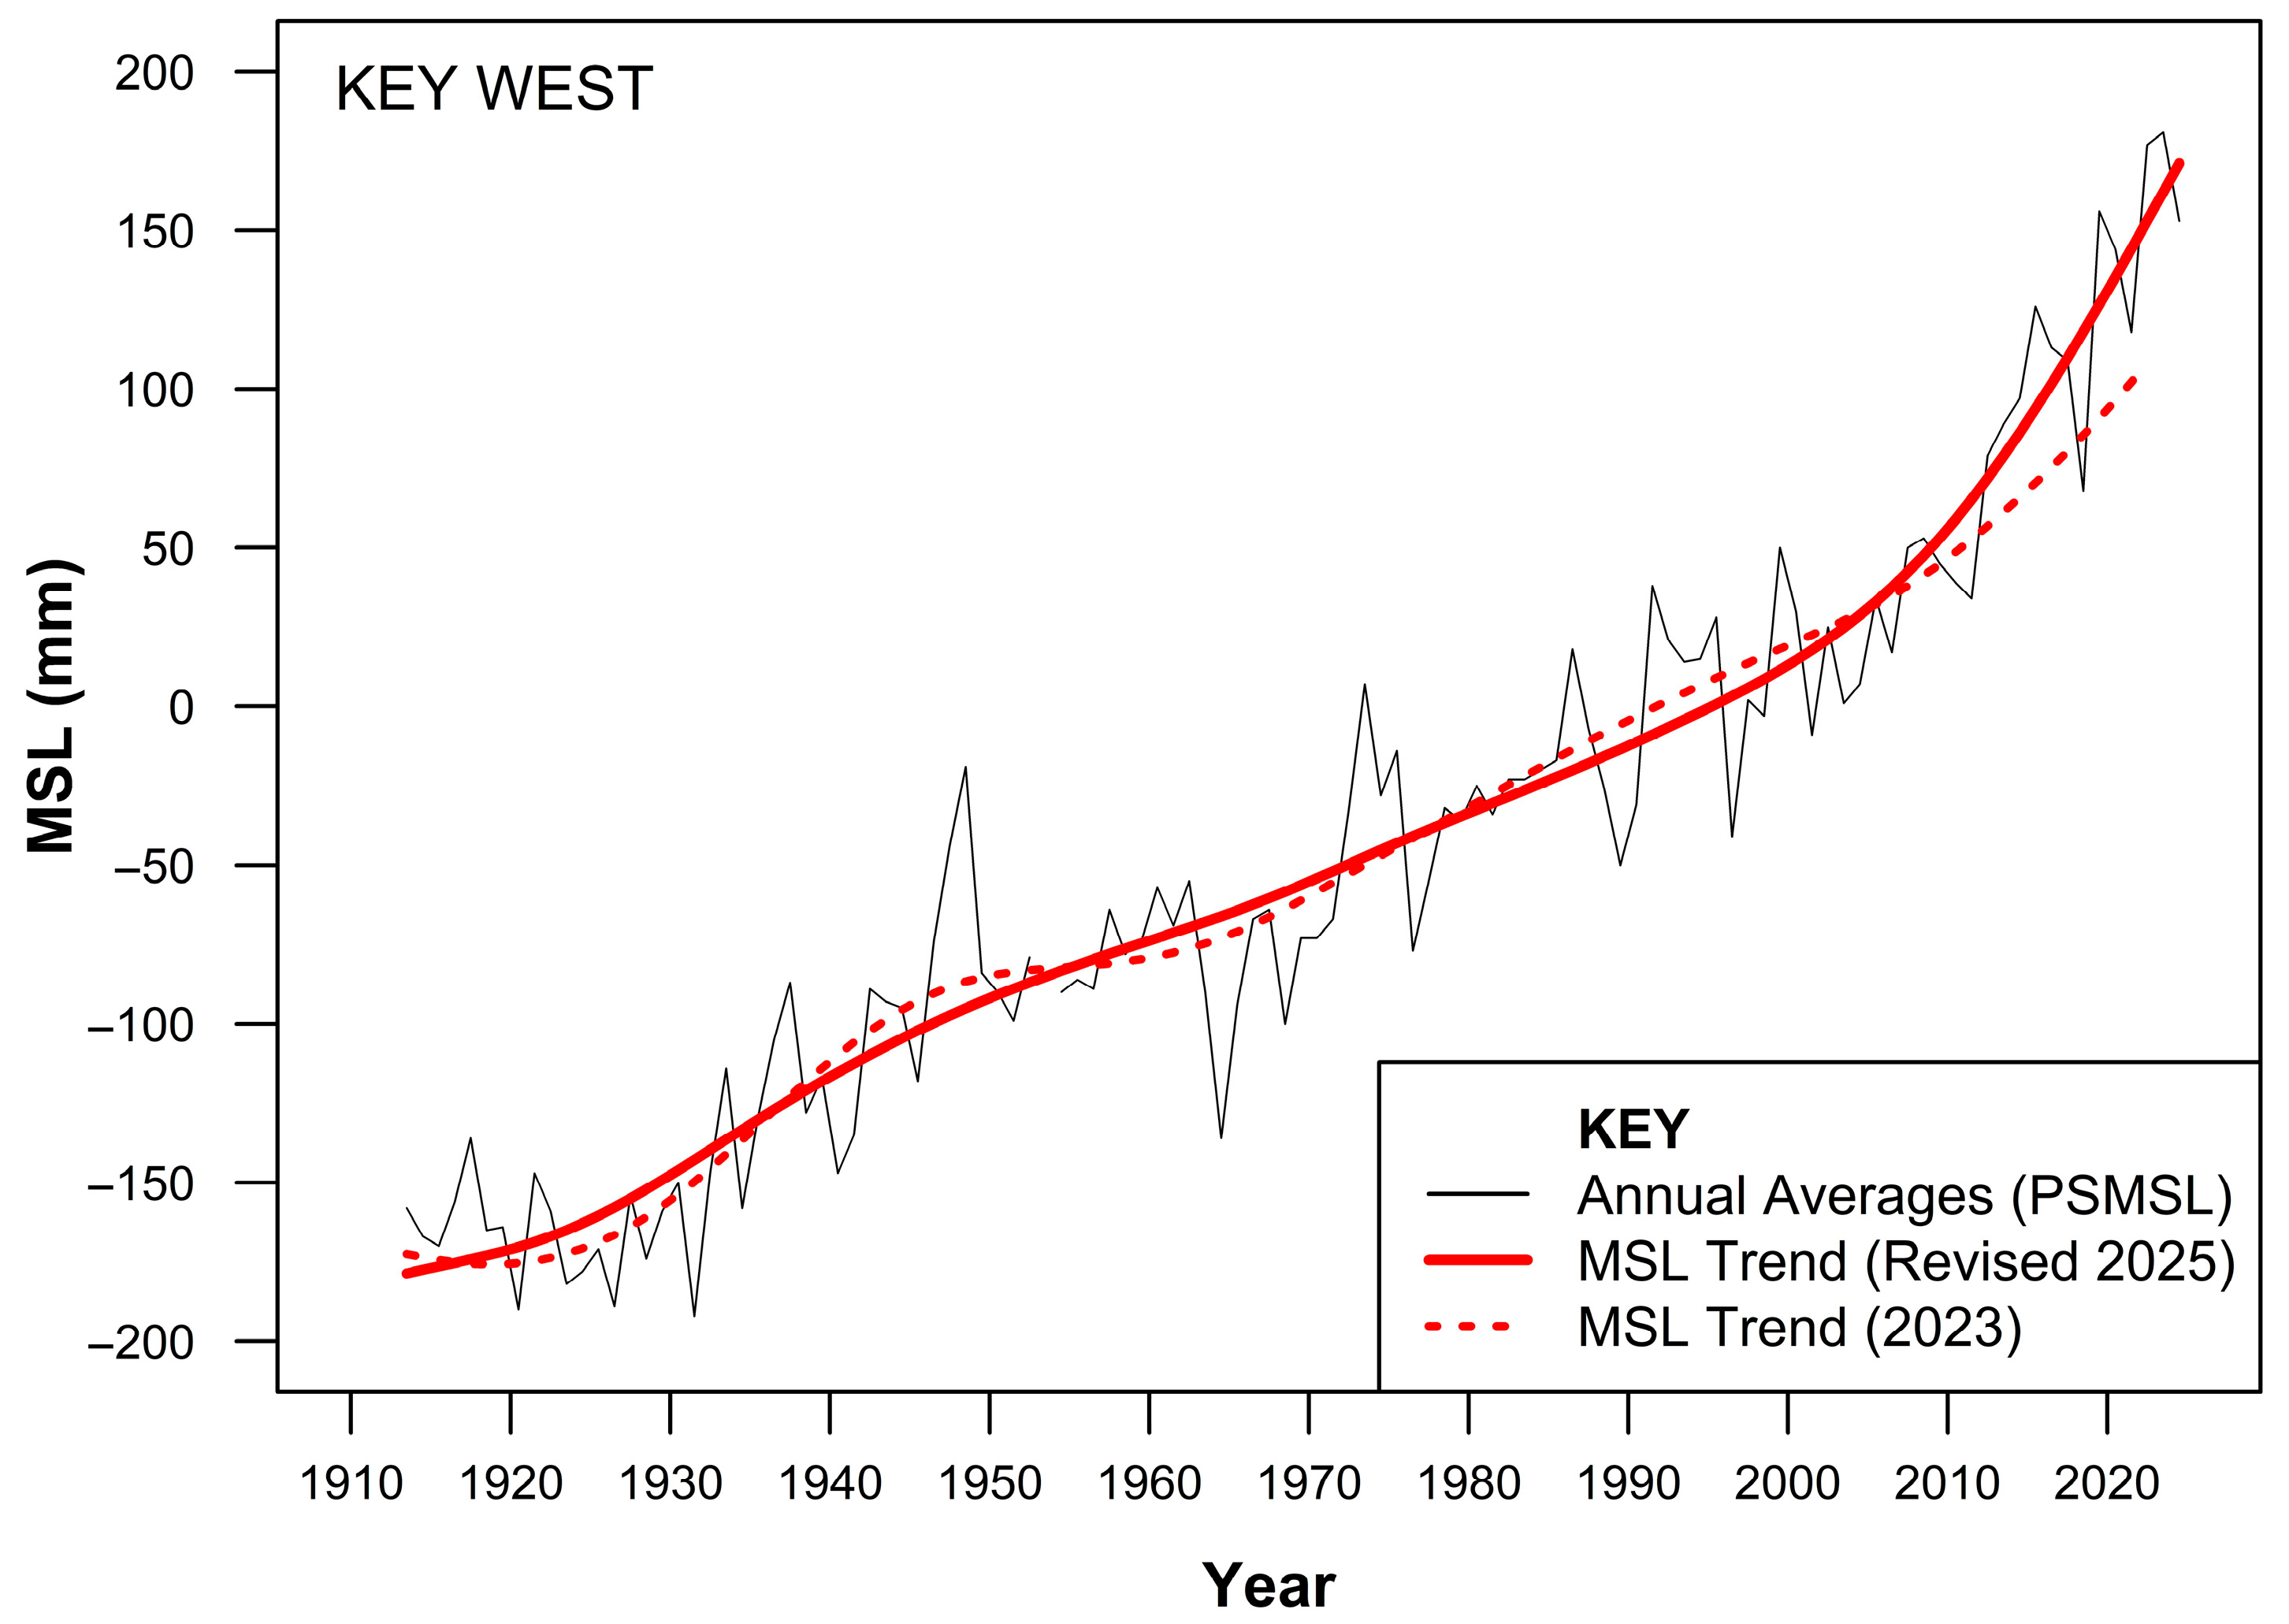
In the case of the revised analysis for Key West, the additional 2 years of data has a significant effect on the resolution of the MSL (or trend) signal in the latter portion of the record (refer to Figure 5). Significantly, the SSA technique efficiently resolves the sharply increasing trend which is visually evident in the annual average time series post ≈ 2010. The revised MSL trend (with 2 additional years’ data) differs from the 2023 trend owing to small differences in the low frequency components from the SSA decomposition. The largest departure between the MSL trend time series is 45 mm (at the end of 2022). For the first 100 years, respective differences between both MSL trend time series are less than 10 mm.
These relatively small changes in the MSL trend signal result in small differences to the hourly time series of measurements above/below MSL used to input into the EVA. This is evident with the re-ordering of some of the 10 largest hourly measurements above MSL (refer Table 1) in which events ranked 3/4 and 8/9 have alternated ranking places from the 2023 analysis.
Any improved temporal resolution in the MSL trend signal will likely result in an improved EVA as the fitting of the GPD requires (in part) stationarity of the input time series.

4.2. Sensitivity of the Timing of Astronomical Tides with Storm Surge

There is no physical relationship between the randomness of dynamic storm-driven surges and predictable astronomical tides. The overlapping Atlantic hurricane storm season (1 June to 30 November [9]) and the “king tide” season at Key West (September through November [52]) risks more extreme super-elevation of the still water surface above the record 1154 mm (measured during hurricane “Wilma” in 2005) into the future. Such a likelihood is merely a matter of random chance and timing, where the physical parameters and track of a major hurricane system coincide with the peak of a high spring (or “king”) tide to produce a major effect at the Key West location.
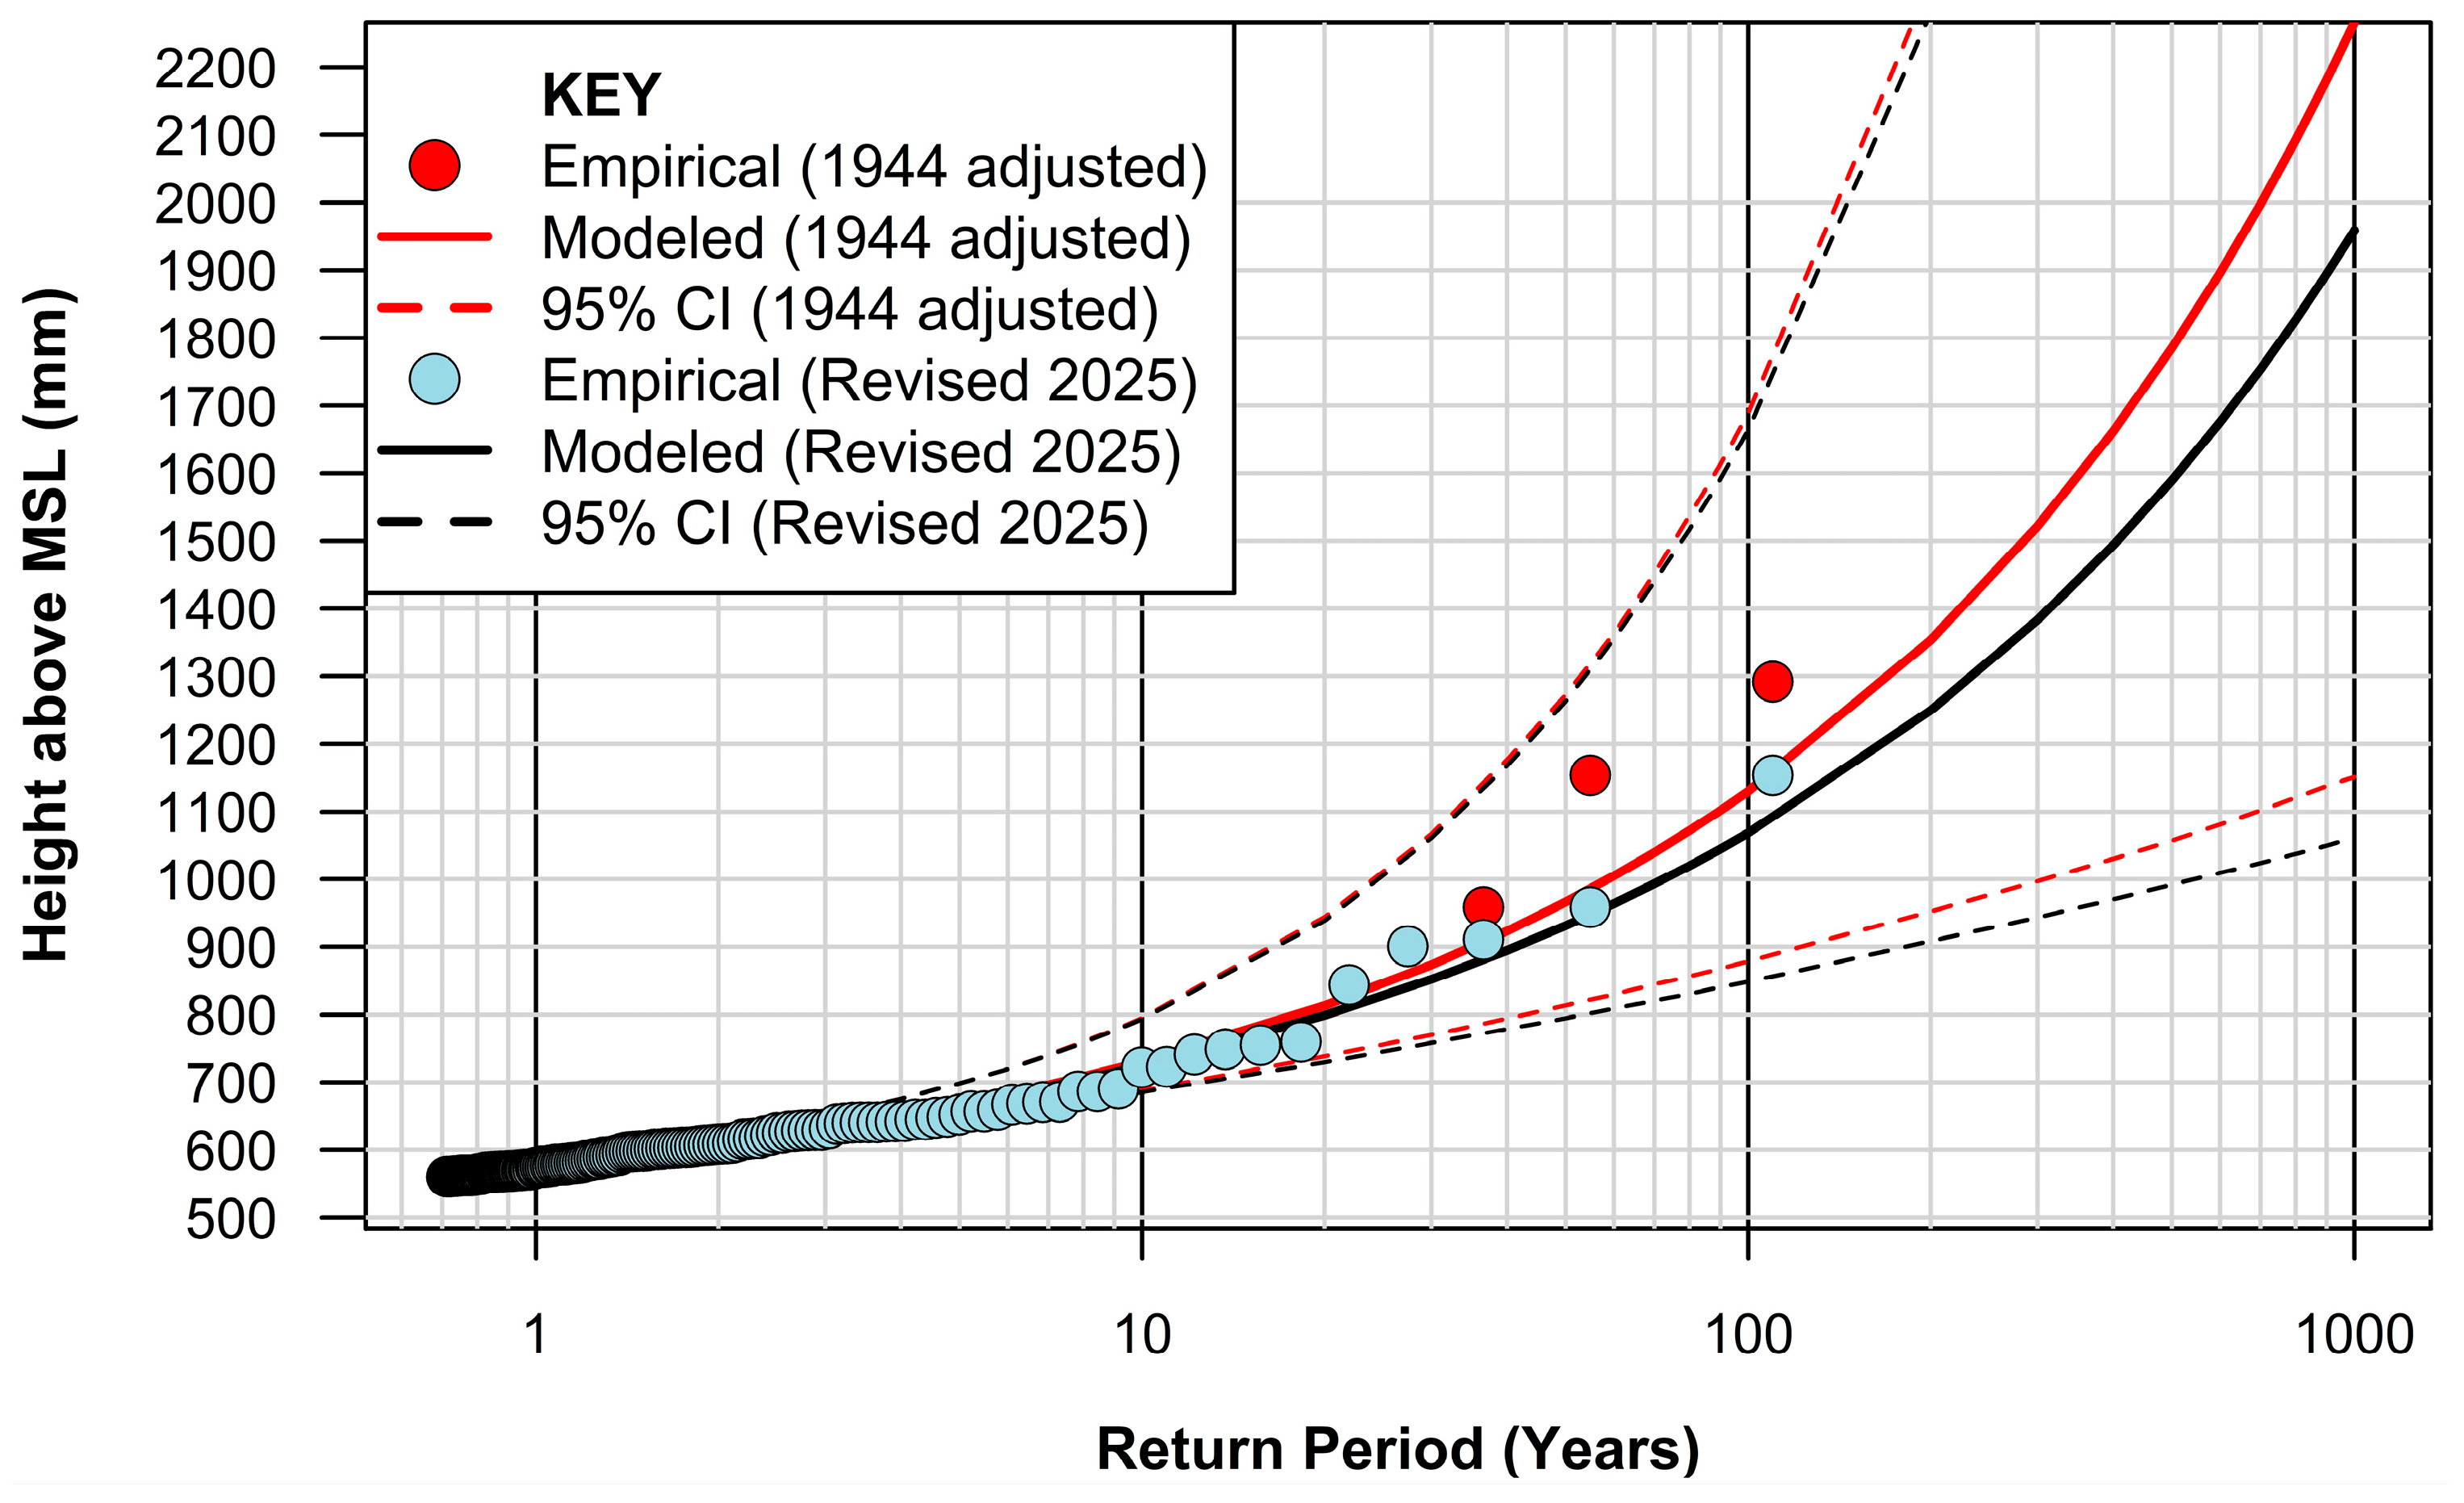
To emphasize this point, had the peak storm surge of 890 mm (18 October 1944, 1000 h) occurred a mere 5 h later, the resulting super-elevation of the still water surface above MSL would have been ≈1292 mm, which equates to an event with a return period of ≈230 yrs (refer Figure 3), vastly eclipsing anything measured over the historical record.
Further, let us run a hypothetical reanalysis of the entire data set having revised just the solitary hourly data point on 19 October 1944 so that the maximum surge (890 mm) coincides with the larger tide 5 h later (402 mm). The reanalysis (termed “1944 adjusted”) produces the return period plot in Figure 6, superimposed over the actual data analysis (termed “Revised 2025”). In effect, this one data point would now become the highest extreme above MSL by ≈138 mm, permitting a slightly improved fitting of the GPD at the extreme end of the data. This single increase in the water surface above MSL is estimated to have a return period of 169 years and the 1154 mm recorded above MSL in the hurricane “Wilma” event is estimated to have a return period of 109 years, significantly lower than the 144 years estimated from the current EVA. Below a return period of 10 years, the predictive curves are near identical.
This example highlights the extreme sensitivity of the timing of the coincident astronomical tide and storm surge in producing extreme measured water levels. Similarly, this example also exemplifies the importance and influence of the most extreme events in fitting the GPD for EVA.
The state-of-the-art in EVA for estimating return level heights from tide gauge records is well established in the literature [1,26] and followed in this paper. However, the abovementioned sensitivities associated with the coincidence of the storm surge and astronomical tide have, on several occasions, averted realizing the most extreme water level on record by as little as 12 h (or less). This raises the question about how the results gleaned from such analyses should best be applied from a scientific, strategic planning and coastal engineering perspective having due regard to risk and consequences. This presents as a significant topic for further academic discussion and sits beyond the purview of this paper.

4.3. Limitations of the Analysis and Results

It should be noted that EVA involves a relatively small proportion of the overall data set which must adhere to quite specific mathematical foundations (i.e., stationarity and independence). As a result, the fitting of continuous probability distribution functions can be very sensitive to a small number of very extreme events resulting in large confidence intervals for increasing event rarity, as evidenced in the return level plot for Key West (Figure 3).
The key results of the analysis provide return levels for extreme water levels above MSL that are the combination of the tidal influence at Key West coupled with the meteorological forcings inherent in the regional context. Therefore, the results are not directly transferable to another location.
It is also noted that there is no statistical evidence (yet) to suggest that extreme water levels above MSL are becoming more extreme at this location [1]. However, should this eventuate as a possible artifact of climate change, the extreme value analysis and return level plots espoused in this paper would no longer be valid (with stationarity principles violated) and the analysis would then have to be reconsidered.

4.4. Why Did Major Hurricanes “Helene” and “Milton” Have Little Effect on the EVA Results at the Key West Tidal Facility?

Figure 7 provides a pictorial representation of the track paths for hurricanes “Helene” and “Milton” compared to the track paths of the 5 largest storm surge-producing hurricane events to impact the Key West tidal facility. What is noticeable is that 4 of the 5 largest surge-producing events at Key West resulted from hurricanes tracking through a near identical position (25° N/83° W), approximately 130 km to the northwest of Key West in the Gulf of Mexico. This would be expected given the counterclockwise rotation of the northern hemisphere hurricanes driving maximum wind-driven surges at the coastline of Key West from these track paths. The extent of the surge at any specific location and time will be governed by complex factors including storm intensity, forward speed, radius of maximum winds and path (amongst others). In the context of the current study, the proximity of the Key West tidal facility to the respective track path of a hurricane will also have a particular bearing on the scale of the surge measured.
Although “Helene” and “Milton” were both major hurricanes with devastating impacts, neither tracked closer than around 280 km from Key West at its closest point, diminishing the extent of storm surge generated at the Key West tidal facility.
Elsewhere, however, the storm surge generated by these major hurricanes had significant impacts. “Helene” produced a catastrophic storm surge with significant impacts to coastal communities along a large portion of Florida’s Gulf Coast. In the Big Bend region, storm surge inundation of 3.7 to 4.9 m above ground level occurred from just west of Keaton Beach through to Steinhatchee, where small coastal communities were devastated [2]. By comparison, “Milton” produced a damaging storm surge along the central to southwest Florida Gulf coast, as well as minor storm surge impacts on the northeast Florida Atlantic coast; however, the maximum surge recorded was substantially lower than that recorded during “Helene” [3]. At the Key West tidal facility, the maximum surges recorded during “Helene” and “Milton” were around 330 mm and 230 mm, respectively, and both peak surges coincided with low tidal conditions. Hence, neither major hurricane had any significant effect on EVA at the Key West location.

5. Conclusions

Although major hurricanes “Helene” and “Milton” proved both deadly and costly disasters to impact the south-eastern USA during 2024, the actual influence on still water levels recorded at the Key West tidal facility were limited, resulting in recorded water levels above MSL at or below that which would be expected on a once-per-annum basis.
The EVA results of Watson (2023) [1] have been updated in this paper with the addition of a further 2 years of hourly data up to and including 2023–2024. The updated results are not markedly different from the prior analysis for use in planning and engineering design applications.
A key element of this paper is the storm surge analysis across the data record spanning ≈113 years, highlighting the largest surge recorded at Key West (890 mm) resulting from a major hurricane in October 1944, exceeding the 834 mm recorded during “Wilma” in October 2005, the key difference between the events being the coincidence of the tidal conditions at the time of the peak surge (343 mm above MSL during “Wilma” compared with only 21 mm above MSL in 1944). Hence, the total superelevation of the still water surface recorded during “Wilma” (1154 mm above MSL) still dwarfs all other recorded extremes by ≈200 mm.
The analysis herein contains an insight into the unrealized risk of more significant extreme measured water levels at Key West which will manifest with a very large hurricane-driven storm surge coinciding with high tide conditions, noting that the hurricane and “king tide” seasons overlap from September through November along Florida’s coastline. During 2024 alone, some 570 hourly predicted tides exceeded the Mean High Higher Water (MHHW) level for the current tidal epoch at Key West (≈280 mm above MSL) during the hurricane season. Any event producing a surge akin to that experienced at this location in 1944, coinciding with the current MHHW, would create a new record for superelevation of the water surface above MSL at Key West.
Further, this neglects the imposition of rising MSL at the Key West location where the relative rate of rise is currently just under 10 mm/y. Combining all of the above-mentioned parameters (surge, tidal conditions and rising MSL) for risk management purposes to inform strategic planning and associated coastal engineering endeavors is no straightforward exercise given uncertainties associated with future sea-level rise projections and the possibility of increased storm intensities in the decades ahead.
With both tidal and surge conditions changing quickly throughout 12–24 h, it is a sobering thought that several of the highest surge-producing events at this location have averted record-breaking water levels above MSL by as little as 6 h, due to low coincident tidal conditions. A precautionary approach is strongly recommended.

Funding

This research received no external funding.

Data Availability Statement

The data presented in this study are openly available in Permanent Service for Mean Sea Level (Refs. [10,11]); NOAA’s Center for Operational Oceanographic Products and Services (Ref. [12]); and US National Hurricane Center (Ref. [9]).

Acknowledgments

The author would like to thank NOAA’s Center for Operational and Oceanographic Products and Services (CO-OPS); Permanent Service for Mean Sea Level; and the National Hurricane Center for their respective publicly accessible data repositories which made this research possible.

Conflicts of Interest

The author declares no conflicts of interest.

References

  1. Watson, P.J. Extreme Value Analysis of Ocean Still Water Levels along the USA East Coast—Case Study (Key West, Florida). Coasts 2023, 3, 294–312. [Google Scholar] [CrossRef]
  2. Hagen, A.B.; Cangialosi, J.P.; Chenard, M.; Alaka, L.; Delgado, S. National Hurricane Center Tropical Cyclone Report—Hurricane Helene (AL092024) 24–27 September 2024; National Hurricane Center: Miami, FL, USA, 2025. [Google Scholar]
  3. Beven, J.L.I.; Alaka, L.; Fritz, C. National Hurricane Center Tropical Cyclone Report—Hurricane Milton (AL142024) 5-10 October 2024; National Hurricane Center: Miami, FL, USA, 2025. [Google Scholar]
  4. Coles, S. An Introduction to Statistical Modeling of Extreme Values; Springer London: London, UK, 2001; ISBN 978-1-84996-874-4. [Google Scholar]
  5. Embrechts, P.; Klüppelberg, C.; Mikosch, T. Modelling Extremal Events; Springer: Berlin/Heidelberg, Germany, 1997; ISBN 978-3-642-08242-9. [Google Scholar]
  6. Watson, P.J. Determining Extreme Still Water Levels for Design and Planning Purposes Incorporating Sea Level Rise: Sydney, Australia. Atmosphere 2022, 13, 95. [Google Scholar] [CrossRef]
  7. Parkinson, R.W.; Harlem, P.W.; Meeder, J.F. Managing the Anthropocene Marine Transgression to the Year 2100 and beyond in the State of Florida U.S.A. Clim. Change 2015, 128, 85–98. [Google Scholar] [CrossRef]
  8. Sweet, W.V.; Hamlington, B.D.; Kopp, R.E.; Weaver, C.P.; Barnard, P.L.; Bekaert, D.; Brooks, W.; Craghan, M.; Dusek, G.; Frederikse, T.; et al. Global and Regional Sea Level Rise Scenarios for the United States: Updated Mean Projections and Extreme Water Level Probabilities Along U.S. Coastlines; NOAA Technical Report NOS 01; National Oceanic and Atmospheric Administration, National Ocean Service: Silver Spring, MD, USA, 2022.
  9. National Oceanic and Atmospheric Administration National Hurricane Center. Available online: https://www.nhc.noaa.gov/data/#hurdat (accessed on 1 April 2024).
  10. PSMSL Permanent Service for Mean Sea Level. Available online: https://www.psmsl.org/data/obtaining/ (accessed on 1 April 2025).
  11. Holgate, S.J.; Matthews, A.; Woodworth, P.L.; Rickards, L.J.; Tamisiea, M.E.; Bradshaw, E.; Foden, P.R.; Gordon, K.M.; Jevrejeva, S.; Pugh, J. New Data Systems and Products at the Permanent Service for Mean Sea Level. J. Coast. Res. 2013, 29, 493. [Google Scholar] [CrossRef]
  12. National Oceanic and Atmospheric Administration’s Center for Operational Oceano-Graphic Products and Services (CO-OPS). Available online: https://tidesandcurrents.noaa.gov/stationhome.html?id=8724580 (accessed on 1 April 2025).
  13. Beirlant, J.; Goegebeur, Y.; Teugels, J.; Segers, J. Statistics of Extremes; John Wiley & Sons, Ltd.: Chichester, UK, 2004; ISBN 9780470012383. [Google Scholar]
  14. Pickands, J. Statistical Inference Using Extreme Order Statistics. Ann. Stat. 1975, 3, 119–131. [Google Scholar] [CrossRef]
  15. Balkema, A.A.; De Haan, L. Residual Life Time at Great Age. Ann. Probab. 1974, 2, 792–804. [Google Scholar] [CrossRef]
  16. Falk, M.; Hüsler, J.; Reiss, R.-D. Statistics of Extremes. In Laws of Small Numbers: Extremes and Rare Events; Springer: Basel, Switzerland, 2011; pp. 455–471. ISBN 978-3-0348-0009-9. [Google Scholar]
  17. Broomhead, D.S.; King, G.P. Extracting Qualitative Dynamics from Experimental Data. Phys. D Nonlinear Phenom. 1986, 20, 217–236. [Google Scholar] [CrossRef]
  18. Golyandina, N.; Nekrutkin, V.; Zhigljavsky, A.A. Analysis of Time Series Structure: SSA and Related Techniques; CRC Press: Boca Raton, FL, USA, 2001. [Google Scholar]
  19. Vautard, R.; Ghil, M. Singular Spectrum Analysis in Nonlinear Dynamics, with Applications to Paleoclimatic Time Series. Phys. D Nonlinear Phenom. 1989, 35, 395–424. [Google Scholar] [CrossRef]
  20. Watson, P.J. Improved Techniques to Estimate Mean Sea Level, Velocity and Acceleration from Long Ocean Water Level Time Series to Augment Sea Level (and Climate Change) Research. Ph.D. Thesis, University of New South Wales, Kensington, NSW, Australia, 2018. [Google Scholar]
  21. Watson, P.J. Status of Mean Sea Level Rise around the USA (2020). GeoHazards 2021, 2, 80–100. [Google Scholar] [CrossRef]
  22. Hastie, T.; Tibshirani, R. Generalized Additive Models. Stat. Sci. 1986, 1, 297–310. [Google Scholar] [CrossRef]
  23. Hastie, T.J. Generalized Additive Models. In Statistical Models in S; Taylor & Francis: Abingdon-on-Thames, UK, 2017; pp. 249–307. [Google Scholar]
  24. Wood, S.N.; Goude, Y.; Shaw, S. Generalized Additive Models for Large Data Sets. J. R. Stat. Soc. Ser. C Appl. Stat. 2015, 64, 139–155. [Google Scholar] [CrossRef]
  25. R Core Team. R Development Core Team R: A Language and Environment for Statistical Computing; R Foundation for Statistical Computing: Vienna, Austria, 2025. [Google Scholar]
  26. Arns, A.; Wahl, T.; Haigh, I.D.; Jensen, J.; Pattiaratchi, C. Estimating Extreme Water Level Probabilities: A Comparison of the Direct Methods and Recommendations for Best Practise. Coast. Eng. 2013, 81, 51–66. [Google Scholar] [CrossRef]
  27. Gilleland, E.; Katz, R.W. ExtRemes 2.0: An Extreme Value Analysis Package in R. J. Stat. Softw. 2016, 72, 1–39. [Google Scholar] [CrossRef]
  28. Scarrott, C.; MacDonald, A. A Review of Extreme Value Threshold Estimation and Uncertainty Quantification. Revstat-Stat. J. 2012, 10, 33–60. [Google Scholar]
  29. Ghosh, S.; Resnick, S. A Discussion on Mean Excess Plots. Stoch. Process. Their Appl. 2010, 120, 1492–1517. [Google Scholar] [CrossRef]
  30. NOAA NOS What Is Storm Surge? Available online: https://oceanservice.noaa.gov/facts/stormsurge-stormtide.html (accessed on 4 August 2025).
  31. UK Met Office Storm Surge. Available online: https://weather.metoffice.gov.uk/learn-about/weather/types-of-weather/storms/storm-surge (accessed on 4 August 2025).
  32. Oppenheimer, M.; Glavovic, B.; Hinkel, J.; van de Wal, R.; Magnan, A.K.; Abd-Elgawad, A.; Cai, R.; Cifuentes-Jara, M.; DeConto, R.M.; Ghosh, T.; et al. Sea Level Rise and Implications for Low Lying Islands, Coasts and Communities. In IPCC Special Report on the Ocean and Cryosphere in a Changing Climate; The Intergovernmental Panel on Climate Change: Geneva, Switzerland, 2019. [Google Scholar]
  33. Fox-Kemper, B.; Hewitt, H.T.; Xiao, C.; Aðalgeirsdóttir, G.; Drijfhout, S.S.; Edwards, T.L.; Golledge, N.R.; Hemer, M.; Kopp, R.E.; Krinner, G.; et al. Ocean, Cryosphere and Sea Level Change. In Climate Change 2021: The Physical Science Basis. Contribution of Working Group I to the Sixth Assessment Report of the Intergovernmental Panel on Climate Change; Masson-Delmotte, V., Zhai, P., Pirani, A., Connors, S.L., Péan, C., Berger, S., Caud, N., Chen, Y., Goldfarb, L., Gomis, M.I., Eds.; Cambridge University Press: Cambridge, UK; New York, NY, USA, 2021; pp. 1211–1362. [Google Scholar]
  34. May, C.L.; Osler, M.S.; Stockdon, H.F.; Barnard, P.L.; Callahan, J.A.; Collini, R.C.; Ferreira, C.M.; Finzi Hart, J.; Lentz, E.E.; Mahoney, T.B.; et al. Coastal Effects. In Fifth National Climate Assessment; Crimmins, A.R., Avery, C.W., Easterling, D.R., Kunkel, K.E., Stewart, B.C., Maycock, T.K., Eds.; U.S. Global Change Research Program: Washington, DC, USA, 2023. [Google Scholar]
  35. National Hurricane Center and Central Pacific Hurricane Center NOAA Website. Available online: https://www.nhc.noaa.gov/surge/ (accessed on 1 April 2025).
  36. National Weather Service NOAA Severe Weather Outbreak in South Florida: 2 February 1998. Available online: https://www.weather.gov/mfl/groundhogday (accessed on 4 August 2025).
  37. Houston, J.R.; Dean, R.G. Sea-Level Acceleration Based on U.S. Tide Gauges and Extensions of Previous Global-Gauge Analyses. J. Coast. Res. 2011, 27, 409–417. [Google Scholar] [CrossRef]
  38. Baart, F.; Van Koningsveld, M.; Stive, M.J.F. Trends in Sea-Level Trend Analysis. J. Coast. Res. 2012, 28, 311–315. [Google Scholar] [CrossRef]
  39. Donoghue, J.F.; Parkinson, R.W. Discussion of: Houston, JR and Dean, RG, 2011. Sea-Level Acceleration Based on US Tide Gauges and Extensions of Previous Global-Gauge Analyses. J. Coast. Res. 2011, 27, 409–417. J. Coast. Res. 2011, 27, 994–996. [Google Scholar]
  40. Houston, J.R.; Dean, R.G. Reply to: Donoghue, JF and Parkinson, RW, 2011. Discussion of: Houston, JR and Dean, RG, 2011. Sea-Level Acceleration Based on US Tide Gauges and Extensions of Previous Global-Gauge Analyses. J. Coast. Res. 2011, 27, 409–417. J. Coast. Res. 2011, 27, 997–998. [Google Scholar]
  41. Rahmstorf, S.; Vermeer, M. Discussion of: Houston, JR and Dean, RG, 2011. Sea-Level Acceleration Based on US Tide Gauges and Extensions of Previous Global-Gauge Analyses. J. Coast. Res. 2011, 27, 409–417. J. Coast. Res. 2011, 27, 784–787. [Google Scholar] [CrossRef]
  42. Houston, J.R.; Dean, R.G. Reply to: Rahmstorf, S. and Vermeer, M., 2011. Discussion of: Houston, JR and Dean, RG, 2011. Sea-Level Acceleration Based on US Tide Gauges and Extensions of Previous Global-Gauge Analyses. J. Coast. Res. 2011, 27, 409–417. J. Coast. Res. 2011, 27, 788–790. [Google Scholar]
  43. Houston, J.R.; Dean, R.G. Effects of Sea-Level Decadal Variability on Acceleration and Trend Difference. J. Coast. Res. 2013, 290, 1062–1072. [Google Scholar] [CrossRef]
  44. Visser, H.; Dangendorf, S.; Petersen, A.C. A Review of Trend Models Applied to Sea Level Data with Reference to the “Acceleration-Deceleration Debate”. J. Geophys. Res. Ocean. 2015, 120, 3873–3895. [Google Scholar] [CrossRef]
  45. Daubechies, I. Orthonormal Bases of Compactly Supported Wavelets. Commun. Pure Appl. Math. 1988, 41, 909–996. [Google Scholar] [CrossRef]
  46. Daubechies, I. Ten Lectures on Wavelets; SIAM: Philadelphia, PA, USA, 1992. [Google Scholar]
  47. Grossmann, A.; Morlet, J. Decomposition of Hardy Functions into Square Integrable Wavelets of Constant Shape. SIAM J. Math. Anal. 1984, 15, 723–736. [Google Scholar] [CrossRef]
  48. Grossmann, A.; Kronland-Martinet, R.; Morlet, J. Reading and Understanding Continuous Wavelet Transforms. In Proceedings of the Wavelets: Time-Frequency Methods and Phase Space Proceedings of the International Conference, Marseille, France, 14–18 December 1987; Springer: Berlin/Heidelberg, Germany, 1990; pp. 2–20. [Google Scholar]
  49. Watson, P.J. Development of a Unique Synthetic Data Set to Improve Sea-Level Research and Understanding. J. Coast. Res. 2015, 31, 758–770. [Google Scholar] [CrossRef]
  50. Watson, P.J. Identifying the Best Performing Time Series Analytics for Sea Level Research. In Time Series Analysis and Forecasting: Contributions to Statistics; Rojas, I., Pomares, H., Eds.; Springer International Publishing: Cham, Switzerland, 2016; pp. 261–278. [Google Scholar]
  51. Watson, P.J. TrendSLR: Estimating Trend, Velocity and Acceleration from Sea Level Records; Comprehensive R Archive Network (CRAN). 2019. Available online: https://r-packages.io/packages/TrendSLR (accessed on 23 September 2025).
  52. City of Miami, Florida Website. Available online: https://www.miami.gov/My-Government/Climate-Change-in-the-City-of-Miami/King-Tides (accessed on 1 April 2025).
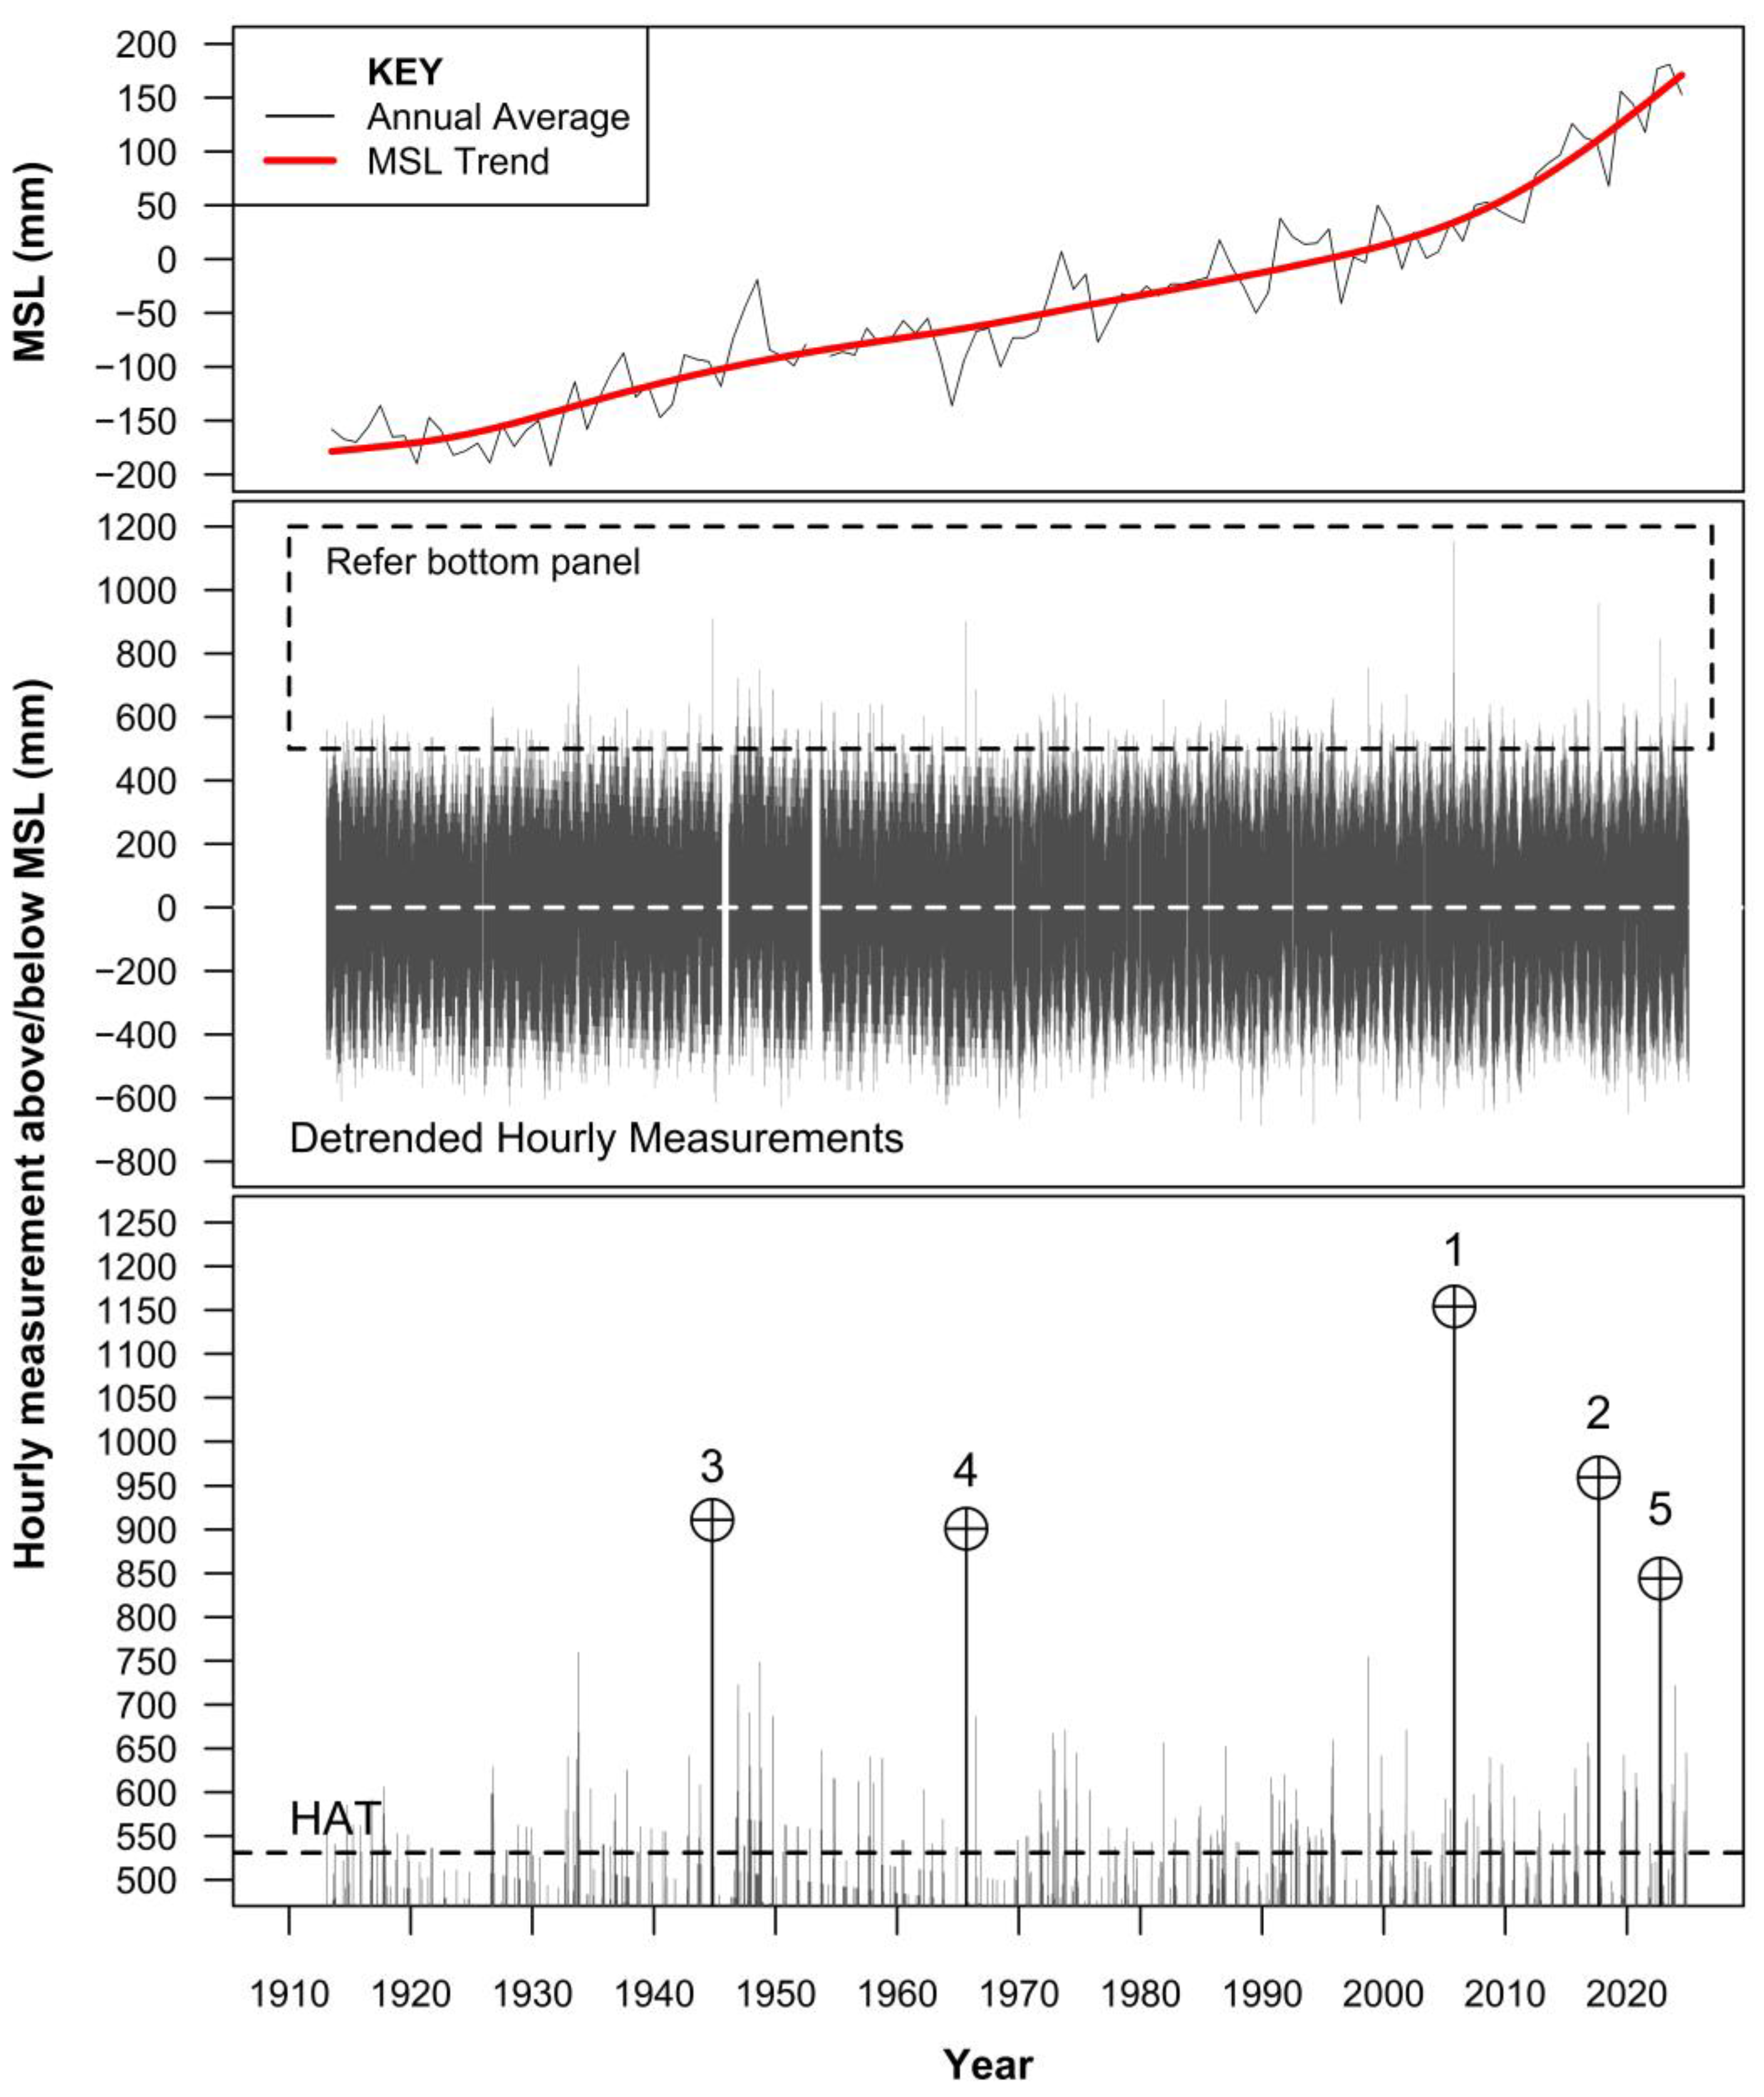
Figure 2. Summary of the detrended hourly tide gauge measurements for Key West, Florida spanning the timeframe from 1913 to 2024 (inclusive). The top panel shows the relative rise in MSL over the period of record. The middle panel depicts the detrended hourly measurements (i.e., with the relative MSL trend removed). The bottom panel depicts the upper portion of the data record exceeding 500 mm above MSL with the five largest events highlighted along with Highest Astronomical Tide (HAT) for the current tidal epoch (531 mm above MSL) [12]. This chart extends Figure 2 (Watson, 2023 [1]) by an additional 2 years.
Coasts 05 00041 g002
Figure 3. Comparison between revised extreme hourly SWL return periods for Key West, Florida and previous estimates in Watson (2023) [1]. The current revised analysis uses a further 2 years of hourly data (denoted by black lines).
Coasts 05 00041 g003
Figure 4. Summary of hourly storm surge measurements for Key West, Florida spanning the timeframe from 1913 to 2024 (inclusive). The highest 10 ranked surge measurements are highlighted in the bottom panel. For further details refer to Table 3 below.
Coasts 05 00041 g004
Figure 5. Comparison between revised MSL trend analysis and previous MSL estimation in Watson (2023) [1]. The current revised MSL analysis uses a further 2 years of data.
Coasts 05 00041 g005
Figure 6. Hypothetical EVA return period plot with 1944 extreme adjusted to coincide with higher tides 5 h later. Current revised (2025) analysis superimposed in black.
Coasts 05 00041 g006
Figure 7. Track paths for hurricanes “Helene” and “Milton” compared to the track paths producing the largest 5 surge events at Key West (denoted by numbers 1–5). Track data sourced from the National Hurricane Center [9] and direction of path depicted with arrows. For further details refer to Table 3.
Coasts 05 00041 g007
Table 1. Summary of 10 Largest Hourly Measurements above MSL at Key West.
RankHeight Above MSL (mm) 1Date
(Time, h)
Hurricane Event 2Coincident Tide (mm) 3
1115424 October 2005 (0700)Wilma343
295910 September 2017 (1700)Irma256
391118 October 1944 (2200)Unnamed21
49018 September 1965 (1400)Betsy336
584428 September 2022 (0300)Ian396
67605 October 1933 (0300)Unnamed436
775525 September 1998 (1800)Georges238
874921 September 1948 (1700)Unnamed292
974121 September 2005 (0200)Rita318
107239 December 1946 (0200)-429
1 Summary based on detrended and declustered results. 2 Hurricane event details sourced from the National Hurricane Center [9]. 3 Datum for coincident tide is MSL.
Table 2. Predicted extreme hourly SWL above MSL (Key West, Florida).
Return Period (Years)Height Above MSL (mm)
(2023)
Height Above MSL (mm)
(Revised 2025)
1576574
2613608
5674667
10733725
20807799
50937932
10010671068
20012361250
50015501590
100018881959
Central model estimates derived from Figure 3. Refer to Figure 3 for 95% CI.
Table 3. Summary of 10 largest hourly storm surge measurements at Key West.
RankStorm Surge
(mm) 1
Date
(Time, h)
Hurricane
Event 2
Min Proximity to Track Path (km) 3
189018 October 1944 (2200)Unnamed110
283424 October 2005 (0800)Wilma117
377310 September 2017 (1400)Irma32
46438 September 1965 (1500)Betsy68
55858 June 1966 (2000)Alma90
658121 September 2005 (0000)Rita64
75342 February 1998 (2200)--
851725 September 1998 (1800)Georges6
950221 September 1948 (2000)Unnamed22
1047528 September 2022 (0100)Ian110
1 Summary based on declustered results. 2 Hurricane event details sourced from the National Hurricane Center [9]. 3 Minimum distance between published track path [9] and the Key West tidal facility. The term “Storm Surge” in this context is considered the difference between the measured water level and the predicted tide.
Disclaimer/Publisher’s Note: The statements, opinions and data contained in all publications are solely those of the individual author(s) and contributor(s) and not of MDPI and/or the editor(s). MDPI and/or the editor(s) disclaim responsibility for any injury to people or property resulting from any ideas, methods, instructions or products referred to in the content.