Article

Modeling of Real-Time Water Levels and Mapping of Storm Tide Pathways: A Collaborative Effort to Respond to the Threats of Coastal Flooding

1
National Weather Service Boston, Norton, MA 02766, USA
2
Marine Geology, Center for Coastal Studies, Provincetown, MA 02657, USA
3
School for the Environment, University of Massachusetts, Boston, MA 02125, USA
4
Massachusetts Office of Coastal Zone Management, Boston, MA 02114, USA
*
Author to whom correspondence should be addressed.
Coasts 2025, 5(4), 36; https://doi.org/10.3390/coasts5040036
Submission received: 1 April 2025 / Revised: 9 May 2025 / Accepted: 4 August 2025 / Published: 1 October 2025

Abstract

The real-time forecast estimates of total water levels (TWL) associated with coastal storms by the Boston Office of the National Weather Service (NWS), and the analysis, identification, and field mapping of storm tide pathways (STP) by the Center for Coastal Studies (CCS) within the forecast region, has led to improved model forecasts, enhanced allocation of resources prior to storm impact (e.g., placement of flood control measures, identification of evacuation routes, development of applications to visualize and communicate threats, etc.), and increased public awareness of the practical implications of sea level rise and storm-related coastal flooding. Both NWS modeling and STP mapping are discussed here. The coupling of these methods began in 2016–2017 in Provincetown, MA, and its utility was highlighted during the new storm of record for most of southern New England, a nor’easter in January 2018. The use of this information by managers, stakeholders, and the public has increased since combining the TWL modeling and STP mapping in an online portal in 2021, and it continues to be used by emergency managers and the public to plan for approaching coastal storms.

1. Introduction

Many global sea level rise (SLR) projections indicate that by 2100 the frequency of extreme events, such as the 100-year return frequency storms, will increase, with many low-lying cities and small islands experiencing them annually by 2050 [1]. The northeastern coast of the United States is highly vulnerable to inundation in many low-lying areas with large population centers and concentrated development [2]. Boston, Massachusetts (Figure 1), with over 2225 ha (5500 ac) of filled tidelands [3], is especially susceptible to impacts from SLR, and under high- and low-CO2-emission scenarios the inundation associated with the present 100-year return frequency event could occur every 8 and 30 years, respectively, by 2050 [4]. The study area, Provincetown, Massachusetts, is also a low-lying community with a year-round population of approximately 3600 that increases up to 20-fold during the summer tourist season (https://ptownchamber.com, accessed on 13 July 2024).
Water expands with increasing temperatures, and this steric effect impacts global and regional sea level rise. Pershing et al. [5] showed that the Gulf of Maine was one of the most rapidly warming ocean embayments in the world. Marsooli et al. [6] found that New England would experience the present 100-year flood elevation annually by 2100 via the compound effects of SLR and projected tropical cyclone climatology under the high emission projection of the Representative Concentration Pathway 8.5 (RCP 8.5).
The mean sea level trend for Boston Harbor, based on historical records for the years 1921–2006, depicts an average sea surface that is rising at the rate of 2.63 mm/year [7]. Recent projections for Boston reflect an accelerating rate and predict that sea level is likely to rise 56 cm by 2100 [7]. Accelerating relative sea level rise has increased the frequency of tidal flooding events in coastal regions during peak tidal cycles (e.g., spring tides). Although this high-tide flooding (HTF) typically produces minimal structural damage, its chronic occurrence generates cumulative impacts including drainage system failures, road closures, and progressive infrastructure degradation not designed for saltwater immersion [8,9]. Current estimates indicate that HTF impacts begin to appear when water levels approach 0.5–0.7 m (1.75–2.25 ft) above mean higher high water (MHHW), a level that is projected to be exceeded between 7 and 35 days by 2030 and 30 and 125 days per year along the Northeast Atlantic Coast [9].
Currently, more than half (53%) of Massachusetts residents live in coastal communities [10]. As one of the major natural resources of the state, the Massachusetts coast and coastal zone employ 2.8 million people annually, earning over USD 206 billion, and equating to more than USD 460 billion in gross domestic product [10]. Major contributors to the State economy associated with the coastal zone include tourism; coastal recreation; commercial and recreational fishing; and real estate [10]. With the retail trade, along with Accommodation and Food Services accounting for 32.9% of Barnstable County’s economy in terms of total employment [11], tourism and recreation make up 95% of Cape Cod’s total ocean economy, providing over USD 372 million in wages [12]. Properties located in floodplains along Cape Cod Bay have an estimated total value in excess of USD 2 billion [13]. With current sea level rise projections increasing, more frequent, intense hurricanes and coastal storms will place a half million people and associated infrastructure along the Massachusetts coast at-risk over the next century [13].

NWS Forecasting

For decades, the National Weather Service (NWS) has issued Coastal Flood Watches, Warnings, and Advisories in a text-based format to inform decision makers and the public of coastal flooding based upon three flood categories: “Minor”, which refers to shallow flooding less than 0.30 m (1 ft) deep (mainly in low-lying areas) where most roads remain passable and there is a minimal threat of property damage; “Moderate”, which refers to flooding 0.30–0.91 m (1–3 ft) deep where coastal roads become impassable and, in the presence of high surf, can cause damage to shoreline structures; and “Major”, which refers to life-threatening flooding more than 0.91 m (3 ft) deep in which evacuations are required and many roads become impassable, potentially cutting off access to some coastal communities, and structural damage is likely from high surf. Watches and Warnings are intended for messaging significant flooding (Moderate or Major), while Advisories are used for Minor flooding that has little impact. These products cover long reaches of coastline with limited specificity.
Many online inundation or sea level rise viewers and flood models limit the ability to zoom to a scale sought by local managers, public works professionals and emergency managers charged with responding to emerging coastal flood hazards [14]. Uncertainty is also a concern with online viewers and flood models, particularly if the latter are run in real-time [15]. Both of these issues are improved for managers and first-responders when real-time models are coupled with GIS-based Low-Complexity Flood Mapping (LCFM) [14].
This study describes the strengths and weaknesses of coupling a coarse-scale, state-of-the-art, real-time TWL forecast model with a new method of fine-scale mapping of STPs that can be completed with standard GIS software (https://www.arcgis.com/index.html, accessed on 13 July 2024) discussed below. To demonstrate utility of the method, a case study is provided discussing the NWS’s real-time TWL forecast models and the 4 January 2018 northeaster, that became the Storm of Record, replacing the Blizzard of 1978 for a significant portion of the southern New England coast in the Gulf of Maine. STP mapping is also discussed in detail to demonstrate the benefits of combining this information with the NWS’s real-time TWL forecast models, or other similar models, including how the mapping and associated inundation can be used to ground-truth forecast models. Lastly, the benefits realized by communicating flooding threats associated with NWS TWL forecasts and advisories of approaching storms through the visualization of the STPs and inundation extents at a local scale on a publicly accessible website will be examined.

2. Materials and Methods

This study takes place in Provincetown, Massachusetts, a small, low-lying coastal town of approximately 7 km2 (www.census.gov, accessed on 13 July 2024) with a year-round population of approximately 3400 that increases to 60,000 during the peak summer tourist season (provincetown-ma.gov, accessed on 13 July 2024). The Provincetown Hook is a series of spits that were deposited over the last 6000 years as sea level rose causing ocean waves to erode the Late Wisconsinan glacial landforms to the south [16].

2.1. The NWS Model/TWL Forecasts (Grid Cell Size, Data Input, Choices)

Over the past several years, the NWS Weather Forecast Office (WFO) in Boston/Norton, MA has produced gridded forecasts of total water level and more recently integrated Geographic Information System (GIS) technology to highlight specific areas at risk through visualization. This initiative marks the beginning of a national effort to tie in coastal inundation forecasts with the National Water Model, which will initially produce riverine inundation forecasts down to the neighborhood level.
Total water level is defined as the combination of astronomical tide and storm surge. Since astronomical tide is a known value, forecasters utilize output from several storm surge models such as the ETSS (Extra-Tropical Storm Surge), STOFS (Surge and Tide Operational Forecast System), P-ETSS (Probabilistic Extra-Tropical Storm Surge), and most recently the Stevens Institute Flood Advisory System to determine the storm surge component.
The NWS’ Meteorological Development Laboratory (MDL) provides NWS forecasters with extra-tropical storm surge guidance, using a modified Sea Lake and Overland Surges from Hurricanes (SLOSH) model to assess potential impacts of extra-tropical storms. SLOSH underwent two modifications in the 1990s. The first, used the Global Forecast System (GFS) winds as input rather than a parametric wind model. Second, overland flooding was not computed so it could run on operational computers more effectively. The result was the Extra-Tropical Storm Surge (ETSS) model [17], which runs operationally four times daily along the U.S. East, West, Alaskan, and Gulf of Mexico coasts. STOFS presents an additional operational set of guidance for forecasts to the ET-SURGE (ETSS) model. The community-based ADvanced CIRCulation (ADCIRC) model is used for STOFS, and the Global Forecast System (GFS) model provides the forcing (https://polar.ncep.noaa.gov/estofs/glo.htm, accessed on 13 July 2024). The STOFS model is run on NOAA’s WCOSS2 supercomputing system four times daily out to 180 h producing numerical storm surge guidance for systems.
Storm surge forecast uncertainty stems from multiple error sources including atmospheric forcing parameters (wind speed, wind direction and atmospheric pressure), initial oceanographic conditions, the relevant physical processes, and numerical scheme, etc. While certain uncertainties can be mitigated through model enhancement, atmospheric forcing uncertainty remains dominant due to its dependence on external inputs.
Ensemble-based approaches combining atmospheric forcing with the modeling of storm surge provide quantitative uncertainty estimation for inundation risk [18]. In 2017 MDL’s implementation of Probabilistic Extra-Tropical Storm Surge (P-ETSS) model utilized 21 ensemble member Global Ensemble Forecast System for atmospheric input to a model for tidal inundation and storm surge. The resulting set of guidance on inundation is equally weighted. MDL recently enhanced P-ETSS by using the 42-member North American Ensemble Forecast System (NAEFS) rather than the 21-member Global Ensemble Forecast System [3].
Davidson Laboratory at the Stevens Institute of Technology in Hoboken, NJ, developed the Stevens Flood Advisory System (SFAS) (http://stevens.edu/SFAS, accessed on 13 July 2024), which provides both real-time water level and forecasted water levels for 150 locations ranging from Delaware Bay north to Maine. For each location, real-time water levels for tidal observing stations and forecasts of total water level and flooding are provided for the ensuing four and half days. The water level and flood forecasts utilize the NYHOPS hydrological model (NYHOPS, www.stevens.edu/NYHOPS) and incorporate meteorological forecasts from the GFS, NAM, CMC, and European models.
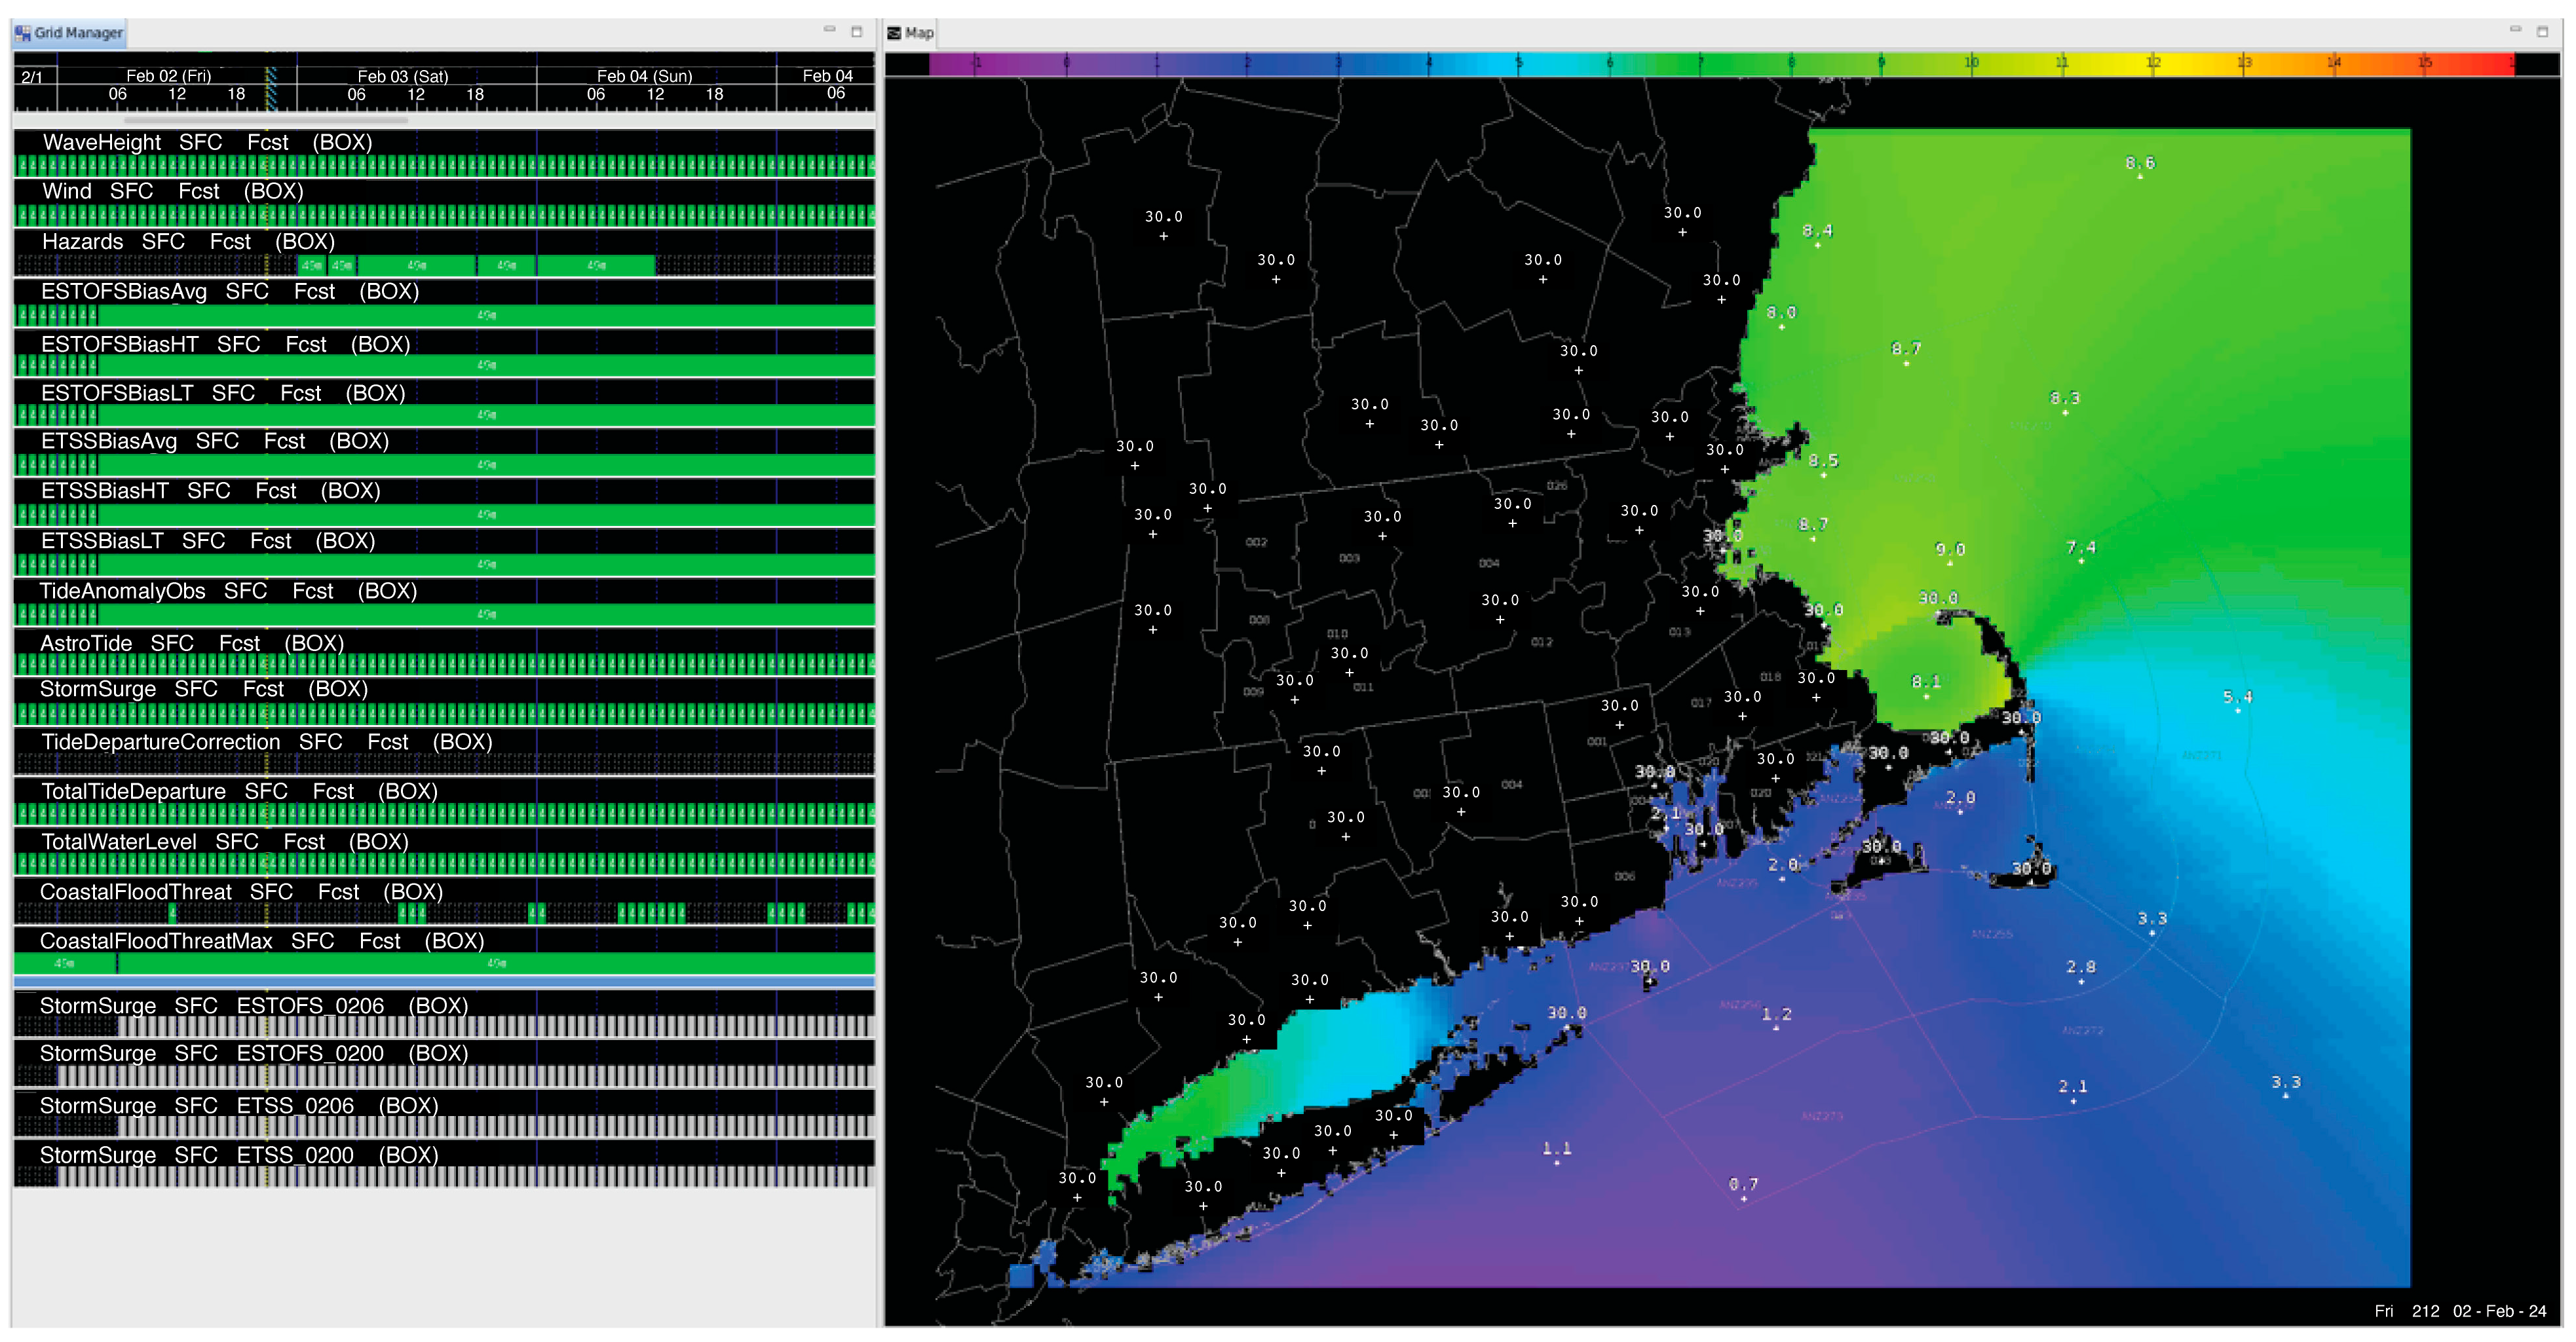
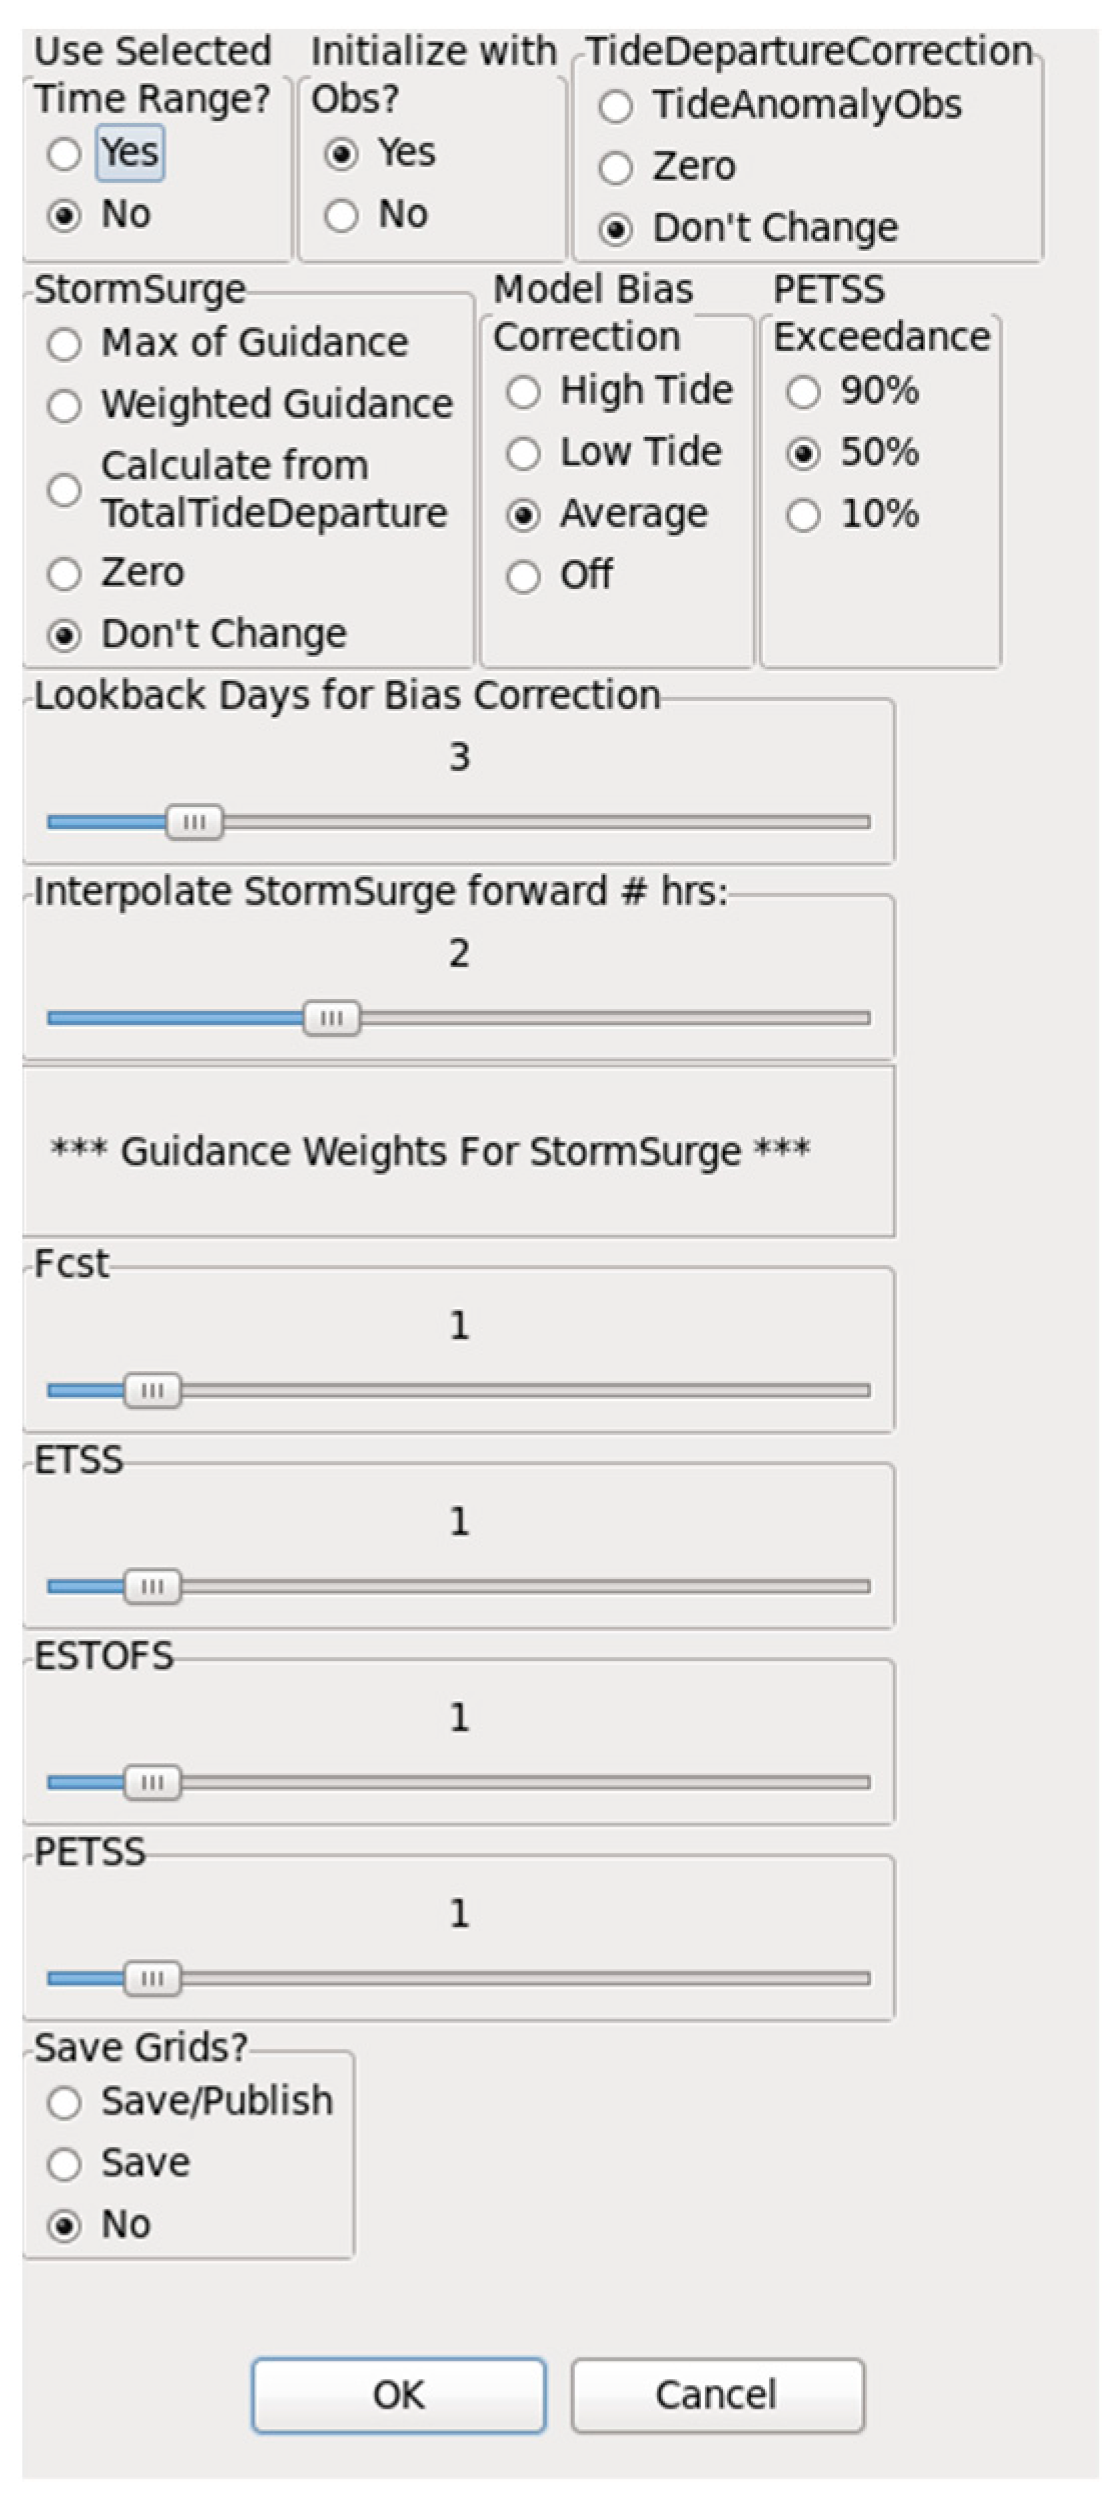
Since the early 2000s, the National Weather Service has utilized the Gridded Forecast Editor (GFE) to produce forecasts of various weather elements through the next seven days, a Python-based system (v3.11) that is part of the AWIPS (Advanced Weather Interactive Processing System) platform to produce forecasts of various weather elements out through the next seven days (Figure 2). GFE operates at a resolution of 2.5 km and allows the forecaster to ingest and interact with model data to produce forecasts in a graphical format, thereby expanding the suite of forecast information to include both text and graphics. Meteorologists have the ability to directly import model guidance, or blends of model guidance, and use tools to populate the graphical database to reflect expected conditions. Recent improvements to the forecast process for populating Total Water Level forecast information include the incorporation of a bias correction to the model data, the ability to blend data from multiple model sources, and the inclusion of P-ETSS percentiles to better capture extreme events (Figure 3) [19,20].
On a daily basis, the model output for storm surge tends to verify well and no forecaster intervention is needed. During potentially high-impact events, such as nor’easters, the model storm surge guidance tends to be too low and often needs to be adjusted upward by the forecaster, based upon factors such as wind speed and direction, fetch, pressure falls, and past experience. Additionally, wave height is incorporated into the forecast process in order to address impacts from wave action such as erosion, overwash, and structural damage. Model guidance for wave height forecasts includes the Western North Atlantic (WNA) and the National Blend of Models (NBM) [21]. As with the storm surge models, the output tends to verify well on a day-to-day basis; however, it can be as much as 25 percent too low during significant events, necessitating forecaster intervention. This is particularly crucial in east or northeast flow situations that impact the eastern Massachusetts coastline.
For Provincetown, its location and orientation present unique forecasting challenges and opportunities for forecasters to add value to model guidance. While model wave height guidance is often reasonable in Cape Cod Bay, it often requires manual adjustment upward near the “hook” of Provincetown because the coarse 2.5 km resolution does not adequately represent higher wave heights closer to the coastline. Similarly, storm surge guidance often needs to be adjusted upward. Recent flooding events in December 2023 and January 2024, which occurred during prevailing southeast winds, displayed a similar bias.

2.2. Storm Tide Pathway Mapping

For this work, storm tide pathways (STPs) were defined as surface locations that provide a direct hydraulic connection between coastal waters and low-lying inland areas. Some examples of pathways in the built environment include the following: low spots along roads, walkways, vertical seawalls or dikes, and/or other structures; other low-lying infrastructure can also act as conduits (e.g., storm water systems, sanitary sewers, conduits for electricity or other utilities); and finally low areas in natural topography (e.g., swales, earthen berms, barrier beaches, and coastal dune systems that are vulnerable to erosion and breaching). The approach to identify and map STPs was developed by CCS in 2014–2015 [22] and first discussed in a series of technical reports prepared by CCS for local, county, and state management entities between 2016 and 2024 [22,23,24]. Between 2016 and 2017, a report was prepared discussing how STP mapping could be combined with the real-time total water level forecasts developed by the NWS Weather Forecast Office in Boston/Norton, Massachusetts in a pilot study for the town of Provincetown, MA funded by the Massachusetts Office of Coastal Zone Management (CZM) [25].
Storm tide pathways are mapped in a four-step process. First, a datum-referenced tidal profile that includes previous storm flooding histories is developed for the area. Second, research is conducted to identify the best sources of available spatial data. Typically, the most recent lidar data are preferred due to their high resolution, accuracy, and synoptic coverage. However, various data sets must be evaluated as the most recent lidar data is not always the most representative or best suited for conditions at the time of mapping due to the dynamic nature of the coast. Third, a desktop GIS-based analysis is conducted to identify potential storm type pathways in the study area prior to beginning fieldwork. Finally, the location of all STPs is verified in the field, adjusted as necessary, and the final location surveyed with a Real-Time-Kinematic GPS (RTK-GPS) instrument.
The development of a datum-referenced tidal profile that characterizes average tidal heights, nuisance flooding, and storm tides forms the basis for identifying and mapping STPs. In addition to the common tidal datums of mean high water springs (MHWS), mean higher high water (MHHW), mean high water (MHW), and mean sea level (MSL), the STP tidal profile includes datum-referenced storm tides of past coastal storm events, including the elevation of the maximum storm tide experienced for the area (i.e., the project storm of record—PSOR). To accommodate sea level rise projections, STP mapping is extended to an elevation 0.91 m (3 ft) above the PSOR. In this way, coastal communities are provided with information that reflects future sea level rise for at least 30 years, a typical planning horizon for many municipalities.
To facilitate historical and contemporary flooding comparisons, all elevations are referenced to the North American Vertical Datum of 1988 (NAVD88) for the 1983–2001 National Tidal Datum Epoch (NTDE). Horizontal positions are referenced to the North American Datum of 1983 (NAD83). For consistency in reporting, NTDE values for tidal stations are updated by NOAA approximately every 25 years [26]. The completed tidal profile and PSOR form the basis for defining the vertical extent of the mapping of storm tide pathways. For this project, analysis and mapping begin at the highest predicted (astronomical) high tide of the year and continue in 0.15 m (0.5 ft) increments to approximately 0.91 m (3 ft) above the storm of record.
While lidar surveys have emerged as a source of cost-effective, three-dimensional coastal geospatial data, with typical horizontal and vertical accuracies of 0.5–1.0 m and 0.15–0.30 m, respectively. Lidar alone does not always accommodate the desired finer temporal and spatial scales to support short-term planning efforts. Notwithstanding the improved resolution; however, the analysis must necessarily be informed by the documented accuracy of the lidar data and, at a minimum, the increment used for any inundation assessment should not be smaller than the range of statistical uncertainty of the elevation data. This base level information: however, when supplemented with point- and area-specific high-resolution elevation data, such as that obtained through RTK-GPS field surveys, can be used to identify reliable STP locations.
The goal of the desktop analysis is to develop an initial working database of potential STPs. This preliminary compilation is used to identify the location and elevation of each potential STP for verification in the field and, if warranted, subsequent incorporation into a final STP spatial database. Lidar data, downloaded in a raster format, are brought into ESRI’s ArcGIS to facilitate data analysis and archiving. These lidar tiles are then brought into QPS’s Fledermaus data visualization software for initial STP screening. Fledermaus works quickly with very large data files and moves rapidly through the data for visual inspection, “fly-throughs” and similar functions. Horizontal planes representing incrementally higher flood levels are created and used to identify the corresponding potential STP elevation. These planes are added to a Fledermaus project or “scene”, forming the basis for the initial STP identification.
Another feature of this data visualization software is the ability to drape 2-dimensional data, such as vertical aerial photographs, over a 3D data set (lidar). This allows the analyst to better document the STP and acquire information about the substrate on which the STP is located and its landscape setting. For example, STPs located on or near ephemeral coastal features, such as sandy beaches or dunes, are characterized differently than those on a concrete wall or other relatively static features. In addition to providing managers with information on how to address individual STPs, these characterizations also inform the field team to more closely examine areas that are naturally evolving and to inspect the area for potential emerging STPs that might not have appeared in the now dated lidar. The ability to drape aerial photography is extremely helpful for planning and conducting the GPS fieldwork, serving as a quick means of orientation, and placing the potential STP in its broader geographic context.
After desktop analysis all potential STPs are incorporated into a GIS database and are uploaded into the GPS. The stakeout function is used along with aerial photographs to facilitate the navigation to the location identified using the lidar data. Each potential STP and the surrounding area is inspected by the field crew and the final location of the STP is occupied with the RTK-GPS instrument. RTK-GPS data are collected at every potential STP for three purposes: (1) to evaluate the real-world location of the STP previously identified in desktop analysis; (2) to document the precise location of the STP identified by field observation; and (3) to validate the positional accuracy of the lidar data.
A Trimble® (Westminster, CO, USA) GNSS receiver utilizing RTK-GPS is used for all positioning fieldwork. CCS subscribes to a proprietary Virtual Reference Station (VRS) network (KeyNetGPS). This network provides access to virtual base stations via cellphone throughout the study area. This enables the field crew to collect RTK-GPS without a terrestrial base station streamlining the field effort and increasing fieldwork efficiency. As shown in Borrelli et al. [27], the average uncertainty using this system showed a root-mean-square error (RMSE) of 0.028 m horizontally and 0.024 m vertically.
STP locations documented in the field that were not identified during initial desktop analysis are added to the project database where necessary. In addition to horizontal and vertical position information, all STPs, where possible, are assigned substrate information and geographic labels for context, photographs and other pertinent information are also included into a database. Once QA/QC has been performed the database is imported into the project GIS serving as an interactive archive of final STP information. Critically, the database is annotated to document locations where the lidar data correlated poorly with current conditions or real-world positions as determined in the field.
The final STP database is brought into ESRI’s ArcGIS. This provides an updateable and interactive archive for local managers to identify and prioritize STPs prior to storm events; prepare for an approaching storm; and/or plan for longer-term improvements to minimize vulnerabilities.
To increase the utility of STP data, inundation planes are also created for local managers to facilitate data visualizations. Although floodplain mapping is not the goal of the project, the planes can be used to clearly visualize STPs in a useful manner while acknowledging the uncertainty associated with the lidar. The lowest plane typically reflects the approximate elevation of the mean high water spring tide (MHWS) for the study area. Planes are then developed in 15.42 cm (0.5 ft) intervals for each range to a maximum elevation represented by the PSOR plus approximately 0.91 m (3 ft).
Points determined to be inaccessible by the field crews are labeled as an unverified STP, indicating the potential STP identified in the desktop analysis was not located due to circumstances (e.g., private property). During fieldwork no data was collected on private property. Similarly, points are labeled as unverified where no GPS signal is available (e.g., beneath substantial tree cover). Due to the nature of the coastal landscape, STPs located on dynamic landforms, such as coastal dunes or barrier beaches, are also labeled as unverified to reflect the ephemeral nature of these locations. Therefore, unverified STPs located on rapidly changing natural landforms are intended to be a guide to local managers that require periodic monitoring and updating to properly assess the evolving risk in those locations.

3. Results

3.1. The Storm of 4 January 2018

The extra-tropical cyclone, or nor’easter, that impacted southern New England on 4 January 2018 occurred during a period of perigean spring tides which peaked on 1–2 January. The highest total water level recorded at the Boston tide gauge (NOAA station 8443970), the primary tidal station for the Massachusetts coast north of Cape Cod since it was installed 3 May 1921, was 2.94 m (NAVD88) occurring at 1242 (LST) on 4 January 2018 [28]. The previous storm of record was the Blizzard of 1978, with a total water level of 0.88 m (2.90 ft) (NAVD88) at the Boston tide gage (Table 1).
The United States Geological Survey (USGS) installed a tide gauge in Provincetown Harbor (420259070105600) in December of 2014. During the 2018 nor’easter, the total water level at the gauge was 0.91 m (2.98 ft) (NAVD88) at approximately 1245 (LST), 0.33 m higher than the Boston gauge [28]. It should be noted that the NOAA tide gauge in Boston records water levels every 6 min, while the USGS tide gage records water levels every 15 min. Observations of water height during the Blizzard of 1978, which peaked on 07 February, were also collected within Provincetown Harbor every 15 min between 0903 and 1148 (LST) with the high tide peaking between 1031 and 1051 (LST) and the highest recorded TWL level reaching 2.85 m (NAVD88) [29].

3.2. The Storm of 4 January 2018 and Total Water Level Forecasts

The storm, a significant Northeast Blizzard, produced moderate to major coastal flooding along the east coast of Massachusetts during the early afternoon high tide on 04 January 2018. As is typical with most extra-tropical storms, model storm surge guidance verified too low during this event. The ETSS model, which has built in bias correction, performed much better that STOFS but its storm surge was about 0.15 m (0.5 ft) too low for most coastal locations. P-ETSS data was not available. Both models did trend higher with each model cycle leading up to the storm which indicated a significant flood event was becoming more likely. P-ETSS data was not available during this event and at the time, and WFO forecasters did not have access to SFAS guidance in real time for this event, but in hindsight the guidance performed exceptionally well and was by far the most accurate among the guidance sources indicating a storm surge of 0.91–1.07 m (3.0 to 3.5 ft). Forecasters recognized the potential several days in advance and were able to adjust the ETSS storm surge guidance upward based upon the expected strengthening of the storm (a pressure fall of 31 hPa in atmospheric pressure corresponds to a 0.91 m (1 ft) rise in water level), persistent northeast winds which resulted in a long overwater fetch, and wind speed. Despite this adjustment, however, forecasts still verified as much as 0.30 m (1 ft) too low.
Likewise, WNA wave model guidance was too low and needed forecaster intervention. Wave height values off the coast of eastern Massachusetts were adjusted upward by as much as 25 percent, leading to offshore wave height forecasts of 4.5 to 6.0 m (15–20 ft), which verified well. These higher seas produced rough surf along the ocean-exposed coastline and resulted in significant beach erosion and some structural damage.
Forecasts for Provincetown followed a similar theme. In the days leading up to the storm, initial forecasts were only for a surge of up to 0.50 m (1.6 ft) and minor flood impacts. These predictions steadily trended upward, with the final forecast issued on the morning of 04 January indicating a 0.75 m (2.5 ft) surge and moderate to major flood impacts, with a total water level near 4.5 m (15 ft) MLLW. The tide gauge peaked at 4.69 m (15.4 ft) MLLW with a storm surge of nearly 1.16 m occurring approximately at the time of the predicted high water. The under-forecasting of water levels and related impacts were largely due to the extremely rapid drop in pressure as the storm passed by Massachusetts. This produced a higher storm surge than would normally be expected in these types of situations.

3.3. Mapping Storm Tide Pathways in Provincetown, MA

Existing benchmarks for Provincetown Harbor (NOAA CO-OPS tidal station #8446121) were recovered and occupied with an RTK-GPS and referenced vertically to the North American Vertical Datum of 1988 (NAVD88). On 05 March 2010 tidal station #8446121 was established in Provincetown Harbor. Tidal datums referenced to the station datum and reported on the NOAA CO-OPS website (tidesandcurrents.noaa.gov), were converted to NAVD88 for reference throughout the project. Contemporary tidal datums for Provincetown compare closely with those for Boston Harbor (Figure 4).
In 2015, the maximum storm tide elevation recorded for Provincetown was the Blizzard of 1978, and this water level plus 0.91 m (3 ft) was used to determine the upper limit of STP analysis (Table 2). Although total water levels associated with subsequent storm tides have exceeded the Blizzard of 1978, they fall well below the upper limit of the 1978 TWL plus 0.91 m (3 ft). To evaluate potential nuisance flooding associated with more frequent non-storm tide events, the lowest elevation considered in the STP analysis began approximately 0.30 m (1 ft) above mean spring tide high water (1.96 m (6.44 ft) NAVD88 or 0.55 (1.8 ft) above MHHW). A review of the NOAA tide tables for Provincetown Harbor indicated that the maximum astronomical high water predicted for 2015 was 1.96 m (6.44 ft) NAVD88.
The terrestrial lidar used for the desktop analysis was collected by the United States Geological Survey (USGS) 2 years prior to the commencement of this study. These data were downloaded in meters from the NOAA website (https://coast.noaa.gov/digitalcoast/, accessed on 13 July 2024) default website settings for horizontal (NAD83) and vertical (NAVD88) reference datums were used. Final data products for the project are reported in feet referenced to NAVD88 (a geodetic datum) and to the MLLW (the local tidal datum) to facilitate use with local tide tables, area navigation charts, and the NWS website.
Metadata for the lidar data report a horizontal accuracy of 0.42 m at 95% confidence level. The data have a Consolidated Vertical Accuracy (CVA) of 0.189 m at 95% confidence level. Vertical accuracy values range from a low of 0.096 m over “Bare-Earth” up to 0.257 m over “Urban Land Cover” depending on ground cover and use.
Post processing of lidar collected via aerial surveys can introduce uncertainties that exaggerate or diminish features in three-dimensional data and, as a result, can obscure or conflate the presence and scale of a storm tide pathway. These effects have been shown to be associated with “bare earth” models where elevations tend to be “pulled up” adjacent to areas where buildings have been removed and “pulled down” in areas where bridges and roads cross streams or valleys (Figure 5). Pull downs typically draw the attention of the investigator as they are potential storm tide pathways. They are often “false positives” and are removed from the final data set. However, pull ups can be more problematic. In locations where there are low-lying areas with adjacent structures or features, storm tide pathways can be missed. This effect is much more prevalent with human-made structures as the methods of interpolation used to create lidar surfaces typically attempt to mimic natural surfaces.
The desktop analysis yielded 81 potential STPs. During the fieldwork, 15 STPs were rejected leaving 66 STPs. The final location of 22 STPs (33%) identified during the desktop analysis using the lidar were moved more than 1 m horizontally during field surveys. In addition, six (6) new STPs not found during the desktop analysis were added, resulting in a final set of 72 STPs.

4. Discussion

The ability of coastal managers to use geospatial products to help inform local community leaders and residents about the threats of coastal hazards associated with storm flooding and sea level rise continues to be limited severely by the lack of regional scale topography with high-quality vertical resolution [30]. For example, Flood Insurance Rate Maps (FIRMS), produced by the Federal Emergency Management Agency (FEMA), are standard resources for coastal communities, but these maps were intended to facilitate the determination of flood insurance rates, and lack the detail and updated information for local planning efforts. FIRMS typically depict the horizontal extent of 100-year storm flooding on maps at scales of 1″ = 400′ or 1″ = 500′, with limited planimetric features. In the absence of datum-referenced, site-specific topographic surveys or high-resolution vertical data, depiction of 100-year storm and sea level rise inundation scenarios historically have not been an effective means of communicating coastal hazard vulnerabilities.
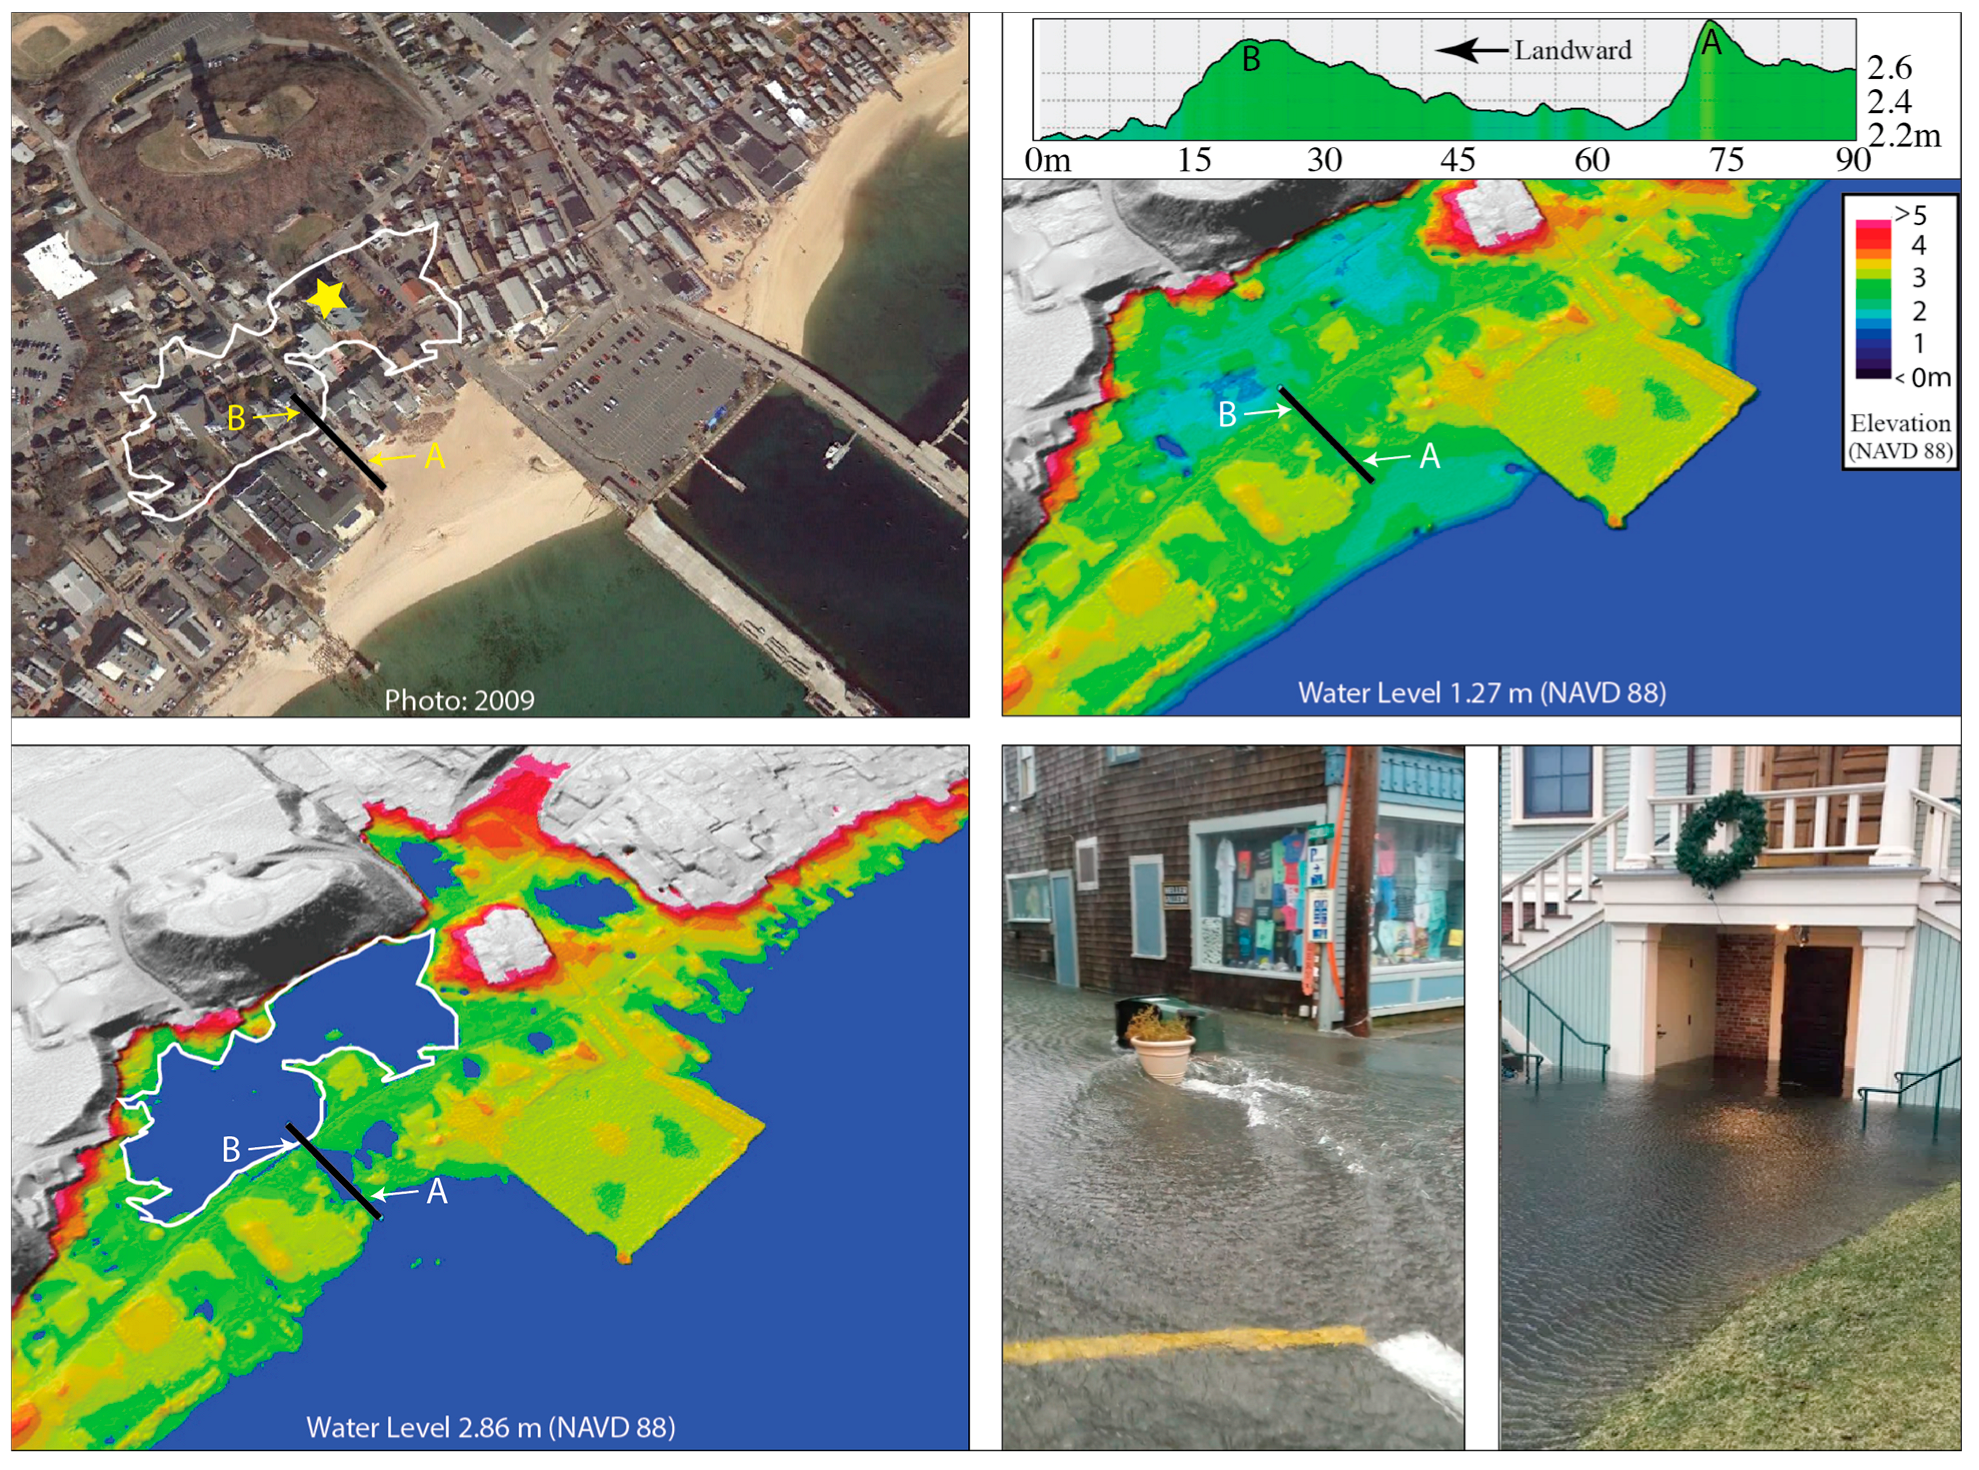
As discussed above, lidar data, although increasing in availability with greater resolution and improved uncertainties, can be greatly enhanced with extensive fieldwork and ground validation. Given the nature of these data products and the areas they capture, problems can arise using only these data supplemented with rudimentary field surveys. This problem is exacerbated by the possibility of missing low-lying areas that could inundate adjacent areas. In fact, this work has shown that one or two STPs could lead to widespread inundation (Figure 6).
The coupling of real-time TWL modeling with the mapping of storm tide pathways can provide reliable and actionable information. Further, local knowledge can serve as a third component that reduces the likelihood of missing critical areas or changes over time. The NWS continues to upgrade the models with more data from the field including more meteorological and oceanographic information. Partnerships with universities and community groups have led to the installation of lower-cost tide gauges along the Massachusetts coastline, allowing for the expansion of NWS Total Water Level forecasts and STP mapping. These tide gauges are installed above the water line on docks or other structures and utilize solar power and cellphone technology to report data.
The mapping of Provincetown STPs identified four (4) pathways that are less than 30.5 cm (12 inches) above the PSOR. Located slightly above the PSOR, these locations provide important information to local managers, public works professionals, and first-responders, as there is no record of them having flooded in the past. With rising sea levels and more intense coastal storms, these areas are increasingly likely to flood. With these data, such areas can be addressed proactively, and protocols can be established to handle inundation.
Coastal communities are typically located in areas of low to moderate relief where small changes in TWL forecasts can result in extensive flooding. For example, a 15.2 cm (6-inch) increase in TWL above the PSOR 4.72–4.87 m (15.5–16.0 ft) in MLLW, will result in an additional 30 ha (69 ac.) being inundated in Provincetown. Prior to the completion of the STP mapping efforts, town staff had little information as to where the flood waters would begin to flow and thus could not proactively prepare for storm-related flooding as efficiently. Inundation maps typically focus on the extent of flooding rather than the pathways the water would take to flood those areas. Another 15.2 cm (6-inch) in TWL, from 4.87 to 5.03 m (16.0–16.5 ft) in MLLW in the study area, will see an additional 117.8 ha (291.2 ac.) being flooded. In total, a 0.91 m (1 ft) increase in TWL above the PSOR will inundate an additional 148 ha (360.2 ac.).
Although the 2.5 km resolution of the TWL projections can be too coarse to direct storm preparations on a street-by-street basis, STPs have proven useful in directing responses and implementing temporary mitigation measures until storms have subsided. In Provincetown, town staff regularly check the NWS projections for approaching storms so that when action level threats are predicted, resources can be allocated and staged based on STP maps and GIS data provided with the technical reports, including earth-moving equipment to build temporary earthen berms, sandbags, and portable flood barriers, prior to the arrival of the storm.
The utility of the STP maps is based on the best available location data. The use of the most accurate and most current lidar for the desktop analysis greatly facilitates the identification of potential STPs; however, based on reported uncertainties, field verification is necessary to provide reliable data that can be used by emergency managers to respond confidently to approaching coastal storms and to address longer-term mitigation efforts.
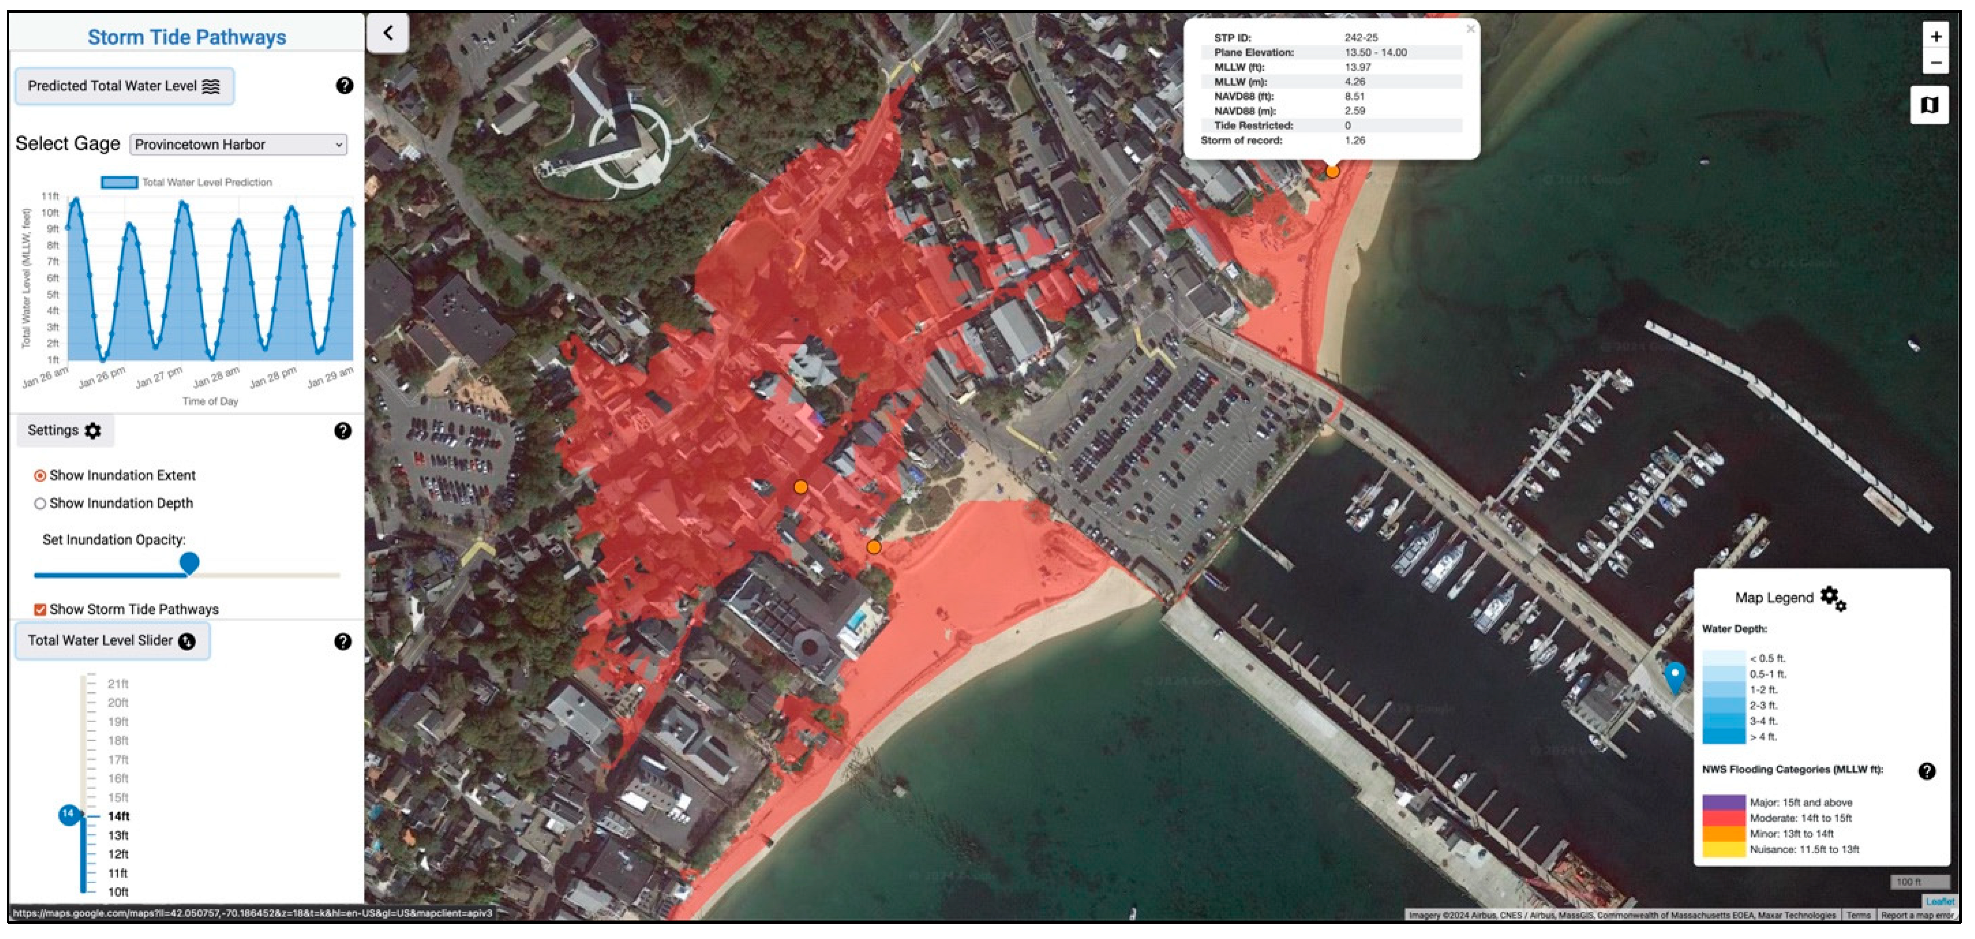
In 2017, the GIS data were also provided to NWS for use on their website to depict the extent of coastal inundation for TWL storm projections. Staff from local municipalities reported increased interaction with the data due to the website. This led to CCS developing an intuitive, publicly accessible website (www.stormtides.org) in 2021–2022, designed to help local managers and the public prepare for approaching coastal storms (Figure 7). After the website was made publicly available, CCS developed and presented in-person and remote training sessions for local managers.

Storm Tide Pathways and National Weather Service Storm Surge Predictions

The STP mapping approach was developed to provide highly reliable coastal flooding data in a format that can be used directly by local communities to prepare short- and long-term responses to approaching storms. As coastal municipalities pursue a more comprehensive approach for confronting local challenges related to sea level rise and climate change, data is visualized to provide information that allows town staff, emergency responders, and the public to make decisions without the need for specialized software or a technical background.
STP mapping is designed to provide cost-effective high-resolution maps with the lowest possible uncertainty. Generally, the reliability of probabilistic coastal flood projections is dependent on the uncertainty often associated with hydrodynamic storm surge models, future sea-level rise estimates, and topographic digital elevation models [31]. As an elevation-based mapping product, the accuracy of storm tide pathway locations and associated data is independent of numerical models, sea level rise projections, and statistical probabilities. When combined with the modeling expertise and professional judgment associated with storm surge projections from the National Weather Service, which has a record of minimizing model uncertainties, the use of storm tide pathways data (www.stormtides.org) by Cape Cod Bay communities has proven to be an effective tool for responding to increasingly common, intense coastal storms.
Where information is available, the NWS associates its estimates of total water level with qualitative descriptions of the potential impacts to help communicate threat levels associated with approaching storms. Organized by elevation the descriptions are related to development characteristics, referenced to local MLLW, and suggest action levels for coastal communities to prepare for approaching coastal storms. The action levels are summarized as follows:
  • Action Stage: In preparation for a projected coastal storm tide some mitigation action should be considered.
  • Minor Flooding Stage: Some public threat is anticipated, including but not limited to, minor flooding of low-lying roads and infrastructure. Minimal or no property damage is expected.
  • Moderate Flooding Stage: Some anticipated inundation of roads and structures. Possible evacuation of some people and/or transfer of property to higher elevations.
  • Major Flooding Stage: Extensive inundation of structures, properties, and roads anticipated and significant evacuation of people to higher elevations.
Table 3 summarizes current NWS Action Levels for Provincetown. Here NWS describes three elevation-based flooding stages that reflect increasing threats to landside infrastructure. As a system based on tidal datum elevations, describing the level and location at which storm tides begin to flow, STPs can be correlated with NWS descriptive flood stages. Therefore, STPs are referenced to MLLW and NAVD88 and color-coded to correspond to action levels of the NWS. These descriptions can be expanded and supplemented as needed with additional detailed local knowledge and information based on the observations of first-responders, municipal emergency managers, and the public.
As coastal storm systems approach, coastal communities can use the TWL projections of the NWS and the STP data of CCS to better prepare and respond to the approaching coastal storms. Continued NWS refinement and improvement of coastal storm models and CCS STP mapping have contributed to the reduction in the uncertainties associated with traditional storm preparation efforts in Provincetown.
By coupling the coarse-scale, real-time TWL model with the fine-scale STP mapping users can access the NWS model in real-time while zooming into any area of interest on the stormtides.org website. The sources of uncertainty for STP mapping have been reduced to only two data sets. The first is the available DEM data layer, in this case lidar. However, the primary input is the field-based, RTK-GPS data which have the lowest uncertainty values for absolute localization.
Though some have found that sea level rise maps have reduced concern among those in affected areas [32], this has not been our experience. In fact, it has been the opposite. After showing the high-resolution maps of storm tide pathways to local managers, residents and first-responders many groups have acted. Local first-responders have begun to develop a reverse 911 system based on the STP mapping to warn the public, if needed, to use evacuation routes mapped as passable for the projected TWL associated with an approaching storm. Several towns have eliminated existing STPs based solely on the mapping for this project such that they will need to be removed during updates to their respective maps.
While the NWS/CCS method described above has improved coastal storm responsiveness, limitations still exist. STPs in flat coastal areas are inherently more difficult to map than in areas exhibiting greater relief [33]. STPs are also difficult to map using the best available remotely sensed data, <1 m grid cell. For this reasons, fieldwork, often costly labor- and time-intensive, is necessary to depict reliable mapping of the elevation sensitive spatial data.
Additionally, recognizing that coastal areas are extremely dynamic environments, maps can quickly become obsolete. Located in this constantly changing coastal setting, STPs can be eliminated by natural means such as the growth of coastal dunes, the deposition of sediment or other similar phenomena; or by anthropogenic actions undertaken to address previously identified STPs. Conversely, new STPs can develop naturally in response to erosion, rising sea levels and increasingly intense storms. Similarly, new STPs can emerge in response to anthropogenic alterations such as erosional end effects associated with coastal structures or poorly planned infrastructure projects such as the elevation of waterfront structures without consideration of adjacent parcels.

5. Conclusions

The ability of modelers and scientists to present information related to unpredictable, episodic events such as coastal storms, to managers, stakeholders, and the public is an important component of emergency management where communicating the nature and extent of coastal storm flooding hazards can help to minimize risks to people, property, infrastructure, and other coastal resources. Real-time forecasts of TWL with location-specific details throughout the Action level descriptions, such as street and/or neighborhood names, provides local communities with a better understanding of risks, allowing them to prepare for an event and minimize impacts. The mapping of storm tide pathways was designed to work with NWS TWL projections to visualize and increase the reliability and utility of coastal storm flooding projections. The location of verified STP locations combined with increasingly reliable TWL projections provide an alternative approach to risk-based, probabilistic models.

Author Contributions

Conceptualization, J.D., M.B., S.T.M., S.M.; methodology, J.D., M.B., S.T.M., S.M.; software, J.D., M.B.; validation, J.D., M.B., S.T.M.; formal analysis, J.D., M.B., S.T.M., S.M.; investigation, J.D., M.B., S.T.M.; resources, J.D., M.B., S.T.M.; data curation, J.D., M.B., S.T.M.; writing—original draft preparation, J.D., M.B., S.T.M.; writing—review and editing, J.D., M.B., S.T.M., S.M.; visualization, J.D., M.B., S.T.M.; supervision, J.D., M.B., S.T.M.; project administration, J.D., M.B., S.T.M., S.M.; funding acquisition, M.B., S.T.M. All authors have read and agreed to the published version of the manuscript.

Funding

This research was funded by the Massachusetts Office of Coastal Zone Management through their Coastal Resiliency Grant Program (ENV17-CZM 03).

Data Availability Statement

Data from this project is available upon request to the Massachusetts Office of Coastal Zone Management (https://www.mass.gov/orgs/massachusetts-office-of-coastal-zone-management-czm, accessed on 13 July 2024).

Acknowledgments

We thank the Massachusetts Office of Coastal Zone Management’s Coastal Resilience Grant Program for funding. We also thank Robert Thompson and Andrew Nash from NWS-Boston for supporting this work, and Eric Allen, and Jeff Waldstreicher from the NWS for helpful comments that greatly improved this manuscript. We would like to thank Sean O’Brien from the Barnstable County Department of Health and Environment, Shannon Hulst, from Barnstable County, Woods Hole Sea Grant and Cape Cod Cooperative Extension and staff from the town of Provincetown including Tim Famulare, Rex McKinsey and Richard Waldo.

Conflicts of Interest

The authors declare no conflicts of interest. The funders had no role in the design of the study; in the collection, analyses, or interpretation of data; in the writing of the manuscript; or in the decision to publish the results.

References

  1. Oppenheimer, M.; Glavovic, B.; Hinkel, J.; Roderik, V.; Magnan, A.; Abd-Elgawad, A.; Rongshu, C.; Cifuentes, M.; Robert, D.; Ghosh, T.; et al. Sea Level Rise and Implications for Low Lying Islands, Coasts and Communities; Cambridge University Press: Cambridge, UK, 2019; pp. 321–445. [Google Scholar]
  2. Mayo, T.L.; Lin, N. Climate change impacts to the coastal flood hazard in the northeastern United States. Weather Clim. Extrem. 2022, 36, 100453. [Google Scholar] [CrossRef]
  3. Mague, S.T.; Foster, R.W. Where’s the Shoreline? Sources of Historical High Water Lines Developed in the Context of Massachusetts Coastal Regulations. Int. Fed. Surv. 2008, 2, 1–18. [Google Scholar]
  4. Kirshen, P.; Watson, C.; Douglas, E.; Gontz, A.; Lee, J.; Tian, Y. Coastal flooding in the Northeastern United States due to climate change. Mitig. Adapt. Strateg. Glob. Change 2007, 13, 437–451. [Google Scholar] [CrossRef]
  5. Pershing, A.J.; Alexander, M.A.; Hernandez, C.M.; Kerr, L.A.; Le Bris, A.; Mills, K.E.; Nye, J.A.; Record, N.R.; Scannell, H.A.; Scott, J.D. Slow adaptation in the face of rapid warming leads to collapse of the Gulf of Maine cod fishery. Science 2015, 350, 809–812. [Google Scholar] [CrossRef] [PubMed]
  6. Marsooli, R.; Lin, N.; Emanuel, K.; Feng, K. Climate change exacerbates hurricane flood hazards along US Atlantic and Gulf Coasts in spatially varying patterns. Nat. Commun. 2019, 10, 3785. [Google Scholar] [CrossRef] [PubMed]
  7. NOAA. Center for Operational Oceanographic Products and Services (CO-OPS). Available online: https://tidesandcurrents.noaa.gov (accessed on 12 December 2023).
  8. Sweet, W.; Park, J.; Marra, J.; Zervas, C.; Gill, S. Sea Level Rise and Nuisance Flood Frequency Changes around the United States; National Oceanic and Atmospheric Administration: Silver Spring, MD, USA, 2014; p. 66. [Google Scholar]
  9. Sweet, W.; Simon, S.; Dusek, G.; Marcy, D.; Brooks, W.; Pendleton, M.; Marra, J. 2021 State of High Tide Flooding and Annual Outlook; National Oceanic and Atmospheric Administration: Silver Spring, MD, USA, 2021. [Google Scholar]
  10. NOAA. NOAA’s Office for Coastal Management. Available online: https://coast.noaa.gov/ (accessed on 12 December 2023).
  11. USBLS. Jobs & Wages (BLS) for Barnstable County, MA. U.S. Bureau of Labor Statistics. Available online: www.statsamerica.org/USCP/default.aspx?geo_id=25001 (accessed on 2 February 2023).
  12. NOAA. Data for Barnstable County. Economics: National Ocean Watch Dataset. Available online: https://coast.noaa.gov/digitalcoast/tools/enow.html (accessed on 12 December 2023).
  13. MA DLS. Massachusetts Division of Local Services. Available online: https://www.mass.gov (accessed on 12 December 2023).
  14. Stephens, S.H.; DeLorme, D.E.; Hagen, S.C. An Analysis of the Narrative-Building Features of Interactive Sea Level Rise Viewers. Sci. Commun. 2014, 36, 675–705. [Google Scholar] [CrossRef]
  15. Kumar, V.; Sharma, K.; Caloiero, T.; Mehta, D.; Singh, K. Comprehensive Overview of Flood Modeling Approaches: A Review of Recent Advances. Hydrology 2023, 10, 141. [Google Scholar] [CrossRef]
  16. Uchupi, E.; Giese, G.S.; Aubrey, D.G.; Kim, D.J. The late quaternary construction of Cape Cod, Massachusetts: A reconsideration of the WM Davis model. Geol. Soc. Am. Spec. Pap. 1996, 309, 1–69. [Google Scholar]
  17. Kim, S.C.; Chen, J.; Shaffer, W.A. An Operational Forecast Model for Extratropical Storm Surges along the U.S. East Coast. In Preprints Conference on Coastal Oceanic and Atmospheric Prediction, Proceedings of the 76th American Meteorological Society’s Annual Meeting, Atlanta, GA, USA, 28 January–2 February 1996; American Meteorological Society (AMS): Boston, MA, USA; pp. 281–286.
  18. Liu, H.; Taylor, A.; Spring, M. Development of the NWS’ probabilistic extra-tropical storm surge model and post processing methodology. In Proceedings of the 98th AMS Annual Meeting, Austin, TX, USA, 7–11 January 2018; pp. 7–11. [Google Scholar]
  19. Allen, E.A.; Hogan, L.G. Collaborative Innovations in Coastal Flood Forecasting: NWS Eastern Region’s Total Water Level Program and Partnerships with the Modeling Community. In Proceedings of the 104th Annual Meeting of the American Meteorological Society, Baltimore, MD, USA, 28 January–1 February 2024; Available online: https://ams.confex.com/ams/104ANNUAL/meetingapp.cgi/Paper/429364 (accessed on 3 March 2024).
  20. Hogan, L.G. From Prototype to Operational Decision Support Services—Five Years of Coastal Total Water Level Forecasting in Eastern Region of the National Weather Service. In Proceedings of the 104th Annual Meeting of the American Meteorological Society, Baltimore, MD, USA, 28 January–1 February 2024; Available online: https://ams.confex.com/ams/104ANNUAL/meetingapp.cgi/Paper/428922 (accessed on 3 March 2024).
  21. Craven, J.P.; Rudack, D.E.; Shafer, P.E. National Blend of Models: A statistically post-processed multi-model ensemble. J. Oper. Meteor. 2020, 8, 1–14. [Google Scholar] [CrossRef]
  22. Borrelli, M.; Mague, S.T.; Smith, T.L. A New Method of Providing Communities With High-Resolution Maps of Present and Future Inundation Pathways: Two Examples From Massachusetts. In AGU Fall Meeting Abstracts. V. 2015, Proceedings of the AGU Fall Meeting, San Francisco, CA, USA, 14–18 December 2015; PA41A-2166; American Geophysical Union (AGU): Washington, DC, USA, 2015. [Google Scholar]
  23. Borrelli, M.; Mague, S.T.; Smith, T.L.; Legare, B. A New Method for Mapping Inundation Pathways to Increase Coastal Resiliency, Provincetown Massachusetts; Technical Report Prepared for the Town of Truro, MA; Center for Coastal Studies: Provincetown, MA, USA, 2016; p. 29. [Google Scholar]
  24. Borrelli, M.; Mague, S.T.; Legare, B.J.; McCormack, B.; McFarland, S.J.; Solazzo, D. Mapping Storm Tide Pathways in Cape Cod Bay, Massachusetts; Technical Report Prepared for the Cape Cod Cooperative Extension 21-CL-05; Center for Coastal Studies: Provincetown, MA, USA, 2021; p. 73. [Google Scholar]
  25. Borrelli, M.; Mague, S.T.; Legare, B.; Smith, T.L. Mapping Inundation Pathways to Provide Communities with Real-Time Coastal Flood Forecasts: A Pilot Project with the National Weather Service; Technical Report Prepared for the Town of Truro, MA; Center for Coastal Studies: Provincetown, MA, USA, 2017; p. 32. [Google Scholar]
  26. Evans, D.; Lautenbacher, C.C.; Spinrad, R.W.; Szabados, M. Computational Techniques for Tidal Datums Handbook; NOAA Special Publication NOS CO-OPS; National Oceanic and Atmospheric Administration: Silver Spring, MD, USA, 2003; p. 2. [Google Scholar]
  27. Borrelli, M.; Smith, T.L.; Mague, S.T. Vessel-Based, Shallow Water Mapping with a Phase-Measuring Sidescan Sonar. Estuaries Coasts 2021, 45, 961–979. [Google Scholar] [CrossRef]
  28. Bent, G.C.; Taylor, N.J. Total Water Level Data from the January and March 2018 Nor’easters for Coastal Areas of New England; 2020-5048; U.S. Geological Survey: Reston, VA, USA, 2020; p. 47. [Google Scholar]
  29. Giese, G.S. Effects of the Blizzard of 1978 on the Coastline of Cape Cod. In Blizzard of 1978: Its Effects in the Coastal Environments of Southeastern New England; Boston State College: Boston, MA, USA, 1978; p. 5. [Google Scholar]
  30. Titus, J.G.; Richman, C. Maps of lands vulnerable to sea level rise: Modeled elevations along the US Atlantic and Gulf coasts. Clim. Res. 2001, 18, 205–228. [Google Scholar] [CrossRef]
  31. Amante, C.J. Uncertain seas: Probabilistic modeling of future coastal flood zones. Int. J. Geogr. Inf. Sci. 2019, 33, 2188–2217. [Google Scholar] [CrossRef]
  32. Mildenberger, M.; Sahn, A.; Miljanich, C.; Hummel, M.A.; Lubell, M.; Marlon, J.R. Unintended consequences of using maps to communicate sea-level rise. Nat. Sustain. 2024, 7, 1018–1026. [Google Scholar] [CrossRef]
  33. Jafarzadegan, K.; Merwade, V. A DEM-based approach for large-scale floodplain mapping in ungauged watersheds. J. Hydrol. 2017, 550, 650–662. [Google Scholar] [CrossRef]
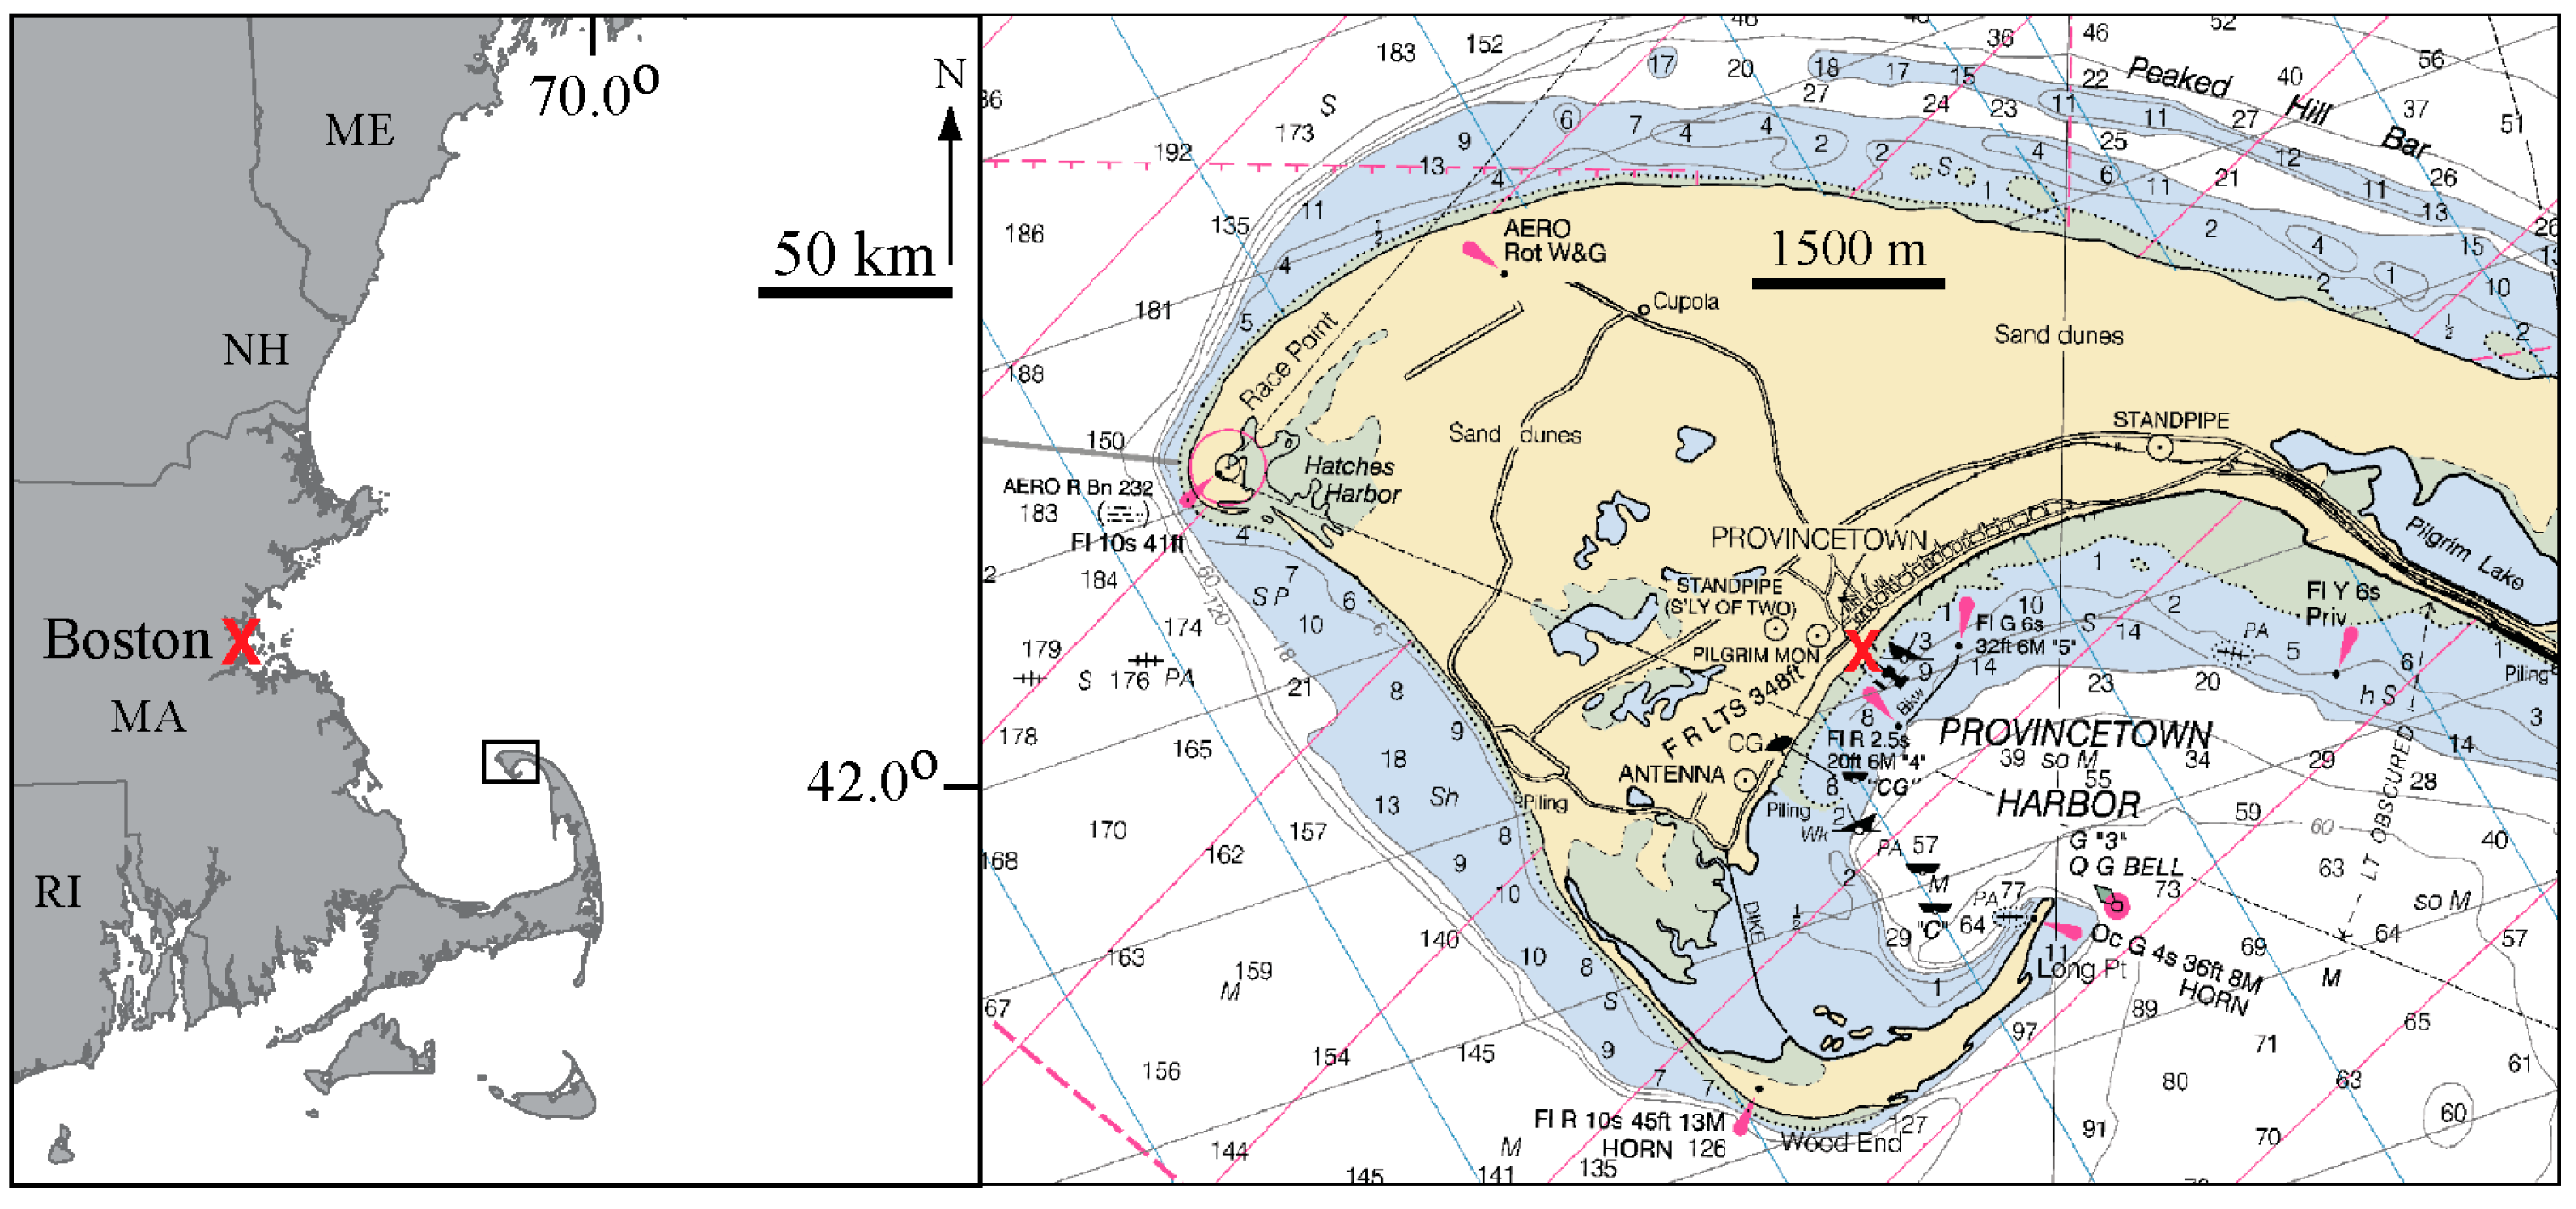
Figure 1. Left: Regional setting, study area denoted by rectangle. “X” is approximate location of NOAA tide gage (Station 8443970) in Boston Harbor. Right: Study area in Provincetown Harbor, Provincetown, MA. “X” is approximate location of USGS tide gage (420259070105600) in Provincetown Harbor.
Coasts 05 00036 g001
Figure 2. Total water level forecast elements. Image captured from the NWS’s Gridded Forecast Editor software (v3.11).
Coasts 05 00036 g002
Figure 3. Populated inputs to the NWS’s Gridded Forecast Editor software.
Coasts 05 00036 g003
Figure 4. Tidal datum profiles for Boston and Provincetown Harbors.
Coasts 05 00036 g004
Figure 5. Inaccuracies in lidar data. Left: A “pull-up” is seen in proximity to a water tower. The dotted line is more representative of elevations surrounding the water tower. The solid line in the image is the location of the profile. Right: A “pull down” is seen in across a bridge. The dotted line is more representative of the elevation of the bridge. Profile units = meters (Vert. NAVD88, Hor. NAD83).
Coasts 05 00036 g005
Figure 6. Upper Left: Draped aerial photograph over lidar surface in downtown Provincetown. White polygon is approximate area of inundated when TWL = 2.85 m. Wharfs seen in aerial photos are not included in lidar data. Upper Right: TWL = 1.27 m, blue areas are horizontal planes created in Fledermaus that depict indicated water levels. Inset is profile generated within Fledermaus with two STPs. Lower Left: TWL = 2.86 m. Water has flowed over both STPs (A and B). Lower Right: Left panel is ocean water flowing over STP (B) during 04 January 2018 storm (video screengrab: Facebook—Ptownie). Right panel (photo: Richard Waldo) shows Provincetown Town Hall (yellow star in upper left) during the storm. The ground floor and basement sustained significant damage.
Coasts 05 00036 g006
Figure 7. Screengrab of stormtides.org website showing downtown Provincetown. Left panel shows options for user including access to real-time TWL from NWS website, ability to show inundation extent or water depth, which is controlled by the TWL slider below. The STP in the upper right shows data when a “mouse-over” is performed. Legend in the lower right. Colors of STPs and inundation extent are tied to the NWS flooding categories of Major, Moderate, Minor and Nuisance.
Coasts 05 00036 g007
Table 1. Comparison of TWL for current and former storms of record for Boston MA (NOAA station 8443970) and Provincetown, MA (USGS Station 420259070105600). All TWL values are in meters, NAVD88.
Tide
Station
Length of
Record
Peak TWL
4 Jan 2018
Peak TWL
7 Feb 1978
Boston, MA1921—present2.942.90
Provincetown, MA2014—present2.982.85
Table 2. Provincetown Harbor Tidal Profile developed for this project. Upper limit of STP analysis, 3.77 m (12.36 ft) (NAVD88) was based on the then Storm of Record, (the Blizzard of 1978) 2.85 m (9.36 ft) plus 0.91 m (3 ft) or 3.77 m (12.36 ft).
Provincetown Harbor Tidal Profile—NOAA Station: 8446121
NAVD88 (ft)NAVD88 (m)MLLW (ft)MLLW (m)Comments
Storm of Record +3 ft12.363.7717.825.43Upper Limit of STP Analysis
Blizzard of 2018 9.772.9815.234.64Storm of Record (current)
Blizzard of 19789.362.8514.824.52Storm of Record (former)
Max. 2015 Predicted Tide6.441.9611.903.632015 NOAA Tide Predictions
MHWS5.541.6911.003.35NOAA Tide Station #8446121
MHHW4.621.4110.083.07NOAA Tide Station #8446121
MHW4.161.279.622.93NOAA Tide Station #8446121
MSL−0.43−0.135.031.53NOAA Tide Station #8446121
MTL−0.48−0.154.981.52NOAA Tide Station #8446121
MLW−5.13−1.560.330.10NOAA Tide Station #8446121
MLLW−5.46−1.660.000.00NOAA Tide Station #8446121
Table 3. Provincetown–Truro NWS Action Levels Elevations are reported in MLLW feet (source: https://water.noaa.gov/gauges/pvhm3, accessed on 13 July 2024).
Elevation
(MLLW, ft)
Action Level
17Major life-threatening flooding occurs in Provincetown and Truro. Provincetown becomes isolated, with inundation along Routes 6 and 6A. Significant inundation occurs in the greater vicinity of Commercial Street and many adjacent side streets. Truro could become bisected with flooding along Route 6 and streets in the greater vicinity of the Pamet River and Little Pamet River marshes. Heed the advice of local officials and evacuate if asked to do so.
16Major coastal flooding occurs in Provincetown and Truro, with Provincetown becoming isolated due to inundation of Routes 6 and 6A. Numerous roads in Provincetown are flooded, including but not limited to large stretches of Commercial Street, Routes 6 and 6A, as well as connecting side streets. Provincetown Airport is completely flooded. In Truro major flooding occurs in the greater vicinity of the Pamet River and Little Pamet River and associated marshland, with inundation along numerous nearby roads.
15Major coastal flooding occurs in Provincetown and Truro. This includes flooding of Provincetown Airport, and inundation along stretches of numerous roads including Routes 6 and 6A, stretches of Commercial Street and nearby side streets. Provincetown may become isolated. In Truro portions of Route 6 and 6A are also flooded, with flooding of roadways including Dechampes Way, Great Hills and Salt Marsh Lanes, and Fisher, Old County, Castle, Great Hills, and Old Pamet Roads.
14Expect Moderate coastal flooding in the vicinity of Provincetown and Truro. In Provincetown, flooding occurs at Provincetown Municipal Airport, Race Point Road, Provincelands Road, and portions of Commercial Street and Route 6A. In Truro flooding occurs in the vicinity of the Pamet River and Parker Marsh, with flooding on several roads including Castle Road, Eagle Neck Road, Phats Valley Road, and Mill Pond Road. Heed the advice of local officials, and evacuate if asked to do so
13Expect Minor coastal flooding of some low-lying roadways. Minor coastal flooding occurs in Provincetown, in the vicinity of Race Point Road and Provincetown Airport. In Truro backwater flooding occurs along the Pamet River.
Disclaimer/Publisher’s Note: The statements, opinions and data contained in all publications are solely those of the individual author(s) and contributor(s) and not of MDPI and/or the editor(s). MDPI and/or the editor(s) disclaim responsibility for any injury to people or property resulting from any ideas, methods, instructions or products referred to in the content.