Article

Regional Controls on Climate and Weather Variability on the Southwest Coast of Peru

1
Physics Department, College of Arts and Sciences, University of Puerto Rico, Mayagüez 00681, Puerto Rico
2
Geography and Environmental Studies Department, Faculty of Science, Agriculture and Engineering, University of Zululand, KwaDlangezwa 3887, South Africa
Coasts 2024, 4(1), 49-62; https://doi.org/10.3390/coasts4010004
Submission received: 16 December 2023 / Revised: 13 January 2024 / Accepted: 19 January 2024 / Published: 25 January 2024

Abstract

:
Southwestern Peru has an arid climate typical of subtropical west coasts bordering cold ocean currents. Mountain runoff is barely able to sustain urban needs and motivates this research. Using high-resolution satellite reanalysis products, the meso-scale climate and weather variability are explored via point-to-field regression. A time series spanning 1970–2022 of Tacna area (18 S, 70.2 W, 570 m) rainfall, potential evaporation, wind, and weather parameters were evaluated for thermodynamic and kinematic features. Although sea breezes draw marine air inland, they simultaneously generate low-level divergence and subsidence aloft. Potential evaporation in early summer causes water deficits that are rarely offset by late summer runoff from the Andes Mountains. Winter (May–September) showers from passing cold fronts are more frequent during El Niño. Warming of the tropical east Pacific accelerates subtropical westerly winds that lift over the coastal plains. Quasi-stationary Rossby wave patterns amplify transient troughs at 70 W, but the winter showers rarely exceed 4 mm/day due to low-level stability from negative heat fluxes over cool seawater offshore. Two winter wet spells were studied using satellite and surface data (July 2002, July 2009). Light showers were prominent in elevations from 400 to 900 m. An early summer dry spell was considered (November 2020), wherein southeast winds, coastal upwelling, and low dewpoint temperatures coincided with La Niña conditions. A rain-gauge transect showed that summer convection stays east of the Andes escarpment and seldom benefits the coastal plains. Thus, water resources in Tacna are strained beyond the carrying capacity.

1. Introduction and Background

The Andes Mountains of Peru provide vital runoff to the arid Pacific coast, and runoff has remained steady despite global warming [1]. Yet many urban centers to the south of Arequipa, Peru, suffer from water shortage [2,3] under the semi-permanent southeast Pacific anticyclone. Coastal upwelling, negative heat flux, and divergent equatorward airflow combine to generate atmospheric subsidence of −2 cm/s [3,4,5,6,7], so stratiform clouds are trapped within a shallow marine boundary layer, unable to convect.
The provincial capital of southern Peru, Tacna (18 S, 70.2 W, 570 m, 300 K pop.), has an air temperature range of 11–26 °C, while offshore sea temperatures stay between 17–23 °C. The landscape is barren due a persistent atmospheric inversion that prevents southerly winds from advecting moisture inland, so rainfall averages < 1 mm/day. In the volcanic highlands above Tacna, melting snowfall [8] yields runoff into the Caplina Valley that sustains agricultural production: forestry, olives, oregano, pomegranate, and corn. Although the Altiplano tends to block tropical convection from the Amazon Basin, humidity from the equatorial Pacific can reach southern Peru during infrequent El Niño events [9]. The potential for coastal showers increases under subtropical westerlies in winter (May–September) [10,11]. Frontal clouds hug the surface and deposit mist in elevations of 400–800 m [12,13]. Low evaporation during the cold winter months helps retain the moisture, which adds to late summer runoff from the 5000 m Cordillera Barroso (Figure 1a). Tacna’s water demand of ~1.8 × 10⁶ m3/day exceeds supply of ~0.7 × 10⁶ m3/day, so underground aquifers in the Caplina Valley are over-exploited [14,15,16], leaving a recharge—abstraction deficit and salinization near the coast.
Previous studies found that infrequent rainfall on Chile’s north coast is associated with subtropical teleconnections [17,18]. During winters with an on-going El Niño, there is an equatorward shift of mid-latitude storm tracks and atmospheric Rossby waves. Occasionally the subtropical jet-stream bifurcates, producing cutoff lows accompanied by NW cloud-bands invigorated by warm SSTs. The mid-level instability generates stratiform showers in the northern Atacama Desert. Determining how, when, where, and why this happens are the goals of the research. The meteorology of southwestern Peru is analyzed in this study for thermodynamic and kinematic controls on winter rainfall, expanding on prior work to link the climate and weather processes and impacts on Tacna, Peru, to assist hydrological risk management.

2. Data and Methods

The geographic focus is the southwestern coast of Peru (14.5–21 S, 75–66 W) (Figure 1a) wherein the meteorological features are characterized by ERA5 reanalysis fields [19] at 25 km resolution: rainfall, potential evaporation, wind velocity, vertical motion, air and sea temperature, specific humidity, and boundary layer height from 1970 to 2022. Satellite rainfall, land and sea surface temperature, and vegetation and ocean color fields were obtained at 4–10 km resolution [20,21] in the period spanning 2000–2022. Ocean currents were studied via SODA reanalysis [22] and large-scale SST were analyzed via Hadley Centre reanalysis [23]. Local weather service rain-gauge, weather station, and radiosonde data were obtained. Dataset acronyms and characteristics are given in Table 1.
After outlining the data sources, methods began with the extraction of ERA5 daily time series at Tacna, Peru (18 S, 70.2 W, 570 m), from 1970 to 2022—a record length of 19,358 days. These were analyzed for overall average, mean annual cycle, temporal fluctuations, and identification of wet cases by ranking. Airport wind roses were computed for night and day, and a rain-gauge transect on 18 S was evaluated for seasonality. To determine validity, the ERA5 monthly rainfall at Tacna was correlated with satellite and gauge products (cf. Appendix A). From hourly ERA5 time series, mean diurnal cycles of air temperature and zonal wind at Tacna were studied to determine how sea breezes promote upslope airflow.
After reduction to seasonal timescale, winter rainfall (May–September) was point-to-field correlated with mid-tropospheric winds, SST, and net OLR over the area of 45 S–5 N, 120–50 W and time period of 1970–2022 (n = 53 years). Temporal lag-correlations were analyzed with Pacific Nino3 SST [26]. Wavelet spectral analysis was applied to 18-month filtered ERA5 rainfall time series to evaluate inter-annual oscillations of hydro-climate. Daily time series of winter rainfall (n = 7950) were correlated with fields of 500 hPa geopotential height at −4 to +2 day lag to determine the evolution of mid-latitude troughs and ridges. Table 2 lists the ranked days with appreciable winter rainfall in Tacna. A winter wet spell during 2–4 July 2002 was analyzed for frontal passage, radiosonde profile, and hourly air temperature and rainfall in Tacna. A second wet spell during 21–22 July 2009 was studied using Cloudsat reflectivity [24], airflow back-trajectories [25], and moisture flux. To understand the meteorology of dry spells associated with Pacific La Niña, daily ERA5 dewpoint temperatures and potential evaporation in Tacna and Nino3 SST were ranked to identify a case in mid-November 2020. The weather conditions, vertical structure, and air–sea interactions were studied therefrom.

3. Results

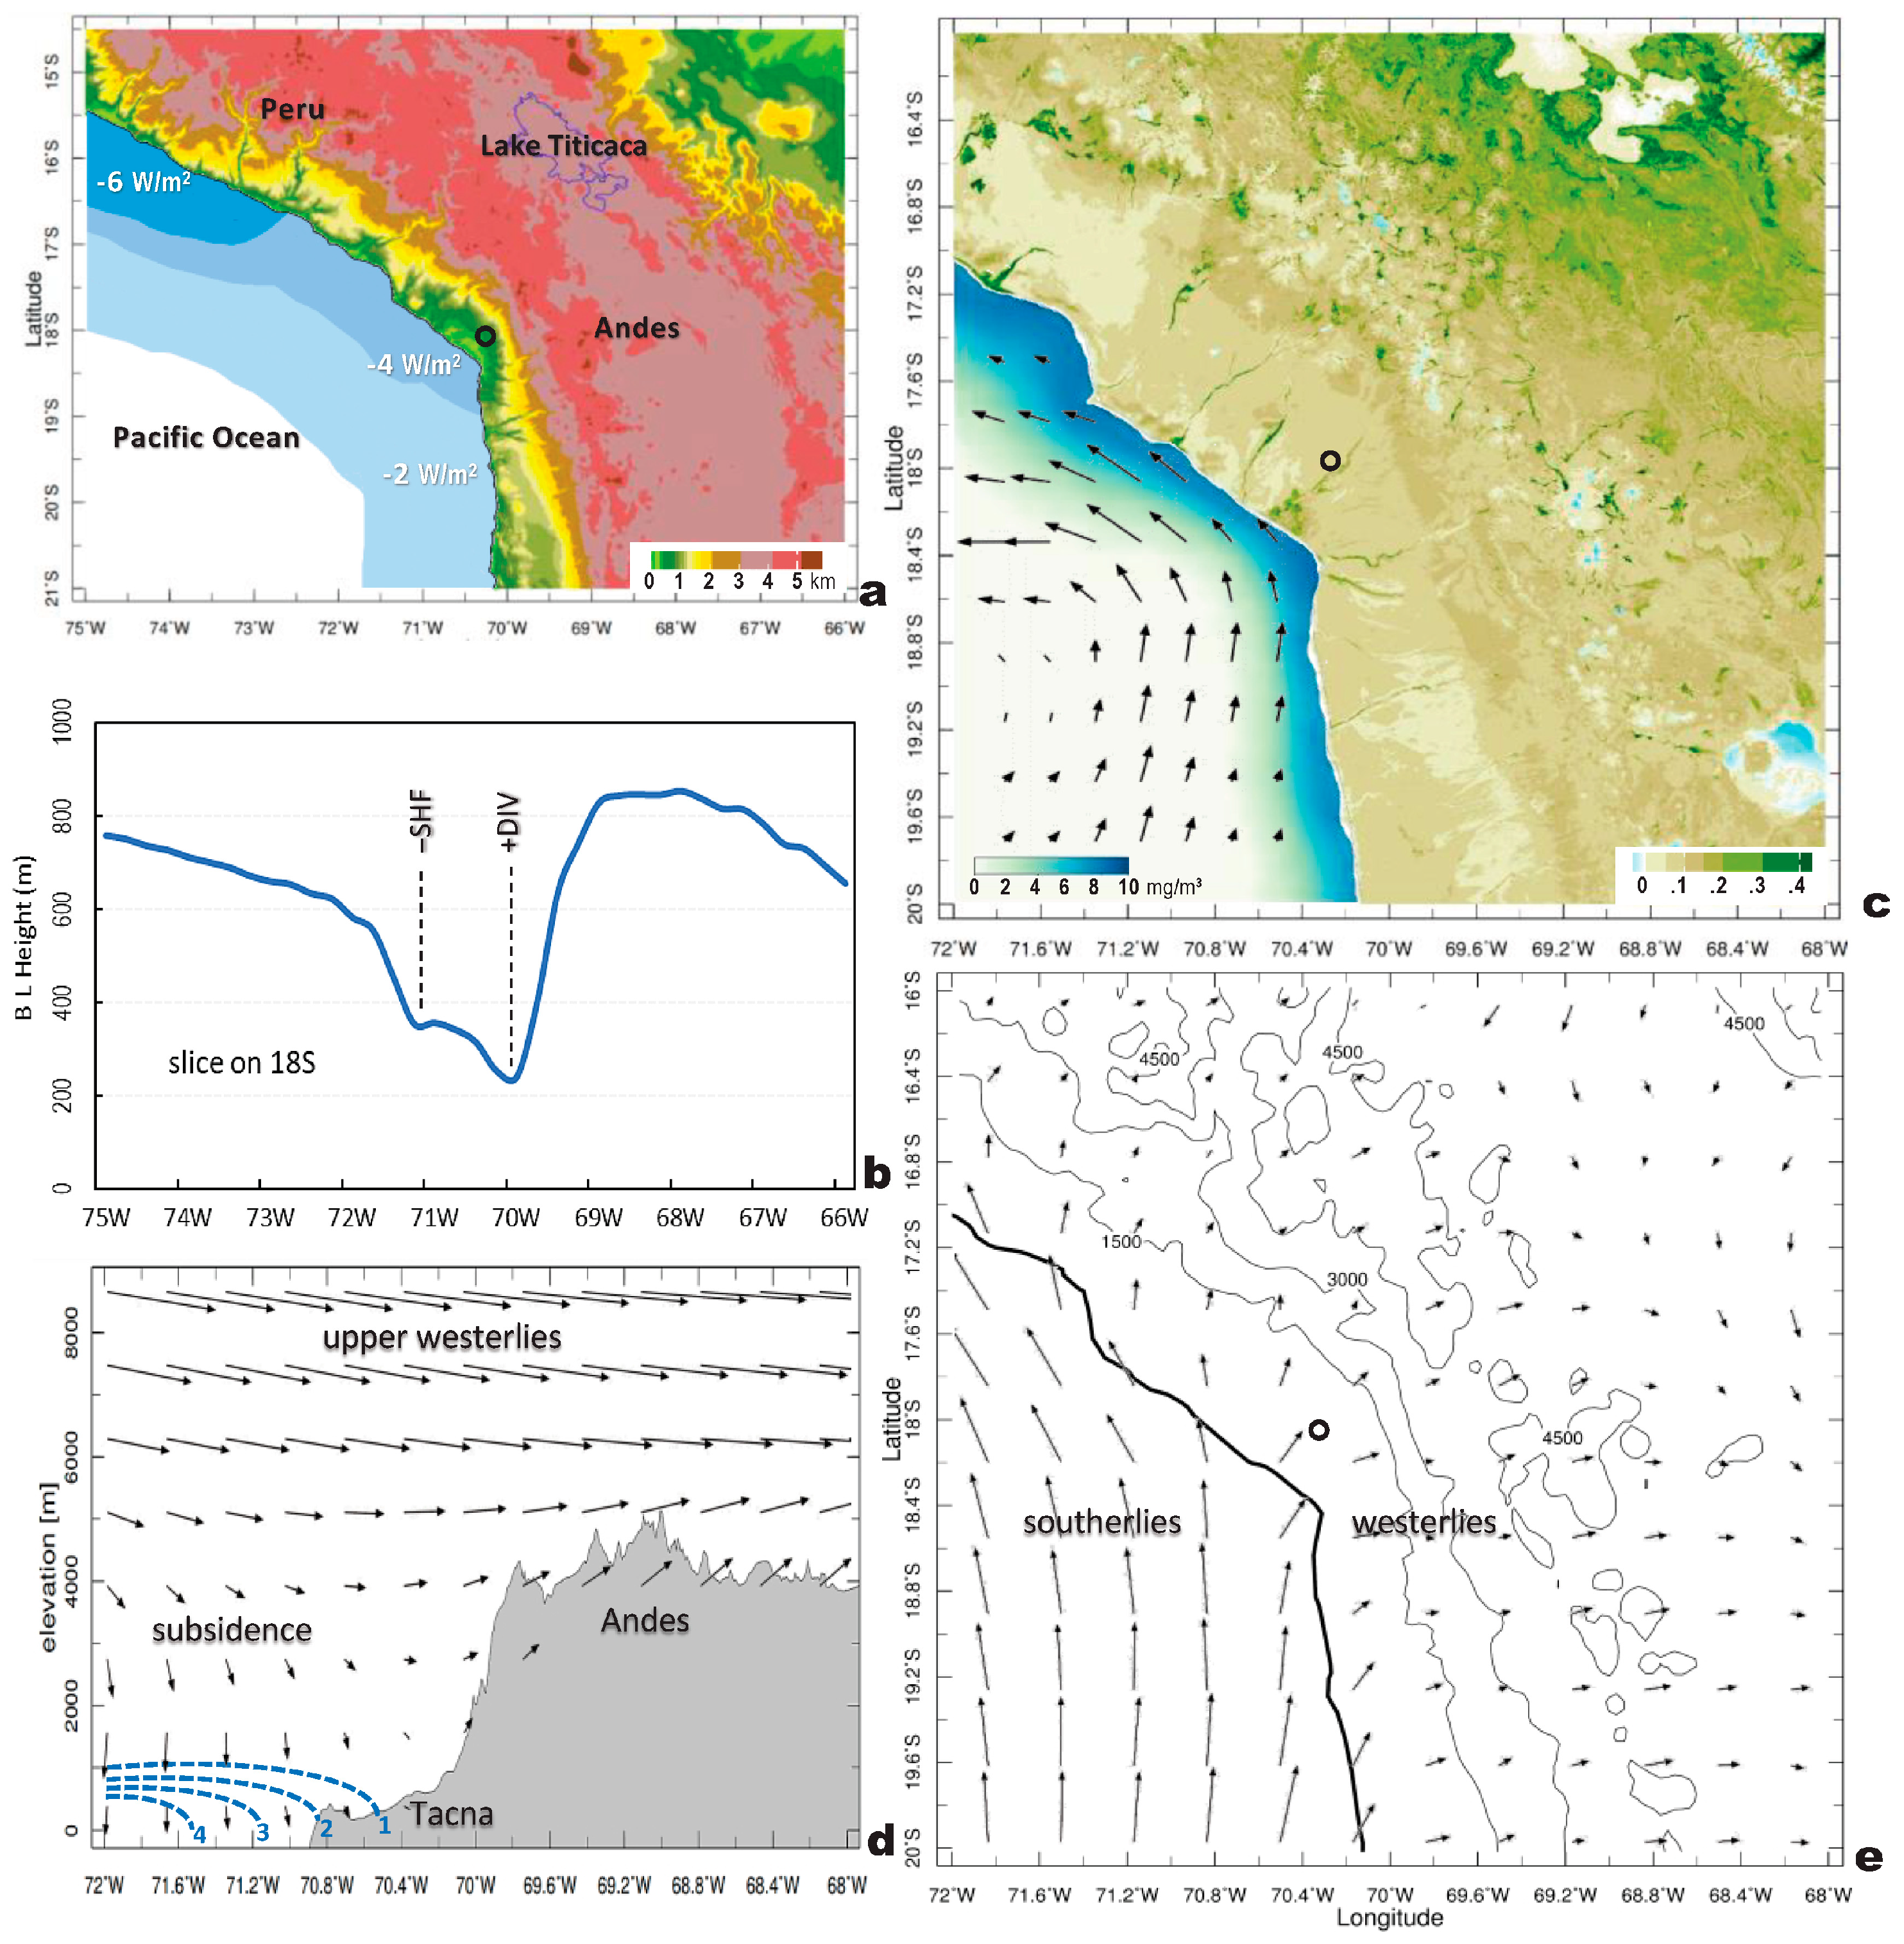
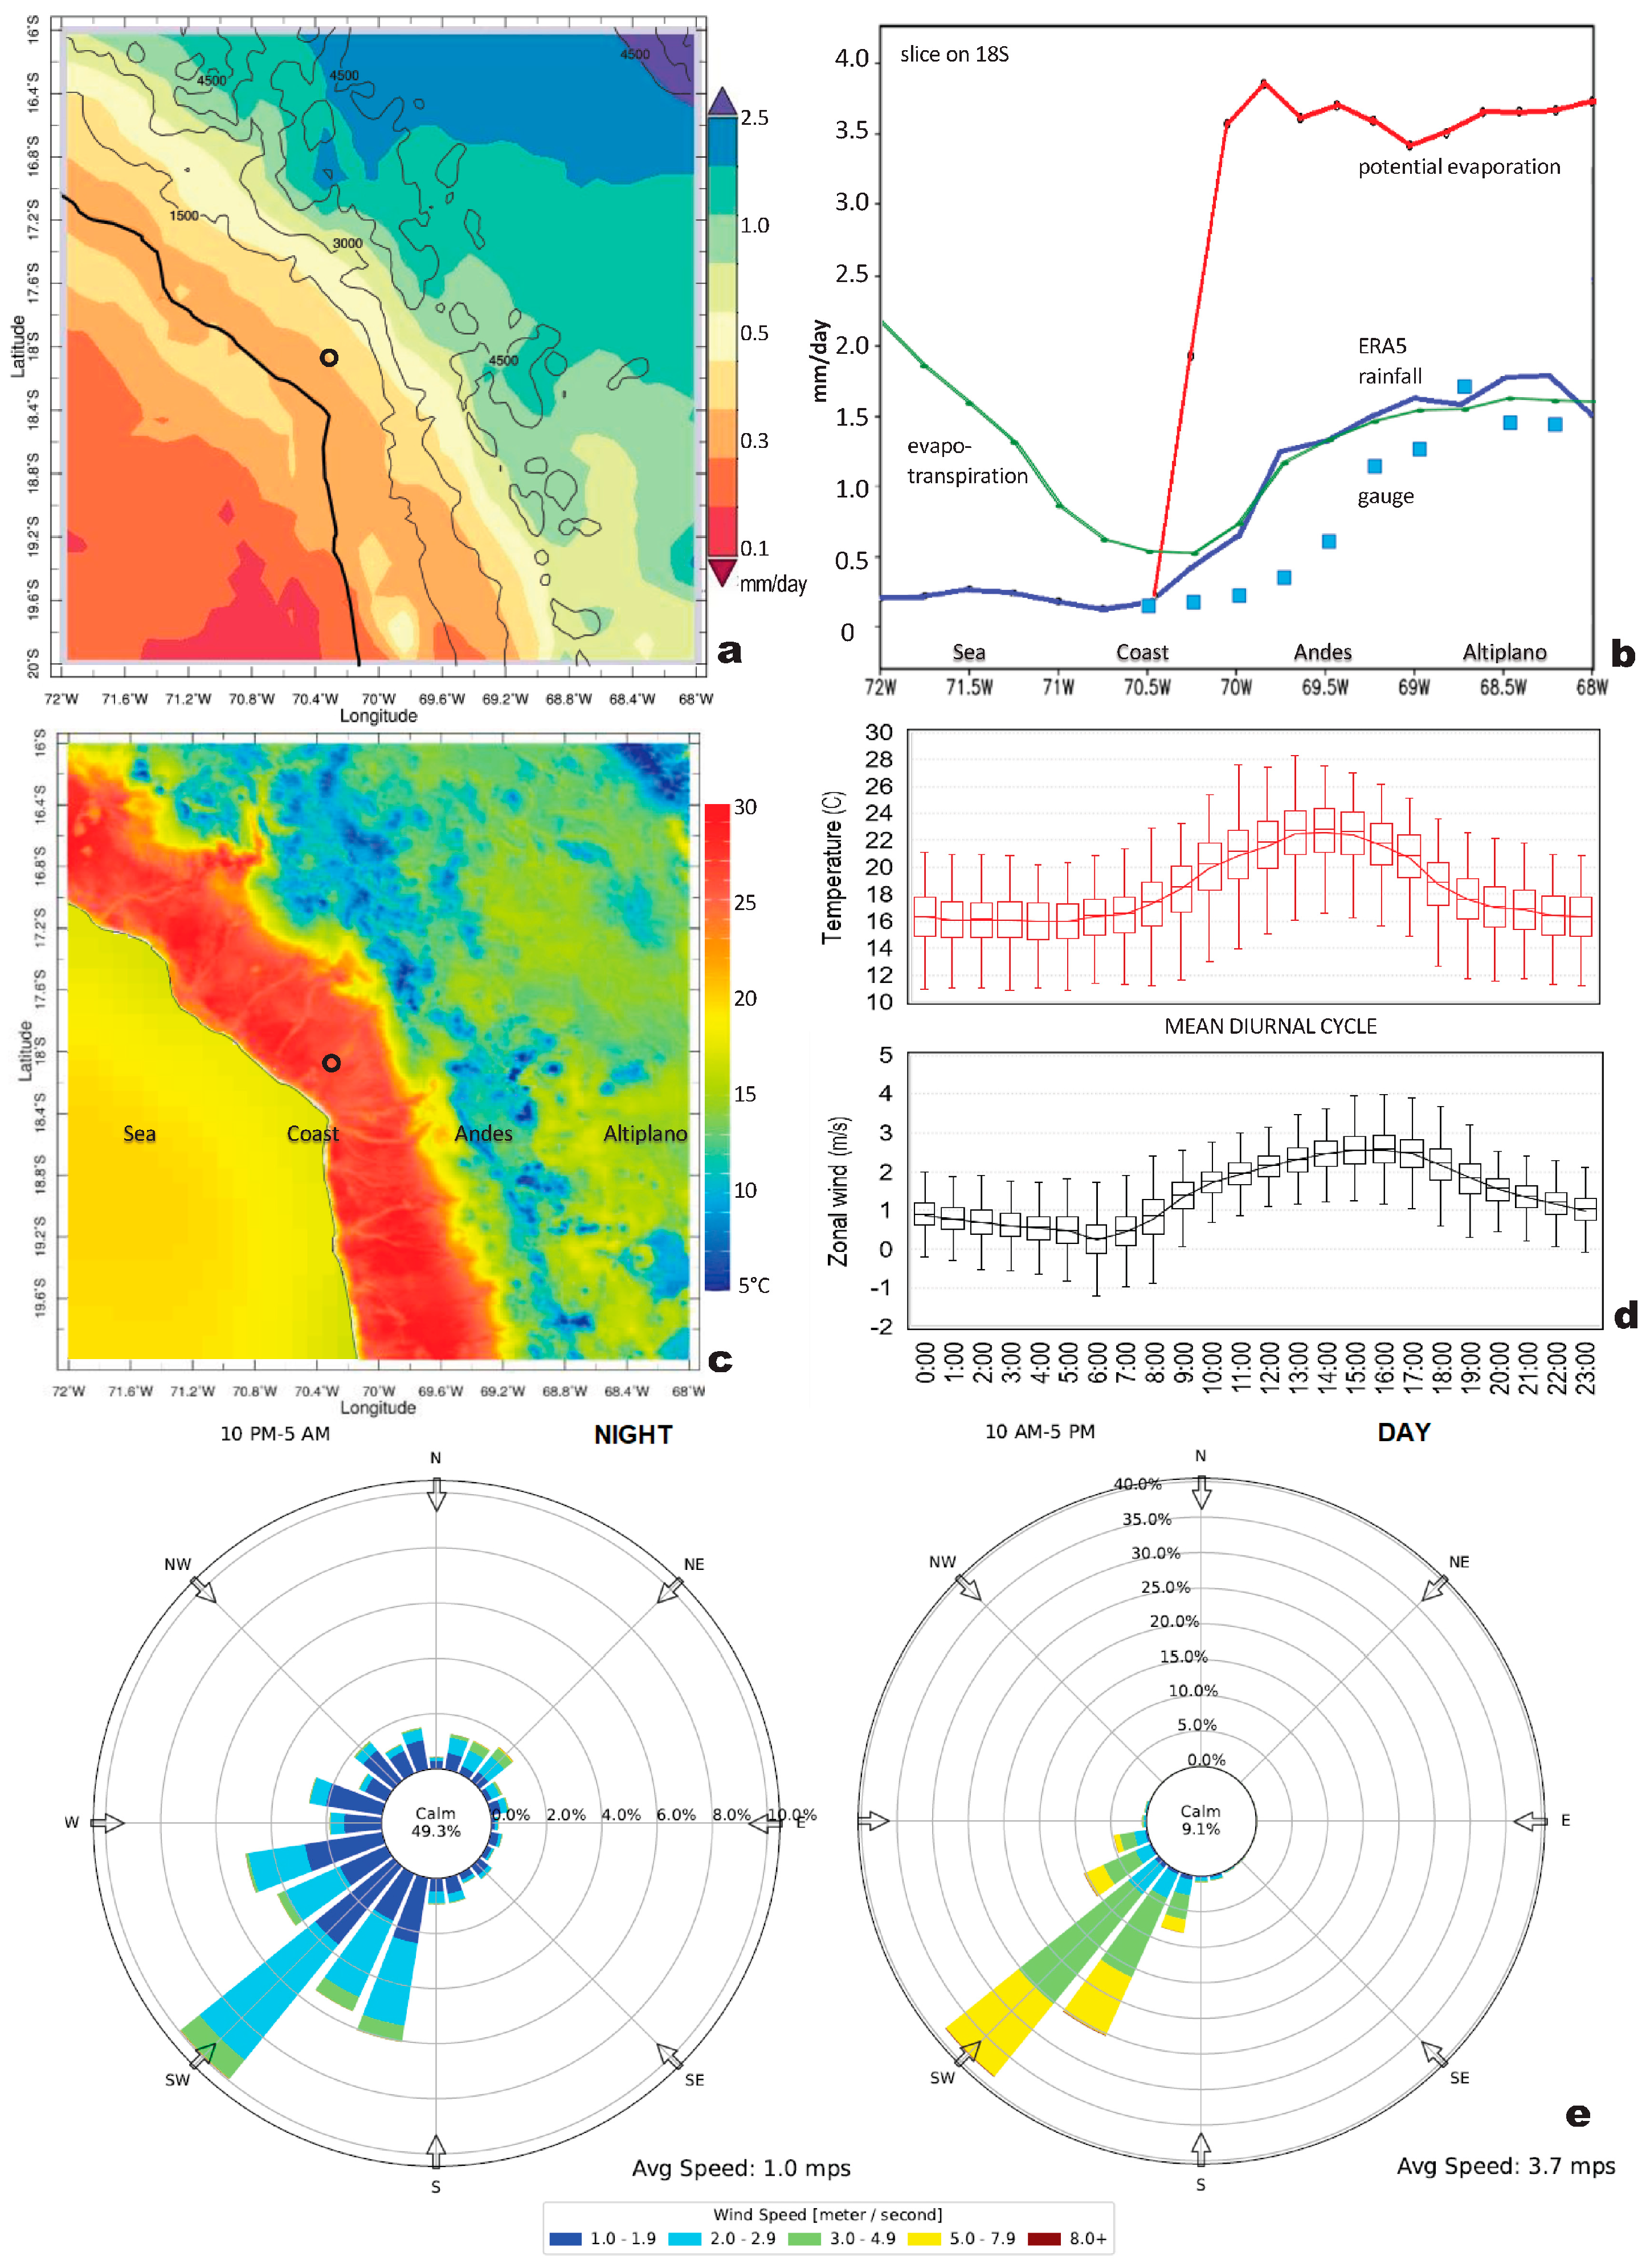
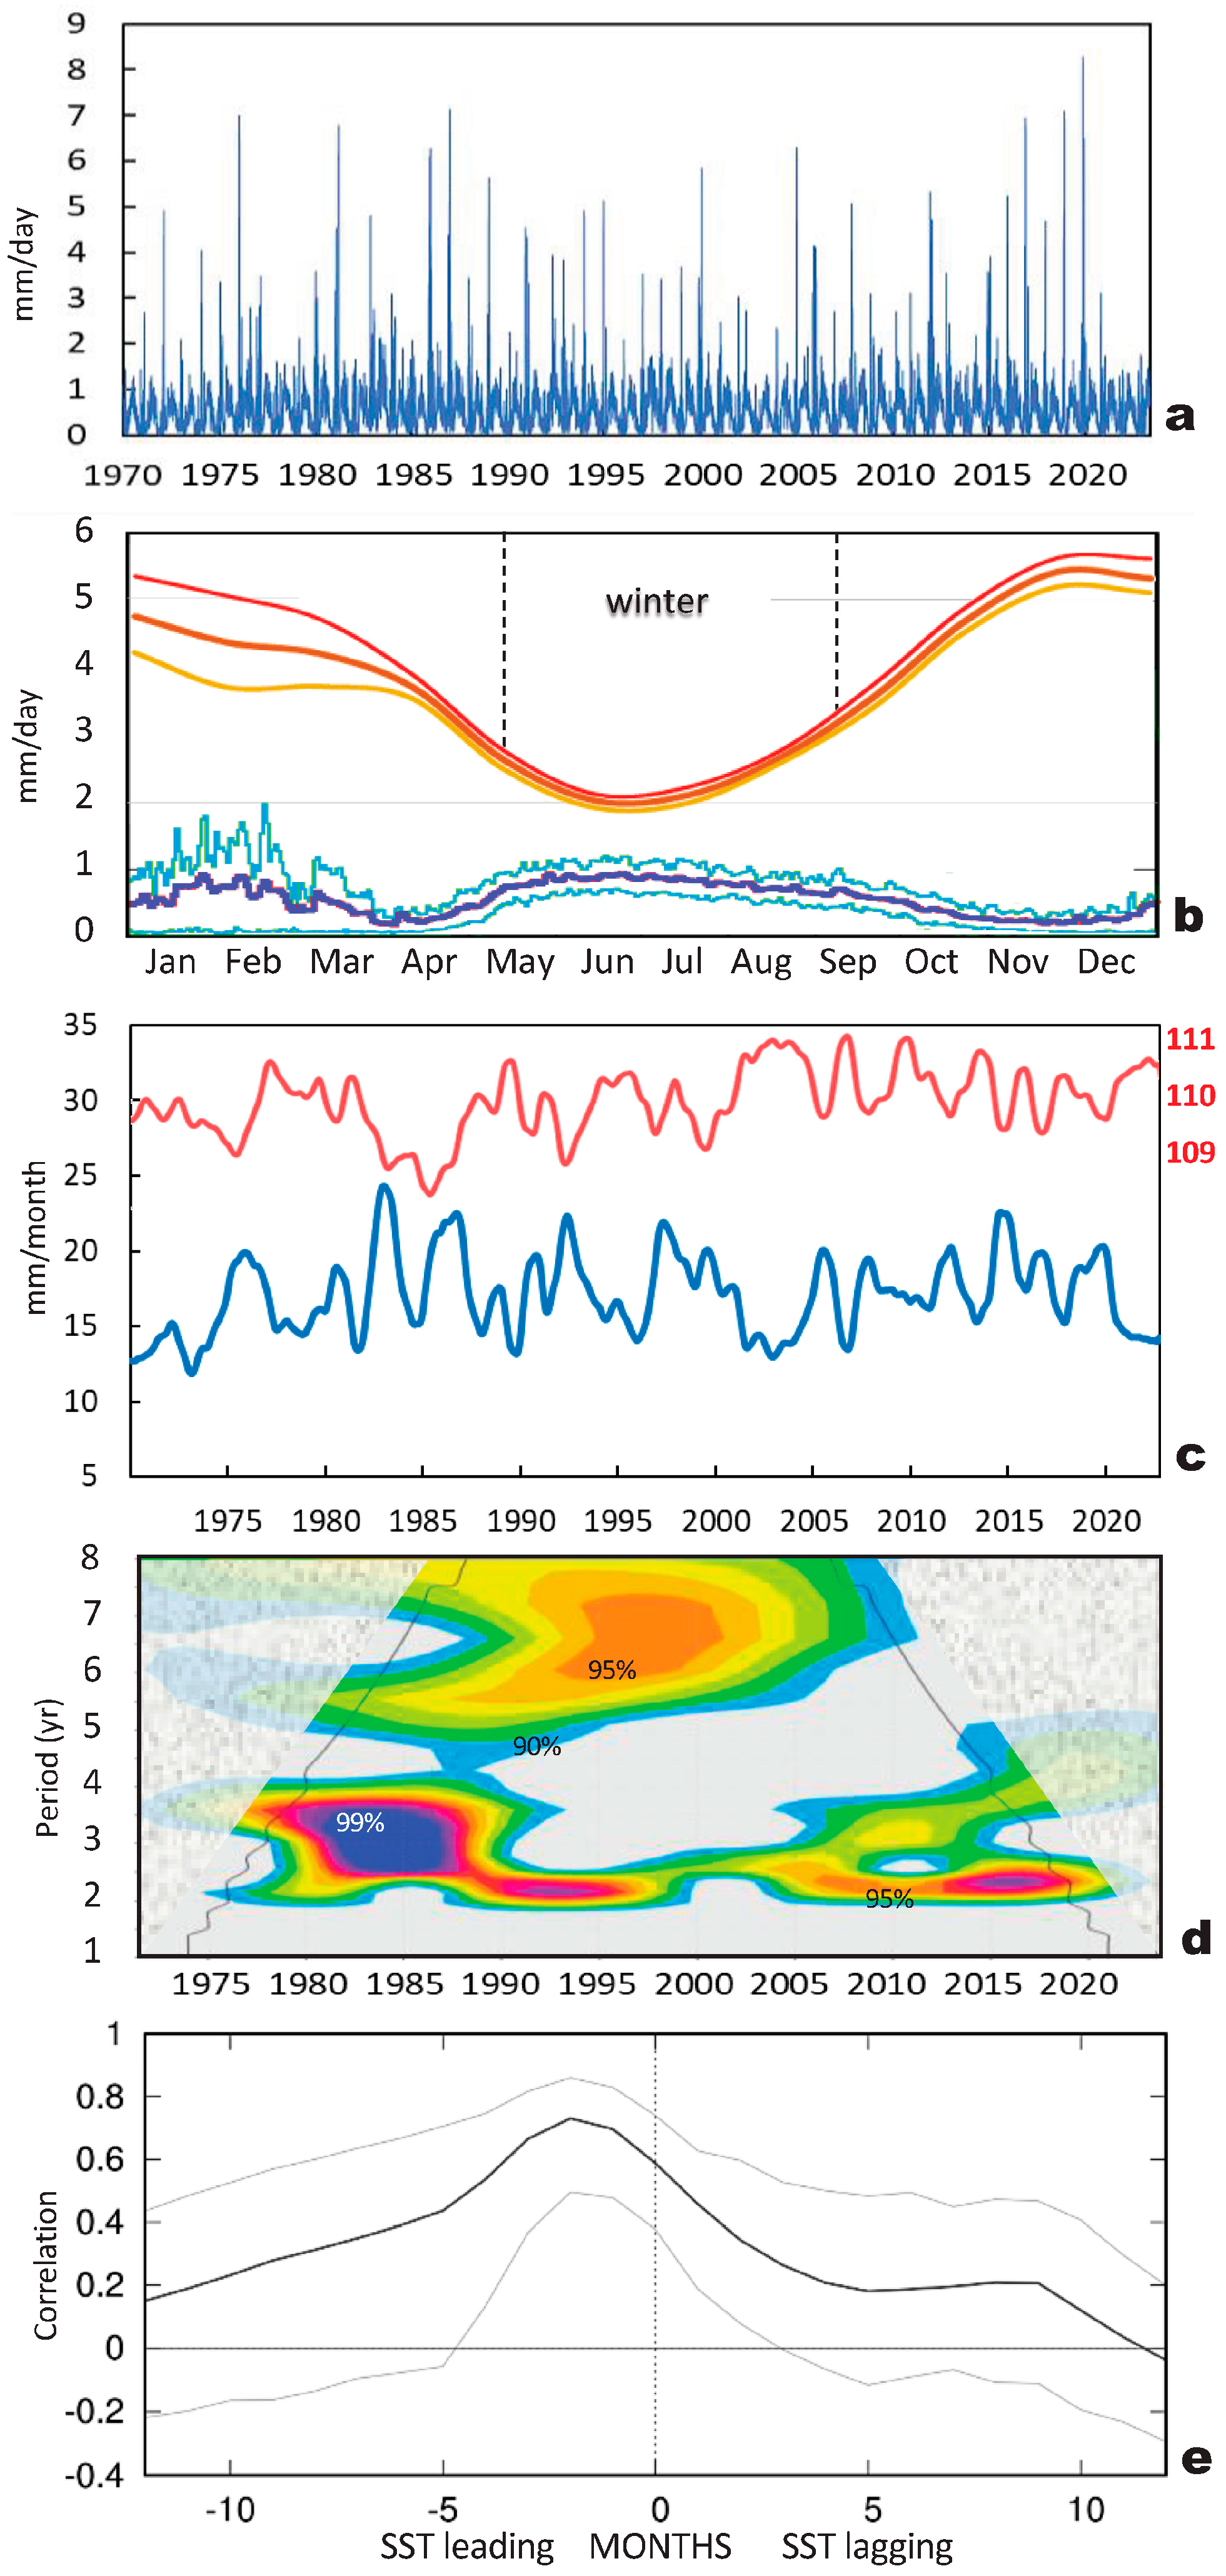
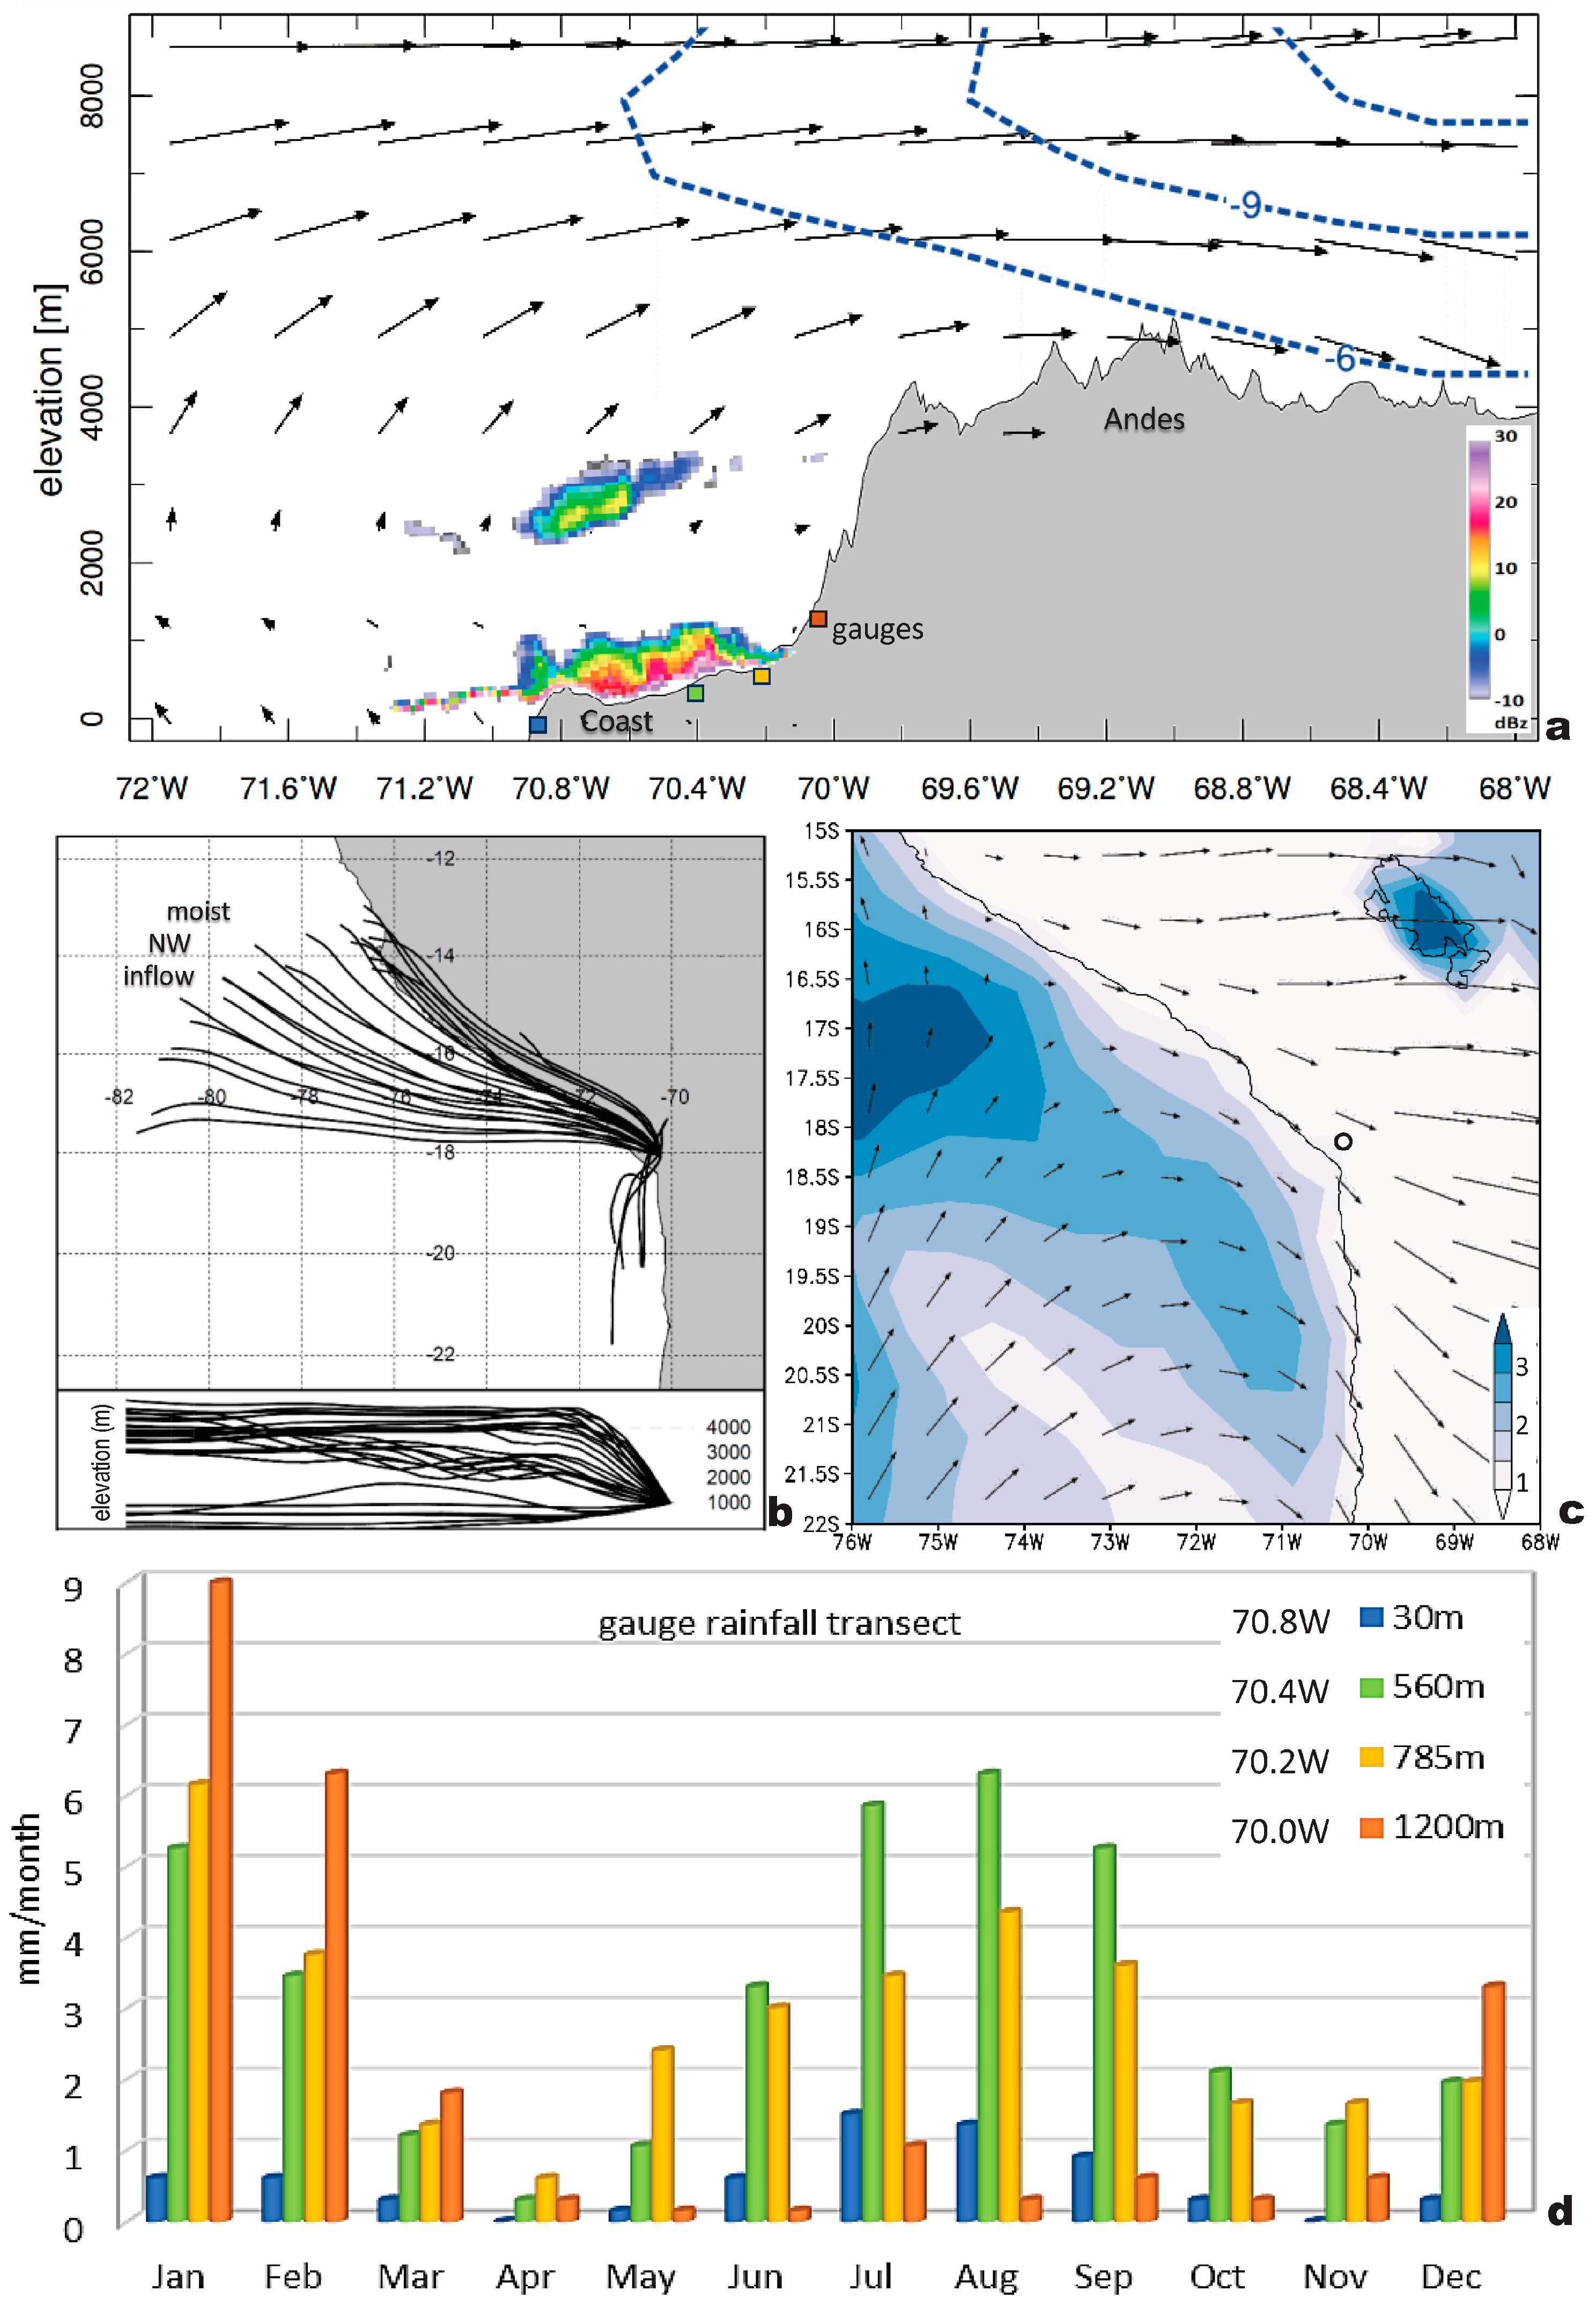
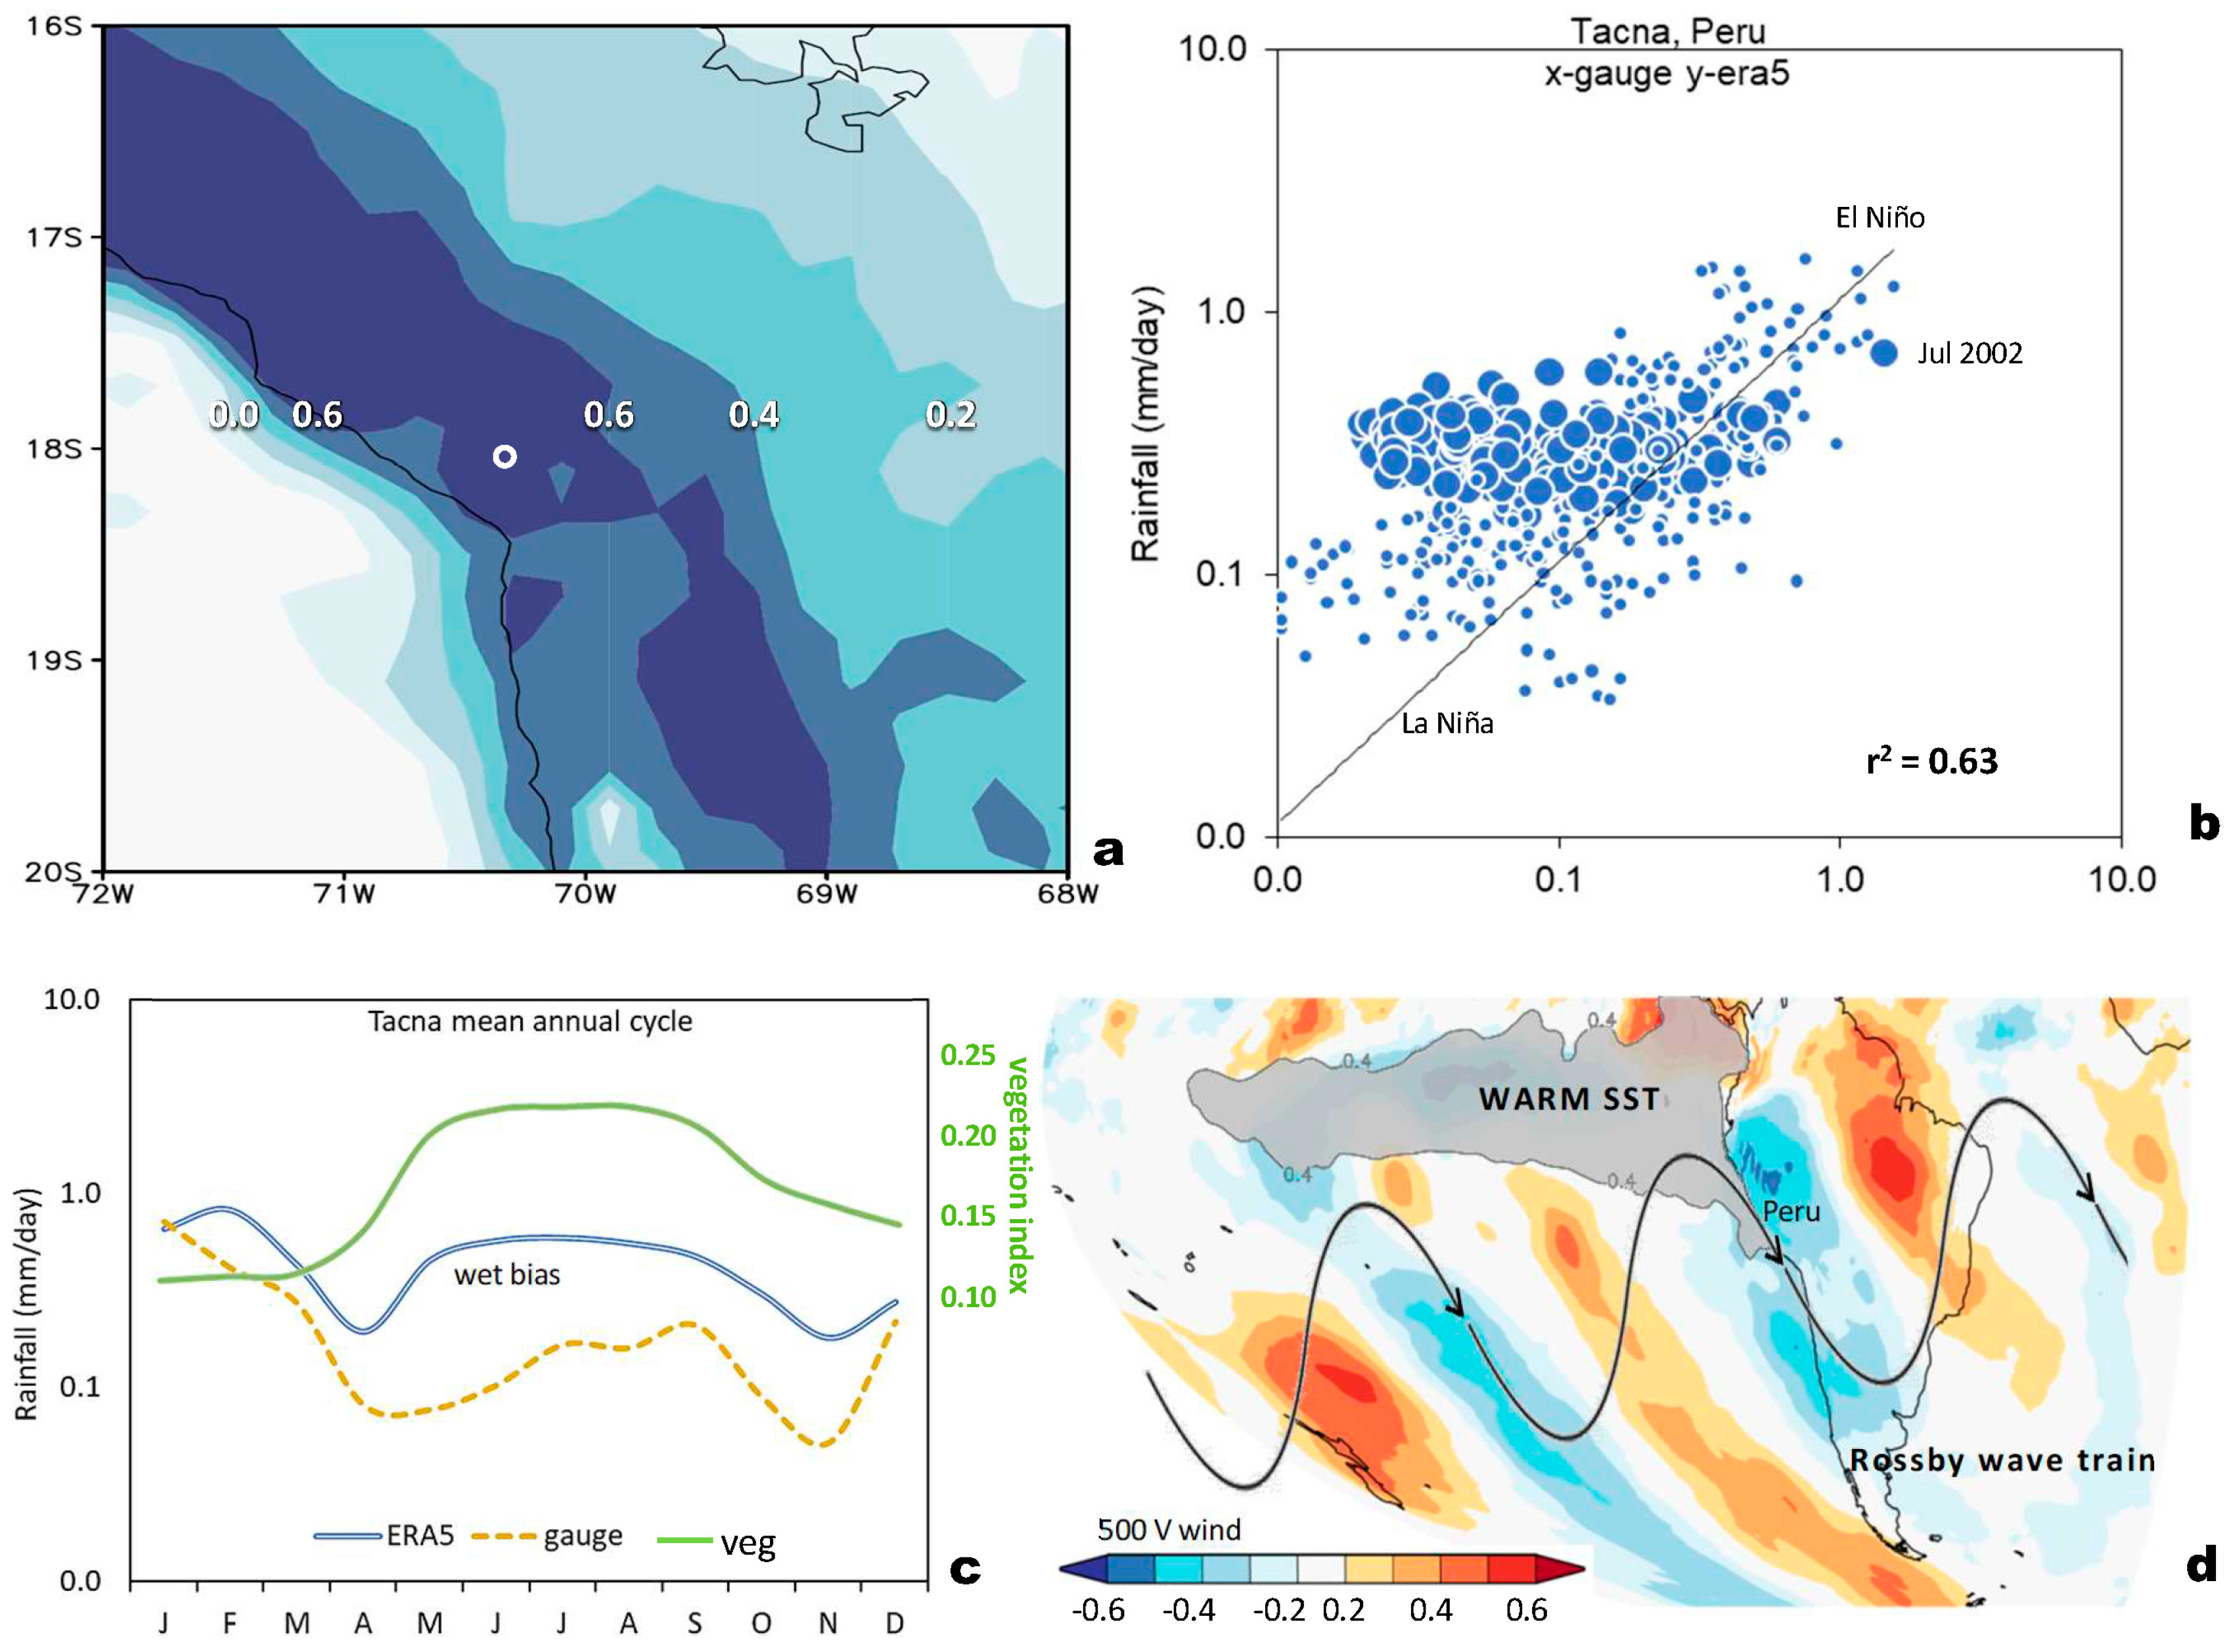
Climate and Seasonality

The geography (Figure 1a) of southwestern Peru shows a concave NNW coastline backed by a steep escarpment and broad highlands (Altiplano). Air–sea sensible heat fluxes are −5 W/m2 over the shelf and thus downward. The arid coastal plains below Tacna slope into valleys where the satellite vegetation fraction is ~20%. Elsewhere the vegetation fraction varies with elevation from ~5% on the coast to 30% in the highlands (Figure 1b). The satellite ocean color fraction (chlorophyll) reaches ~10 mg/m3 inside the equatorward Humboldt Current and supports a marine fishery. Atmospheric boundary layer height (Figure 1c) is ~700 m offshore and over the highlands, but dips to ~300 m over the coast due to negative heat flux and equatorward wind divergence (Figure 1d,e) as noted by previous researchers [27]. Moist SW winds of 1–4 m/s are confined to a shallow layer by atmospheric subsidence. The concave shape of the coastal topography induces streamline diffluence, slowing equatorward airflow around the southeast Pacific anticyclone.
Long-term mean climate data are presented in Figure 2. Rainfall along a zonal slice on 18 S averages ~0.2 mm/day over the coastal plains and rises to ~1.5 mm/day over the 3000+ m Andes about 100 km inland (Figure 2a). Local gauge interpolated values rise more slowly inland, due to winter mist that plates onto vegetation but produces little measurable precipitation. The appendix compares ERA5 monthly rainfall in Tacna with satellite and gauge data. Point-to-field correlations > 0.6 spread NW-SE along the coastal plains (Figure A1a). The ERA5 vs. gauge scatterplot achieves r2 fit 0.63 (Figure A1b) with a wet bias in early winter that corresponds with the annual cycle of the satellite vegetation index (Figure A1c). This spatial and temporal coherence supports the use of ERA5 rainfall as a basis for this study.
Evapotranspiration (moisture supply to atmosphere) is ~2 mm/day offshore and over the highlands, but dips below 1 mm/day over the coastal plains around Tacna. Evapotranspiration rises gradually inland at about the same rate as rainfall. In contrast, potential evaporation (moisture lost by surface) increases rapidly inland to ~3.5 mm/day and exceeds rainfall by threefold over the coastal plains above Tacna (Figure 2b). Thus, surface hydrological deficits are created, and surface water supplies seldom meet urban and agricultural demand. Long-term mean surface temperatures vary from 20 °C in the southeast Pacific Ocean to >30 °C over the coastal plains. Surface temperatures decline inland according to elevation, reaching ~10 °C over the highest Andes (Figure 2c). Land–sea thermal contrasts instill a mean diurnal cycle for air temperature and zonal wind (Figure 2d) whose amplitude is steady across the seasons. In Tacna, mean temperatures rise from 16 °C (night) to 23 °C (day) and drive an onshore airflow of 2–3 m/s, representing the afternoon sea breeze. The airport wind roses for night and day (Figure 2e) show large contrasts: nocturnal airflow is variable and calm half the time, while diurnal airflow is southwesterly 3.7 m/s and upslope.
Turning our focus to temporal variability, the daily rainfall time series and its mean annual cycle are presented in Figure 3a,b. Spikes tend to occur during late summer each year as convection spills over from the north. Annual cycling from summer to winter is rather flat at ~1 mm/day in Tacna. Upper and lower rainfall terciles show a wide spread in January–March but are narrow in winter. Hence, late summer convection varies according to ENSO but winter mists are quite reliable and can bring snowfall to the Andes [8]. The mean annual cycle of potential evaporation ranges from 5.3 mm/day in November to 1.9 mm/day in June. Large water deficits on the coastal plains are partially offset by runoff from the highlands. Interannual variability of ERA5 rainfall is presented in Figure 3c,d. The 18-month smoothed rainfall time series oscillates between 14–22 mm/month and exhibits a sustained rhythm of 2–3 years with a harmonic of ~6 years from 1990 to 2005, according to wavelet spectra. Previous researchers [28] have related those oscillations to the way that mid-latitude weather responds to tropical climate anomalies. Fluctuations of winter rainfall correlate with ENSO as represented by tropical Pacific Nino3 SST (Figure 3e). A warm phase in the preceding season drives moist onshore airflow: correlation coefficients exceed 0.6 at a lead time of 1–3 months.
Having acquainted the reader with the mean climate, sharp coastal gradients, annual cycle, and the rhythm of inter-annual fluctuations, the mechanisms linking the local weather to regional climate are described below.

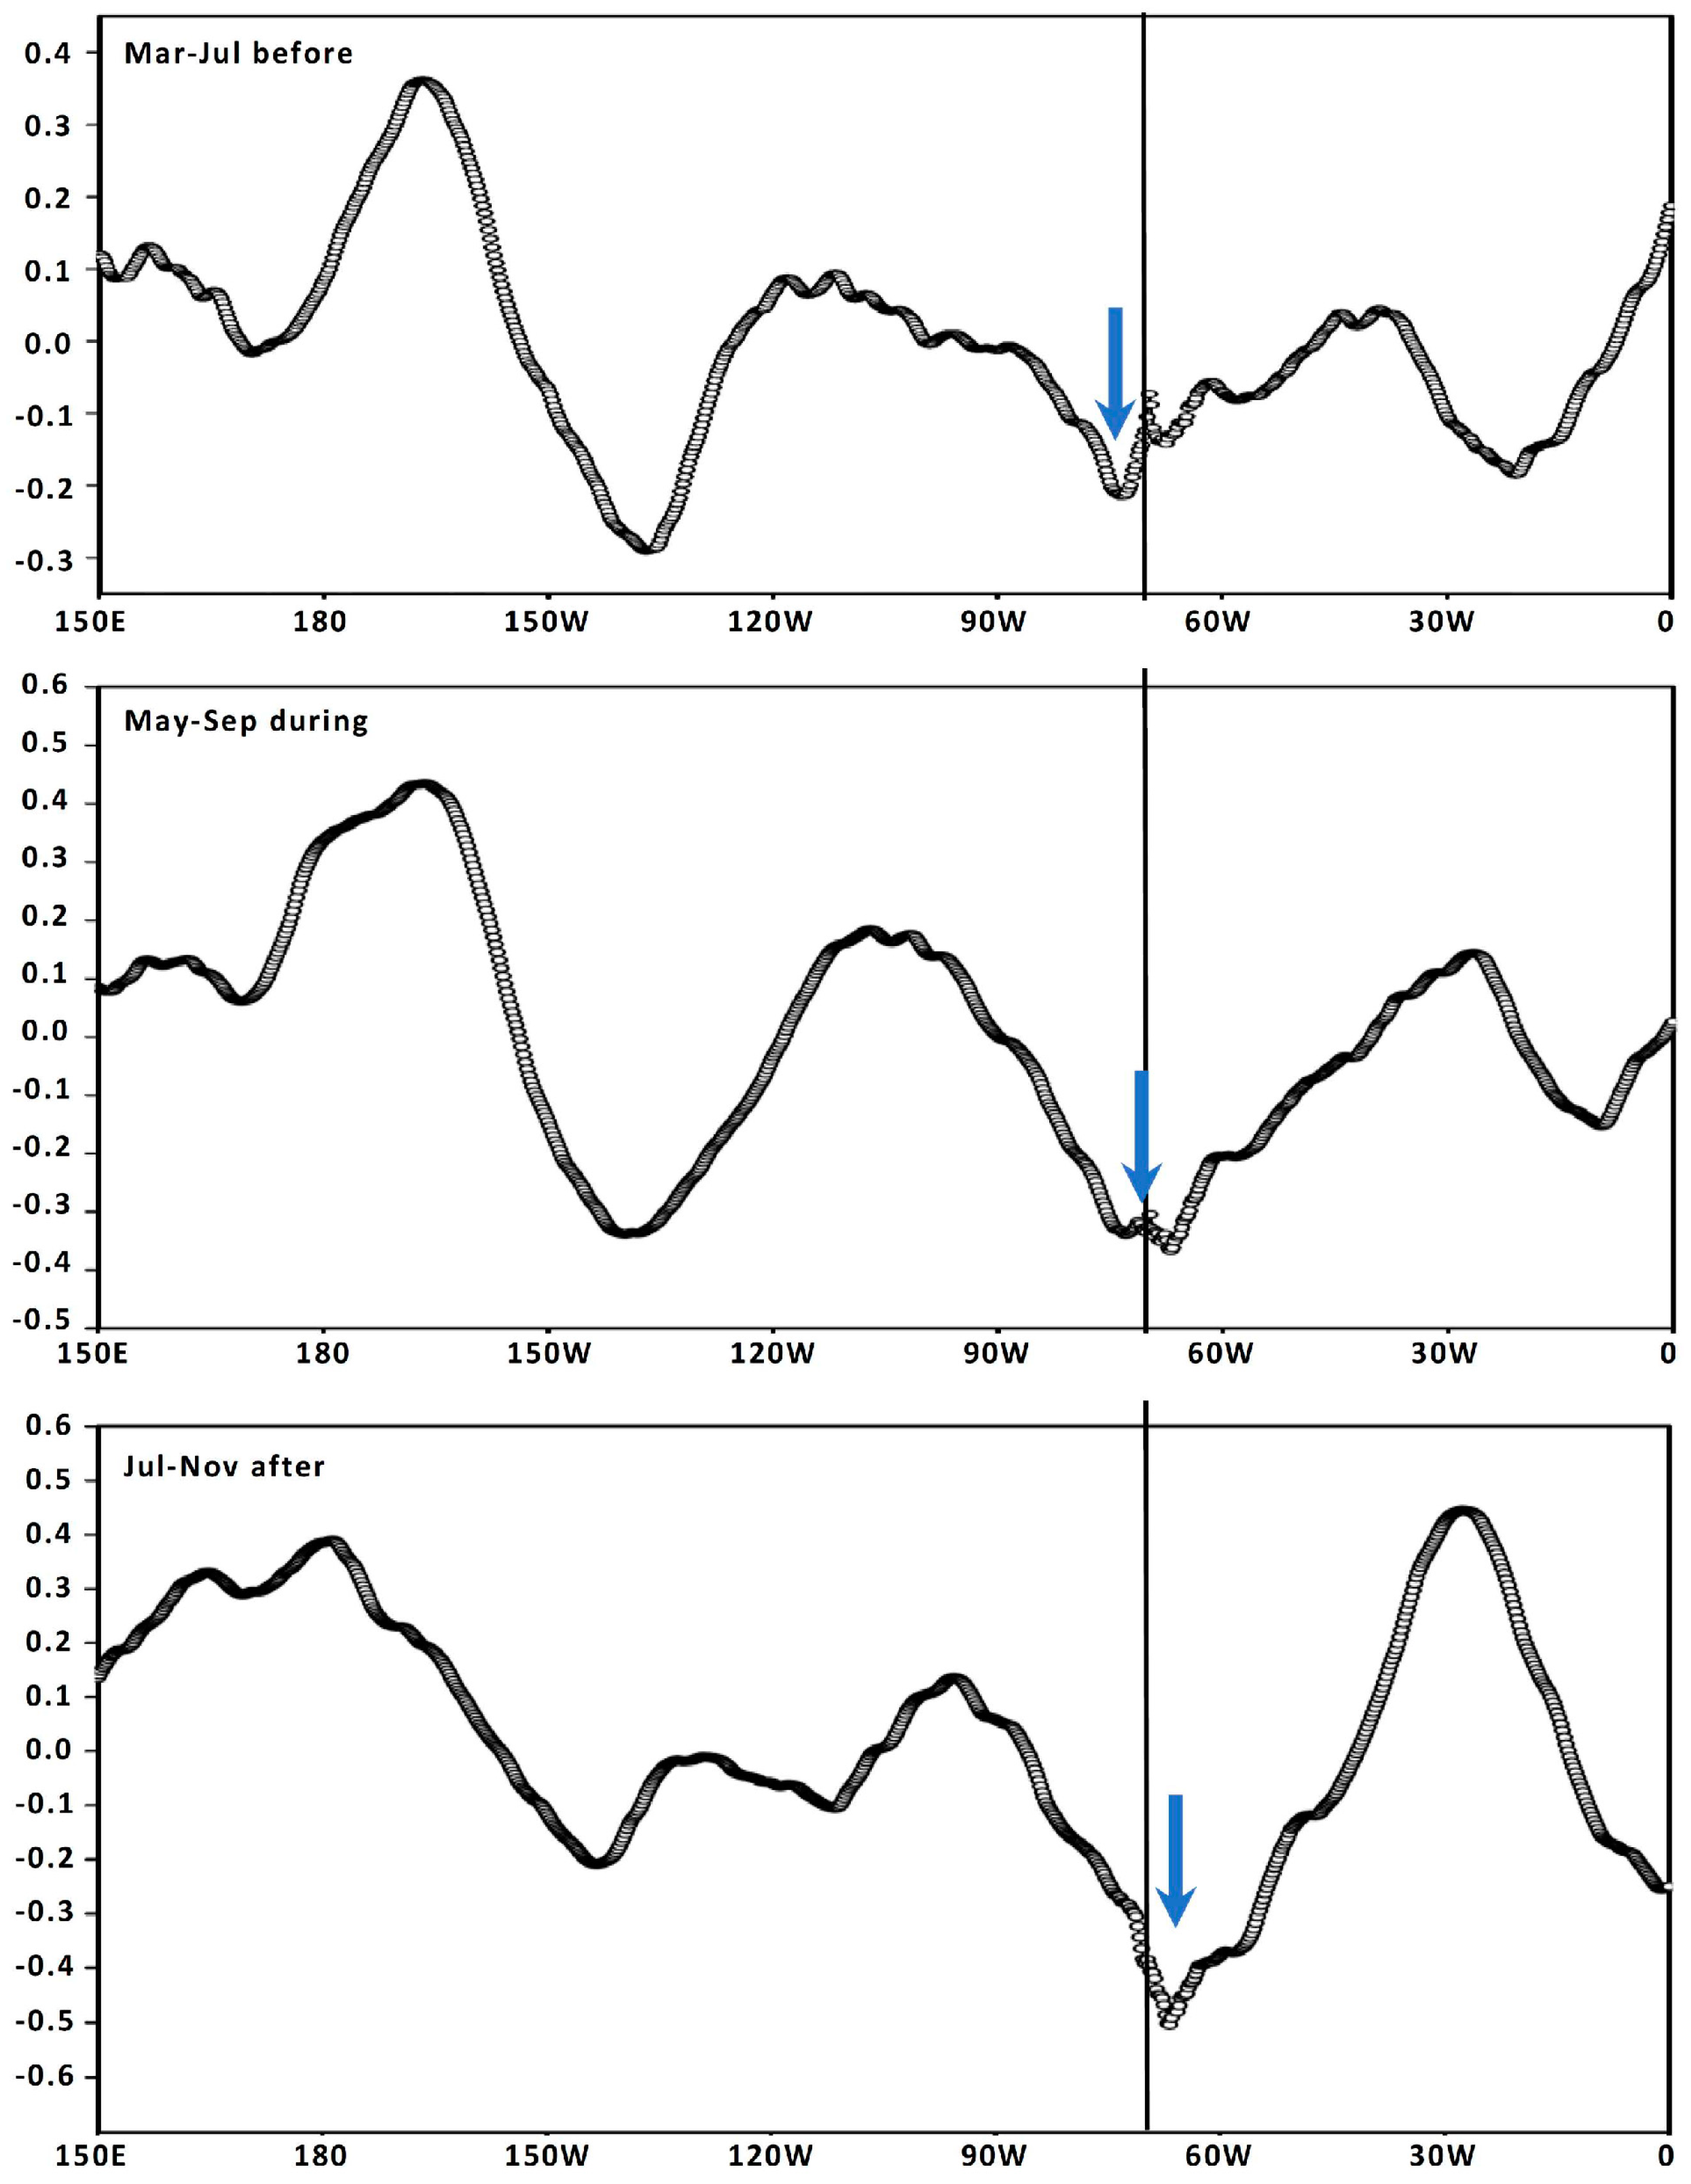
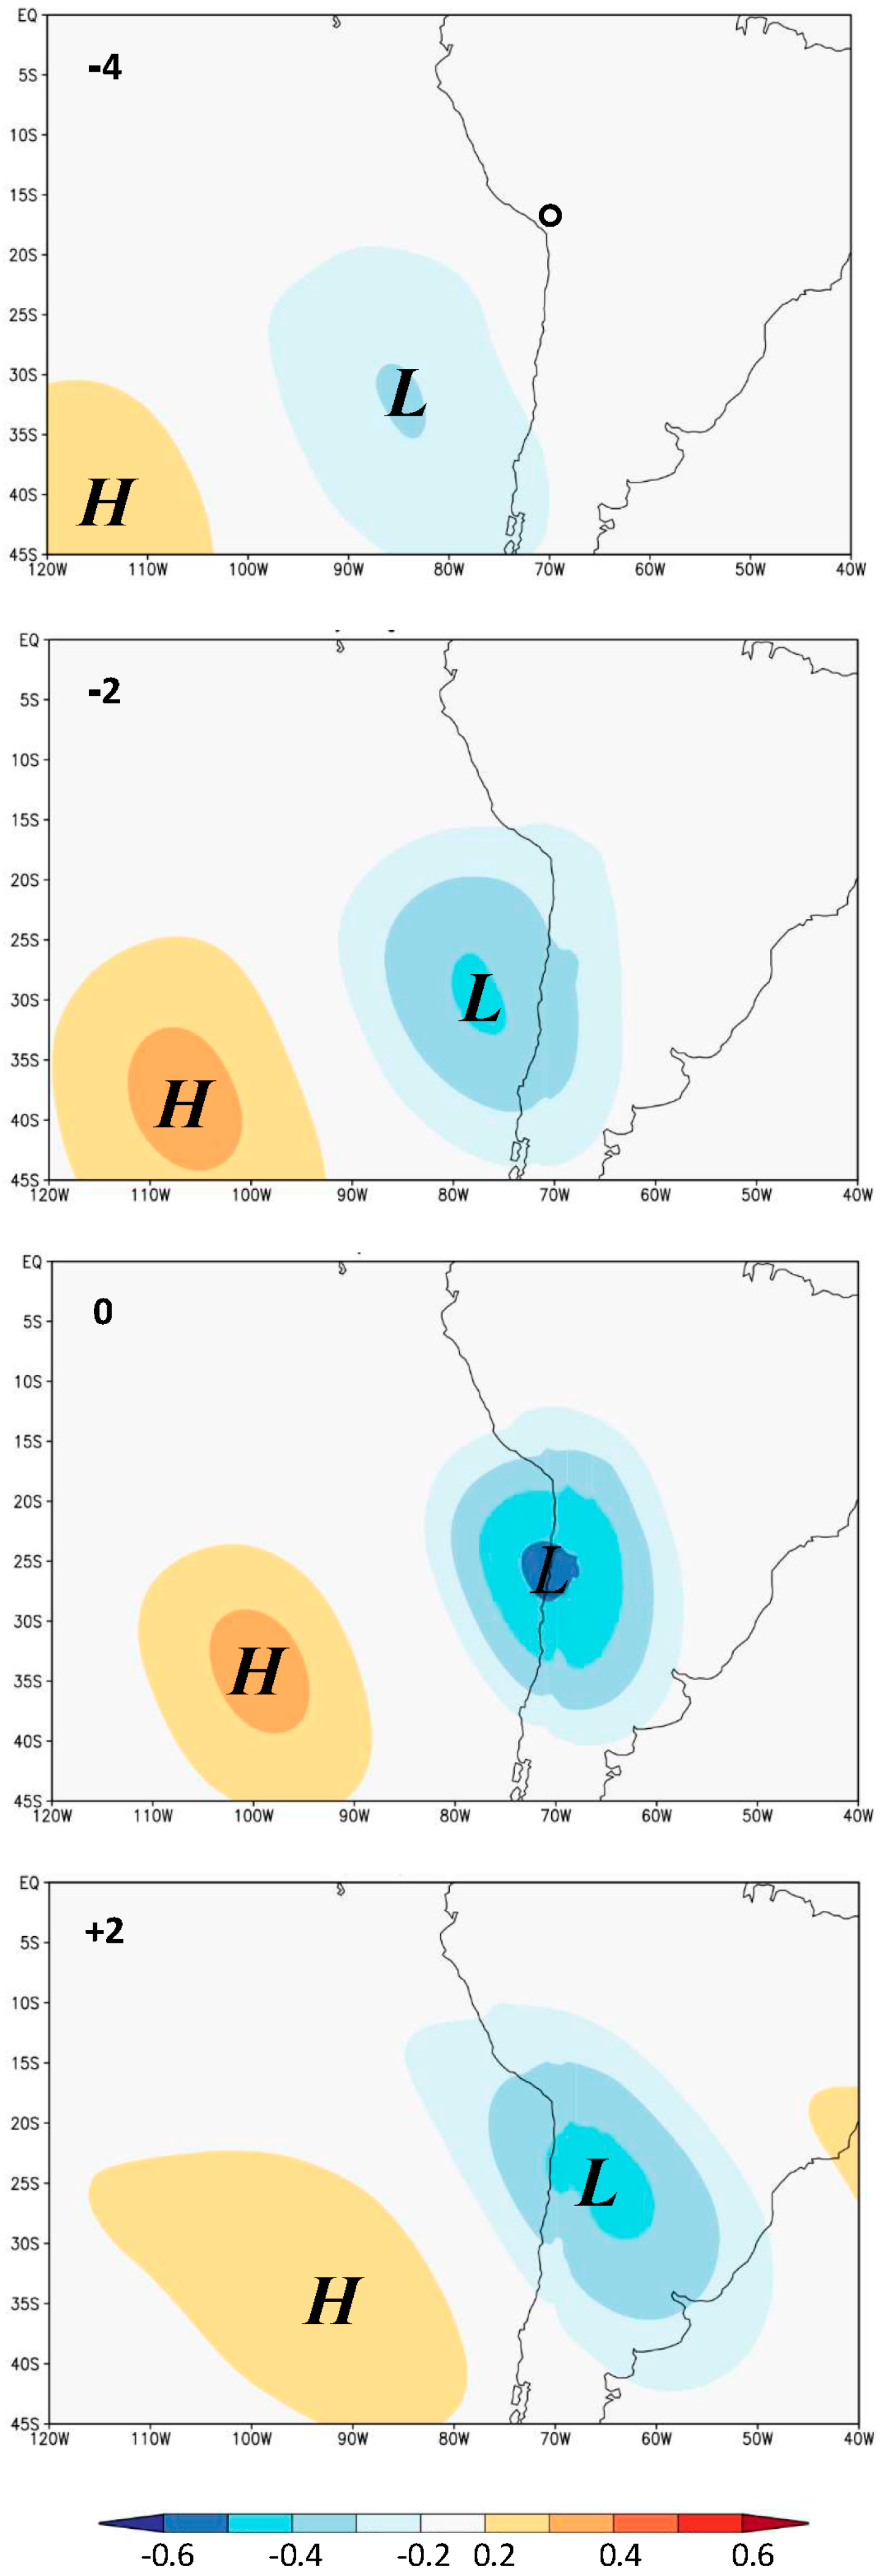
4. Regional Teleconnections

Point-to-field correlations between May–September rainfall in Tacna and 700 hPa zonal wind, SST, net OLR, and 500 hPa meridional winds are illustrated in Figure 4a–d for the period of 1970–2022. Wind anomalies of 700 hPa in the subtropics are westerly (+r), as expected, and drive moist Pacific air onshore and upslope. Westerly wind anomalies (r > 0.4) are also detected over the tropical east Pacific, while easterly anomalies appear over the Amazon where soil moisture exhibits a negative correlation (dry). The SST displays positive correlations spreading across the east Pacific (10 N–20 S, 120–75 W), indicating that El Niño favors increased winter rainfall in southwest Peru, as it does in northern Chile [11]. Correlation patterns naturally include the opposing influence: easterly marine winds and cool SST during La Nina correlate with dry winter weather in Tacna. Although ENSO influence is strong during summer, teleconnections during winter have a small signal-to-noise ratio.
Considering a wider perspective, the net OLR correlation with Tacna winter rainfall (Figure 4c) shows convection over the equatorial Pacific (5 N–5 S, 150 E–90 W), while northeast Brazil exhibits dry conditions. Thus, above normal winter rainfall in Tacna is sympathetic with the maritime tropics. An important feature is the quasi-stationary mid-latitude Rossby wave-train in point-to-field correlations with the 500 hPa meridional wind field (Figure 4d). Centers of action alternate across the south Pacific: 170 E (+), 150 W (−), 110 W (+), and 70 W (−), spreading over the subtropics (10–50 S) in a manner consistent with the Pacific-South America pattern (PSA; [29]). Previous researchers [29] explained the PSA mode as thermal wind intensification of the mid-latitude jet generated by tropical convection over warm SST. The wave-train links climate and weather processes and establishes a trough over SW Peru when El Niño warming spreads toward Ecuador (cf. Appendix A Figure A1d and Figure A2). Poleward airflow along the coast promotes rising motion due to increasing Coriolis and is joined by NW cloud bands sweeping in from tropical zones with anomalous moisture. It is reiterated that correlation fields infer the wave-train has opposing centers of action under dry weather conditions in SW Peru associated with east Pacific cold tongue.
Repeating the point-to-field correlation with daily 500 hPa geopotential heights from May to September each year (Figure 5), we find a gradual ENE progression of high–low cells in the southeast Pacific at lags −4, −2, 0, and +2 days, separated by 30° longitude, consistent with the findings of [11]. The phase speed is slow (3.5 m/s), which is typical of cutoff lows. The pattern exhibits a NW-tilt indicative of a ridging high delivering cold air behind the cyclonic vortex. The slow propagation enables the inflow of tropical air from anomalously warm SST associated with Pacific El Nino, as noted by previous researchers [17]. Slow eastward propagation of 500 hPa poleward airflow is also noted in the Rossby wave-train established during winter (cf. Figure A2). The following section focuses on the winter-time meteorology of two case study wet spells.

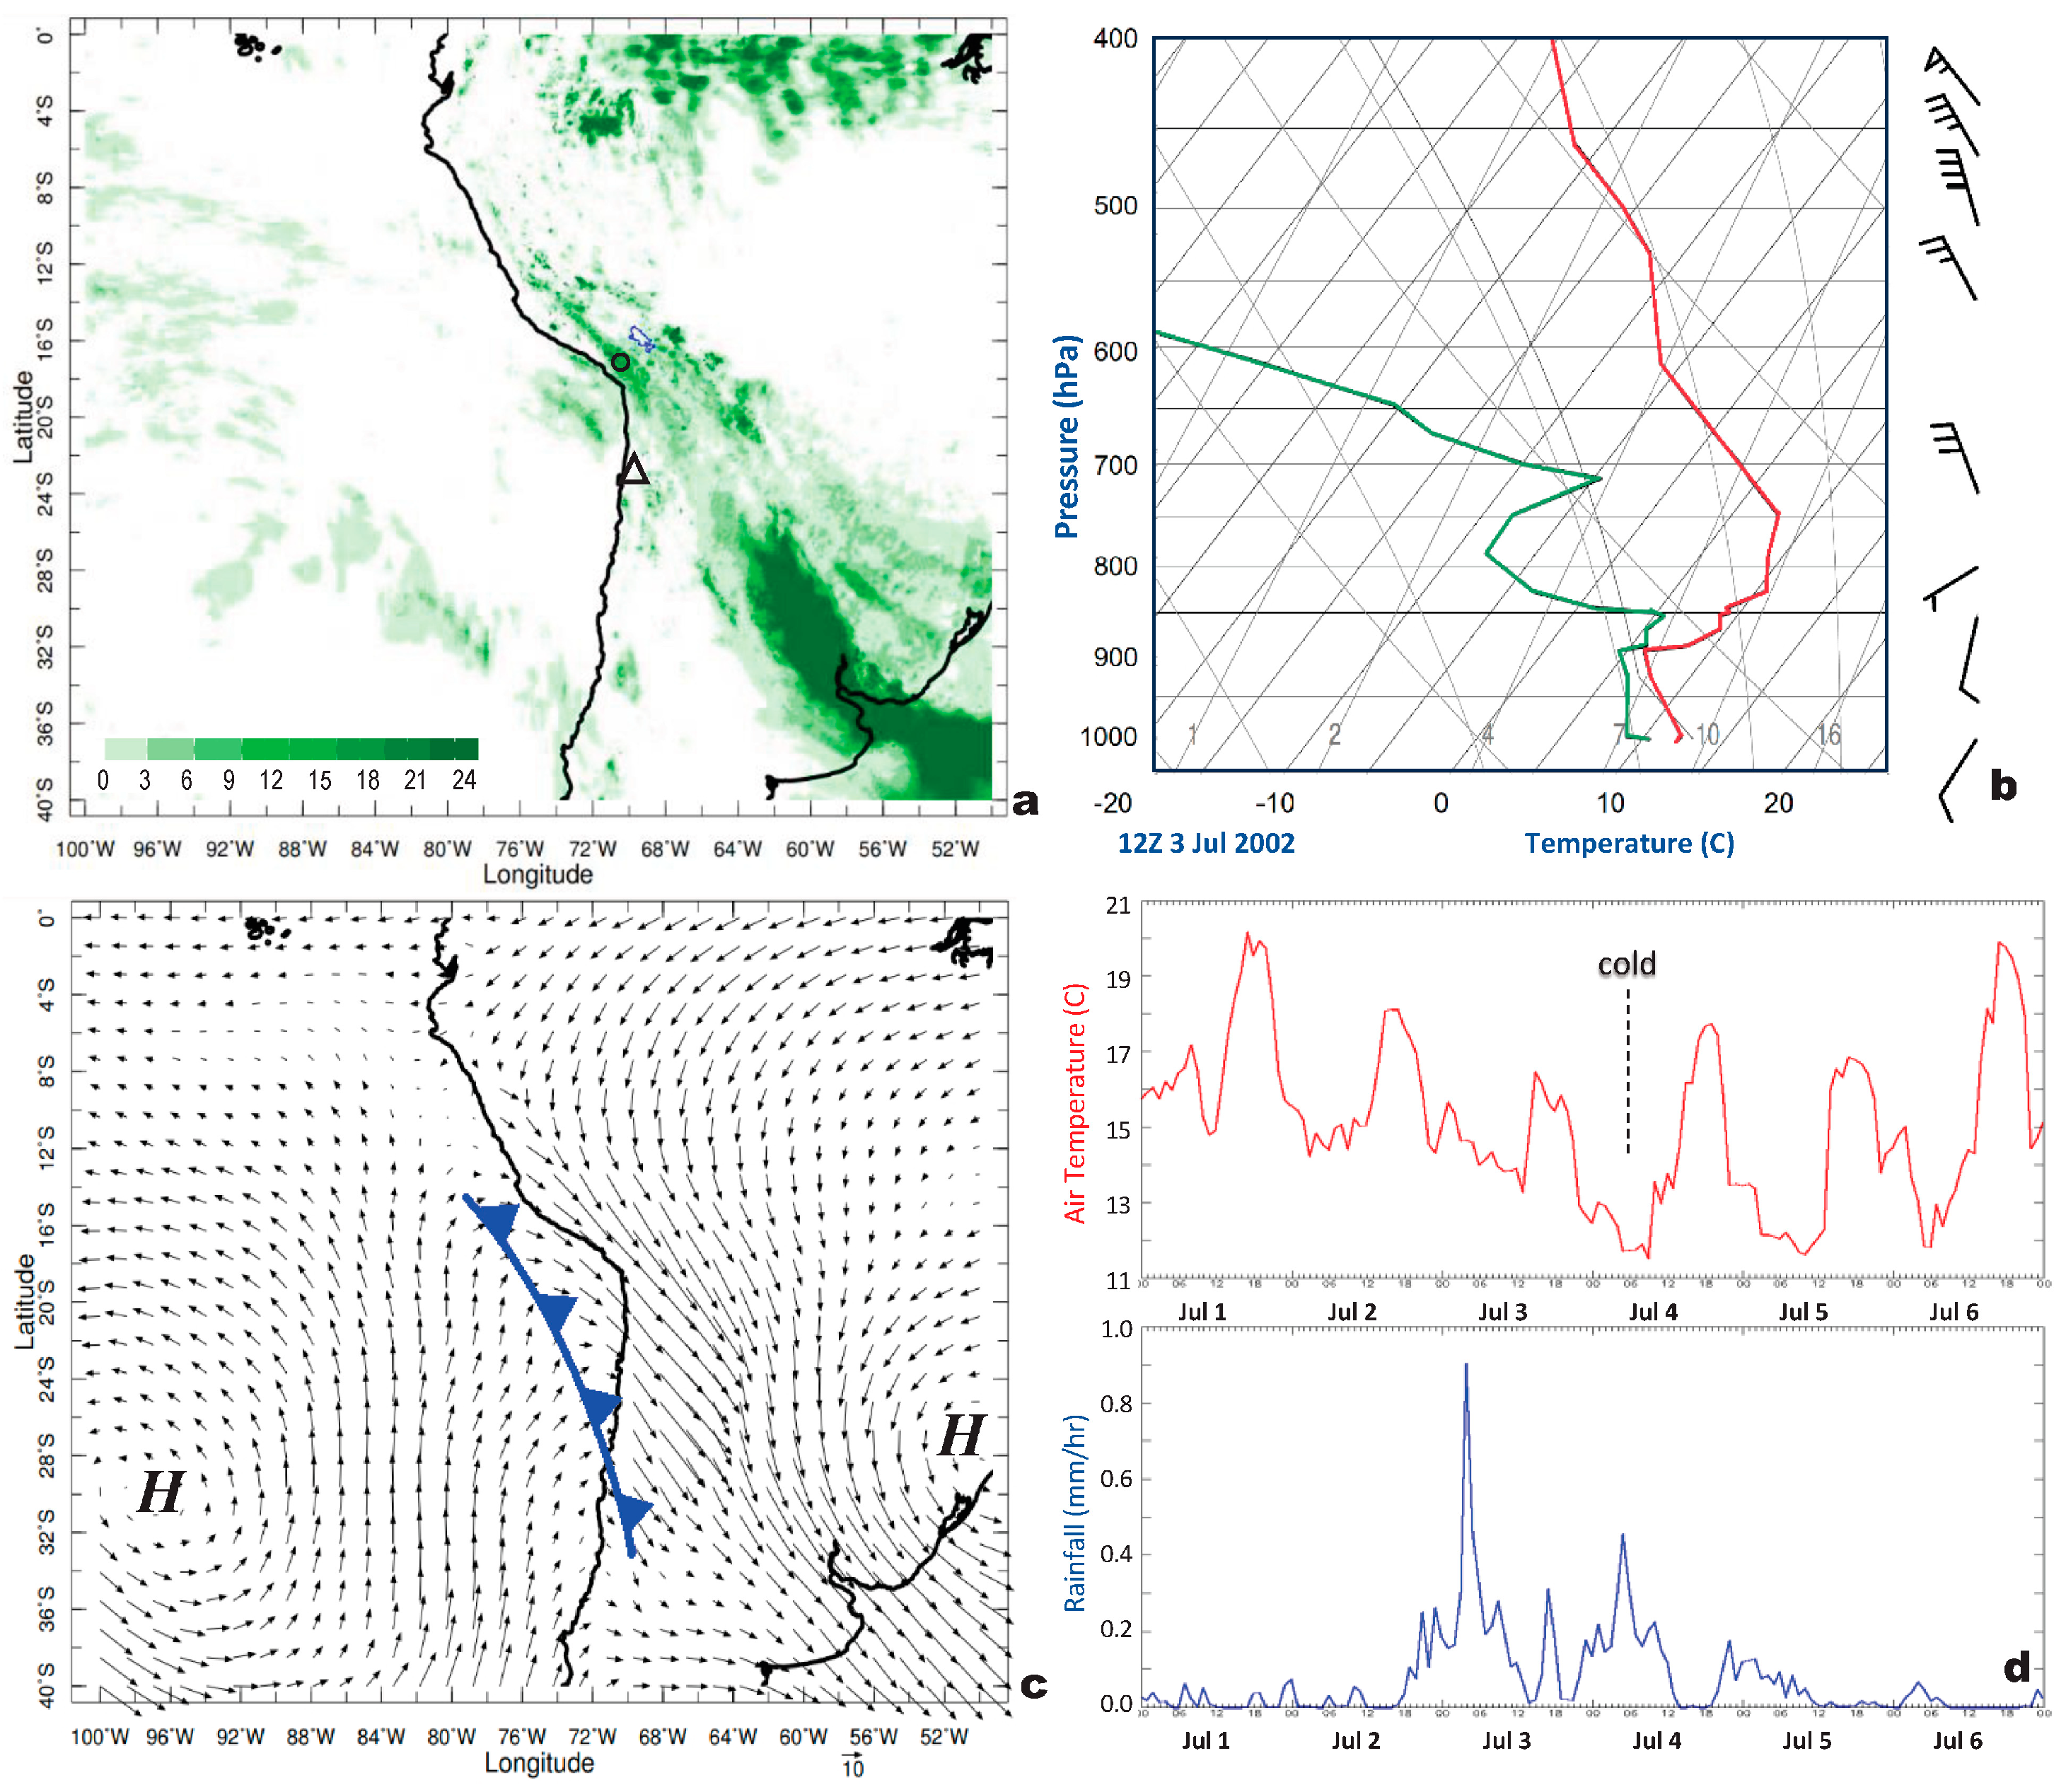
5. Winter Showers in July 2002 and 2009

In this section, the meteorology of winter wet spells in southwest coastal Peru is studied for two top-ranked events. The rainfall map for 3 July 2002 (Figure 6a) shows a NW cloud band extending along the Andes toward Argentina, similar to previous research findings [30]. A streak of showers intersects at Tacna, Peru. The radiosonde profile from northern Chile (Figure 6b) reveals a 1 km layer of unstable marine air below a weak inversion at 800 hPa. Frontal instability and strong NW winds are seen in the 700 hPa layer. The 600 hPa wind map (Figure 6c) reveals a sharp trough bracketed by mid-latitude highs to the west and the east. The trough amplitude is large relative to the wavelength (30 × 40°) and imparts cyclonic vorticity (−10−4 s−1) that sustains uplift. Another key feature is the downstream acceleration of NW winds. The hourly time series of air temperature and rainfall in Tacna (Figure 6d) reveal diurnal warming of 5 °C and evening showers of 0.5 mm/h on 2–3 July 2002. A frontal passage led to a cold snap of 12 °C on 4 July 2002, followed by dry weather.
A second winter wet spell is analyzed in Figure 7a–c. The zonal circulation on 21–22 July 2009 exhibits strong NW winds that accelerate over the Andes, pulling moisture upslope over the coastal plains. The Cloudsat reflectivity section reveals >35 dBz in a shallow layer (400–900 m) above Tacna. A secondary patch of reflectivity spreads inland from the coast at ~3000 m. Back-trajectories on 21–22 July 2009 derive from the nearby ocean, with many from WNW and others from SW looping over the coastal plains. Such trajectories are consistent with infrequent wet spells in the northern Atacama [30,31]. The marine moisture flux reaches 3 mm/day around the frontal trough. The long-term mean rainfall transect (Figure 7d) confirms that winter showers are received at elevations of 560–785 m, however much less is measured at gauges on the coast (30 m) and escarpment (1200 m).

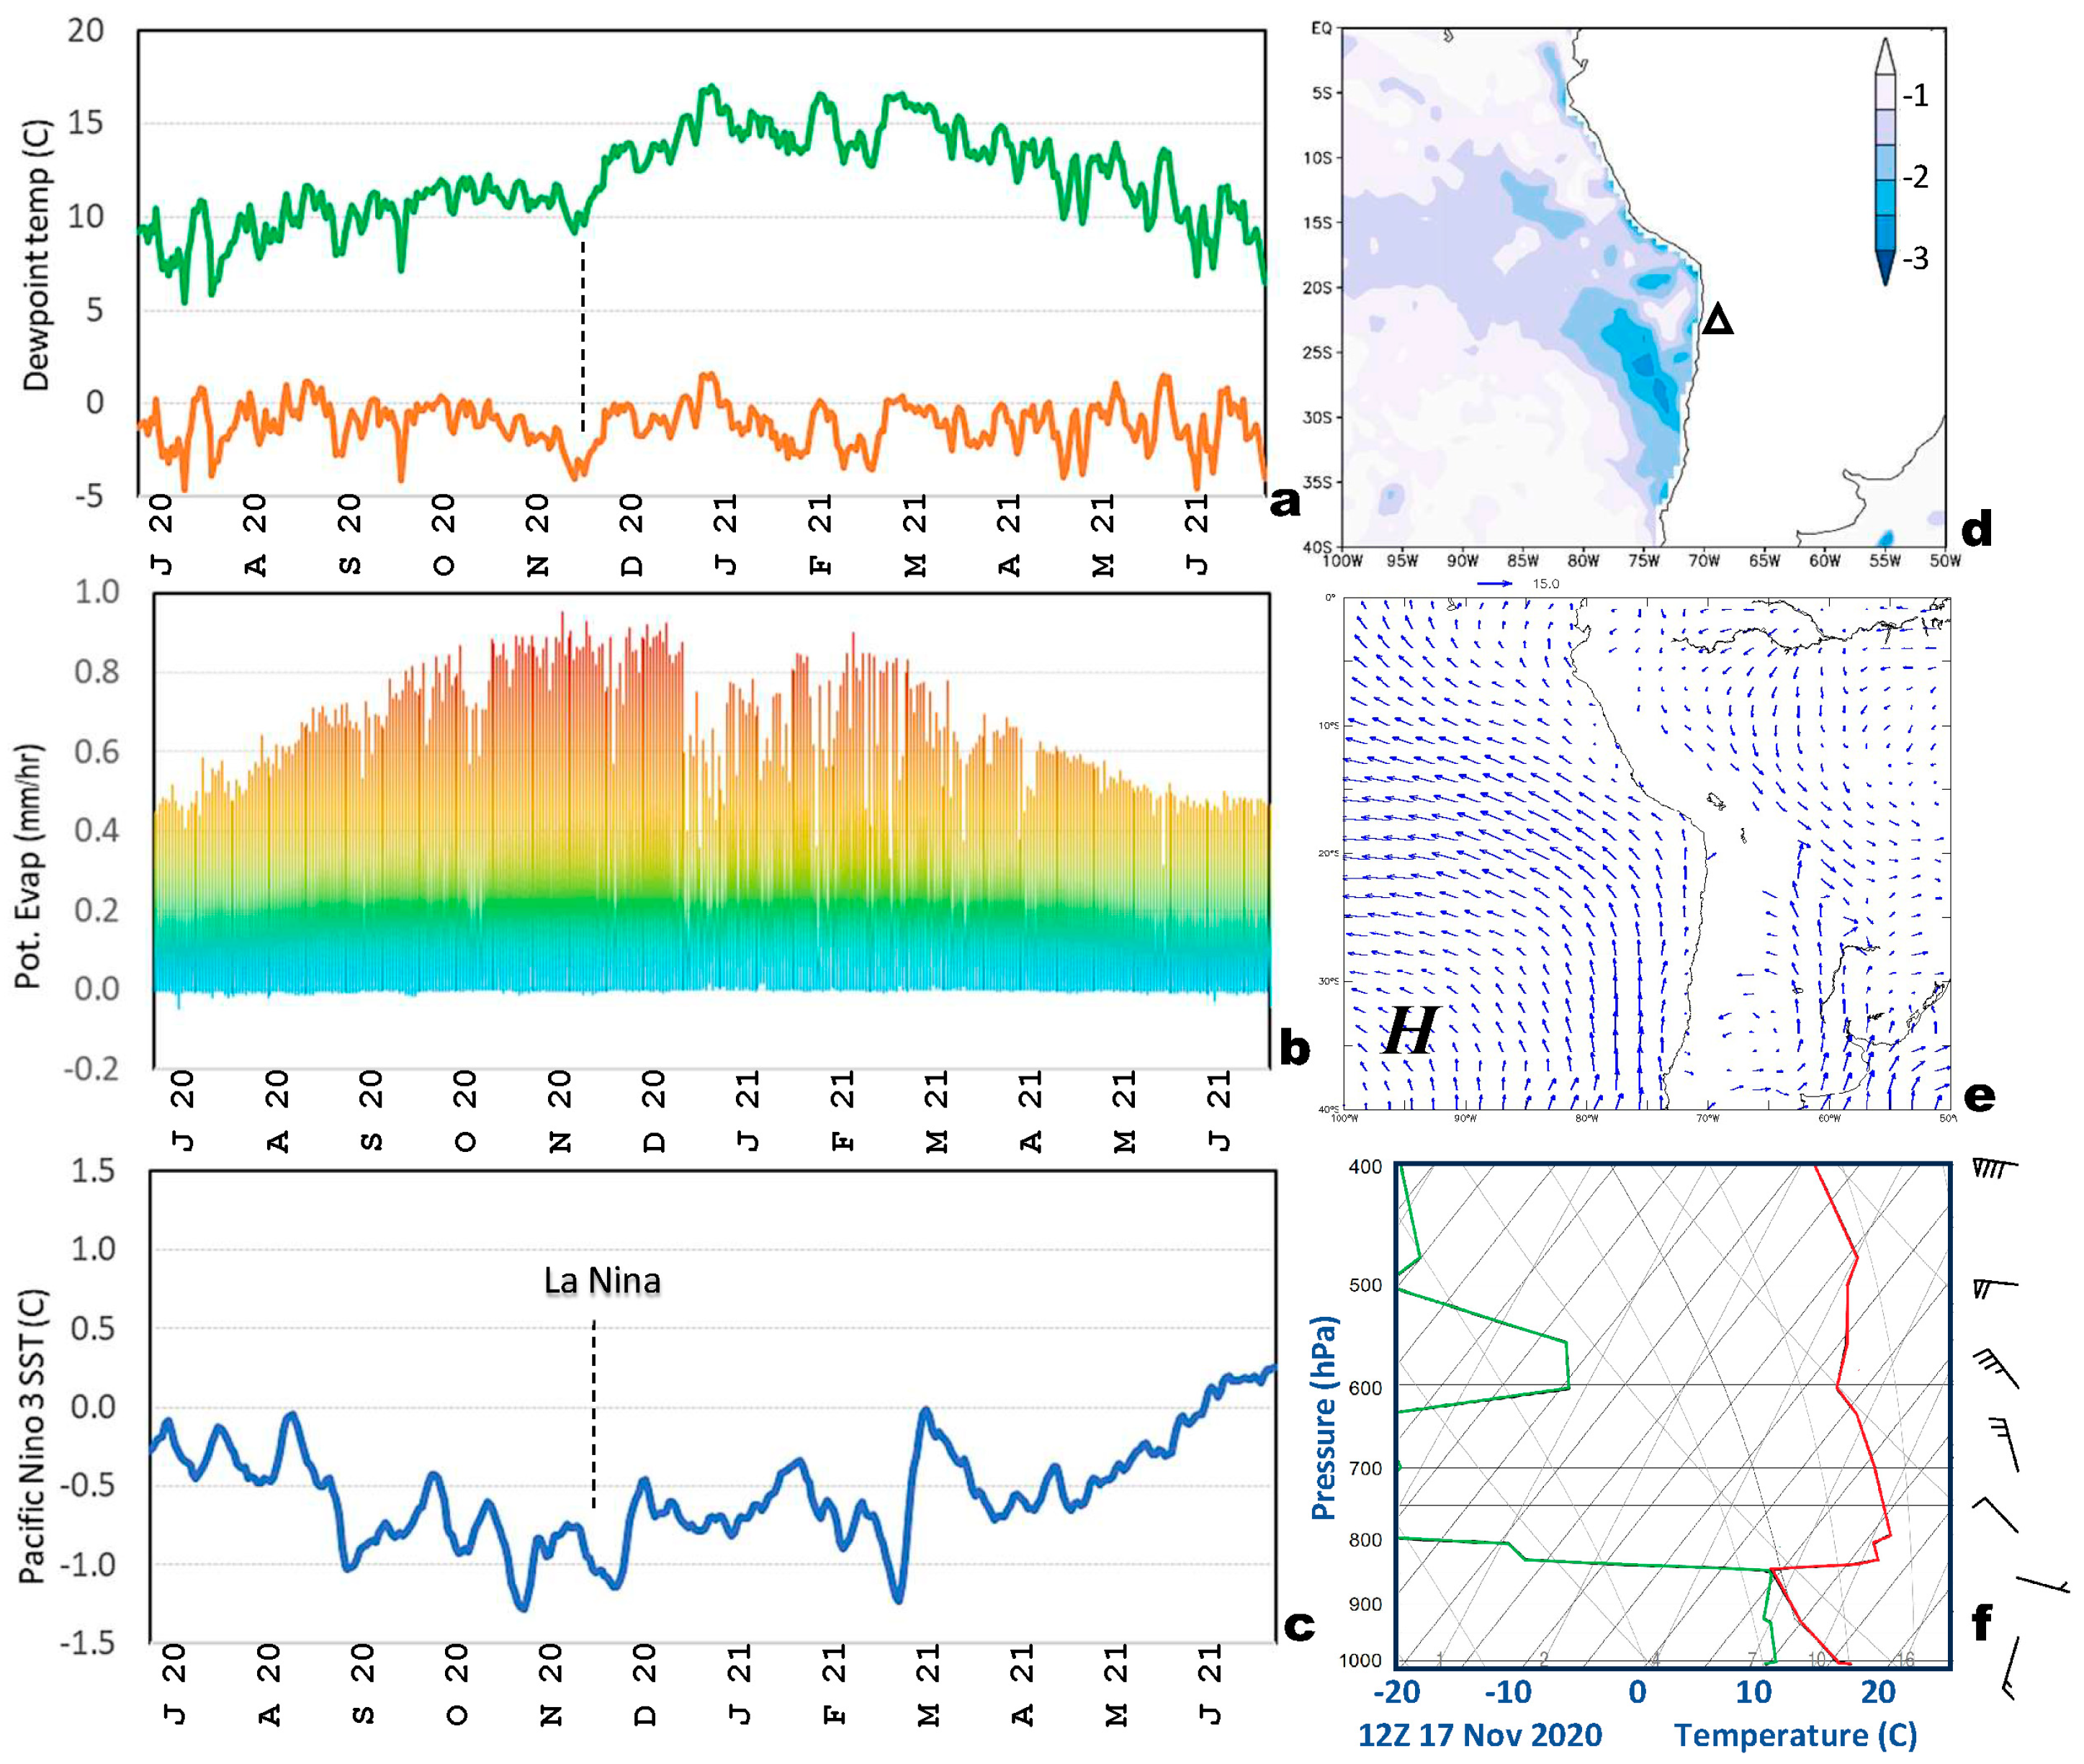
6. Dry Spell in November 2020

Having studied the coastal meteorology of winter showers, we turn our attention to desiccation in early summer during La Niña events. Ranking the daily time series of potential evaporation and dewpoint temperature in Tacna and Pacific Nino3 SST, a dry spell is noted in mid-November 2020 (Figure 8a–c). Mid-day potential evaporation rates of 1 mm/h correspond with dewpoint anomalies of −4 °C and Nino3 index values of −1 °C. Regional maps of SST anomalies and low-level winds are illustrated in Figure 8d,e. Plumes of cold upwelled water spread northwestward from the coast of Chile and Peru under 10 m/s southeasterly airflow around the subtropical anticyclone. The skew-T radiosonde profile shows a 7 °C inversion at 850 hPa and light easterly winds above the sea breeze. During this, dry spell ERA5 subsidence reached −2.3 cm/s at 700 hPa which entrain toward the surface and desiccate the coastal plains.

7. Concluding Discussion

Tacna, Peru, is a sentinel for climate variability on the northern edge of the Atacama Desert. Here, hourly to monthly 25 km resolution ERA5 fields that use coupled model physics to interpolate between coastal observations in SW Peru and global satellite measurements form a basis for study in the period of 1970–2022. Rainfall correlations between various gauge, satellite, and model products suggest spatial and temporal consistency and a ‘wet bias’ for ERA5 in early winter that is attributed to the inability of gauges to measure ‘mist’ that causes an uptick in the vegetation index. Coastal wind and upper air observations are quite limited; however, satellite feature tracking, vertical profiling, and microwave radiance lend confidence to interpretations on weather and climate processes coupled with ENSO.
Long-term analyses reveal an extremely arid landscape with warm coastal plains bracketed by the cool Pacific and Altiplano. Although sea breezes draw marine air inland, they simultaneously generate low-level divergence and subsidence aloft. Day-time potential evaporation rates of 1 mm/h during early summer contribute to water deficits that are rarely offset by late summer runoff. During the winter season (May–September), light showers from passing cold fronts sustain the meager water resources and boost vegetation growth (cf. Figure A1c). Those occur when potential evaporation losses are minimal (cf. Figure 3c) and may do more to replenish water resources than previously thought.
Wetter-than-normal winters were statistically linked with El Niño warming of the tropical east Pacific, accelerated subtropical westerlies, and a quasi-stationary Rossby wave pattern across the southeast Pacific (cf. Figure A1d and Figure A2; [28,32,33]). Under the right climatic conditions, the transient winter troughs may amplify near 70 W and generate winter stratiform clouds that ride above the stable surface layer. Two winter wet spells were studied in detail (July 2002, July 2009). Passing cold fronts accompanied by NW cloud bands induced light showers in elevations from 400 to 900 m due to orographic uplift within the onshore airflow. The Cloudsat slice (cf. Figure 7a) clearly revealed the localization of orographically lifted showers. Meteorological features needed to overcome the atmospheric subsidence and stability include: (i) a sharp trough over the subtropical southeast Pacific, (ii) moist NW inflow ahead of the cyclonic vortex, (iii) above-normal SST along the coast and tropical east Pacific, and (iv) local orographic ascent that drives stratiform clouds onto the coastal foothills (as noted in a previous study [31]).
An early summer dry spell was also considered (November 2020), wherein southeast winds, coastal upwelling, and dewpoint temperatures < 10 °C coincided with La Niña conditions. Extreme subsidence (−2.3 cm/s) is entrained into the boundary layer by divergent sea breeze airflow, desiccating the landscape as indicated by daytime potential evaporation losses of 1 mm/h. The long-term mean rain-gauge transect (cf. Figure 7d) indicated that summer convection stays east of the Andes escarpment and seldom benefits the coastal plains. Thus, water resources in Tacna are strained beyond the carrying capacity, and careful environmental management is needed to sustain the local population and agricultural production.

Funding

This research received no external funding.

Institutional Review Board Statement

Not applicable.

Informed Consent Statement

Not applicable.

Data Availability Statement

A data spreadsheet is available upon request.

Acknowledgments

I thank Carlos A Zavaleta-Caballero of University National Jorge Basadre Grohmann, Tacna, Peru, for valuable insights. Websites used for data extraction and analysis include: APDRC Univ Hawaii, Iowa Enviro-monitoring, IRI Climate Library, KNMI Climate Explorer, NASA–Giovanni, and NOAA Ready–ARL. Outcome-based support from the South African Dept of Higher Education via the University of Zululand is acknowledged.

Conflicts of Interest

The author declares no conflict of interest.

Appendix A

Figure A1. Monthly rainfall comparison (a) point-to-field correlation of ERA5 time series onto GPM rainfall during 2000–2022; (b) scatterplot of ERA5 vs. average of four gauges near Tacna during 1981–2022 (larger dots are winter months); (c) mean annual cycle of ERA5 and gauge, plotted in log-scale. For reference, the vegetation index in Tacna is illustrated; (d) point-to-field correlation map using gauge time series instead of ERA5 onto 500 hPa meridional wind field (blue-red shaded) and SST (grey shaded > 0.4), as in Figure 4b,d but in Mollweide projection, confirming the austral winter Rossby wave-train pattern (icon) during wet conditions in SW Peru associated with El Niño.
Coasts 04 00004 g0a1
Figure A2. Correlation of Tacna winter gauge-rainfall vs. ERA5 500 hPa meridional wind along 30S at lags −2, 0, and +2 months (top-down), illustrating the evolution of the southeast Pacific wave-train. Arrows emphasize poleward airflow. Vertical line is Tacna, Peru.
Coasts 04 00004 g0a2

References

  1. Drenkhan, F.; Carey, M.; Huggel, C.; Seidel, J.; Oré, M.T. The changing water cycle: Climatic and socioeconomic drivers of water-related changes in the Andes of Peru. Wiley Interdiscip. Rev. Water 2015, 2, 715–733. [Google Scholar] [CrossRef]
  2. Bradley, R.; Vuille, M.; Diaz, H.; Vergara, W. Threats to water supplies in the tropical Andes. Science 2006, 312, 1755–1756. [Google Scholar] [CrossRef] [PubMed]
  3. Eda, L.E.H.; Chen, W. Integrated water resources management in Peru. Procedia Environ. Sci. 2010, 2, 340–348. [Google Scholar] [CrossRef]
  4. Lettau, H. Dynamic and energetic factors which cause and limit aridity along South America’s Pacific coast. World Surv. Climatol. 1976, 12, 188–192. [Google Scholar]
  5. Rutllant, J. On the Extreme Aridity of Coastal and Atacama Deserts in Northern Chile. Ph.D. Thesis, Department of Meteorology, University of Wisconsin, Madison, WI, USA, 1977; 175p. [Google Scholar]
  6. Rutllant, J.; Ulriksen, P. Boundary layer dynamics of the extremely arid northern part of Chile. Bound. Layer Meteorol. 1979, 17, 41–55. [Google Scholar] [CrossRef]
  7. de Abreu, M.L.; Bannon, P. Dynamics of the South American coastal desert. J. Atmos. Sci. 1993, 50, 2952–2964. [Google Scholar] [CrossRef]
  8. Ramos, I.; Aliaga-Nestares, V.; Castro, A. Heavy snowfalls in the Peruvian Andes: The wettest winter of the last 19 years, in State of the Climate 2018. Bull. Am. Meteorol. Soc. 2019, 100, S203–S221. [Google Scholar]
  9. Bozkurt, D.; Rondanelli, R.; Garreaud, R.; Arriagada, A. Impact of warmer eastern tropical Pacific SST on the March 2015 Atacama floods. Mon. Weather Rev. 2016, 144, 4441–4460. [Google Scholar] [CrossRef]
  10. Montecinos, A.; Aceituno, P. Seasonality of the ENSO-related rainfall variability in central Chile and associated circulation anomalies. J. Clim. 2003, 16, 281–296. [Google Scholar] [CrossRef]
  11. Reyers, M.; Boehm, C.; Knarr, L.; Shao, Y.; Crewell, S. Synoptic-to-regional-scale analysis of rainfall in the Atacama Desert (18-26S) using a long-term simulation with WRF. Mon. Weather Rev. 2020, 149, 91–112. [Google Scholar] [CrossRef]
  12. Böhm, C.; Schween, J.H.; Reyers, M.; Maier, B.; Löhnert, U.; Crewell, S. Toward a climatology of fog frequency in the Atacama Desert via multispectral satellite data and machine learning techniques. J. Appl. Meteor. Climatol. 2021, 60, 1149–1169. [Google Scholar]
  13. Moat, J.; Orellana-Garcia, A.; Tovar, C.; Arakaki, M.; Arana, C.; Cano, A.; Faundez, L.; Gardner, M.; Hechenleitner, P.; Hepp, J.; et al. Seeing through the clouds–Mapping desert fog oasis ecosystems using 20 years of MODIS imagery over Peru and Chile. Int. J. Appl. Earth Obs. Geoinf. 2021, 103, 102468. [Google Scholar] [CrossRef]
  14. Pino, E.; Ramos, L.; Avalos, O.; Tacora, P.; Chávarri, E.; Angulo, O.; Ascensios, D.; Mejía, J. Factors affecting depletion and pollution by marine intrusion in the Yarada coastal aquifer of Tacna Peru. Technol. Sci. Water 2019, 10, 177–213. [Google Scholar]
  15. Huanacuni-Lupaca, C. Technical Report of the Water Resources Council for the Tacna Basin, Peru, 2021.
  16. Chucuya, S.; Vera, A.; Pino-Vargas, E.; Steenken, A.; Mahlknecht, J.; Montalván, I. Hydrogeochemical characterization and identification of factors influencing groundwater quality in the Tacna Peru coastal aquifer. Int. J. Environ. Res. Public Health 2022, 19, 2815. [Google Scholar] [CrossRef]
  17. Houston, J. Variability of precipitation in the Atacama Desert: Its causes and hydrological impact. Int. J. Climatol. 2006, 26, 2181–2198. [Google Scholar] [CrossRef]
  18. Vargas, G.; Rutllant JOrtlieb, L. ENSO tropical-extratropical climate teleconnections and mechanisms for Holocene debris flows along the hyperarid coast of western South America 17S–24S. Earth Planet. Sci. Lett. 2006, 249, 467–483. [Google Scholar] [CrossRef]
  19. Hersbach, H.; Bell, B.; Berrisford, P.; Hirahara, S.; Horányi, A.; Muñoz-Sabater, J.; Nicolas, J.; Peubey, C.; Radu, R.; Schepers, D.; et al. The ERA5 global reanalysis. Q. J. R. Meteo. Soc. 2020, 146, 1999–2049. [Google Scholar] [CrossRef]
  20. Hou, A.Y.; Kakar, R.K.; Neeck, S.; Azarbarzin, A.A.; Kummerow, C.D.; Kojima, M.; Oki, R.; Nakamura, K.; Iguchi, T. The Global Precipitation Measurement mission. Bull. Am. Meteorol. Soc. 2014, 95, 701–722. [Google Scholar] [CrossRef]
  21. Xiong, X.; Angal, A.; Chang, T.; Chiang, K.; Lei, N.; Li, Y.; Sun, J.; Twedt, K.; Wu, A. MODIS and VIIRS calibration and characterization in support of long-term high-quality data products. Remote Sens. 2020, 12, 3167. [Google Scholar] [CrossRef]
  22. Carton, J.A.; Chepurin, G.A.; Chen, L. SODA3: A new ocean climate reanalysis. J. Clim. 2018, 31, 6967–6983. [Google Scholar] [CrossRef]
  23. Rayner, N.A.A.; Parker, D.E.; Horton, E.B.; Folland, C.K.; Alexander, L.V.; Rowell, D.P.; Kent, E.C.; Kaplan, A. Global analyses of sea surface temperature, sea ice, and night marine air temperature since the late nineteenth century. J. Geophys. Res. 2003, 108, 4407. [Google Scholar] [CrossRef]
  24. Marchand, R.; Mace, G.G.; Ackerman, T.; Stephens, G. Hydrometeor detection using Cloudsat, an earth-orbiting 94-GHz cloud radar. J. Atmos. Ocean. Technol. 2008, 25, 519–533. [Google Scholar] [CrossRef]
  25. Stein, A.F.; Draxler, R.R.; Rolph, G.D.; Stunder, B.J.B.; Cohen, M.D.; Ngan, F. NOAA’s HYSPLIT atmospheric transport and dispersion modeling system. Bull. Am. Meteorol. Soc. 2015, 96, 2059–2077. [Google Scholar] [CrossRef]
  26. Zhang, T.; Hoell, A.; Perlwitz, J.; Eischeid, J.; Murray, D.; Hoerling, M.; Hamill, T.M. Towards probabilistic multi-variate ENSO monitoring. Geophys. Res. Lett. 2019, 46, 10532–10540. [Google Scholar] [CrossRef]
  27. Garreaud, R.; Muñoz, R. The diurnal cycle in circulation and cloudiness over the subtropical southeast Pacific: A modeling study. J. Clim. 2004, 17, 1699–1710. [Google Scholar] [CrossRef]
  28. Lou, J.; O’Kane, T.J.; Holbrook, N.J. Linking the atmospheric Pacific-South American mode with oceanic variability and predictability. Commun. Earth Environ. 2021, 2, 223. [Google Scholar] [CrossRef]
  29. Robertson, A.W.; Mechoso, C.R. Circulation regimes and low-frequency oscillations in the South Pacific sector. Mon. Weather Rev. 2003, 131, 1566–1576. [Google Scholar] [CrossRef]
  30. Bohm, C.; Reyers, M.; Knarr, L.; Crewell, S. The role of moisture conveyor belts for precipitation in the Atacama Desert. Geophys. Res. Lett. 2021, 48, e2021GL094372. [Google Scholar] [CrossRef]
  31. Vicencio-Veloso, J. Analysis of an extreme precipitation event in the Atacama desert in January 2020 and its relationship to humidity advection along the SE Pacific. Atmósfera 2022, 35, 421–448. [Google Scholar] [CrossRef]
  32. Solman, S.A.; Menendez, C.G. ENSO-related variability of the Southern Hemisphere winter storm track over the eastern Pacific–Atlantic sector. J. Atmos. Sci. 2002, 59, 2128–2140. [Google Scholar] [CrossRef]
  33. Sanabria, J.; Bourrel, L.; Dewitte, B.; Frappart, F.; Rau, P.; Solis, O.; Labat, D. Rainfall along the coast of Peru during strong El Niño events. Int. J. Climatol. 2018, 38, 1737–1747. [Google Scholar] [CrossRef]
Figure 1. Long-term mean analysis: (a) Topography and air–sea sensible heat flux (shaded < 0 W/m2) with place names and circle at Tacna, Peru; (b) ERA5 atmospheric boundary layer height on 18 S; (c) MODIS satellite color over land (vegetation fraction) and sea (chlorophyll mg/m3) with near-surface current vectors (max 0.1 m/s); (d) atmospheric circulation on 18 S with zonal vector (max 10 m/s) equatorward wind (contour > 1 m/s) and elevation profile; (e) ERA5 surface wind vector (max 5 m/s). Key features are identified.
Coasts 04 00004 g001
Figure 2. Long-term mean: (a) GPM multi-satellite rainfall; (b) ERA5 rainfall (blue), evapotranspiration supply (green), and potential evaporation demand (red) on 18 S compared with local gauges (symbols); (c) IR satellite surface temperature; (d) box-whisker plot of diurnal cycle of hourly ERA5 air temperature and U wind in Tacna, upper/lower bars indicate summer/winter; (e) night and daytime wind roses at Tacna airport, note different frequency rings.
Coasts 04 00004 g002
Figure 3. Time series in Tacna: (a) ERA5 daily rainfall, (b) mean annual cycle and terciles of rain (blue) and potential evaporation (red), (c) 18-month smoothed rain (blue) and potential evaporation (red), (d) rainfall wavelet spectra (shaded > 90% confidence) with cone of validity, (e) lag correlation of winter rainfall with Nino3 SST (n = 53, 95% confidence bands). Figure A1a–c compares ERA5 rainfall with other datasets.
Coasts 04 00004 g003
Figure 4. Tacna winter rainfall time series correlation with fields of: (a) 700 U zonal wind, (b) SST, (c) net OLR, and (d) 500 V meridional wind with wave-train icon; 1970–2022 (n = 53). Color bar (upper right) applies to all and highlights conditions associated with more winter rainfall; grey shading in (b) refers to r < −0.3 with soil moisture in the Amazon (dry).
Coasts 04 00004 g004
Figure 5. Correlation of Tacna daily winter rainfall > 0.5 mm/day with 500 geopotential height fields at (top–down) −4, −2, 0, and +2 day lags, illustrating slow northeastward progression of a high/low pair. The small circle in top panel is Tacna, here and elsewhere.
Coasts 04 00004 g005
Figure 6. A case of winter showers emerges from: (a) multi-satellite rainfall on 3 Jul 2002, (b) radiosonde skew-T profile, (c) 600 hPa wind circulation and weather icons, and (d) Tacna hourly time series of ERA5 air temperature (°C) and rainfall (mm/h). Triangle in (a) is the radiosonde station in northern Chile (23 S).
Coasts 04 00004 g006
Figure 7. (a) Cloudsat slice of reflectivity on 18 S during winter rainfall: 0 h 22 July 2009, with zonal circulation vectors (max 20 m/s), upper meridional wind (blue dashed < −6 m/s); (b) Ensemble back-trajectories for airflow arriving at Tacna 0–24 h 21 July 2009, and (c) corresponding surface moisture flux (shaded mm/day) and 850 hPa wind vectors (max 10 m/s) showing westerlies in the Andes. (d) Transect along 18 S of long-term mean annual cycle of gauge rainfall ( in panel (a)), Tacna airport = 70.4 W.
Coasts 04 00004 g007
Figure 8. Tacna time series 1 July 2020–30 June 2021 of: (a) dewpoint temperature (green) and anomalies, (b) hourly potential evaporation, and (c) Niño3 SST anomalies. Dashed line identifies dry spell of mid-November 2020. Regional maps on 16 November 2020 of: (d) SST anomalies and (e) 925 hPa wind field. (f) Radiosonde skew-T profile in northern Chile during the dry spell.
Coasts 04 00004 g008
Table 1. Dataset details, characteristics, and references.
AcronymName (Variables)Horz. Res.Reference Document
CloudsatSatellite microwave radar
(cloud reflectivity)
4 km[24]
ERA5European Reanalysis v5
(geopt ht, temp, wind, vertical motion, humidity, pot. Evap, net OLR)
25 km[19]
GPMGlobal Precipitation Monitoring (multi-satellite calibrated rainfall)10 km[20]
HADLEYHadley Centre reanalysis
(sea surface temperature)
100 km[23]
HYSPLITHybrid Lagrangian Trajectory model (airflow)50 km[25]
In-situWeather data around Tacna, Peru
(gauge and station data, radiosonde profile)
pointPeru/Chile
weather service
MODISMulti-spectral satellite imager
(land/sea temperature and color)
4 km[21]
NOAAENSO variables
(Nino3 SST)
25 km[26]
SODASimple Ocean Data Assimilation
(near-surface currents)
50 km[22]
Table 2. Ranked daily ERA5 winter rainfall in Tacna, * = case study. Most listings derive from successive pulses within multi-day events.
YearMonDayAmount
19925293.93
19925283.34
19925302.86
19768252.79
200273* 2.72
19927142.55
2002742.52
19768262.48
1993752.41
2010512.23
1993742.18
20146262.17
19927132.15
19836122.13
19768242.12
2015892.12
19835152.1
1992642.07
19835142.01
1986642.01
19926292
19837101.99
19838281.98
1983711.97
19838291.94
1992631.94
20059141.93
19927151.91
2002721.9
2009721* 1.90
1984871.9
Disclaimer/Publisher’s Note: The statements, opinions and data contained in all publications are solely those of the individual author(s) and contributor(s) and not of MDPI and/or the editor(s). MDPI and/or the editor(s) disclaim responsibility for any injury to people or property resulting from any ideas, methods, instructions or products referred to in the content.

