Article

Use of eDNA to Determine Source Locations of Deadly Jellyfish (Cubozoa) in an Open Coastal System

by
Scott J. Morrissey
1,2,*,
Dean R. Jerry
1,3,4 and
Michael J. Kingsford
1,2
1
Marine Biology and Aquaculture, College of Science and Engineering, James Cook University, Bebegu Yumba Campus, Townsville, QLD 4814, Australia
2
ARC Centre of Excellence for Coral Reef Studies, Bebegu Yumba Campus, Townsville, QLD 4814, Australia
3
Tropical Futures Institute, James Cook University, Singapore 387380, Singapore
4
ARC Research Hub for Supercharging Tropical Aquaculture through Genetic Solutions, Bebegu Yumba Campus, Townsville, QLD 4814, Australia
*
Author to whom correspondence should be addressed.
Coasts 2024, 4(1), 198-212; https://doi.org/10.3390/coasts4010011
Submission received: 12 December 2023 / Revised: 27 February 2024 / Accepted: 1 March 2024 / Published: 5 March 2024

Abstract

:
Challenges associated with cubozoan jellyfish detection and the limitations of current detection techniques limit the ability of scientists to fill critical knowledge gaps surrounding their ecology. Environmental DNA (eDNA), however, has proven useful as an ecological survey tool to detect and study these deadly jellyfish. This study aimed to leverage the power of eDNA to detect and explore the distribution of the Australian box jellyfish (Chironex fleckeri), encompassing both its medusae and polyp life history stages, within an open coastal bay (Horseshoe Bay) of Magnetic Island, Queensland, Australia. Our investigation focused on a hypothesis concerning the source locations of the jellyfish within Horseshoe Bay and, through a comparison of both life history stage distributions, aimed to determine potential population stock boundaries. eDNA results aligned with the predicted nearshore distribution of medusae. Further, the elusive benthic polyp stage was also detected. These findings confirmed Horseshoe Bay as a source location of the jellyfish. Moreover, our evidence supported a model that the area likely represents a population stock of the species. This adds to growing evidence suggesting some cubozoan jellyfish have population stocks of small spatial scales in both open and relatively closed ecosystems such as estuaries. In conclusion, this study serves as a notable example of eDNA’s ability to resolve critical knowledge gaps surrounding cubozoan ecology and to enhance the management ability of these deadly jellyfish to reduce envenomations.

1. Introduction

Stinging jellyfish pose a global issue due to their threat to human health and their subsequent economic impacts [1,2,3,4,5,6,7,8,9,10]. Cubozoan jellyfish, known for their potent venom, are the class of most concern [4,11,12,13]. Of these taxa, the Australian box jellyfish, Chironex fleckeri, is the most notorious, and is responsible for more than 200 recorded deaths in the Indo-Pacific region [14]. The presence of these stinging jellyfish leads to extensive beach closures, which significantly impacts upon local tourism industries and consequently, local economies [3]. However, due to their elusive nature and the challenges associated with their detection, mitigating and managing their threat is a ‘wicked’ problem [4,15,16]. To enhance the ability of stakeholders to effectively manage these taxa, it is important to gain a greater understanding surrounding their ecology [11]. The more that is known surrounding these taxa, the more informed and appropriate management solutions can be applied.
Considerable knowledge gaps, namely, understanding surrounding population dynamics, distribution limits, and the locality of benthic life history stages (polyps), exist surrounding the ecology of cubozoan jellyfish [11,14,17]. Importance is placed upon understanding the locality of polyps as they are the source of stinging medusa and, given their asexual characteristics [18], play a major role in the population dynamics and distributional limits of cubozoans [11,17,18,19,20]. Additionally, growing evidence suggests that population stocks of some of the ~50 cubozoan species [21] are of small spatial scales and therefore the locality of the polyp stage is central to this understanding [17,22,23,24,25,26]. The ability to study these aspects of cubozoan ecology, however, are logistically challenging to undertake. This is due to limitations of current detection/sampling techniques which hinder the ability of scientists to fill these critical knowledge gaps. Environmental DNA (eDNA), however, provides a new approach to investigate the ecology of these dangerous taxa [27,28,29,30,31].
A highly specific and sensitive eDNA detection assay has recently been developed for Chironex fleckeri [29]. This detection tool was successfully utilised as an ecological survey tool and successfully detected the elusive benthic polyp life history stage of the species [28]. Morrissey et al. [28] putatively detected the polyp stage of C. fleckeri and further examined this life history stage’s potential habitat. Polyps were detected in habitats with rocky substrata and shallow carbonate reefs. Further, Morrissey et al. [28] utilised the genetic tool to contribute to an understanding of population stock boundaries of the jellyfish in a relatively enclosed estuarine system (Port Musgrave, Australia) [26]. The results from eDNA largely concurred with the results of a biophysical modelling and jellyfish behaviour study indicating low connectivity from Port Musgrave and a source of polyps that were only found in the estuary [28].
In contrast, C. fleckeri is also found in a relatively open coastal system at Magnetic Island, situated off the coast of North Queensland, Australia. The island is not only of interest ecologically, but it is a tourism hotspot where cubomedusae co-occur with swimmers and are responsible for beach closures during the Australian box jellyfish season (October–May) (pers. comms. Surf Life Saving Queensland, SLSQ). Multiple coastal bays on the island are monitored and patrolled by local management authorities (SLSQ) due to the threat posed by cubozoan jellyfish. Horseshoe Bay, which is located on the northern side of the island, is a recognised hotspot for C. fleckeri medusae and it has been hypothesised as a source location of the jellyfish [32]. This hypothesis arose from a multiyear study undertaken by Brown [32], who examined the distribution and movements of the species’ medusae stage on Magnetic Island. Brown [32] made visual surveys around the entire island and noted that C. fleckeri medusae appeared firstly within the vicinity of Horseshoe Bay during November, the start of the Australian box jellyfish season, and from December onwards, individuals were encountered in neighbouring bays, although in considerably lower abundance. Furthermore, Brown [32] noted that small juvenile C. fleckeri individuals were only found within Horseshoe Bay whereas larger specimens were found at multiple locations around the island. From these findings, Brown [32] hypothesised that Horseshoe Bay was the source location of the species for the island and, therefore, most likely contained the polyp life history stage of the species. eDNA, as it can detect putative presence of nearby polyps, therefore allowed for the testing of components of this hypothesis [27,29]. Further, as C. fleckeri medusae have largely been observed along the north side of Magnetic Island, primarily within Horseshoe Bay, it is possible that the area may represent a local stock of the jellyfish. This provides an opportunity to test a developing paradigm that C. fleckeri commonly have population stocks of small spatial scales [17,22,26,28].
The objective of this study was to utilise eDNA to detect and study the Australian box jellyfish, C. fleckeri, in an open coastal system, contrasting that of Morrissey et al. [28] (semi-enclosed system). Specifically, we aimed to determine (i) the presence and localised distribution of the species’ medusae stage, (ii) the source of medusae by examining the distribution of polyps in the absence of medusae, and (iii) compare medusae and polyp distributions to infer likely population concentrations and boundaries. Further, the results of our sampling will allow us to contribute to knowledge on the spatial scales of C. fleckeri populations.

2. Materials and Methods

2.1. Study Area

This study was conducted within and near a group of open coastal bays at Magnetic Island, Australia (19.11° S, 146.85° E). Horseshoe is the largest bay, and to the west and outside of Horseshoe Bay is Maud Bay (Figure 1). Horseshoe Bay, in particular, is a hotspot for tourism where Chironex fleckeri medusae are known to reside during the Australian box jellyfish season (October to May). Surf Life Saving Queensland (SLSQ) monitors this area through undertaking daily beach tows, within and outside of the local stinger net (preventative measure to provide a safe, jellyfish-free swimming area), covering ~150 m of shoreline. These beach tows provided information on the presence or absence of C. fleckeri medusae in the study area. Additionally, oceanographic data exist for Horseshoe Bay (pers. comms JA Schlaefer). Both Horseshoe and Maud Bays have some freshwater inflows which become isolated during low tide (tidal range 3.4 m).

2.2. Field Sampling

The sampling was divided into two temporal windows as follows; October to May, when medusae are present (Australian box jellyfish season), and July to September, when medusae are absent. Sampling took place between 2020 and 2022. It has been predicted from other studies that medusae will be most abundant close to shore [32,33], and that sites with freshwater inflows may be a source of medusae from benthic polyps [34,35]. Within the Australian box jellyfish season, spatial variation in the distribution of medusae was determined by sampling for eDNA. Initially, sampling was undertaken at sites located along the shores of Horseshoe and Maud Bays resulting from their known nearshore distribution (Figure 1, December 2020 and February 2021). Samples were also collected within and at the mouths of freshwater inflows into these bays (the flora and landform of Horseshoe Bay are shown in Figure S1). It was possible that medusae could move outside the open coastal bays. To detect this potential scenario, samples were collected in a grid design across the bays and positioned at three distances from shore (Figure 1, March 2021 and December 2021). This sampling design also allowed us to examine whether any eDNA signal was being transported out of the bay. eDNA sampling for medusae detection was conducted concurrently with SLSQ’s detection of C. fleckeri medusae using beach tows.
The distribution of polyps could only be determined in the absence of medusae [28]. The seasonality of C. fleckeri medusae is well established with medusae only being present during summer months (October to May) [11,34,36,37]. Accordingly, sampling for eDNA was undertaken in the austral winter (July 2020, Figure 1). Polyps were detected in winter, and a modified sampling design in July 2022 gave greater sampling effort in and near sites where polyps had been detected, and some emphasis was given to sites with freshwater inflows within Horseshoe Bay. Samples were collected within the freshwater inflow when connected (sites 6, 8, and 10) and when isolated (sites 7, 9, and 11) by the tide and along the shore of Horseshoe Bay. An offshore site (site 14) acted as an in situ negative control and a 100 × 16 m beach seine net drag (mesh size of 3 cm) was utilised at all sites along the shore of Horseshoe Bay to further confirm the absence of medusae.
For each site, 2 L replicate water samples were collected and filtered immediately in the field and were stored in Longmires buffer at temperatures of 4 °C until processed. An equipment control, prior to sample collection, was also undertaken for each replicate sample to ensure the sampling equipment was not contaminated. Specific details surrounding collection, handling, and storage of eDNA samples can be found in Morrissey et al. [29]. Further, a conductivity, temperature, and depth device (CTD; Seabird SBE 19 Plus) was utilised at each sample site to examine the level of stratification, as this is known to have an influence upon eDNA within the water column [38,39].

2.3. eDNA Extraction and Purification

Collected eDNA samples were extracted using the PPLPP method, initially developed by Edmunds and Burrows [40] and subsequently modified for filter-based extractions by Cooper, Huerlimann [41]. Following extraction, the eDNA underwent purification utilising the Zymo One Step PCR Inhibitor Removal kit (Zymo IR; Zymo Research; Irvine, CA, USA) in accordance with the manufacturer’s instructions. The resulting eDNA, now purified, was then stored under −20 °C conditions until the quantification process. Specific details surrounding eDNA extractions and purifications can be found in Morrissey et al. [29].

2.4. Quantitative PCR

This study utilised a multiplexed assay, developed by Morrissey et al. [29], for the identification, quantification, and interpretation of Chironex fleckeri eDNA. To assess method success and for potential PCR inhibitors, an endogenous control assay was multiplexed with the C. fleckeri specific assay [29]. qPCR reactions were composed of 2 μL of eDNA template, 10 μL of TaqMan Environmental Master Mix 2.0, 0.7 μM sense and anti-sense C. fleckeri primers, 0.525 μM sense and anti-sense endogenous control primers, 0.25 μM of both C. fleckeri and endogenous control TaqMan MGB probes (assay sequences listed in Table S1). MilliQ water was added to adjust the final volume to 20 μL. Utilising the QuantStudio 3 and 5 Real-Time PCR systems, each reaction followed a two-step cycling profile (95 °C for 10 min, succeeded by 50 cycles of 95 °C for 15 s and 60 °C for 1 min). Six technical replicates were performed for each sample to ensure precision. Additionally, each plate included at least three negative controls, extraction blanks, a positive control, and synthetic DNA (sDNA) standards (10 thousand to one copy μL−1) to ensure lack of contamination and consistency among plates. The criteria for confirming positive detection of C. fleckeri involved the amplification of a single technical replicate. The decision to consider a single positive technical replicate as indicative of species presence is common for eDNA detection of cryptic and low-abundance species [41,42,43,44,45]. Additionally, zeroing single technical replicate detections in an ad hoc manner may introduce uncertainties, biases, or type II errors into subsequent analyses [46]. Any positive findings were substantiated through clean up and bidirectional sanger sequencing of PCR product, undertaken by the Australian Genome Research Facility. The results were cross-checked against reference sequences to ensure accuracy.

2.5. Statistical Analysis

Replicate filters (n = 2) were treated as subsamples. Positive technical replicates from each replicate water sample were averaged to represent the eDNA concentration (copies L−1) at each sample site [47,48,49]. The average provided a more representative snapshot of Chironex fleckeri presence in the study area. Additionally, detections were also reported as number of positive technical replicates out of 12 per sampling site, hence, two measures of positive detection of Chironex fleckeri eDNA are presented.

3. Results

3.1. Seasonality of Chironex fleckeri Medusae within Horseshoe Bay

The detection of Chironex fleckeri in beach tows is known to be highly seasonal within Horseshoe Bay. Medusae were only present in summer months (October–May) in each year of sampling (pers. comms. Surf Life Saving Queensland). The seasonality of C. fleckeri medusae is additionally well established [11,34,36,37]. The absence of observations of medusae and stings confirmed the absence of the taxa’s medusae stage during winter months (June–September). Additionally, no medusae were captured in beach seine net drags at any Horseshoe Bay sites that were sampled during the July 2022 sampling time. This sampling regime established the ground truth that C. fleckeri medusae are only present during summer months, and thus any detections during winter months are most likely eDNA shed from C. fleckeri polyps rather than medusae.

3.2. Detection and Distribution of Chironex fleckeri Medusae

3.2.1. Nearshore Detection of Chironex fleckeri Medusae

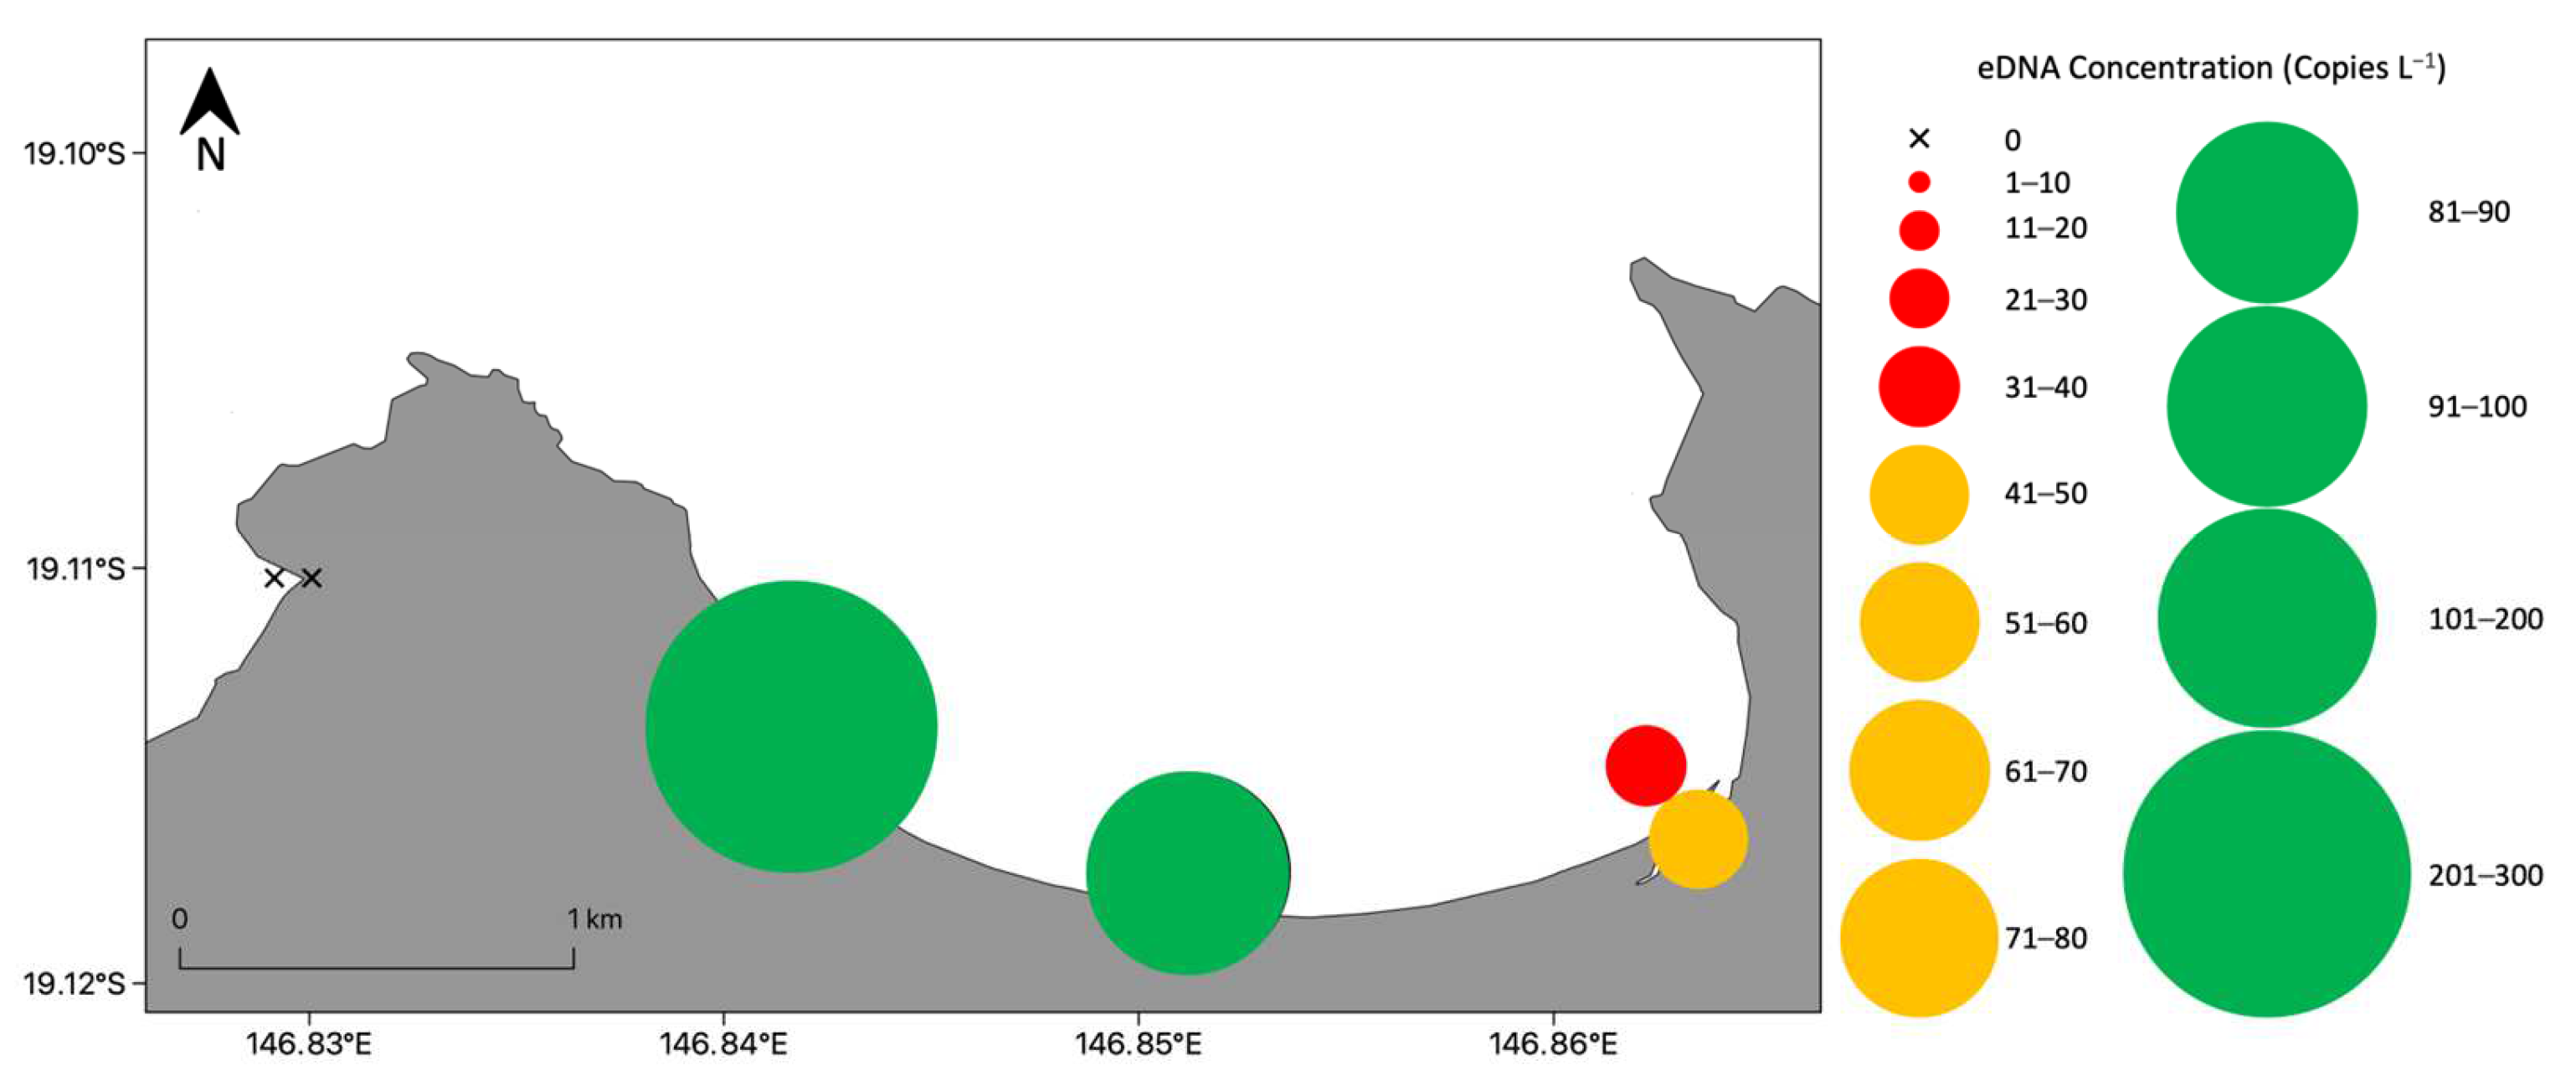
Chironex fleckeri eDNA was detected along the shores of both Horseshoe and Maud Bays in 2020 and 2021 (Figure 2 and Figure 3). In the summer of 2020 (December), eDNA was exclusively found within Horseshoe Bay, with increasing concentrations observed along the shore to the western end of the bay (Figure 2, sites 16–19). Detection was noted in 22.9% of technical replicates from positive sample sites, with eDNA copies L−1 ranging from 32 to 275.6 copies L−1 (Table S2).
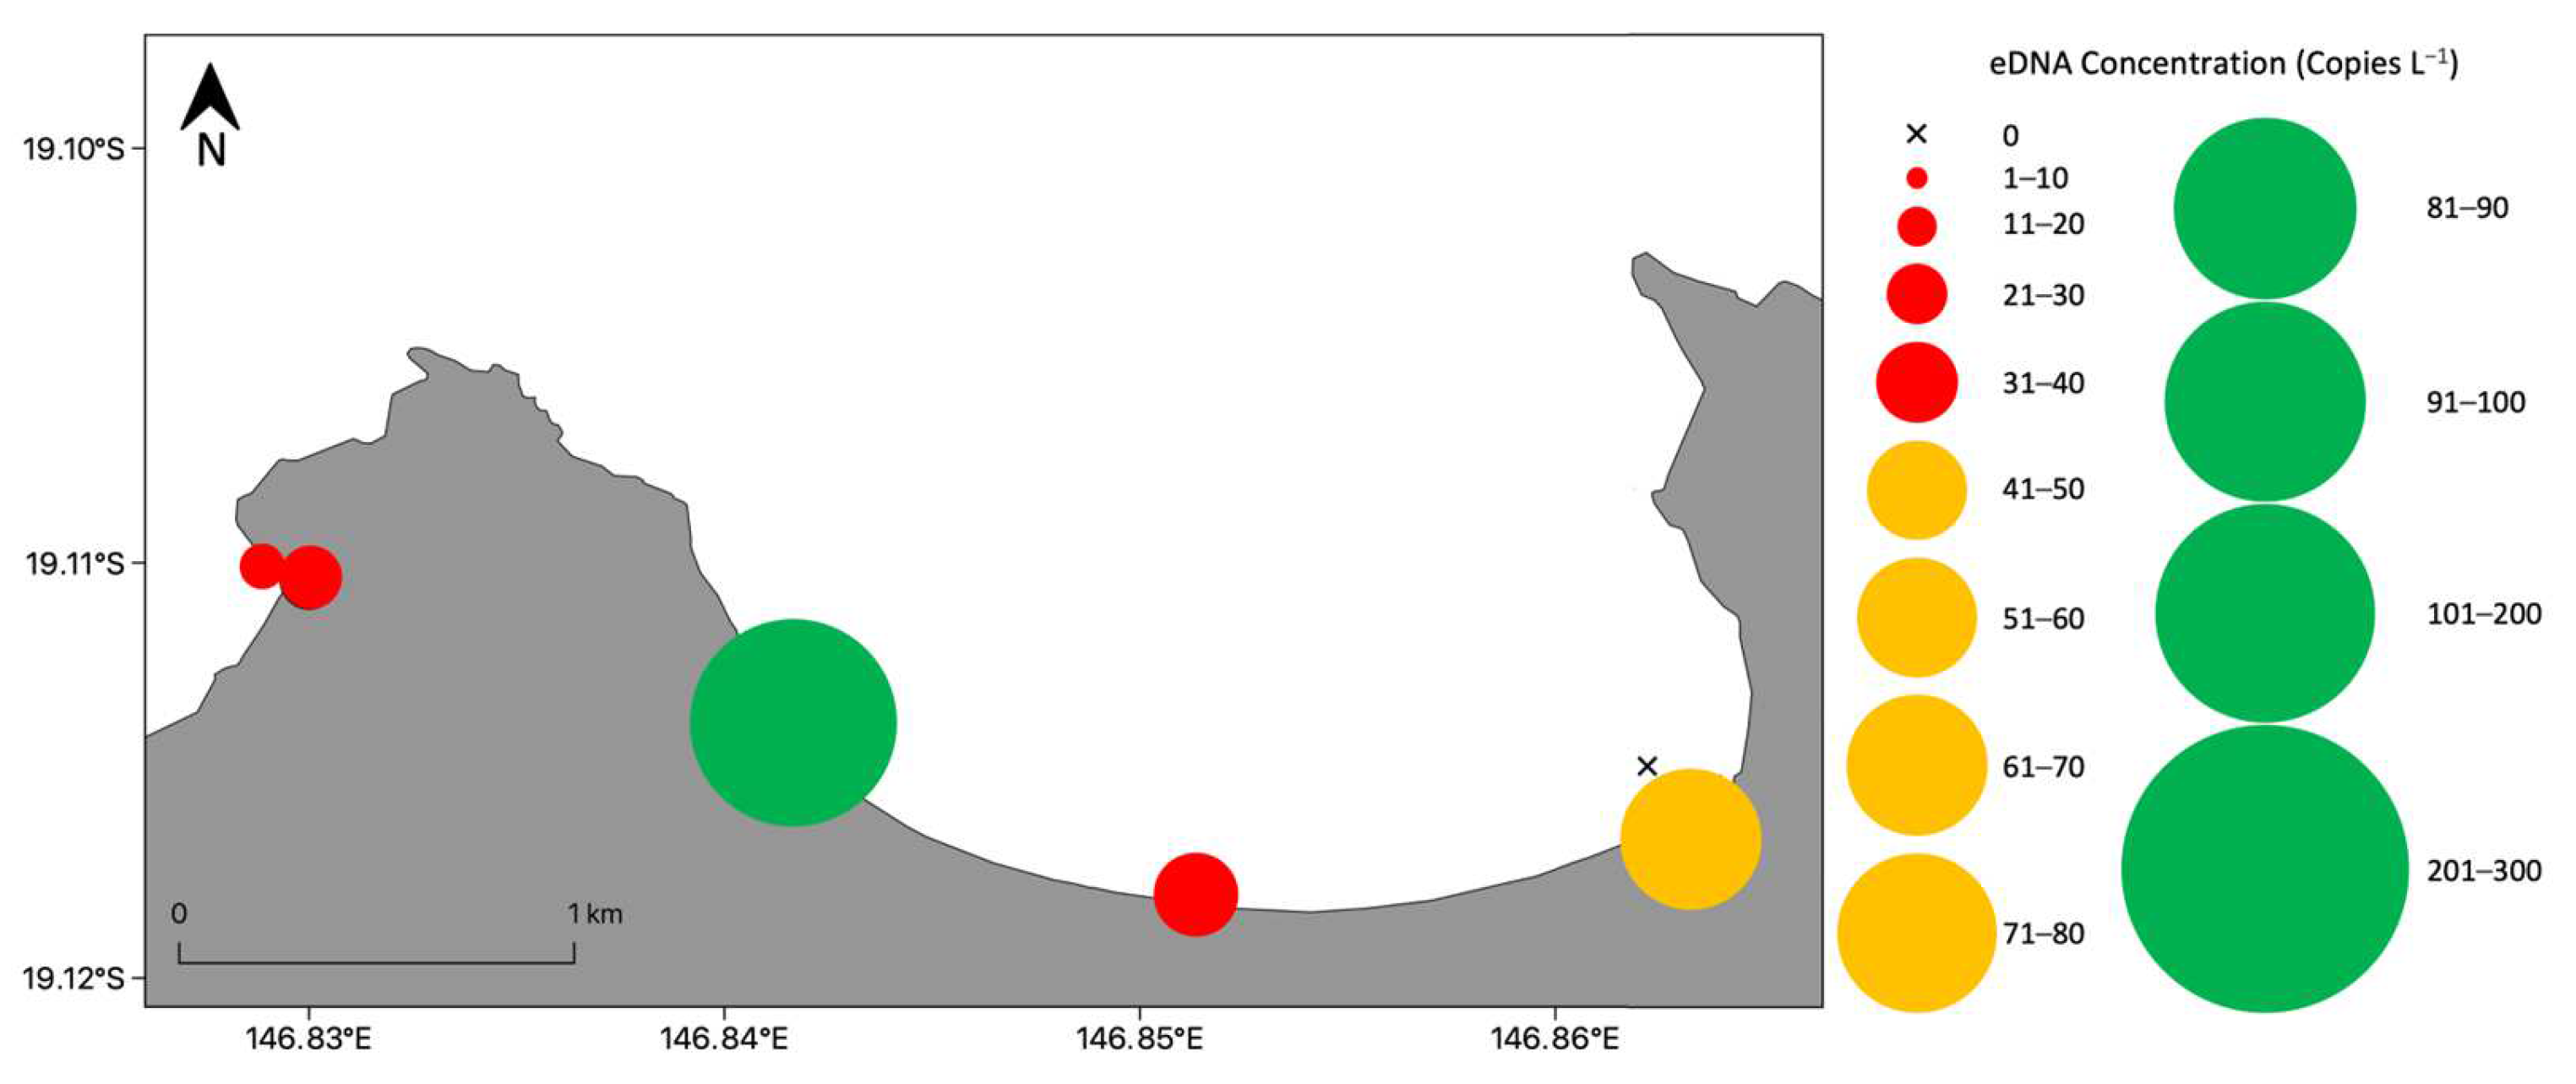
Two months later (i.e., February 2021), C. fleckeri eDNA was again detected within Horseshoe Bay. Additionally, eDNA was detected in Maud Bay close to this bay’s freshwater inflow (Figure 3). During this sampling time, detection was found in 15% of technical replicates from positive sample sites, with eDNA copies L−1 ranging from 17.8 to 92.4 copies L−1 (Table S2). Notably, eDNA concentrations were generally lower during that sampling period (exception of site 6). Equipment controls for both sampling times verified the lack of contamination, while the endogenous control affirmed method success.
Temperatures and salinities were similar throughout the study area within each sampling period (December 2020; 29–31.1 °C and 36.2–36.4 ppt, February 2021; 29.8–30.3 °C and 32.4–33.8 ppt). Lower salinities were observed in February, likely due to rainfall in the week preceding sampling. No stratification of the water column in temperature or salinity was detected in water depths of 0.4–3.1 m (Figures S2 and S3).

3.2.2. Bay Wide Sampling Design for Chironex fleckeri Medusae

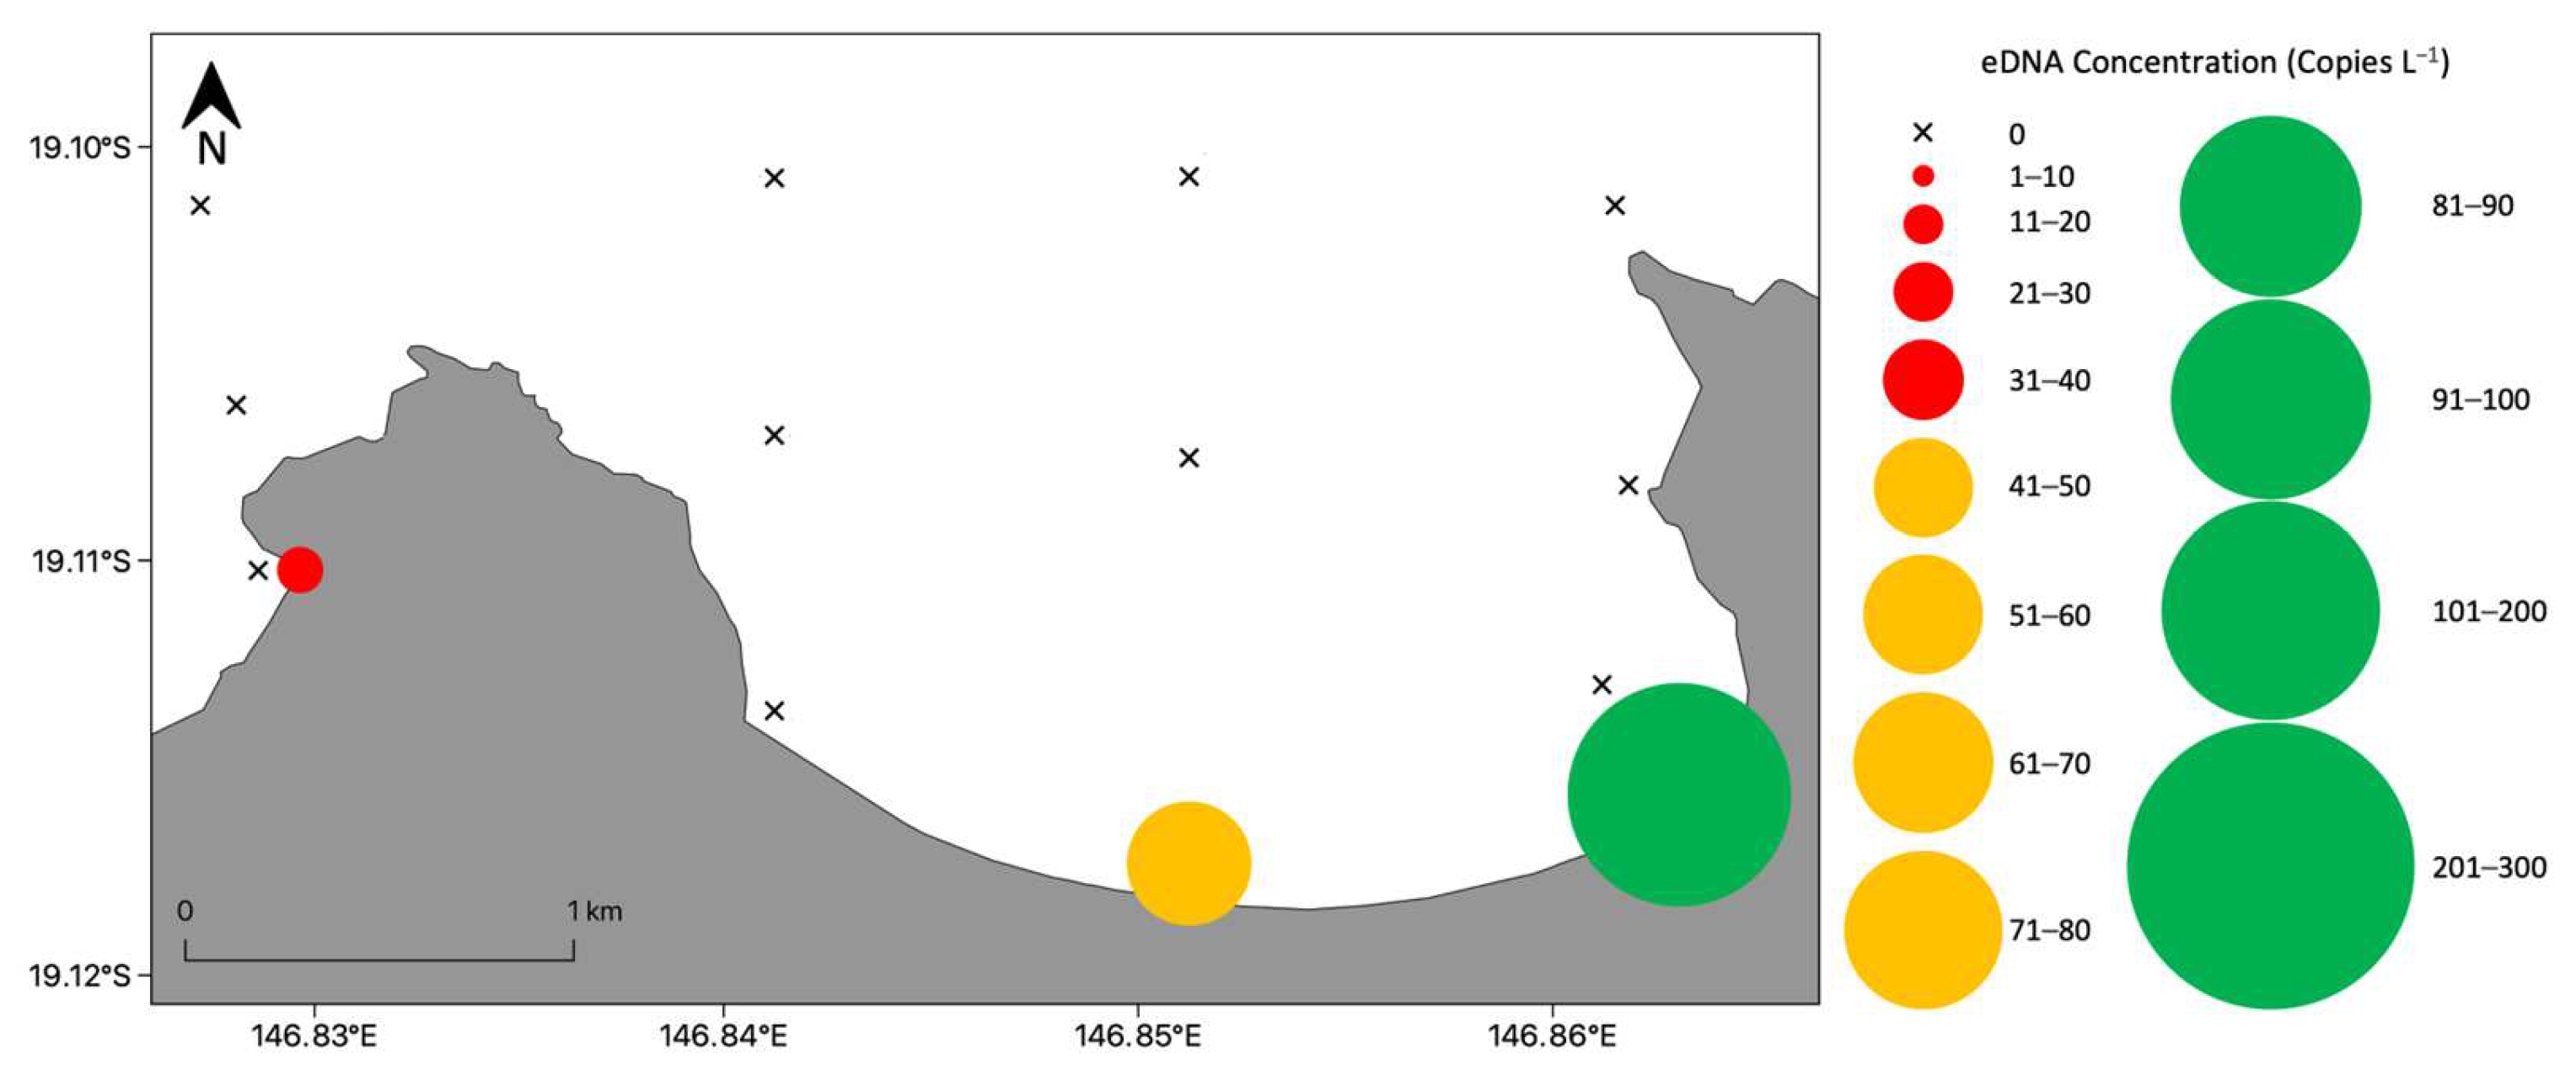
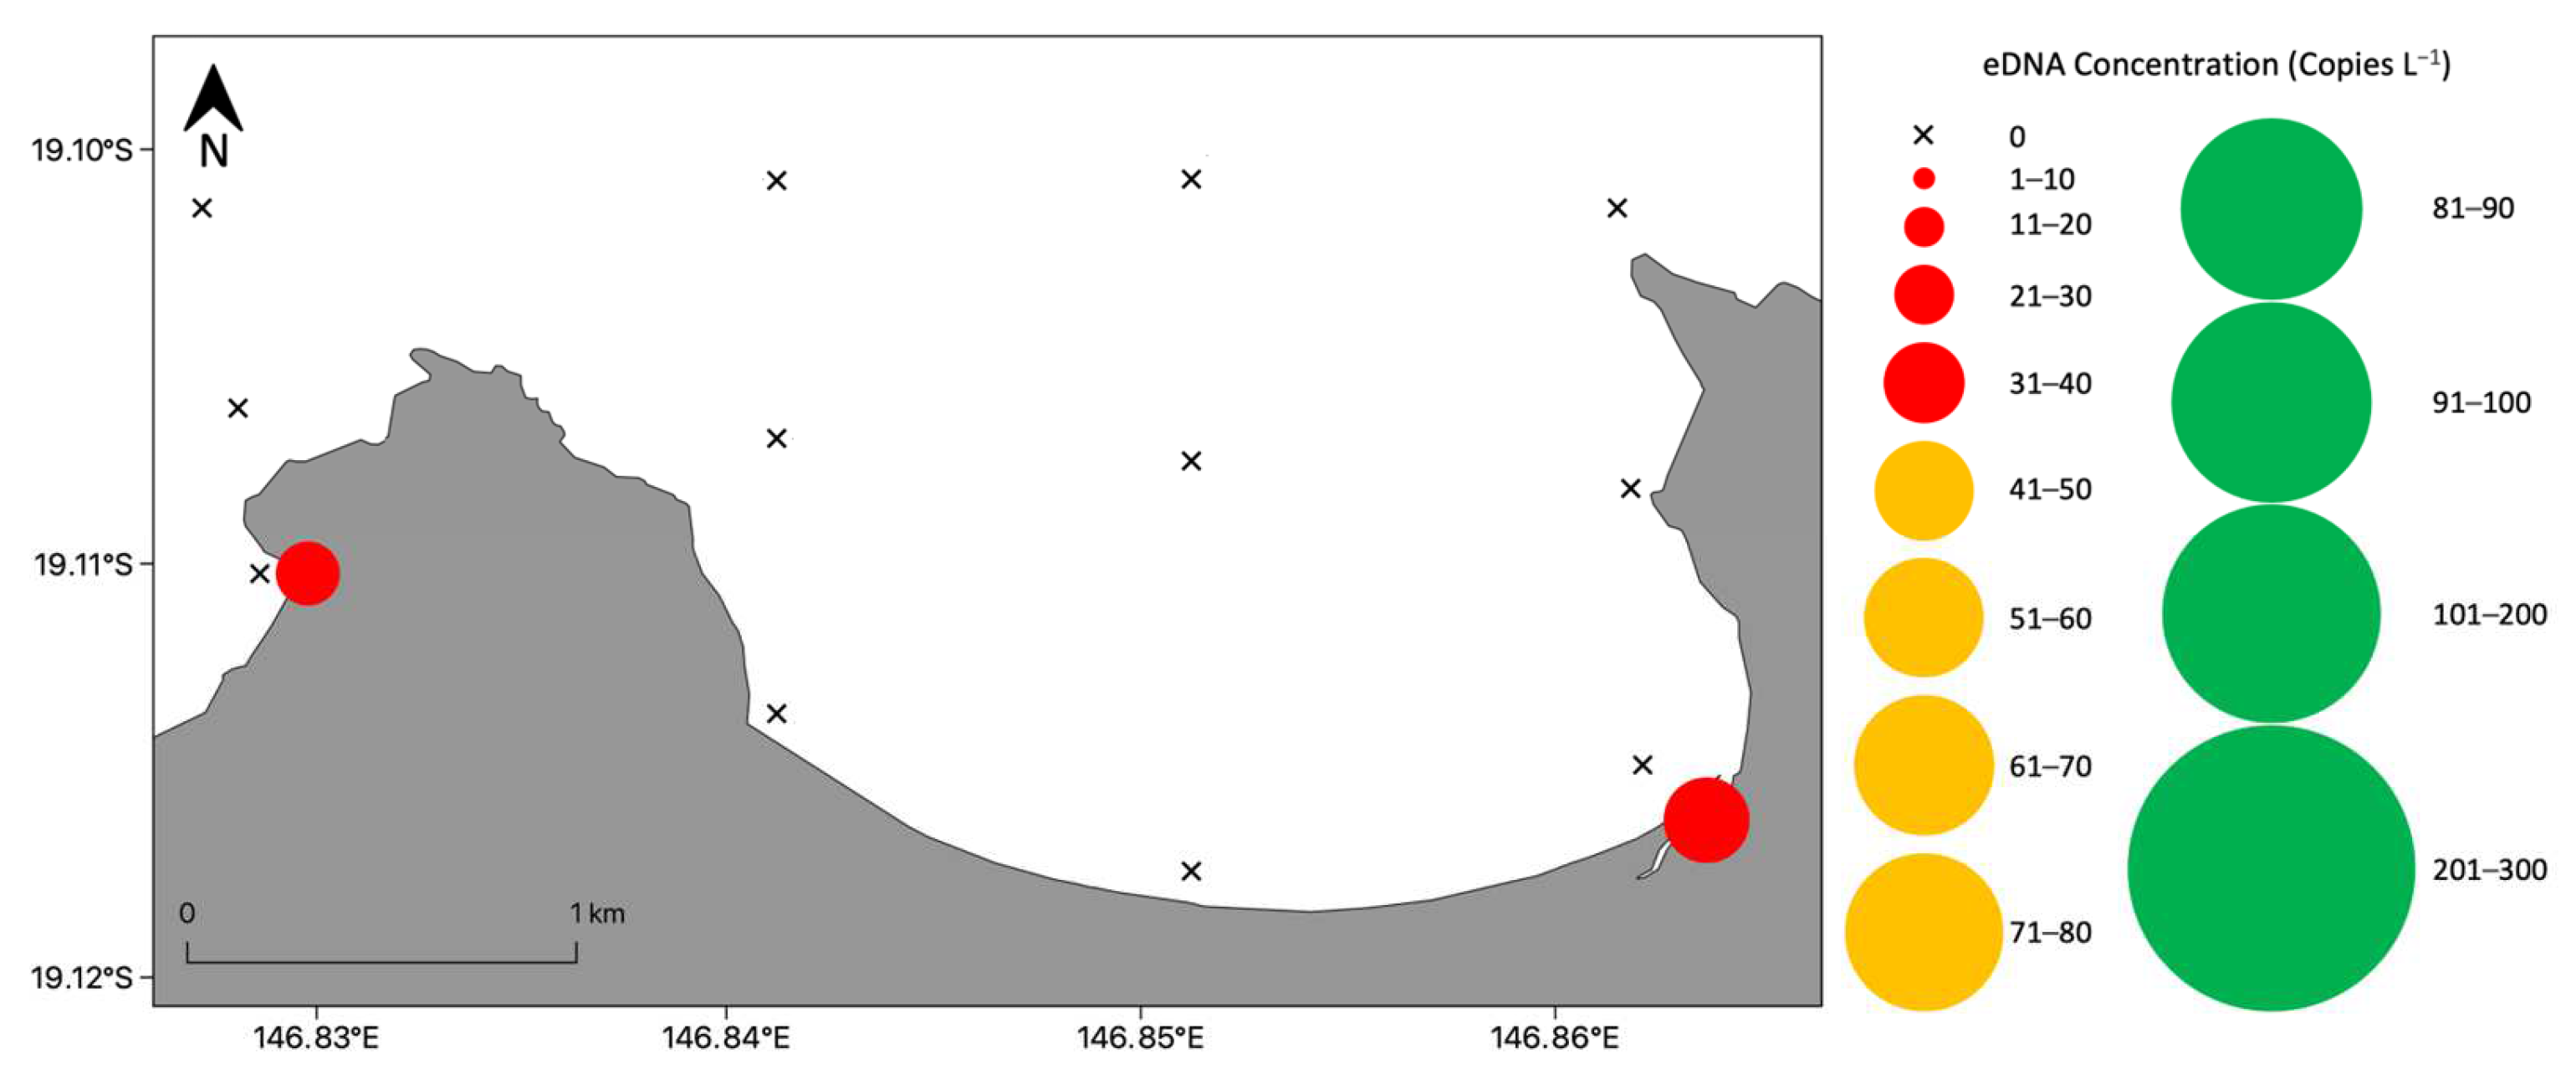
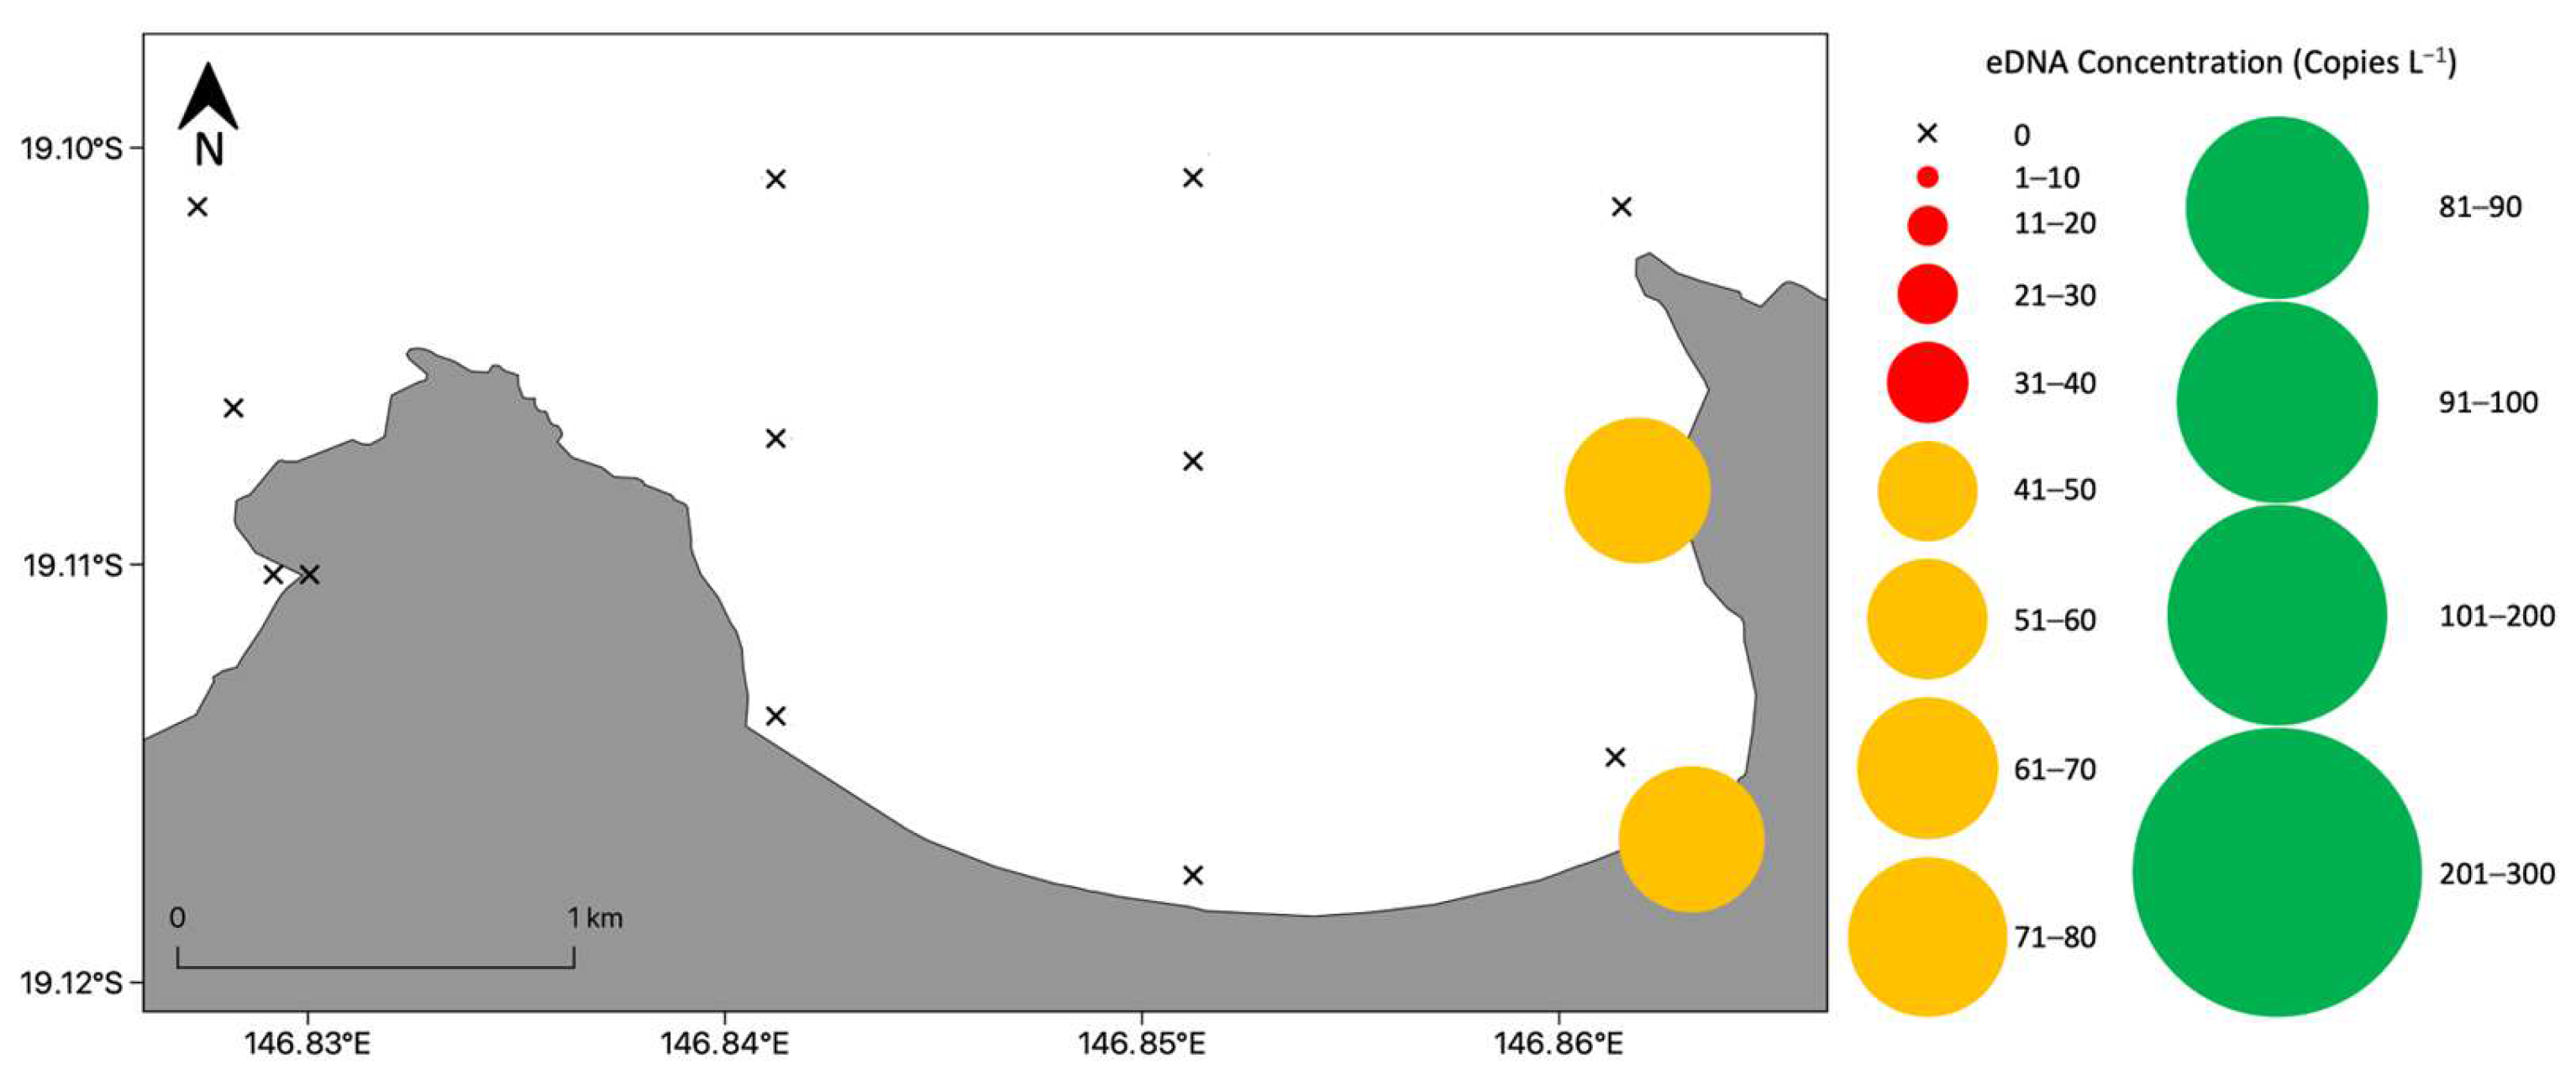
The eDNA of Chironex fleckeri was only detected at nearshore sample sites in Horseshoe Bay and there were some detections in Maud Bay (Figure 4 and Figure 5). Interestingly, no C. fleckeri eDNA was detected at mid-shore or offshore sites. In March 2021, the highest eDNA concentrations were observed near the freshwater inflow in Horseshoe Bay (Figure 4). Notably, this specific site consistently exhibited positive detections at all sampling times within the 2020/21 box jellyfish season (Figure 2, Figure 3 and Figure 4). Detection was observed in 22.2% of the technical replicates from positive sample sites, and eDNA copies L−1 ranged from 18.8 to 134.8 copies L−1 (Table S3). At the end of 2021 (December), at the beginning of the next Australian box jellyfish season (2021/22), detection of eDNA was confined to sites with freshwater inflow in both Horseshoe and Maud Bays (Figure 5). Thus, only two sites had positive detections during that sampling time with eDNA copies L−1 ranging from 22.5 to 33.5 copies L−1 (Table S3). All controls again verified the lack of contamination and method success for both sampling times.
Stratification of the water column is known to restrict eDNA dispersal within the water column [38,39]. However, CTD profiles did not detect any stratification of the water column in temperature or salinity at all sites ranging in depths from 0.4 to 13 m (Figures S4 and S5). Temperatures and salinities were consistent throughout the study area for each sampling period (March 2021; 27.2–29.6 °C and 31.4–32.9 ppt, December 2021; 30–30.7 °C and 35.2–35.5 ppt). It should be noted, however, that nearshore waters in March 2021 were 2 °C higher than all other sites.

3.3. Detection and Distribution of Chironex fleckeri Polyps

3.3.1. Bay Wide Sampling Design for Chironex fleckeri Polyps

Chironex fleckeri eDNA was positively detected within Horseshoe Bay outside of the established medusae season (Figure 6). The detections, therefore, could only be attributed to the presence of the species’ benthic polyp stage, as no medusae were reported to be present during that sampling period and medusae are not usually found at this time of the year. Positive detections were only found near the freshwater inflow within Horseshoe Bay and along the eastern side of the bay. eDNA copies L−1 ranged from 62.5 to 63.5 copies L−1 (Table S4). All controls provided assurance of contamination-free conditions and method success.

3.3.2. Targeted Sampling to Determine Chironex fleckeri Polyp Hotspots

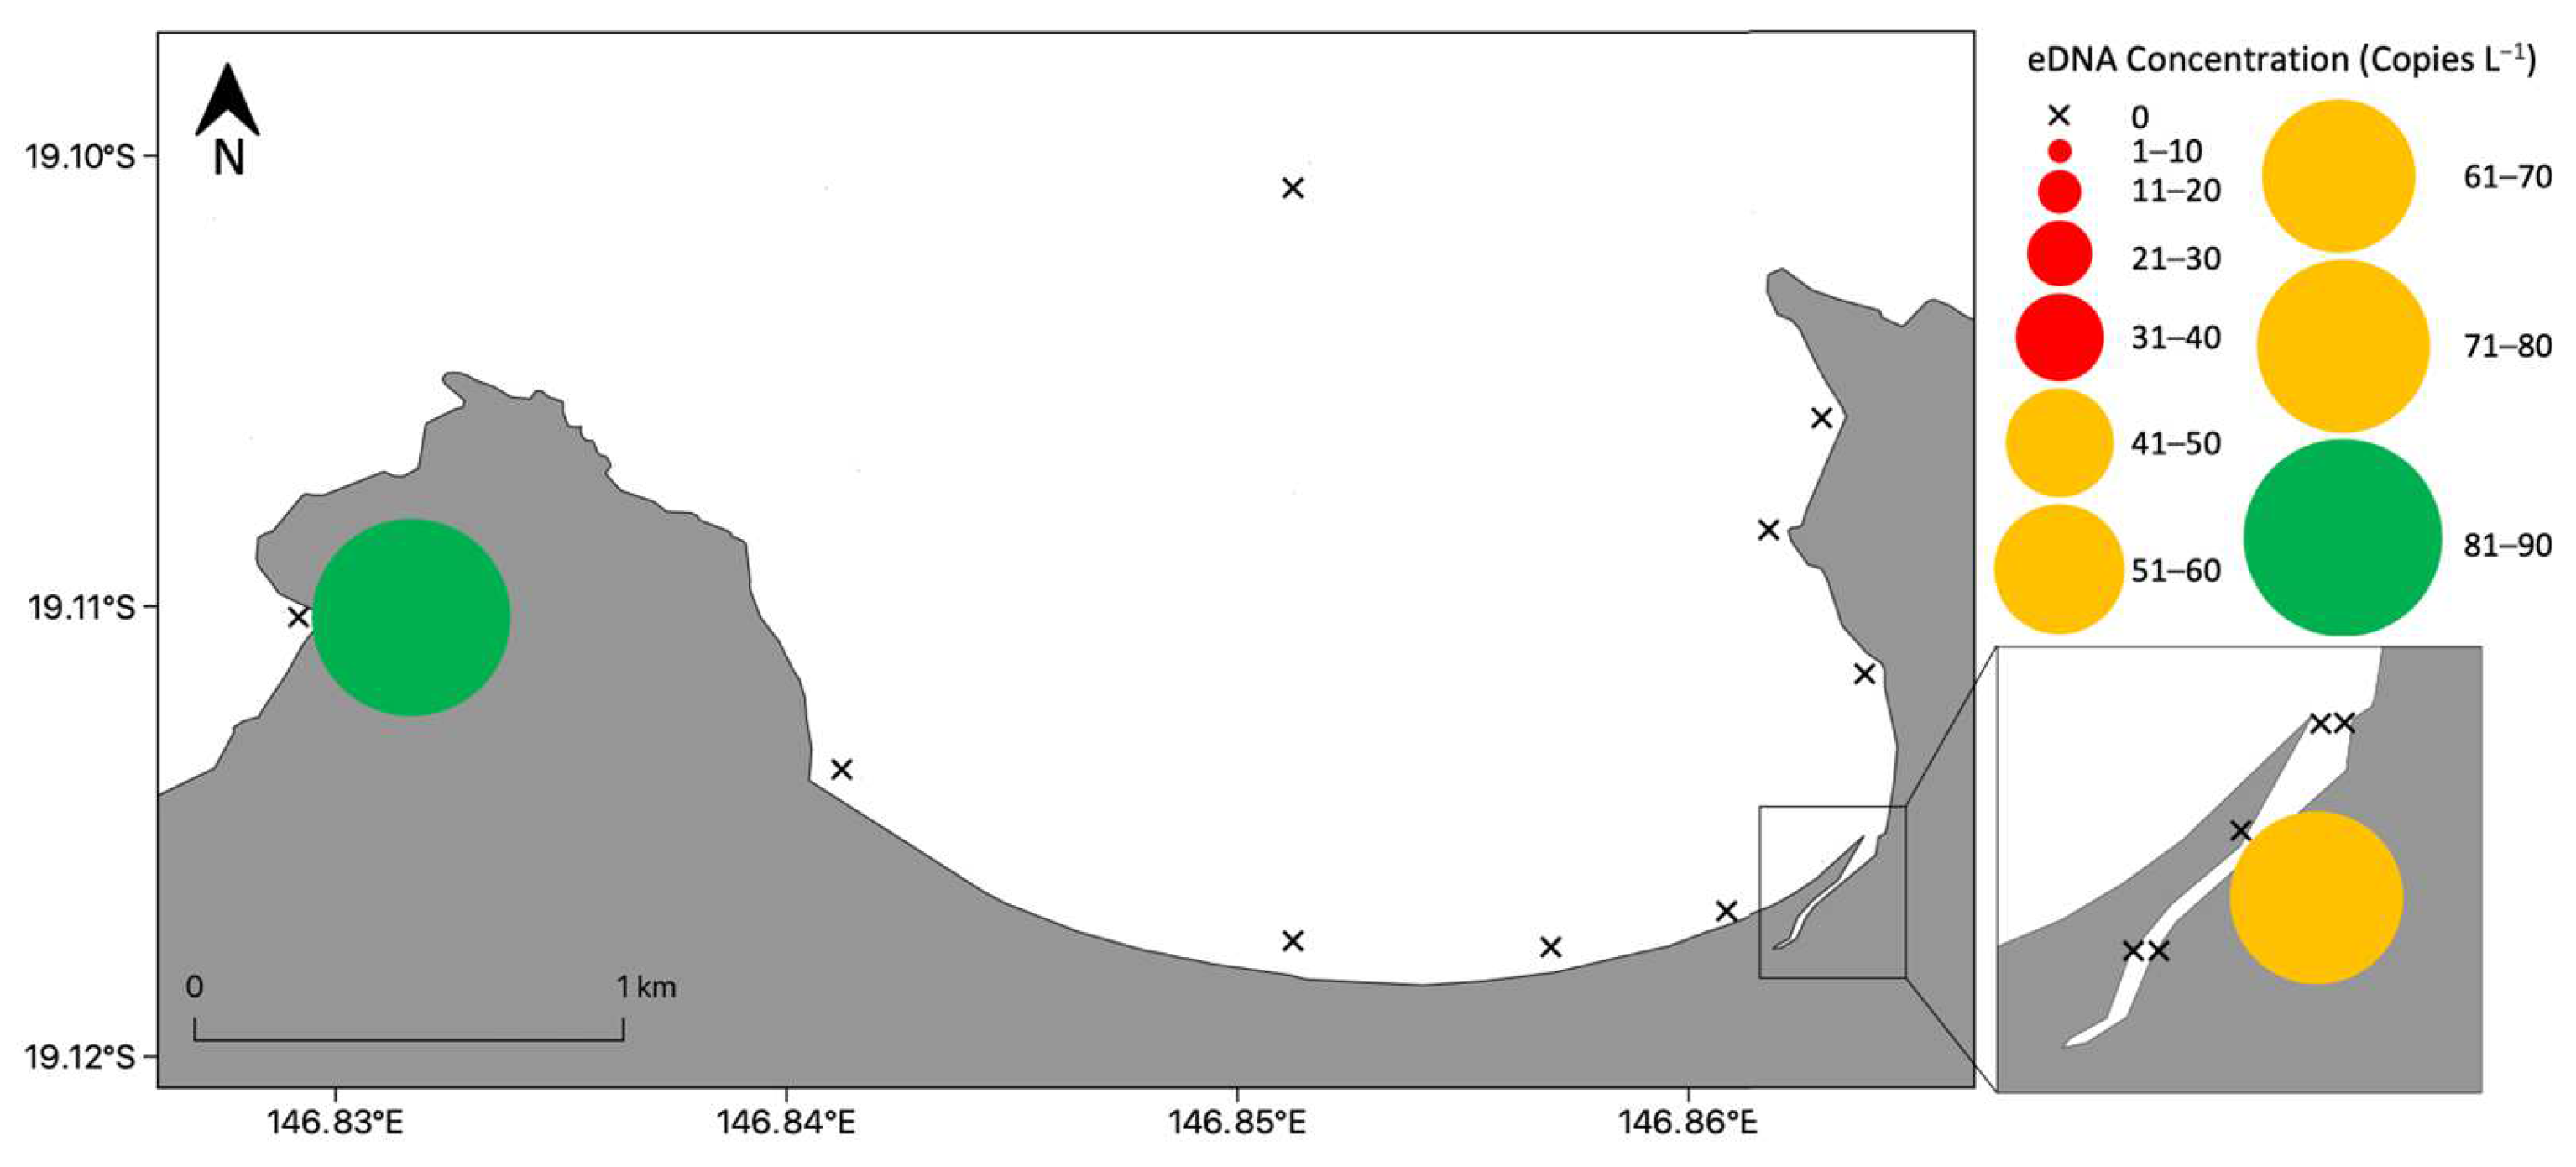
The targeted sampling design only detected Chironex fleckeri eDNA at sites with freshwater inflows within Horseshoe and Maud Bays (Figure 7). These detections were outside of the established medusae season and therefore could only be attributed to the presence of benthic polyps. Additionally, there were no reports of medusae being present during that sampling period, and none were caught in our beach seines. eDNA copies ranged from 73.6 to 82.3 copies L−1 (Table S5), and positive detection was observed in 12.5% of technical replicates from positive sample sites. All controls ensured the absence of contamination and validated the success of the applied methods.
CTD profiles did not reveal any stratification of the water column in terms of temperature or salinity in shallow water. Variation in temperature was found to occur between inshore and offshore sites, with highest temperatures being recorded nearshore. Temperatures and salinities were 20–22.7 °C and 31.5–34.4 ppt within Horseshoe and Maud Bays. Salinities were, however, found to decrease considerably when moving further within Horseshoe Bay’s freshwater inflow (34.1–2.5 ppt) (Table S5). Further, salinities were observed to fluctuate (±3.7 ppt) midway along this freshwater inflow. This lower salinity may have been resultant from rainfall occurring two weeks prior to sampling, resulting in a recent mixing of freshwater with saltwater.

3.4. Detection of Chironex fleckeri near Shore at All Times

There were consistent spatial patterns of eDNA detection across times (Figure 8). Within Horseshoe Bay’s freshwater inflow, eDNA was detected at all sampling times (site 6). This detection must be due to the presence of both medusae and polyp life history stages. Similarly, Chironex fleckeri eDNA was detected in Maud Bay and near a freshwater inflow (site 23) at all but one sampling time. Regarding nearshore sample sites within Horseshoe Bay, to the west of site 5, detection was only found during the medusae season (sites 16 and 19).

4. Discussion

4.1. Distribution of Chironex fleckeri Medusae

During the Australian box jellyfish season, Chironex fleckeri medusae were consistently detected nearshore and not in waters that were hundreds of meters to kilometres from shore. This eDNA detection aligned with Brown’s [32] observations on C. fleckeri medusae distributions surrounding Magnetic Island and with previous studies indicating nearshore distributions of C. fleckeri [22,32,33,34]. This finding was predicted based on previous studies [22,32,33,34]; however, eDNA’s use for exploring C. fleckeri distributions have only been undertaken in semi-enclosed waters rather than open coastal waters. eDNA, being a passive particle, can be influenced by oceanographic processes [38,50,51,52,53,54], such as transport by currents [50] and isolation from surface waters due to water column stratification [38]. However, in this study, despite daily persistence of C. fleckeri eDNA (99% decay within 27 h) [29], the dispersion of eDNA appeared to be limited. Water is known to ebb out of Horseshoe Bay along both sides of the bay (J. A. Schlaefer, E. Wolanski and M. J. Kingsford, unpublished data); however, no detection was ever found at mid- and offshore sites along these currents. Furthermore, no stratification was observed in mid- and offshore water columns that could have potentially isolated eDNA below a pycnocline [38]. It was also clear that despite 32 replicate samples being taken at samples sites that were hundreds of meters to kilometres from shore, C. fleckeri eDNA was never detected. The combined evidence, therefore, suggested restricted C. fleckeri eDNA dispersal, and the absence of C. fleckeri at mid- and offshore sites. To validate this further, biophysical modelling of eDNA dispersion may be employed [55,56]. Additionally, because we employed a highly specific and sensitive detection assay, best practice control measures and optimised techniques for elusive species detections that ensure precision, we are confident in the accuracy of our findings [29]. Thus, eDNA has successfully identified the nearshore distribution of the taxa for the area, further highlighting the ability of eDNA to expose elusive taxa distributions [57,58,59].
Studying medusae detection throughout the 2020/2021 Australian box jellyfish season may offer insights into the species’ movements. In December, C. fleckeri was solely detected in Horseshoe Bay. However, in February and March, C. fleckeri was additionally detected in neighbouring Maud Bay, suggesting potential movement. This aligns with Brown’s observations [32] that initially, C. fleckeri medusae were only present in Horseshoe Bay but later appeared in adjacent bays as large medusae. Brown [32] proposed this movement may be due to strong northerly winds causing medusae to seek calmer waters. However, we consistently found nearshore detections at multiple sampling times, so more data are required on movements as there are few data on the movements of cubomedusae [11,37,60,61].
Persistent medusa eDNA detection was observed in the freshwater inflow of Horseshoe Bay during summer months. This may be a result of polyps being putatively present in that area (see Section 4.2), as they are the source of medusae. Alternatively, or perhaps in combination, medusae may opt to remain in areas with higher/appropriate prey abundance to minimise energy expenditure [62]. Mangrove habitats are known for harbouring a higher abundance of post larval, juvenile and small adult fish, along with juvenile crustaceans, which serve as common medusa prey [63,64]. However, medusae were clearly venturing to nearshore waters without mangroves where perhaps prey are still available. The detection of C. fleckeri eDNA in Maud Bay may be due to a combination of some leakage of medusae from Horseshoe Bay, as suggested by Brown [32], and/or recruitment from a local source of polyps.

4.2. Detection of Chironex fleckeri Polyps

Outside of the Australian medusae box jellyfish season, Chironex fleckeri eDNA was detected. Since C. fleckeri medusae are absent from waters during winter months due to their seasonality [11,34,36,65], confirmed via SLSQ for Magnetic Island (no detection or reported stings), these detections must arise from benthic polyp life history stages. Additionally, detections were of a lower frequency in comparison to those during summer months when medusae were present. Polyps of multiple scyphozoan jellyfish species have been observed to have restricted distributions, such as Cyanea sp. within the Niantic River, USA [66] and Aurelia aurita within Mikawa Bay, Japan [67]. C. fleckeri polyps likely follow suit, which subsequently explains the lower frequency and restricted eDNA detection of C. fleckeri found during winter months. Further, the reliability and confidence in these detections were ensured through the use of a [29] highly sensitive and specific C. fleckeri detection assay and the use of eDNA methods optimised for elusive species [29]. This study reinforces the validity of the eDNA technique to detect the putative presence of C. fleckeri polyps [28].
During the first sampling time within the Austral winter (July 2020), C. fleckeri polyps were putatively detected in Horseshoe Bay’s freshwater inflow and along the eastern side of the bay. Later, in July 2022, C. fleckeri polyps were detected within the freshwater inflows of both Horseshoe and Maud Bays. As suggested in a previous study undertaken by the authors [28], rocky substrata is likely a suitable habitat for cubozoan polyps, and medusae ‘hotspots’ may be good indicators of their presence. All sites where polyps were detected have rocky substrata, with Horseshoe and Maud Bays’ freshwater inflows containing mangroves and granite boulders, and the eastern side of Horseshoe Bay containing granite boulders, coral reef, and coral rubble. These detections subsequently aligned with the study of Morrissey et al. [28] where polyp habitat was identified. Additionally, polyp presence within Horseshoe Bay’s freshwater inflow was unsurprising as it consistently showed medusa presence in summer months. This subsequently aligned with Morrissey et al.’s [28] suggestion of medusae ‘hotspots’ being good indicators of polyp presence. These findings additionally provide support to Brown’s [32] hypothesis surrounding Horseshoe Bay being a source location of C. fleckeri.
As cubozoan polyps are difficult to find in their natural environment, resulting from their tiny size, eDNA provides the most efficient technique for their detection [27,28,29]. Subsequently, the technique opens the door to studying this life history stage and the filling of critical knowledge gaps surrounding C. fleckeri’s ecology [11,28]. As previously suggested [28], environmental RNA (eRNA), which may enable a finer resolution of detection due to its rapid decay [68], may assist physical in situ locating of C. fleckeri polyps. Recent advancements in this technique, however, may completely remove this need. Parsley and Goldberg [69] successfully utilised the technique to distinguish between amphibian life history stages. Hence, eRNA, in addition to the known seasonality of medusae [11,34,36,65] and lack of their presence during winter months, would undoubtably confirm detections of C. fleckeri polyps. The authors hence suggest exploration of this application for cubozoan and scyphozoan jellyfish, whose medusa stage is not seasonal.

4.3. Evaluating Distributions of Chironex fleckeri Medusae and Polyps for Informed Stock Boundary Assessment and the Generality of eDNA for This Application

Through utilising eDNA to detect both Chironex fleckeri medusae and polyp life history stages, we gain insights into the spatial extent of C. fleckeri’s population for the area. Polyps, as they are the benthic source of medusae [11,19], likely play a key role in the spatial boundaries of the species population stocks [17]. Studies exploring the role of scyphozoan polyps in determining the abundance and distributions of medusae have reported a strong relationship between the distribution of both life history stages [66,67,70]. Further, as cubozoans are gonochoristic [71], with C. fleckeri medusae undertaking external fertilisation [72], medusae need to be in close proximity to each other and in areas of suitable habitat and environmental conditions for polyps. Increasing evidence suggests that some cubozoan jellyfish, including C. fleckeri, have population stocks of small spatial scales, to the extent of bays and estuaries; however, polyp locations have largely not been considered or were impossible to detect [17]. As polyps have been putatively detected within this study, it allows for an exploration into potential population stock boundaries of C. fleckeri for the study area.
C. fleckeri medusae were exclusively detected nearshore in Horseshoe and Maud Bays, highlighting their nearshore distribution. Additionally, the benthic polyp stage of the species was consistently detected within Horseshoe Bay and once within Maud Bay. As polyps are the source of medusae, and as medusae were found to reside within these bays across the Australian box jellyfish season, it is reasonable to infer that the northern side of Magnetic Island likely represents a population stock of the jellyfish. This is supported by the lack of C. fleckeri captures by SLSQ in bays located on the south side of the island (pers. comms. SLSQ) and aligns with Brown’s [32] observations on C. fleckeri medusae distributions surrounding the island. This suggestion additionally aligns with evidence from other sources [22,23,26,62].
A biophysical modelling and jellyfish behaviour study, undertaken by Schlaefer [26], found C. fleckeri medusae to have strong swimming behaviour and an orientation to nearshore environments. Additionally, Gordon and Seymour [62], via the use of acoustic telemetry, observed multiple C. fleckeri medusae (n = 11) to not venture far from initial tagging locations, covering hundreds of metres to a few kilometres over an average duration of ~15 h. These studies findings suggest limited dispersal of C. fleckeri medusae, with them staying close to home, and subsequently align with evidence presented within this study. Further, Mooney and Kingsford [22,23] examined both the elemental chemistry and morphometrics of C. fleckeri statoliths to investigate the structure and scale of the species population units. An examination of C. fleckeri statolith morphometrics revealed variations between sites separated by dozens of kilometres [23]. An examination of statolith elemental chemistry revealed distinct variations between individuals located within Horseshoe Bay and mainland Townsville, located ~10 km away [22]. Mooney and Kingsford’s [22,23] findings subsequently suggested spatially small population units of C. fleckeri and provided additional support to the northern side of Magnetic Island representing a population stock of C. fleckeri. To validate this notion, examining the genetics of individuals in Horseshoe Bay and the nearby mainland (~10 km away) would be valuable. Furthermore, since eDNA has been successfully utilised as a population genetics tool [73,74,75], the use of both eDNA and eRNA may enable the linking of medusae to detected polyps, thereby confirming their origin. Leveraging genetic detection techniques for this use would significantly contribute to our understanding of cubozoan jellyfish distributions, population structures, and potential movements.
Prior to this study, eDNA was utilised to investigate a hypothesis surrounding a semi-enclosed estuarine system representing a population stock of C. fleckeri [28]. The genetic detection technique proved successful, providing evidence to support the hypothesis. However, favourable currents, medusae swimming behaviour, and presence of polyps within the estuary likely favour the retention of the jellyfish in that system. In contrast, eDNA, in this current study, was utilised to inform C. fleckeri stock boundaries in an open coastal environment, where oceanographic and geomorphic conditions were more likely to facilitate dispersal of jellyfish rather than retention. Accordingly, based on the evidence and discussion above, C. fleckeri population stocks appear common at small spatial scales, in ecosystems of varying geomorphic and oceanographic conditions.

5. Conclusions

An in-depth understanding on cubozoan ecology is needed for effective mitigation and management of their threat posed to both human health and enterprise [1,11]. This study further demonstrated the ability of eDNA to investigate and fill critical knowledge gaps surrounding cubozoan ecology. Chironex fleckeri medusae were exclusively detected nearshore, with eDNA identifying their expected nearshore distribution despite potential eDNA dispersal. Further, the genetic tool was again successful in detecting C. fleckeri’s elusive benthic polyp stage. This finding concurred with a hypothesis suggesting that Horseshoe Bay was an important source of medusae for Magnetic Island. Polyps were consistently detected near freshwater inflows, and this aligned with a previous study where polyp habitat was identified [28]. A comparison of these two life history stages added to existing evidence that the northern side of Magnetic Island is likely a robust population stock of the jellyfish. This adds to growing evidence [17] suggesting that C. fleckeri have population stocks of small spatial scales, in both semi-enclosed estuaries [26,28] and open bays. Additionally, our study and other research have demonstrated that even in an open coastal setting, medusae populations of C. fleckeri have a very restricted distribution nearshore. Accordingly, eDNA offers a tool capable of testing ecological hypotheses and filling critical knowledge gaps surrounding cubozoan ecology.

Supplementary Materials

The following supporting information can be downloaded at: https://www.mdpi.com/article/10.3390/coasts4010011/s1, Table S1: Species-specific Chironex fleckeri and generic fish endogenous control assay information (adapted from Morrissey et al. (2022) [29]); Table S2: eDNA sample collection sites with depth, depth-integrated temperature and salinity, number of positive technical replicates, and eDNA concentrations (copies L−1) during the December 2020 and February 2021 sampling periods; Table S3: eDNA sample collection sites with depth, depth-integrated temperature and salinity, number of positive technical replicates, and eDNA concentrations (copies L−1) during the March 2021 and December 2021 sampling periods. * indicates sites where data were not collected; Table S4: eDNA sample collection sites with depth, depth-integrated temperature and salinity, number of positive technical replicates, and eDNA concentrations (copies L−1) during the July 2020 sampling period. Note, temperature and salinities were not measured during that sampling period; Table S5: eDNA sample collection sites with depth, depth-integrated temperature and salinity, number of positive technical replicates, and eDNA concentrations (copies L−1) during the December 2020 and July 2022 sampling periods. * indicates sites where data were not collected; Figure S1: Labelled satellite image displaying the flora and landform of Horseshoe Bay, Magnetic Island; Figure S2: Depth profiles of temperature and salinity at nearshore sample sites for the December 2020 sampling time; Figure S3: Depth profiles of temperature and salinity at nearshore sample sites for the February 2020 sampling time; Figure S4: Depth profiles of temperature and salinity at offshore (sites 1 and 14), mid-shore (sites 3 and 15) and nearshore (sites 5 and 16) sample sites for the March 2021 sampling time; Figure S5: Depth profiles of temperature and salinity at offshore (sites 1 and 14), mid-shore (sites 3 and 15), and nearshore (sites 5 and 16) sample sites for the December 2021 sampling time.

Author Contributions

Conceptualization, S.J.M., D.R.J. and M.J.K.; data curation, S.J.M.; formal analysis, S.J.M.; funding acquisition, S.J.M., D.R.J. and M.J.K.; investigation, S.J.M.; supervision, D.R.J. and M.J.K.; writing—original draft, S.J.M.; writing—review and editing, S.J.M., D.R.J. and M.J.K. All authors have read and agreed to the published version of the manuscript.

Funding

Funding for the project was provided by the Australian Lions Foundation for Scientific and Medical Research on Marine Species Dangerous to Humans to S.J.M. and from the Australian Research Council Centre of Excellence for Coral Reef Studies to M.J.K.

Institutional Review Board Statement

Not applicable.

Informed Consent Statement

Not applicable.

Data Availability Statement

The data that support this study will be shared upon reasonable request to the corresponding author.

Acknowledgments

The authors thank Julie Goldsbury, Mark O’Callaghan, Nadia Bieri, Jessica Strickland, and Cecilia Villacorta Rath for assistance with field work and logistics, sharing protocols, and for valuable information and advice. The authors also thank the reviewers for commenting on drafts of this manuscript. Finally, the authors acknowledge the traditional owners (past, present, and emerging) of the lands where this project was carried out.

Conflicts of Interest

The authors declare no conflicts of interest. The funders had no role in the design of the study; in the collection, analyses, or interpretation of data; in the writing of the manuscript; or in the decision to publish the results.

References

  1. Kingsford, M.J.; Becken, S.; Bordehore, C.; Fuentes, V.L.; Pitt, K.A.; Yangihara, A.A. Empowering stakeholders to manage stinging jellyfish: A perspective. Coast. Manag. 2018, 46, 1–18. [Google Scholar] [CrossRef]
  2. Graham, W.M.; Gelcich, S.; Robinson, K.L.; Duarte, C.M.; Brotz, L.; Purcell, J.E.; Madin, L.P.; Mianzan, H.; Sutherland, K.R.; Uye, S.-I.; et al. Linking human well-being and jellyfish: Ecosystem services, impacts, and societal responses. Front. Ecol. Environ. 2014, 12, 515–523. [Google Scholar] [CrossRef]
  3. Lucas, C.H.; Gelcich, S.; Uye, S.-I. Living with Jellyfish: Management and Adaptation Strategies; Springer: Berlin/Heidelberg, Germany, 2014. [Google Scholar]
  4. Gershwin, L.-A.; De Nardi, M.; Winkel, K.D.; Fenner, P.J. Marine stingers: Review of an under-recognized global coastal management issue. Coast. Manag. 2010, 38, 22–41. [Google Scholar] [CrossRef]
  5. De Donno, A.; Idolo, A.; Bagordo, F.; Grassi, T.; Leomanni, A.; Serio, F.; Guido, M.; Canitano, M.; Zampardi, S.; Boero, F. Impact of stinging jellyfish proliferations along south Italian coasts: Human health hazards, treatment and social costs. Int. J. Environ. Res. Public Health 2014, 11, 2488–2503. [Google Scholar] [CrossRef]
  6. Cegolon, L.; Heymann, W.C.; Lange, J.H.; Mastrangelo, G. Jellyfish stings and their management: A review. Mar. Drugs 2013, 11, 523–550. [Google Scholar] [CrossRef] [PubMed]
  7. Bosch-Belmar, M.; Milisenda, G.; Basso, L.; Doyle, T.K.; Leone, A.; Piraino, S. Jellyfish impacts on marine aquaculture and fisheries. Rev. Fish. Sci. Aquac. 2020, 29, 242–259. [Google Scholar] [CrossRef]
  8. Bordehore, C.; Alonso, C.; Sánchez-Fernández, L.; Canepa, A.; Acevedo, M.; Nogué, S.; Fuentes, V.L. Lifeguard assistance at Spanish Mediterranean beaches: Jellyfish prevail and proposals for improving risk management. Ocean. Coast. Manag. 2016, 131, 45–52. [Google Scholar] [CrossRef]
  9. Rodrigues, T.; Domínguez-Pérez, D.; Almeida, D.; Matos, A.; Antunes, A. Medusozoans reported in Portugal and its ecological and economical relevance. Reg. Stud. Mar. Sci. 2020, 35, 101230. [Google Scholar] [CrossRef]
  10. Kennerley, A.; Wood, L.; Luisetti, T.; Ferrini, S.; Lorenzoni, I. Economic impacts of jellyfish blooms on coastal recreation in a UK coastal town and potential management options. Ocean. Coast. Manag. 2022, 227, 106284. [Google Scholar] [CrossRef]
  11. Kingsford, M.J.; Mooney, C.J. The Ecology of Box Jellyfishes (Cubozoa). In Jellyfish Blooms; Springer: Berlin/Heidelberg, Germany, 2014; pp. 267–302. [Google Scholar]
  12. Fenner, P.J.; Harrison, S.L. Irukandji and Chironex fleckeri jellyfish envenomation in tropical Australia. Wilderness Environ. Med. 2000, 11, 233–240. [Google Scholar] [CrossRef]
  13. Currie, B.J.; Jacups, S.P. Prospective study of Chironex fleckeri and other box jellyfish stings in the “Top End” of Australia’s Northern Territory. Med. J. Aust. 2005, 183, 631–636. [Google Scholar] [CrossRef]
  14. Gershwin, L.-a.; Richardson, A.J.; Winkel, K.D.; Fenner, P.J.; Lippmann, J.; Hore, R.; Avila-Soria, G.; Brewer, D.; Kloser, R.J.; Steven, A. Biology and Ecology of Irukandji Jellyfish (Cnidaria: Cubozoa). In Advances in Marine Biology; Elsevier: Amsterdam, The Netherlands, 2013; Volume 66, pp. 1–85. [Google Scholar]
  15. Crowley-Cyr, L.; Gershwin, L.-A. Protecting the Public from Hazardous Jellyfish: A Wicked Problem for Regulators and Operators? In The Cnidaria: Only a Problem or also a Resource? Nova Science Publishers: Hauppauge, NY, USA, 2021. [Google Scholar]
  16. Gershwin, L.-A.; Crowley-Cyr, L. Forecasting Hazardous Jellyfish: Shifting Perceptions from Black Swans Events to White. In The Cnidaria: Only a Problem or also a Resource? Nova Science Publishers: Hauppauge, NY, USA, 2021. [Google Scholar]
  17. Kingsford, M.J.; Schlaefer, J.A.; Morrissey, S.J. Population Structures and Levels of Connectivity for Scyphozoan and Cubozoan Jellyfish. Diversity 2021, 13, 174. [Google Scholar] [CrossRef]
  18. Courtney, R.; Browning, S.; Seymour, J. Early Life History of the ‘Irukandji’ Jellyfish Carukia barnesi. PLoS ONE 2016, 11, e0151197. [Google Scholar] [CrossRef]
  19. Arai, M.N. A Functional Biology of Scyphozoa; Springer Science & Business Media: Berlin/Heidelberg, Germany, 1997. [Google Scholar]
  20. Courtney, R.; Seymour, J. Seasonality in Polyps of a Tropical Cubozoan: A latina nr mordens. PLoS ONE 2013, 8, e69369. [Google Scholar] [CrossRef] [PubMed]
  21. Collins, A.G.; Jarms, G. WoRMS Cubozoa: World List of Cubozoa (Version 2018-04-01). In Species 2000 & ITIS Catalogue of Life, 2018 Annual Checklist; Roskov, Y., Abucay, L., Orrell, T., Nicolson, D., Bailly, N., Kirk, P.M., Bourgoin, T., DeWalt, R.E., Decock, W., et al., Eds.; Species; Naturalis: Leiden, The Netherlands, 2000; Available online: www.catalogueoflife.org/annual-checklist/2018 (accessed on 2 February 2021).
  22. Mooney, C.J.; Kingsford, M.J. Discriminating populations of medusae (Chironex fleckeri, Cubozoa) using statolith microchemistry. Mar. Freshw. Res. 2017, 68, 1144–1152. [Google Scholar] [CrossRef]
  23. Mooney, C.J.; Kingsford, M.J. Statolith morphometrics as a tool to distinguish among populations of three cubozoan species. Hydrobiologia 2017, 787, 111–121. [Google Scholar] [CrossRef]
  24. Schlaefer, J.A.; Wolanski, E.; Lambrechts, J.; Kingsford, M.J. Behavioural and oceanographic isolation of an island-based jellyfish (Copula sivickisi, Class Cubozoa) population. Sci. Rep. 2021, 11, 10280. [Google Scholar] [CrossRef] [PubMed]
  25. Schlaefer, J.A.; Wolanski, E.; Yadav, S.; Kingsford, M.J. Behavioural maintenance of highly localised jellyfish (Copula sivickisi, class Cubozoa) populations. Mar. Biol. 2020, 167, 40. [Google Scholar] [CrossRef]
  26. Schlaefer, J.A.; Wolanski, E.; Kingsford, M.J. Swimming behaviour can maintain localised jellyfish (Chironex fleckeri: Cubozoa) populations. Mar. Ecol. Prog. Ser. 2018, 591, 287–302. [Google Scholar] [CrossRef]
  27. Bolte, B.; Goldsbury, J.; Huerlimann, R.; Jerry, D.; Kingsford, M. Validation of eDNA as a viable method of detection for dangerous cubozoan jellyfish. Environ. DNA 2021, 3, 769–779. [Google Scholar] [CrossRef]
  28. Morrissey, S.J.; Jerry, D.; Kingsford, M. Use of eDNA to test hypotheses on the ecology of Chironex fleckeri (Cubozoa). Mar. Ecol. Prog. Ser. 2024, 728, 25–41. [Google Scholar] [CrossRef]
  29. Morrissey, S.J.; Jerry, D.R.; Kingsford, M.J. Genetic Detection and a Method to Study the Ecology of Deadly Cubozoan Jellyfish. Diversity 2022, 14, 1139. [Google Scholar] [CrossRef]
  30. Anzama, Y.; Oka, S.; Teruya, M.; Toshino, S.; Tanimoto, M.; Hanahara, N.; Kuba, Y.; Miyagi, A.; Fukuchi, Y. Real-time PCR assay for detecting environmental DNA of box jellyfish. J. Hyg. Anim. Health 2023, 74, 13–20. [Google Scholar]
  31. Sathirapongsasuti, N.; Khonchom, K.; Poonsawat, T.; Pransilpa, M.; Ongsara, S.; Detsri, U.; Bungbai, S.; Lawanangkoon, S.-A.; Pattanaporkrattana, W.; Trakulsrichai, S. Rapid and Accurate Species-Specific PCR for the Identification of Lethal Chironex Box Jellyfish in Thailand. Int. J. Environ. Res. Public Health 2021, 18, 219. [Google Scholar] [CrossRef] [PubMed]
  32. Brown, T.W. Chironex Fleckeri: Distribution and Movements Around Magnetic Island; TW Brown: North Queensland, Australia, 1973. [Google Scholar]
  33. Kingsford, M.; Seymour, J.; O’Callaghan, M. Abundance Patterns of Cubozoans on and near the Great Barrier Reef. In Jellyfish Blooms IV; Springer: Berlin/Heidelberg, Germany, 2012; pp. 257–268. [Google Scholar]
  34. Hartwick, R. Distributional Ecology and Behaviour of the Early Life Stages of the Box-Jellyfish Chironex Fleckeri. In Coelenterate Biology: Recent Research on Cnidaria and Ctenophora; Springer: Berlin/Heidelberg, Germany, 1991; pp. 181–188. [Google Scholar]
  35. Cutress, C.; Studebaker, J. Development of the Cubome-Dusae, Carybdea Marsupials. Proc. Assoc. Isl. Mar. Lab. Caribb. 1973, 9, 25. [Google Scholar]
  36. Gordon, M.; Seymour, J. Growth, development and temporal variation in the onset of six Chironex fleckeri medusae seasons: A contribution to understanding jellyfish ecology. PLoS ONE 2012, 7, e31277. [Google Scholar] [CrossRef] [PubMed]
  37. Mooney, C.; Kingsford, M. Sources and Movements of Chironex Fleckeri Medusae Using Statolith Elemental Chemistry. In Jellyfish Blooms IV; Springer: Berlin/Heidelberg, Germany, 2012; pp. 269–277. [Google Scholar]
  38. Jeunen, G.J.; Lamare, M.D.; Knapp, M.; Spencer, H.G.; Taylor, H.R.; Stat, M.; Bunce, M.; Gemmell, N.J. Water stratification in the marine biome restricts vertical environmental DNA (eDNA) signal dispersal. Environ. DNA 2020, 2, 99–111. [Google Scholar] [CrossRef]
  39. Gray, C.A.; Kingsford, M.J. Variability in thermocline depth and strength, and relationships with vertical distributions of fish larvae and mesozooplankton in dynamic coastal waters. Mar. Ecol. Prog. Ser. 2003, 247, 211–224. [Google Scholar] [CrossRef]
  40. Edmunds, R.C.; Burrows, D. Got Glycogen?: Development and Multispecies Validation of the Novel Preserve, Precipitate, Lyse, Precipitate, Purify (PPLPP) Workflow for Environmental DNA Extraction from Longmire’s Preserved Water Samples. J. Biomol. Tech. JBT 2020, 31, 125. [Google Scholar] [CrossRef] [PubMed]
  41. Cooper, M.K.; Huerlimann, R.; Edmunds, R.C.; Budd, A.M.; Le Port, A.; Kyne, P.M.; Jerry, D.R.; Simpfendorfer, C.A. Improved detection sensitivity using an optimal eDNA preservation and extraction workflow and its application to threatened sawfishes. Aquat. Conserv. Mar. Freshwat. Ecosyst. 2021, 31, 2131–2148. [Google Scholar] [CrossRef]
  42. Budd, A.M.; Cooper, M.K.; Le Port, A.; Schils, T.; Mills, M.S.; Deinhart, M.E.; Huerlimann, R.; Strugnell, J.M. First detection of critically endangered scalloped hammerhead sharks (Sphyrna lewini) in Guam, Micronesia, in five decades using environmental DNA. Ecol. Indic. 2021, 127, 107649. [Google Scholar] [CrossRef]
  43. Trujillo-González, A.; Edmunds, R.; Becker, J.; Hutson, K. Parasite detection in the ornamental fish trade using environmental DNA. Sci. Rep. 2019, 9, 5173. [Google Scholar] [CrossRef] [PubMed]
  44. Bessell, T.J.; Appleyard, S.A.; Stuart-Smith, R.D.; Johnson, O.J.; Ling, S.D.; Heather, F.J.; Lynch, T.P.; Barrett, N.S.; Stuart-Smith, J. Using eDNA and SCUBA surveys for detection and monitoring of a threatened marine cryptic fish. Aquat. Conserv. Mar. Freshwat. Ecosyst. 2023, 33, 431–442. [Google Scholar] [CrossRef]
  45. Villacorta-Rath, C.; Espinoza, T.; Cockayne, B.; Schaffer, J.; Burrows, D. Environmental DNA analysis confirms extant populations of the cryptic Irwin’s turtle within its historical range. BMC Ecol. Evol. 2022, 22, 57. [Google Scholar] [CrossRef] [PubMed]
  46. Lahoz-Monfort, J.J.; Guillera-Arroita, G.; Tingley, R. Statistical approaches to account for false-positive errors in environmental DNA samples. Mol. Ecol. Resour. 2016, 16, 673–685. [Google Scholar] [CrossRef] [PubMed]
  47. Goldberg, C.S.; Sepulveda, A.; Ray, A.; Baumgardt, J.; Waits, L.P. Environmental DNA as a new method for early detection of New Zealand mudsnails (Potamopyrgus antipodarum). Freshw. Sci. 2013, 32, 792–800. [Google Scholar] [CrossRef]
  48. Thomsen, P.F.; Kielgast, J.; Iversen, L.L.; Møller, P.R.; Rasmussen, M.; Willerslev, E. Detection of a diverse marine fish fauna using environmental DNA from seawater samples. PLoS ONE 2012, 7, e41732. [Google Scholar] [CrossRef]
  49. Congram, M.; Torres Vilaça, S.; Wilson, C.C.; Kyle, C.J.; Lesbarrères, D.; Wikston, M.J.; Beaty, L.; Murray, D.L. Tracking the prevalence of a fungal pathogen, Batrachochytrium dendrobatidis (chytrid fungus), using environmental DNA. Environ. DNA 2022, 4, 687–699. [Google Scholar] [CrossRef]
  50. Harrison, J.B.; Sunday, J.M.; Rogers, S.M. Predicting the fate of eDNA in the environment and implications for studying biodiversity. Proc. R. Soc. B 2019, 286, 20191409. [Google Scholar] [CrossRef]
  51. Shogren, A.J.; Tank, J.L.; Egan, S.P.; Bolster, D.; Riis, T. Riverine distribution of mussel environmental DNA reflects a balance among density, transport, and removal processes. Freshw. Biol. 2019, 64, 1467–1479. [Google Scholar] [CrossRef]
  52. Stoeckle, B.C.; Beggel, S.; Kuehn, R.; Geist, J. Influence of stream characteristics and population size on downstream transport of freshwater mollusk environmental DNA. Freshw. Sci. 2021, 40, 191–201. [Google Scholar] [CrossRef]
  53. Shogren, A.J.; Tank, J.L.; Egan, S.P.; August, O.; Rosi, E.J.; Hanrahan, B.R.; Renshaw, M.A.; Gantz, C.A.; Bolster, D. Water flow and biofilm cover influence environmental DNA detection in recirculating streams. Environ. Sci. Technol. 2018, 52, 8530–8537. [Google Scholar] [CrossRef]
  54. Pont, D.; Rocle, M.; Valentini, A.; Civade, R.; Jean, P.; Maire, A.; Roset, N.; Schabuss, M.; Zornig, H.; Dejean, T. Environmental DNA reveals quantitative patterns of fish biodiversity in large rivers despite its downstream transportation. Sci. Rep. 2018, 8, 10361. [Google Scholar] [CrossRef]
  55. Ellis, M.R.; Clark, Z.S.; Treml, E.A.; Brown, M.S.; Matthews, T.G.; Pocklington, J.B.; Stafford-Bell, R.E.; Bott, N.J.; Nai, Y.H.; Miller, A.D. Detecting marine pests using environmental DNA and biophysical models. Sci. Total Environ. 2022, 816, 151666. [Google Scholar] [CrossRef]
  56. Andruszkiewicz, E.A.; Koseff, J.R.; Fringer, O.B.; Ouellette, N.T.; Lowe, A.B.; Edwards, C.A.; Boehm, A.B. Modeling environmental DNA transport in the coastal ocean using Lagrangian particle tracking. Front. Mar. Sci. 2019, 6, 477. [Google Scholar] [CrossRef]
  57. West, K.; Travers, M.J.; Stat, M.; Harvey, E.S.; Richards, Z.T.; DiBattista, J.D.; Newman, S.J.; Harry, A.; Skepper, C.L.; Heydenrych, M. Large-scale eDNA metabarcoding survey reveals marine biogeographic break and transitions over tropical north-western Australia. Divers. Distrib. 2021, 27, 1942–1957. [Google Scholar] [CrossRef]
  58. Albonetti, L.; Maiello, G.; Cariani, A.; Carpentieri, P.; Ferrari, A.; Sbrana, A.; Shum, P.; Talarico, L.; Russo, T.; Mariani, S. DNA metabarcoding of trawling bycatch reveals diversity and distribution patterns of sharks and rays in the central Tyrrhenian Sea. ICES J. Mar. Sci. 2023, 80, 664–674. [Google Scholar] [CrossRef]
  59. Fukumoto, S.; Ushimaru, A.; Minamoto, T. A basin-scale application of environmental DNA assessment for rare endemic species and closely related exotic species in rivers: A case study of giant salamanders in Japan. J. Appl. Ecol. 2015, 52, 358–365. [Google Scholar] [CrossRef]
  60. Morrissey, S.J.; Yanagihara, A.A.; Kingsford, M.J. Utility of statolith elemental chemistry as a proxy for temperature to elucidate the movements of the Irukandji jellyfish species Alatina alata. Mar. Biol. 2020, 167, 134. [Google Scholar] [CrossRef]
  61. Morrissey, S.J.; Schlaefer, J.A.; Kingsford, M.J. Experimental validation of the relationships between cubozoan statolith elemental chemistry and salinity and temperature. J. Exp. Mar. Biol. Ecol. 2020, 527, 151375. [Google Scholar] [CrossRef]
  62. Gordon, M.; Seymour, J. Quantifying movement of the tropical Australian cubozoan Chironex fleckeri using acoustic telemetry. Hydrobiologia 2009, 616, 87–97. [Google Scholar] [CrossRef]
  63. Carrette, T.; Alderslade, P.; Seymour, J. Nematocyst ratio and prey in two Australian cubomedusans, Chironex fleckeri and Chiropsalmus sp. Toxicon 2002, 40, 1547–1551. [Google Scholar] [CrossRef]
  64. Robertson, A.; Duke, N. Mangroves as nursery sites: Comparisons of the abundance and species composition of fish and crustaceans in mangroves and other nearshore habitats in tropical Australia. Mar. Biol. 1987, 96, 193–205. [Google Scholar] [CrossRef]
  65. Mooney, C.J.; Kingsford, M.J. The influence of salinity on box jellyfish (Chironex fleckeri, Cubozoa) statolith elemental chemistry. Mar. Biol. 2016, 163, 103. [Google Scholar] [CrossRef]
  66. Colin, S.P.; Kremer, P. Population maintenance of the scyphozoan Cyanea sp. settled planulae and the distribution of medusae in the Niantic River, Connecticut, USA. Estuaries 2002, 25, 70–75. [Google Scholar] [CrossRef]
  67. Toyokawa, M.; Aoki, K.; Yamada, S.; Yasuda, A.; Murata, Y.; Kikuchi, T. Distribution of ephyrae and polyps of jellyfish Aurelia aurita (Linnaeus 1758) sensu lato in Mikawa Bay, Japan. J. Oceanogr. 2011, 67, 209–218. [Google Scholar] [CrossRef]
  68. Yates, M.C.; Derry, A.M.; Cristescu, M.E. Environmental RNA: A revolution in ecological resolution? Trends Ecol. Evol. 2021, 36, 601–609. [Google Scholar] [CrossRef]
  69. Parsley, M.B.; Goldberg, C.S. Environmental RNA can distinguish life stages in amphibian populations. Mol. Ecol. Resour. 2023. [Google Scholar] [CrossRef]
  70. Shahrestani, S.; Bi, H. Settlement and survival of Chrysaora chesapeakei polyps: Implications for adult abundance. Mar. Ecol. Prog. Ser. 2018, 601, 139–151. [Google Scholar] [CrossRef]
  71. Siebert, S.; Juliano, C.E. Sex, polyps, and medusae: Determination and maintenance of sex in cnidarians. Mol. Reprod. Dev. 2017, 84, 105–119. [Google Scholar] [CrossRef]
  72. Yamaguchi, M. Early life history of the sea wasp, Chironex fleckeri (Class Cubozoa). Dev. Cell. Biol. Coelenterates 1980, 11–16. [Google Scholar]
  73. Adams, C.I.; Knapp, M.; Gemmell, N.J.; Jeunen, G.-J.; Bunce, M.; Lamare, M.D.; Taylor, H.R. Beyond biodiversity: Can environmental DNA (eDNA) cut it as a population genetics tool? Genes 2019, 10, 192. [Google Scholar] [CrossRef] [PubMed]
  74. Andres, K.J.; Lodge, D.M.; Sethi, S.A.; Andrés, J. Detecting and analysing intraspecific genetic variation with eDNA: From population genetics to species abundance. Mol. Ecol. 2023, 32, 4118–4132. [Google Scholar] [CrossRef] [PubMed]
  75. Zanovello, L.; Girardi, M.; Marchesini, A.; Galla, G.; Casari, S.; Micheletti, D.; Endrizzi, S.; Fedrigotti, C.; Pedrini, P.; Bertorelle, G. A validated protocol for eDNA-based monitoring of within-species genetic diversity in a pond-breeding amphibian. Sci. Rep. 2023, 13, 4346. [Google Scholar] [CrossRef] [PubMed]
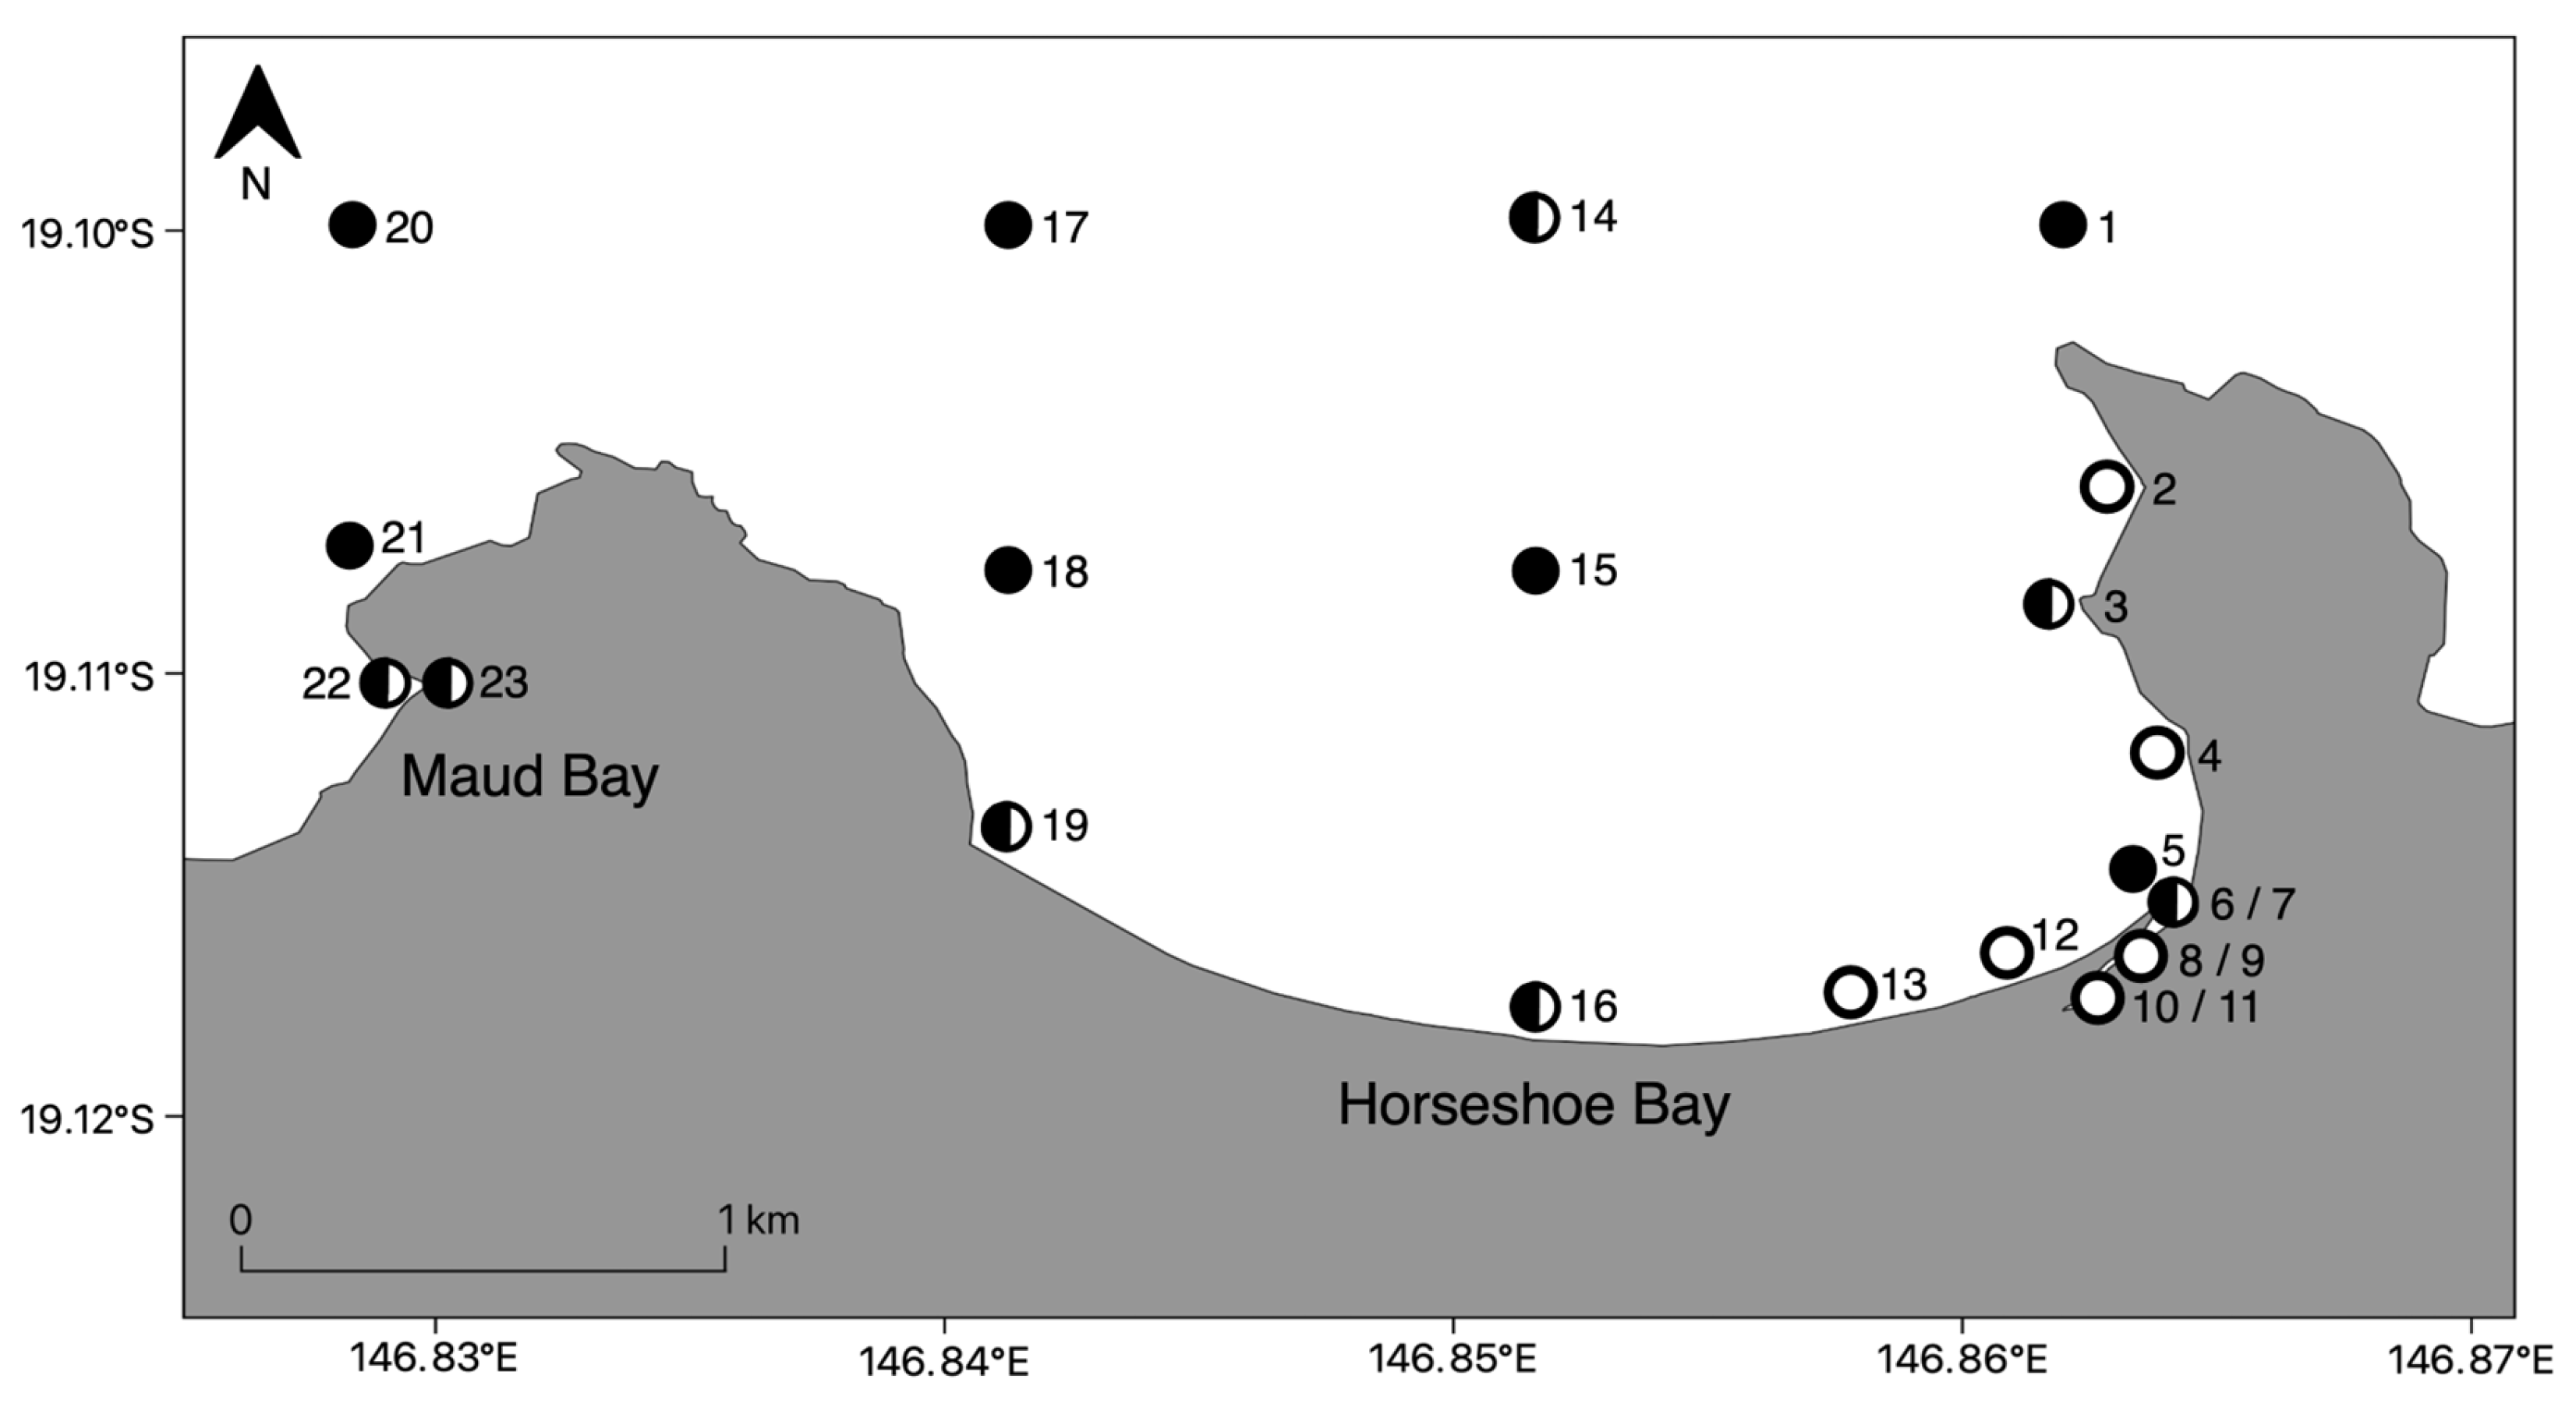
Figure 1. Sampling sites in Horseshoe and Maud Bays, Magnetic Island. Sampling sites are numbered. The circle colours indicate the sampling design: black circles for the grid sampling design, white circles for the modified winter sampling design, and half-white, half-black circles for sites included in both designs. Sites 5, 6, 16, 19, 22, and 23 reflect the nearshore sampling design. Sites 6/7, 8/9, 10/11, and 23 reflect the freshwater inflows.
Coasts 04 00011 g001
Figure 2. Bubble map plot displaying sampling sites along the shore of Horseshoe and Maud Bays with positive detections of Chironex fleckeri medusae, in December 2020. Bubbles indicate eDNA concentrations (copies L−1); colours are for visualisation purposes only.
Coasts 04 00011 g002
Figure 3. Bubble map plot displaying sampling sites along the shore of Horseshoe and Maud Bays with positive detections of Chironex fleckeri medusae, in February 2021. Bubbles indicate eDNA concentrations (copies L−1); colours are for visualisation purposes only.
Coasts 04 00011 g003
Figure 4. Bubble map plot displaying sampling sites within Horseshoe and Maud Bays with positive detections of Chironex fleckeri medusae, in March 2021. Bubbles indicate eDNA concentrations (copies L−1); colours are for visualisation purposes only.
Coasts 04 00011 g004
Figure 5. Bubble map plot displaying sampling sites within Horseshoe and Maud Bays with positive detections of Chironex fleckeri medusae, in December 2021. Bubbles indicate eDNA concentrations (copies L−1); colours are for visualisation purposes only.
Coasts 04 00011 g005
Figure 6. Bubble map plot displaying sampling sites within Horseshoe and Maud Bays with positive detections of Chironex fleckeri polyps, in July 2020. Bubbles indicate eDNA concentrations (copies L−1); colours are for visualisation purposes only.
Coasts 04 00011 g006
Figure 7. Bubble map plot displaying sampling sites within Horseshoe and Maud Bays with positive detections of Chironex fleckeri polyps, in July 2022. Bubbles indicate eDNA concentrations (copies L−1); colours are for visualisation purposes only.
Coasts 04 00011 g007
Figure 8. Bar plot of Chironex fleckeri eDNA concentrations (copies L−1) (1 ± SE) at nearshore sample sites across all sampling times in and out of the jellyfish season.
Coasts 04 00011 g008
Disclaimer/Publisher’s Note: The statements, opinions and data contained in all publications are solely those of the individual author(s) and contributor(s) and not of MDPI and/or the editor(s). MDPI and/or the editor(s) disclaim responsibility for any injury to people or property resulting from any ideas, methods, instructions or products referred to in the content.