Abstract
Among the impacts of climate change in West Africa, coastal erosion is the most threatening disaster apart from floods and the increase in temperatures. The southern coast of the Dakar region, as part of the most threatened coastal zones in West Africa, records the most current coastal damages in Dakar due to its coastline dynamics and low-lying area. This paper investigates the influences of the topography and slope of the beach on shoreline dynamics using remote sensing, cartographic tools and statistical methods such as linear regression. It also states the important role of geomorphologic structures in shoreline dynamics. It was conducted in three littoral cells (Mbao, Bargny and Toubab Dialaw) along the southern coast of Dakar. It helps to understand better the role that topography, slope and geomorphology play in coastal dynamics. The Modified Normalized Difference Water Index (MNDWI) was employed to delineate the coastlines before computing the dynamic rate of the coastline using Digital Shoreline Analysis System (DSAS) software. After that, the topography and slope were determined using a digital elevation model (DEM). Then, the correlation between the coastline dynamic, topography and slope was analyzed using the coefficient of correlation and linear regression model. In the Mbao and Bargny littoral cells where the geomorphology is mostly dominated by soils little or not evolved in situ, there is a significant relationship between the coast line dynamic, topography and slope with a coefficient of correlation of about 0.63 and 0.87, respectively. The relationship is not significant in Toubab Dialaw, where the topography and slope are high, and the geomorphology is mainly characterized by a category of sandstone, with a coefficient of 0.15. We conclude that topography, slope and geomorphology play an important role in the shoreline dynamics in the study area.
1. Introduction
Due to climatic and hydrodynamics factors such as waves, wind, drift, tides, etc., coastal areas are the most dynamic zones in the world. Depending on the degree of porosity and the nature of sediment that composes the coast, they are subjected to changes. The drive factors for these changes are the geological and geomorphological, hydrodynamic, biological, climatic and anthropogenic conditions. Geologic conditions, characterized by the sediment structure type, arrangement, resistance and isostasy, are the basis of morphological processes and the development of coastal relief. In contrast, geomorphologic conditions are determined by climatic factors such as precipitation, rainfall and wind. These geologic and geomorphologic conditions are the generator of the forms of typical relief and sediment supply [1]. In addition, hydrodynamic factors such as waves and wind play an important role in coastal environmental change. If a wave breaks into weak or soft materials, the forward-moving water’s force easily cuts into the littoral. It causes erosion, and the retreat of the shoreline is rapid. Wind is an essential key para- meter in hydrodynamic conditions and generates swell, waves and sea currents. It contributes to this erosion and performs two kinds of erosional work: deflation and abrasion. Deflation is the removal of particles, largely silt and clay, from the ground by the wind. It acts on loose soil or sediment. The second process of wind erosion, abrasion, drives sand-sized particles against an exposed rock or soil surface, wearing down the surface by the impact of the particles [2].
However, the normal functioning of these key generators of erosion is disturbed by climate change. This is a meaningful phenomenon which challenges the economic deve- lopment and prowess of our environment. It is severe in many parts of the world. Most areas in the world are vulnerable to the impacts of climate change, such as advancing seas, coastal erosion, decreasing biodiversity, land salinity, the disappearance of human esta- blishments, ocean acidification, fishing reduction and an unbalance between water supply and water demand, etc. The long-term and immediate impacts of climate change include its massive global effects and implications for small changes in the earth’s orbit. Human actions have an effect on the atmosphere, ecology and seas, which results in a warming of the planet and an increase in air and marine temperatures. Extreme weather, heat waves, storms and flooding, forest fires, reduced safety, economic troubles, long-term effects on human health and the ecosystem, risks to water and food resources, and altitudinal and tree line shifts are all effects of climate change that we are currently experiencing [3]. Furthermore, climate change will accelerate the loss of biodiversity and dwindling freshwater and land resources and increase societal vulnerabilities, particularly in areas where the economies are highly dependent on natural resources [4]. West Africa makes a very small contribution to global climate change, but because of its position and poor capacity for adaptation, it is extremely sensitive to the consequences of climate variability and change. As they rely on rain-fed agriculture and ecosystem services, inhabitants in the dry parts of West Africa, in particular, suffer unfavorable effects from rising temperatures and fluctuating rainfall patterns. In various West African nations, flooding is another typical ha- zard brought on by the environment [5].
In this context, one of the most important effects of climate change on the coastal areas of many countries is sea-level rise. An increase in temperatures is anticipated in addition to the increasing sea levels (between 0.09 and 0.88 m by 2100). The sea level has risen by around 15 cm over the previous century, but due to melting land ice and warming ocean waters, the rate of rise has recently accelerated, and it is anticipated that the sea level will rise by another 30 cm over the next 50 years. The greenhouse effect has primarily been held responsible for this accelerating rate of sea-level rise. The ocean surface is predicted to warm by an extra 2 to 4 °C if atmospheric CO2 doubles during the next 100 years [6]. The rising sea level causes an aggravation of temporary submersion; extension of permanent submersion on low-lying areas; lagoon shores; maritime marshes; coral reefs; reinforcement of erosion actions on cliffs and beaches; increased salinization of estuaries; and reduction in the volume of freshwater aquifers [7]. The consequences of such a natural phenomenon affect the economy through the reduction of agricultural productivity and marine biodiversity, the risk of flooding of port and road infrastructure and the destruction of tourism facilities [8].
One of the effects of sea-level rise is coastal erosion. It is the most threatening disaster in Senegal apart from flooding. Therefore, the Dakar region, like most coastal cities in the world, is not safe from the impacts of coastal erosion. The advance of the sea resulting from the rise in sea level affects the coasts of Dakar [9]. Most tourist facilities are endangered, and up to 180,000 people could lose their homes [10]. Such impacts suggest that vulnerability to sea-level rises will increase substantially over the next few decades. At the local level, the coastal dynamics of the Dakar region show that there is indeed an advance in the sea, which is probably due to variations in oceanic waters aggravated by the effects of hydrodynamic agents, such as wave, tide, wind, geomorphologic and topographic conditions. Therefore, a reduction of coastal areas, human displacement toward inland and the disruption of economic activities (fishing, recreation and hotel and industrial activities) are noted. These threats are accentuated by humankind through sand mi- ning, pollution and illegal settlements along the coast [9].
When combined with the coast’s low-lying nature and low socioeconomic and institutional development, these parameters would suggest that West Africa is vulnerable to sea-level rises. Large areas of land could be lost, and most of the threatened land is wetland areas within deltas or around estuaries and lagoons [10]. Therefore, to protect against coastal erosion, several means are used: protective walls, groin fields, reforestation, dikes, riprap, beach nourishment, dune restoration, beach draining systems and breakwaters. Among these means, some are more effective depending on their quality, their resistance duration against hydrodynamic conditions (swell, winds, sea currents and waves) and the type of coast where they are installed. According to Stewart et al. (2011), long-term coast management is an important and challenging task. Some challenges coastal managers face include maintaining and protecting public access and natural cha- racter, protecting people and property from natural hazards and sustainable planning and use of natural and physical resources [11]. Despite all the endeavors of West African countries against coastal erosion, the coasts are still challenged by this phenomenon. Nevertheless, it is important to note that the impacts of possible responses to sea-level rises vary at the local and regional scales.
This study aims to investigate the contribution of the topography, slope and geomorphological conditions in shoreline dynamics through the use of remote sensing, cartographic tools and statistical methods. The Modified Normalized Difference Water Index (MNDWI) was employed to delineate the coastlines before computing the dynamic rate of the coastline using Digital Shoreline Analysis System (DSAS) software. After that, the topography and slope were determined using a digital elevation model (DEM). Then, the correlation between the coastline dynamic, topography and slope was analyzed through the coefficient of correlation and multiple linear regression model.
2. Study Area
The southern coast of Dakar region is located between 14°43′ north latitude and 17°16′ west longitude. Its coastal length is estimated at 41 km. This study was conducted in three littoral cells (Mbao (3.9 km), Bargny (5.5 km) and Toubab Dialaw (4.9 km)) on the southern coast of the Dakar region (Figure 1). Approximately 500,000, or 17% of the regional population, live in the department of Rufisque [12]. It has infrastructures for industrial, artisanal and industrial fishing. It remains the most vulnerable to erosion due to its high population and the industrial and tourist infrastructures along the coast. The southern coast comprises two maritime facades to the north and south. Its climate is determined by airline conditions. Geographical and atmospheric conditions strongly influence the climate. Three types of wind are noted: the trade wind maritime, harmattan and monsoon. The wind is among the critical factors in the coastal systems generating swell, sea currents and waves and plays an important role in coastal sediment transport. However, the perturbation of these airline conditions in coastal zones accentuates coastal erosion through an increase in storm surge frequency, coastal flooding, dune retreats, dune disappearances, etc. [9]. The southern coast is subjected to a northwest swell whose energy is reduced due to refraction and diffraction around the Cap-Vert Peninsula and the southwest swell, which is more noticeable during the rainy season. Offshore, its energy is lower than the northwest swell (11 kW.m−1 vs. 18 kW.m−1) [13,14,15]. The northwest swell reaches a depth of 13 m with a minimum direction of N200°. Due to its low occurrence and low offshore energy, the importance of this type of swell could be minimized [16,17].
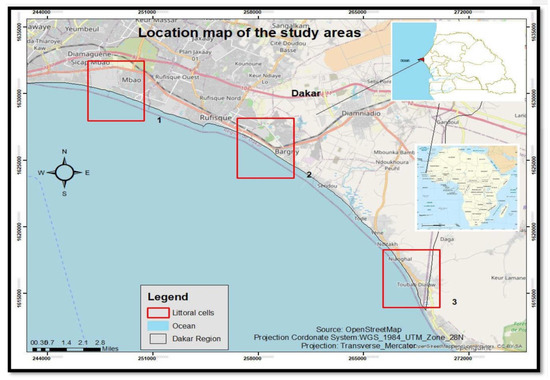
Figure 1.
Location map of the study areas. Source: OpenStreetMap.
The lithology of the southern coast from Mbao to Bargny is marked by outcrops of Lower Eocene (Ypresian) formations with white marl and grey marl and Middle Eocene or Lutetian formations characterized by Bargny limestone, Thiore and Dakh-Abdak marl and limestone. There are also volcanic formations of the Miocene age. The Quaternary is represented by four main types of formations, namely the beach sandstones or beach rocks with an altitude of 1 to 2 m above sea level, the Ogolian dunes of the erg of Pikine with a height of 3 to 7 m and the Nouakchottennes, which are sandy–clay stretches with an a- verage altitude of 2 m above sea level. These formations, from the Ypresian to the Lutetian, are organized in a monoclinal series with a dip of 6 to 12° [15].
The geomorphologic and morpho-pedologic conditions are essential in the morpho-logy and natural coastal erosion dynamic. The limestone plateau of the Bargny–Rufisque district, whose substratum is part limestone and marl from the Eocene age, is found. Geo-morphological units are portrayed by low topography, high porousness and less resistant materials. The characteristics of the geomorphological units in the graben are one of the primary drivers of the vulnerability of Dakar to coastal erosion [18]. These characteristics are marked by five for mations: recent volcanic formation, formation on Maastrichtian sandstone (Cretaceous), formation on marl–limestone rocks (Paleocene–Eocene), recent Ergs and littoral formations. The Cap-Vert Peninsula in Senegal has been the site of si-gnificant magmatic activity. The recent volcanic formation is composed of a Basaltic spread, a low-leaching tropical ferruginous soil on complex material in the head of the Dakar region. These volcanic rocks are scattered over 7000 km2 from Dakar to the east of Thiès [19]. The formation of Maastrichtian sandstone (Cretaceous) can be found in trays and small valley zones and is composed of two types of sediment, lithosols and regosols, on cuirass dismantled on sandstone, which can be found in the tray zones at the center of Dakar and the north close to the coastal dunes and tropical ferruginous soils with little or no leaching and on colluviums, which appear in small valley zones. (Regosols in the World Reference Base for Soil Resources (WRB) are very weakly developed mineral soils in unconsolidated materials. Regosols are extensively eroded lands, particularly in arid and semi-arid areas and mountain regions [20]). The formation of marl–limestone rocks (Paleocene–Eocene) can be found in trays, alluvial plains, cliff zones and the edges of pla-teaus and are composed successively by vertic hydromorphic soils on clayey marly–limestone material, which is strongly tirsified; deep hydromorphic soils on sandy–clayey alluviums; hydromorphic soils on various materials; erosion Rendzina on marl–limestone rocks; and hydromorphic soils on limestone colluvium. (Rendzina soils typically develop from solid or unconsolidated rocky material that is carbonate- or sulphate-rich. Limestone is the most common, but others include dolomite, gypsum, marble, chalk and marlstone [21]). The recent Ergs are composed of inland dunes and coastal dunes: hydromorphic soils in the Niayes area and low-leaching tropical ferruginous soils. Three sediments characterize the littoral formations: sharp coastal dunes and marine beaches—raw mineral soils; semi-fixed coastal dunes—raw mineral soils and holomorphic soils on clayey material; and slightly evolved soils on exuding sands [22]. (The pedogenic process of salinization forms holomorphic soils. The areas where silts and clays make up a large proportion of the soil body are called holomorphic soil [23]).
In our study areas, the composition of the geomorphologic conditions is different regarding the nature of rocks and sediment, their permeability and porousness. Therefore, Mbao littoral cell’s geomorphology is characterized by soils that have little or not evolved in situ (wind soils); soils more or less developed in situ after significant mechanical action; sands; a group of erosion Rendzinas with Rendzine on marly limestone; and the category of sandy–clay colluvium and alluvium. (Colluvium can be defined as being produced by mass–gravity-driven transport on steep slopes, and alluvium is produced by water-driven transport on floodplains and wind soil [24]). Alluvium is loose clay, silt, sand or gravel deposited by running water in a stream bed, on a floodplain, in an alluvial fan or beach or similar settings [24]). In Bargny, the following geomorphologic features are distinctive: soils that have little or not evolved in situ (wind soils); the category of sandy–clay alluvium; and soils more or less developed in situ after significant mechanical action. Depleted sandstone; eolian soil; Dior soils on sandy–clay colluvium; and soils that have little or not evolved in situ are the defining features of Toubab Dialaw (Figure 2). (Dior soils constitute the wealth of Senegal; the dunes they form are highly favorable to peanut cultivation, whereas the soils between the dunes are suitable for other food crops, such as sorghum [25]).
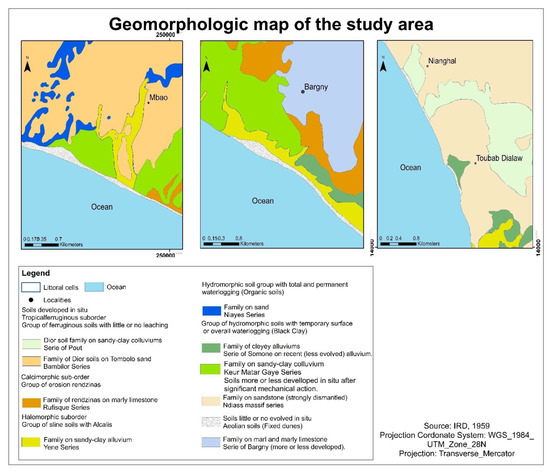
Figure 2.
Geomorphologic conditions of the Mbao, Bargny and Toubab Dialaw littoral cells. Source: IRD, 1959.
3. Materials and Methods
In this study, remote sensing and statistical techniques were used to analyze the relationship between coastline dynamics and topography and slope conditions. Using the historical Landsat images, the Modified Normalized Difference Water Index (MNDWI) was employed to delineate the coastlines before computing their evolution rate. After that, the relationship between the coastline dynamic rate, topographic and slope conditions was analyzed through the correlation coefficient and linear regression model. The following flow chart summarizes the methodology employed in this study (Figure 3).
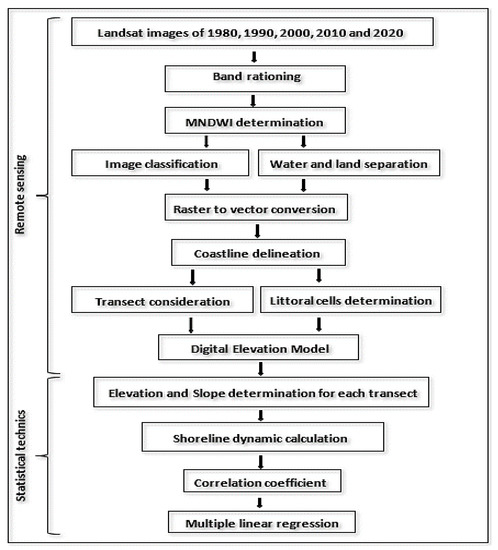
Figure 3.
Flow chart summarizing the methodology adopted in this study [26] accessed on 9 July 2021.
3.1. Data Source
The data used in this study are five different Landsat images from 1980, 1990, 2000, 2010 and 2020. These images are characterized by the provided satellite, sensor, path and row, the number of bands and the acquisition date. Topographic data from GLO-30 DEM and geomorphologic data from the website (http://sphaera.cartographie.ird.fr/ (accessed on 7 May 2022)) were also employed.
The following table summarizes all helpful information related to the different Landsat images (Table 1).

Table 1.
Landsat image information (1980, 1990, 2000, 2010 and 2020) for Dakar region, Senegal.
These Landsat images were processed using the QGIS software’s semi-automatic classification plugin. According to Congedo (2021), a semi-automatic classification plugin was created in Python to make land cover monitoring easier. By simplifying and automa-ting the land cover classification phases, from downloading remote sensing data to analysis, it offers a set of interconnected tools and a user interface. It enables image processing with tools for classifying or analyzing land cover. Additionally, it permits post-processing using instruments to enhance and assess the classification’s accuracy or incorporate additional data [27]. After processing of the images, the Modified Normalized Difference Water Index (MNDWI) is used for the coastline delineations.
3.2. The Use of the Modified Normalized Difference Water Index (MNDWI)
To better dissociate the land surface and sea, the Modified Normalized Difference Water Index (MNDWI) was used in this study (Figure 4). For that, the band rationing technique was employed using near infrared (NIR) and short-wave infrared (SWIR) [28]. The bands 2 and 5 for Landsat 5 TM and Landsat 7 were used. For Landsat 8, bands 3 and 6 were used. In MNDWI, the highest value is +1, and the lowest is −1. The threshold value for classification is 0.
MNDWI = (GREEN) − (SWIR)/(GREEN) + (SWIR)
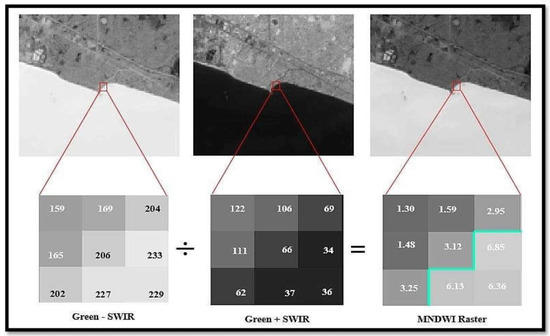
Figure 4.
Band rationing of Landsat-OLI imagery of the southern coast for delineating the shoreline. Source: glovis.usgs.gov.
The Modified Normalized Difference Water Index (MNDWI) originates from the Normalized Difference Water Index (NDWI), which is calculated using two near-infrared channels. These two indices are enhancement techniques using band rationing. According to Gao (1996), the NDWI is used for remote sensing vegetation liquid water interacting with solar radiation [29]. In a study, McFeeters (1996) stated that this NDWI takes benefits from the condition where the presence of features that show higher near-infrared reflectance and lower red light reflectance (e.g., terrestrial vegetation) will be enhanced, while those with low red light reflectance and very low NIR reflectance (e.g., water) will be suppressed or eliminated [30]. This NDWI is modified by substituting a middle infrared band, such as Landsat TM band 5, for the near-infrared band used in the NDWI. To enhance and extract water information in the water regions where the background is dominated by built-up land areas, the MNDWI is more suitable than the NDWI because it reduces or even removes built-up land and vegetation noise [31] (Figure 4).
3.3. Classification, Digitalization and Coastline Delineations
Landsat images for each year (1980, 1990, 2000, 2010 and 2020) from the MNDWI calculation were used to analyze the coastline dynamics. The MNDWI images were classified to distinguish the land and sea boundary. Note the threshold value for classification is 0. Next, these classified raster images were converted to vector layers from which the coastline was delineated using the editing tool in arcGIS (Figure 5).
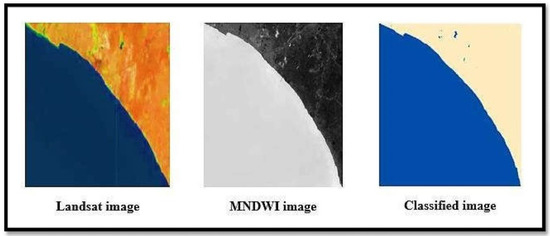
Figure 5.
The classified image based on the MNDWI of the southern coast of Dakar.
3.4. Shoreline Dynamic Calculation
Two methods were used to analyze the shoreline retreat in Senegal over time. The first one was primarily concerned with interpreting old geological maps in relation to sea levels. The second method involved analyzing modern geospatial tools that included ae-rial photos and cadastral maps. Nonetheless, the accessibility of satellite pictures and va-rious computerized geospatial analytic techniques has benefited the monitoring of coastal erosion [32]. In this study, satellite images and Digital Shoreline Analysis System (DSAS) software, which is an extension in Arc GIS 10.7, are used for the shoreline velocity between 1980 and 2020. For that, the distance of shoreline movement is divided by the time elapsed between the oldest and the youngest shorelines. The advantage of this statistical method is that the dynamic rate is computed easily through the end point rate (EPR) [33]:
where:
EPR = NSM/TE
- EPR = end point rate (EPR) statistical method is computed by dividing the net shoreline movement (NSM) by the time elapsed between the oldest and the youngest shorelines;
- NSM = net shoreline movement is the distance between the most recent shorelines and the oldest shorelines for each transect and is measured in meters (m);
- ET = elapsed time between 1980 and 2020 [33,34,35,36,37,38,39].
3.5. Littoral Cells and Transect Determinations
According to Inman (2005), a littoral cell is a coastal compartment containing a complete sedimentation cycle, including sources, transport paths and sinks. The cell boundaries delineate the geographical area within which the sediment budget is balanced, providing the framework for the quantitative analysis of coastal erosion and accretion. The sediment sources are commonly streams, sea cliff erosion, onshore migration of sandbanks and material of biological origin such as shells, coral fragments and skeletons of tiny marine organisms. The usual transport path is along the coast by waves and currents (longshore transport, longshore drift or littoral drift). Cross-shore (on/offshore) paths may include windblown sand, overwash and ice-push. The sediment sinks are usually offshore losses at submarine canyons and shoals or onshore dune migration, rollover and deposition in bays and estuaries [34]. This study has considered three littoral cells: Mbao, Bargny and Toubab Dialaw on the southern coast of Dakar. In each littoral cell, over 80 transects were taken into account, and the distance between two transects is estimated at 50 m (Figure 6). For each transect, the coastline dynamic rate, average topographic values of 5 intersects (1980, 1990, 2000, 2010 and 2020) (Figure 7) and slope value was employed to a-nalyze their relationship.
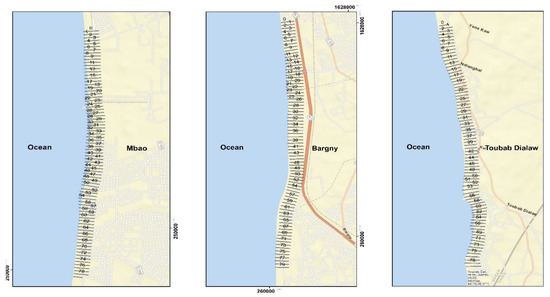
Figure 6.
Transect considerations in Mbao, Bargny and Toubab Dialaw littoral cells.
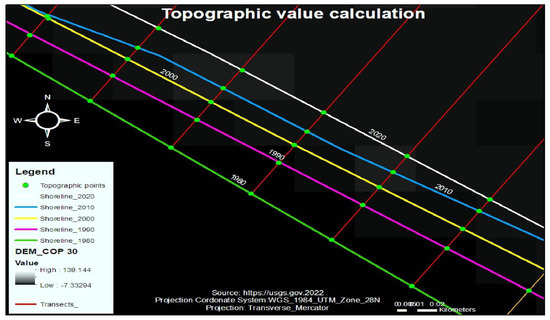
Figure 7.
Determination of the topographic values in the study area. Source: GLO-30 DEM.
3.6. Determination of Elevation Value for Each Transect Using a DEM Copernicus Raster
In this study, elevation is defined as the height of a topographic point (intersect). Its value is measured by extracting the corresponding topographic value of each intersect using X and Y coordinate intersect points and a digital elevation model. The average elevation value of the years 1980, 1990, 2000, 2010 and 2020 for each transect is considered. It was determined in Mbao, Bargny and Toubab Dialaw littoral cells (Figure 7).
3.7. Slope Determination
Coastal areas are the most dynamic part of the terrestrial sphere. Several factors and processes lead to this dynamism. Far from being negligible, slope plays an essential role in shoreline dynamics. Most often, the lower it is, the faster the shoreline retreat. Low- lying areas are more exposed to submersion than coastal areas with high topographic values. In this study, the slope is included in the relationship between the topography and shoreline dynamic to power the linear regression prediction. It was determined using a digital elevation model Copernicus raster and the spatial analysis tool in ArcGIS (Figure 8).
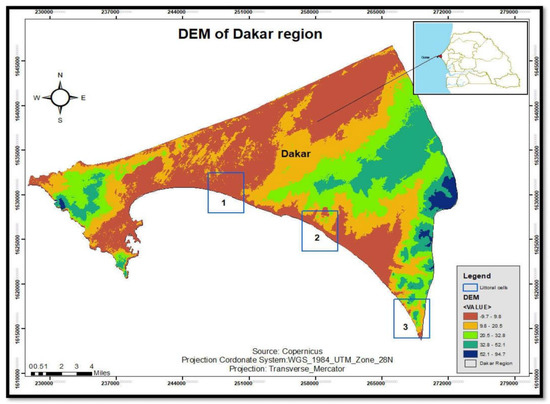
Figure 8.
Determination of the slope values in the study area. Source: GLO-30 DEM.
3.8. Linear Regression between Coastline Dynamic, Slope and Topography
In a study, Uyanık and Güler (2013) state that ‘regression analysis is a statistical technique for estimating the relationship among variables which have reason and result relation. The mean focus of univariate regression is to analyze the relationship between a dependent and one independent variable and formulates the linear relationship equation between the dependent and independent variable’ [35]. The following formula is used to point out the correlation between the coastline dynamic, slope and topography:
where:
Y = β1Xi,1 + β2Xi,2 + β3Xi,3 + Ɛ
Y = predicted variable.
Xi,1 = EPR; Xi,2 = slope; Xi,3 = topography.
βi (1,2,3) = parameters to be estimated or model parameters.
Ɛ = the error term.
3.9. Multicollinearity Test
In a study, Oke et al. (2022) stated that ‘Multicollinearity is a statistical phenomenon in which there exists a strong or perfect relationship between the predictor variables. The presence of multicollinearity can cause serious problems with the estimation of and the interpretation’ [36]. Therefore, a much higher correlation between the explanatory variables means more risk in the statistical inference about the significance of the regression coefficients. Various tests and diagnostic measures of multicollinearity have been proposed in the econometric literature. Some measures are available for diagnosing multicollinearity, such as the variance inflation factor (VIF), condition number (CN), condition index (CI) and variance decomposition [37]; chi-square test statistic [38,39]; and an F-test by regressing each of the independent variables on the remaining independent variables. The VIF, a well-known meas ure of multicollinearity, is defined as:
where is the coefficient of determination of the regression of the i-th column of X on the remaining columns of X. Based on the VIF diagnostic measure, multicollinearity is severe whenever the VIF is more than 10. There is no logical reasoning behind the value 10 [40]. In this study, a multicollinearity was performed to point out the dependence among independent variables (Table 2).

Table 2.
The variance inflation factor of independents variables (topography and slope).
The results from the multicollinearity test show that there is no collinearity among independents variables because the square roots of the VIF are lower than 5.
3.10. Specification of the Model
Akaike information cri terion (AIC), Bayesian information criterion (BIC) and R2 are employed. In a study, Romero (2007) stated that it is usual practice in econometrics to employ R2 in model selection. This goodness-of-fit measurement, along with others, such as unadjusted R squared, Akaike Information Criterion and Bayesian Information Criterion, are almost always available to researchers using econometric software [41].
Therefore, a prominent approach for selecting models is the Akaike Information Criterion (AIC). It is widely employed at parameter space singularities and borders to violate regularity conditions [42], whereas a helpful metric for comparing multilevel models is the Bayesian Information Criterion. The BIC has a number of benefits over conventional hypothesis-testing techniques [43]. According to Yulistiani and Suliadi (2019), good criteria for model selection can use Bayesian Information Criterion (BIC) [44]. For model selection in linear mixed models, one may use Akaike Information Criterion (AIC) or Bayesian Information Criterion (BIC). Distinct random effect specifications result in different cova-riance structures of observation because linear mixed models might provide a specific structure of dependency among responses [45] (Table 3).

Table 3.
Specification of the model using AIC, R2 and BIC tests.
M0 = model without diagnostic; M1 = model that is neither outlier nor influencer.
The lower the AIC, the better the model is. The higher the R2 is, the better the model is. The lower the BIC is, the better the model is.
The AIC of the M1 model (637) is lower than the one in M0 (671). The higher R2 is recorded in the M1 model (0.54) and the lower in M0 (0.52). For the BIC, the lower is re-corded in M1 and the higher in M0 (685). Based on these results, model M1 was chosen.
4. Results
The average coastal dynamics from 1980 to 2020 in Mbao, Bargny and Toubab Dialaw were estimated at −1.04, −1.17 and −0.06 m/year, respectively. The average dynamics in all littoral cells is about −0.75 m/year. High topographic values were recorded at Toubab Dialaw with an average of 5.27 m, while low topographic values were noted in Mbao (1.85 m) and Bargny (1.37 m). With regard to slope, Toubab Dialaw recorded an average of 17.92°, while Mbao and Bargny recorded 4.98 and 3.45°, respectively. In terms of geomorphology, the Mbao coast is characterized by soils little or not evolved in situ (wind siols), soils more or less developed in situ after significant mechanical action, sands, group of erosion renzinas with rendzine on marly limestone and category of sandy clay alluvium and colluvium. In Bargny, the geomorphology is marked by soils little or not evolved in situ (wind soils), category of sandy-clay alluvium and soils more or less developed in situ after significant mechanical action. Toubab Dialaw is characterized by depleted sandstone, eolian soil, Dior soil on sandy-clay colluvium and soils little or not evolved in situ (wind soils). A positive correlation between coastline dynamics, topography (elevation) and slope is noted at Mbao (0.63) and Bargny (0.87). However, in Toubab Dialaw, the correlation coefficient is not significant (0.15) (Table 4).

Table 4.
Littoral cells, transect considerations and statistic values.
Linear Regression between Coastline Dynamic, Topography and Slope
The following figures show the linear regression of the topography (elevation) and dynamic shoreline rate (EPR) in different littoral cells of the study area (Figure 9).
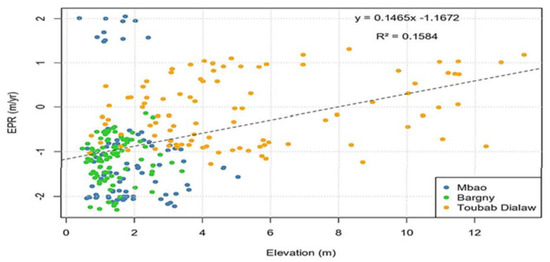
Figure 9.
Cross plot of the shoreline change rate (EPR) and topography in the three littoral cells.
The coefficient of correlation between the coastline dynamic and slope is estimated at 0.56 in Mbao and 0.87 in Bargny, whereas in the littoral cell of Toubab Dialaw, the coefficient is lower than those recorded in Mbao and Bargny (0.06) because of high slope values with an average of about 17.92° and a low dynamic rate of −0.06 m/year (Figure 10).
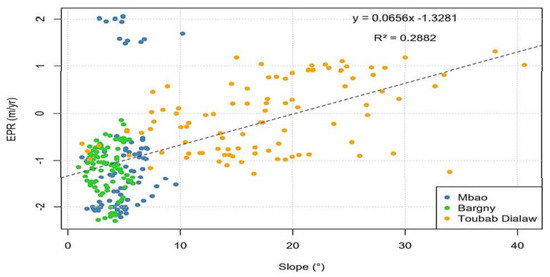
Figure 10.
Cross plot of the shoreline change rate and slope in the three littoral cells.
The following figure is the box plot of the topography, slope and coastline dynamic rate (EPR) in the three littoral cells. It helps to understand the distributional characteristics of the topography, slope and coastline dynamic value in each littoral cell. For the topo-graphy, the upper quartiles in Mbao and Bargny are lower than 2.5 m, whereas in Toubab Dialaw, 50% of the observed values exceed 4 m. In terms of slope, all quartiles are lower than 10.5°. In Toubab Dialaw, 75% of observations are higher than 10°. In Mbao and Bargny, 75% of quartiles regarding the coastline dynamic rate are lower than 0.8 m/year, whereas, in Toubab Dialaw, 75% of quartiles are higher than 0.8 m/year (Figure 11).
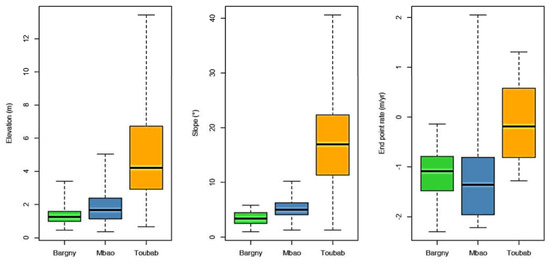
Figure 11.
Box plot of the topography (elevation), slope and EPR in the three littoral cells.
5. Discussion
In the context of climate change, the recorded temperatures in the world show an increase in the global trend. Consequently, global warming is noted. The effects of this global warming on the hydrosphere and cryosphere cause ice melting and dilating sea-water, leading in most coastal areas in the world to a coastline retreat resulting from sea-level rises. The effects of this rising sea level combined with human activities, such as sand mining and abnormal settlement, lead to coastal erosion, which is accentuated by the effects of hydrodynamic agents [46]. In addition, geologic and geomorphologic conditions along the coasts play an important role in this coastline dynamic. According to Adjoussi (2001), three different activities determine the geological history of the Dakar region: vo-lcanic activities, marine transgressions and regressions, which were observed from the pre-Quaternary period up to the Quaternary period in the Dakar region, and the geomorphological structure is the result of the evolutionary dynamics of these geological formations [47].
The coastal shapes observed in the Dakar region evidence that there is a difference in terms of the geomorphologic composition and topographic and slope conditions. Therefore, due to its geographical position in the sea and low-lying areas, the Dakar region is vulnerable to coastal erosion, the most threatening disaster that challenges coastal communities. In this study, the average shoreline dynamic in Mbao, Bargny and Toubab Dialaw littoral cells from 1980 to 2020 are estimated, respectively, at −1.04, −1.17 and −0.06 m/year. In all littoral cells, the average dynamics is roughly −0.75 m/year. These dynamic rates are similar to those found in some studies about coastline dynamic assessment. Diallo (1982) found that the rate of shoreline evolution was −1.29 m per year. Sall (1982) found −1.3 m/year of coastline erosion in the same location, while Niang Diop (1996) found −1.2 m/year of coastal change. According to Dieye (2000), the coastline between Bel Air and Rufisque is showing annual erosion at a rate of 0.6 meters per year. Guerin (2003) found a 0.77 percent annual erosion of the shoreline. Ndour (2015) noted an approximate dynamic rate of −1.6 m/year [14,15,17,48,49,50]. These dynamic rates are similar to those observed in other West African countries. For example, the dynamics of the coastline on a portion of the West Cameroon Coast from Batoke to Seme Beach was estimated at −1.09 m/year between 1979 and 2018 by Arnaud in 2019 [51]. In Ghana, Jonah estimates the average dynamic rates at −1.24 and −0.85 m/year in the medium and short term periods, respectively [52]. In Côte d’Ivoire, it was estimated at −1.40 m/year in the report on coastal management practices in West Africa in 2019 [53].
While climatic and hydrodynamic conditions contribute to coastal erosion, it should be noted that topography and slope play an important role in this erosion. The morpho-logy of the Rufisque department shows high topographic levels forming two plateaus in the northwest (Cap des Biches) and the southeast (Kolobane, Arafat), separated by a depression in the center (Keury Souf) [54]. Therefore, in the littoral cell of Toubab Dialaw, high topographic values were observed with an average of 5.27 m, whereas low topographic values were observed in Mbao (1.85 m) and Bargny (1.37 m). In terms of slope, Mbao and Bargny registered 4.98 and 3.45°, respectively, while Toubab Dialaw recorded an average of 17.92°.
Even though topography and slope are two of the most essential factors determining how vulnerable coastal zones are to erosion, geomorphologic characteristics along the beaches are crucial to this shoreline dynamic. In a study, Bird (2008) stipulated that the feature of a coastline may vary due to large-scale geology factors, surface processes and the effects of recent changes in the relative level of the sea and land [55]. The geomorphology of the Mbao shore is characterized by soils little or not evolved in situ (wind soils); soils more or less developed in situ after significant mechanical action; sands; group of erosion Rendzinas with Rendzine on marly limestone; and the category of sandy–clay alluvium and colluvium. In Bargny, the following geomorphologic features are distinctive: soils little or not evolved in situ (wind soils); the category of sandy–clay alluvium; and soils more or less developed in situ after significant mechanical action. Depleted sandstone; eolian soil; Dior soils on sandy–clay colluvium and soils little or not evolved in situ are the defining features of Toubab Dialaw.
The results of this study show that the geomorphologic conditions intervene in the relationship between the coastline dynamic rate, topography and slope. For example, in the Mbao and Bargny littoral cells, there is a significant relationship between the topographic and slope conditions and coastline dynamic with a coefficient of correlation of about 0.63 and 0.87, respectively. The geomorphology in these coasts is most characterized by soils little or not evolved in situ (wind soils), with high porosity and water infiltration and is generally subjected to erosion. Contrary to the Toubab Dialaw littoral cell where the geomorphology is marked by a category of sandstone (strongly dismantled), it is less exposed to erosion due to its less porous characteristic and the high compacity of soil. Sandstone is a sedimentary rock made of sand-sized grains of mineral, rock or organic material bonded together over time by natural processes. Strongly disassembled sandstone has suffered extensive physical weathering, such as by the action of wind, water or ice, which has caused it to disintegrate into smaller pieces. According to Boggs (2012), 20 to 25 % of all sedimentary rocks are sandstones, which can include different levels of se-diment [56]. Sandstone and other siliciclastic sedimentary rocks undergo a significant dia- genetic process known as sedimentation. It significantly contributes to decreasing the porosity of sedimentary rocks and may have an impact on sediment compaction [57]. The relationship in Toubab Dialaw is not significant, with a correlation coefficient of about 0.15, assuming that the average of the topography (5.27 m) and slope (17.92°) do not favor high shoreline dynamic rates, and the geomorphologic conditions do not allow rapid erosion because of its compacity and impermeability of geomorphological structures.
Some efforts were made in order to fight against coastal erosion in Senegal, particularly on the southern coast of Dakar region. In a study, it is stated that faced with this coastal erosion, the Senegalese government adopted some adaptation measures depen-ding on the means at its disposal: protective walls, reforestation, protective dikes, rock fills, dune replenishment, beach drainage systems, breakwaters, etc. Among these protective measures, some are more effective depending on their quality, their duration of resistance against hydrodynamic parameters and the type of coastline where they are installed [46]. However, it should be noted that these protective infrastructures constitute a significant constraint on sedimentary exchanges between continents and oceans. To better manage coastal erosion and pollution, 26 additional development and preservation projects have been inventoried for an estimated budget of more than XOF 30 billion [58]. Despite all the endeavor that the Senegalese government made, coastal erosion still remains a challenge for communities living along the coasts.
6. Conclusions
In summary, this study was undertaken to investigate if there is a relationship between the coastline dynamic, topographic and slope and the contribution of the geomorphology along the southern coast of Dakar. It provides a better understanding of the roles of topography, slope and geomorphology in coastal dynamics using remote sensing, cartographic tools and statistical methods. It also allows for more knowledge about the most vulnerable coastal areas in terms of topography, slope and geomorphology. In the littoral cells of Mbao and Bargny where the topography and slope are low, the average shoreline dynamics are estimated, respectively, at −1.04 and −1.17 m/year. In contrast to the littoral cell of Toubab Dialaw where the topography and slope are more important, the average shoreline dynamic rate is about −0.06 m/year. Therefore, the geomorphologic structure plays an essential role in the relationship between the topography, slope and shoreline dynamic. For example, in the Mbao littoral cell, where porous and erodible structures characterize the geomorphologic condition, there is a positive relationship between the topography, slope and coastline dynamic (0.63). In the littoral cell of Bargny, the relationship between the topography, slope and coastline dynamic is positive with a coefficient of about 0.87, whereas, in the Toubab Dialaw littoral cell, the coefficient of correlation (0.15) is not significant. This is because of the domination of compact and impermeable structures in this coastal zone. Even though topography, slope and geomorphology play a vital role in the shoreline dynamic, it should be important to search for an answer to the following question: what about the contribution of the population to the shoreline dynamic?
Author Contributions
Conceptualization, I.P., D.P.A., J.A.N. and A.S.; methodology, I.P.; software, I.P.; validation, I.P., D.P.A., J.A.N. and A.S.; formal analysis, I.P.; investigation, I.P.; resources, I.P.; data curation, I.P.; writing—original draft preparation, I.P.; writing—review and editing, I.P.; visualization, I.P.; supervision., D.P.A., J.A.N. and A.S.; project administration, I.P.; funding acquisition, I.P. All authors have read and agreed to the published version of the manuscript.
Funding
This research was funded by the West African Science Service Centre on Climate Change and Adapted Land Use (WASCAL).
Institutional Review Board Statement
Not applicable.
Informed Consent Statement
Not applicable.
Data Availability Statement
EPR, topography and slope datasets are available upon a request at pouye.i@edu.wascal.org. Geomorphologic dataset are avialable at http://sphaera.cartographie.ird.fr.
Acknowledgments
I appreciate the opportunity to conduct a study at the Institute of Environmental Social Sciences and Geography at the Albert Ludwig University in Freiburg, Germany and the West African Science Service Centre on Climate Change and Adapted Land Use (WASCAL). Support was offered in the form of funding, remote sensing, charting and statistical technics.
Conflicts of Interest
The authors declare no conflict of interest.
References
- Łabuz, T.A. Environmental Impacts—Coastal Erosion and Coastline Changes—Second Assessment of Climate Change for the Baltic Sea Basin; BACC II Author Team, Ed.; Springer International Publishing: Cham, Switzerland, 2015; pp. 381–396. [Google Scholar] [CrossRef]
- Strahler, A. Introducing Physical Geography, 6th ed.; Wiley: Hoboken, NJ, USA, 2013. [Google Scholar]
- Bhatt, R. Consequences of Climate Change Impacts and Implications on Ecosystem and Biodiversity; Impacts of Developmental Projects and Mitigation Strategy in Nepal; IntechOpen: London, UK, 2021. [Google Scholar] [CrossRef]
- IPCC. Climate Change and Land: IPCC Special Report on Climate Change, Desertification, Land Degradation, Sustainable Land Management, Food Security, and Greenhouse Gas Fluxes in Terrestrial Ecosystems; Cambridge University Press: Cambridge, UK, 2022. [CrossRef]
- Teye, J. Migration in West Africa: An Introduction; Springer: Cham, Swtzerland, 2022; pp. 3–17. [Google Scholar] [CrossRef]
- Duxbury, A.B.; Duxbury, A.C.; Sverdrup, K.A. Fundamentals of Oceanography, 4th ed.; Mc Graw Hill: New York, NY, USA, 2002. [Google Scholar]
- Paskoff, R. L’élévation du Niveau de la Mer et les Espaces Côtiers: Le Mythe et la Réalité; Institut Océanographique: Paris, France, 2001. [Google Scholar]
- MEPN/DEEC. Deuxième Communication Nationale du Sénégal sur les Changements Climatiques; MEPN: Dakar, Senegal, 2010. [Google Scholar]
- Pouye, I.; Adjoussi, D.P.; Ndione, J.A.; Sall, A.; Adjaho, K.D.; Gomez, M.L. Coastline Dynamics Analysis in Dakar Region, Senegal from 1990 to 2040. Am. J. Clim. Chang. 2022, 11, 23–36. [Google Scholar] [CrossRef]
- Nicholls, R.J.; Mimura, N. Regional issues raised by sea-level rise and their policy implications. Clim. Res. 1999, 11, 5–18. [Google Scholar] [CrossRef]
- Stewart, C.; Becker, J.; Coomer, M. Community Perceptions of Coastal Processes and Management Options for Coastal Erosion; Technical Report 2011/09; Waikato Regional Council: Hamilton, New Zeland, 2011; p. 116. [Google Scholar]
- GRDR. Rapport sur le Système Alimentaire du Département de Rufisque. 2017. Available online: https://www.grdr.org/IMG/pdf/grd-_rapport_satrufisque_lowdefb-2.pdf (accessed on 6 March 2023).
- Barusseau, J.P. Essai d’évaluation des transports littoraux sableux sous l’action des houles entre Saint-Louis et Joal (Sénégal). Bull. Liaison L’association Sénégalaise Pour L’etude Du Quat. Afr. Dakar 1980, 31–39. [Google Scholar]
- Sall, M. Dynamique et Morphogenèse Actuelles au Sénégal Occidental. Ph.D. Thesis, Université Louis Pasteur, Strasbourg, France, 1982. [Google Scholar]
- Niang-Diop, I. L’érosion Côtière sur la Petite Côte du Sénégal à Partir de l’ensemble de Rufisque: Passé, Présent et Futur. Ph.D. Thesis, Université d’Angers, Angers, France, 1996. [Google Scholar]
- Nardari, B. Analyse de la houle sur les côtes du Sénégal, application à la pointe de Sangomar. In Rapport de Stage, UTIS, ISRA/ORSTOM, Dakar; Université de Toulon et du Var: La Garde, France, 1993; p. 31. [Google Scholar]
- Guerin, K. Dynamique du littoral sableux de Tiaroye à Bargny (Baie de Gorée—Sénégal). Ph.D. Thesis, Université de Paris 1—Sorbonne-Panthéon, Paris, France, 2003. [Google Scholar]
- Sane, M.; Yamagishi, H. Coastal Erosion in Dakar, Western Senegal. J. Jpn. Soc. Eng. Geol. 2004, 44, 360–366. [Google Scholar] [CrossRef]
- Barusseau, J.P.; Serrano, O.; Nehlig, P.; Duvail, C. Notice Explicative de la Carte Géologique du Sénégal à 1/500,000, Feuilles Nord-Ouest, Nord-Est et Sud-Ouest. 2009. Available online: https://www.au-senegal.com/cartes-geologiques-du-senegal,15640.html?lang=fr (accessed on 4 May 2022).
- FAO; WRB. International Soil Classification System for Naming Soils and Creating Legends For Soil Maps. World Soil Resour. Rep. 2014, 106, 106. [Google Scholar]
- Soil Classification System of England and Wales. Cranfield University, UK, National Soil Resources Institute. Available online: http://www.soilsworldwide.net/index.php/Soil_classification_system_of_England_and_Wales (accessed on 1 January 2023).
- USAID project/RSI N 685-0233. 2021. Available online: https://pdf.usaid.gov/pdf_docs/PDAAQ050.pdf (accessed on 20 June 2021).
- Musa, D.A. Study of Holomorphic Soil in SuleTankarkar Local Government Area of Jigawa State Using Remote Sensed Data. J. Environ. Earth Sci. 2016, 6, 132–140. [Google Scholar]
- Miller, B.A.; Juilleret, J. The colluvium and alluvium problem: Historical review and current state of definitions. Earth-Sci. Rev. 2020, 209, 103316. [Google Scholar] [CrossRef]
- Senegal—Lamd|Britannica. Available online: https://www.britannica.com/place/Senegal/Land (accessed on 13 April 2022).
- Kumar, A.; Narayana, A.C.; Jayappa, K.S. Shoreline changes and morphology of spits along southern Karnataka, west coast of India: A remote sensing and statistics-based approach. Geomorphology 2010, 120, 133–152. [Google Scholar] [CrossRef]
- Congedo, L. Semi-Automatic Classification Plugin: A Python tool for the download and processing of remote sensing images in QGIS. J. Open Source Softw. 2021, 6, 3172. [Google Scholar] [CrossRef]
- Munasinghe, D.; Cohen, S.; Gadiraju, K. A Review of Satellite Remote Sensing Techniques of River Delta Morphology Change. Remote Sens. Earth Syst. Sci. 2021, 4, 44–75. [Google Scholar] [CrossRef]
- Gao, B.C. NDWI—A normalized difference water index for remote sensing of vegetation liquid water from space. Remote Sens. Environ. 1996, 58, 257–266. [Google Scholar] [CrossRef]
- McFeeters, S.K. The use of the Normalized Difference Water Index (NDWI) in the delineation of open water features. Int. J. Remote Sens. 1996, 17, 1425–1432. [Google Scholar] [CrossRef]
- Xu, H. Modification of normalised difference water index (NDWI) to enhance open water features in remotely sensed imagery. Int. J. Remote Sens. 2006, 27, 3025–3033. [Google Scholar] [CrossRef]
- Koulibaly, C.T.; Ayoade, J.O. The Application of GIS and Remote Sensing in a Spatiotemporal Analysis of Coastline Retreat in Rufisque, Senegal. Geomatics Environ. Eng. 2021, 15, 55–80. [Google Scholar] [CrossRef]
- Himmelstoss, E.A.; Henderson, R.E.; Kratzmann, M.G.; Farris, A.S. Digital Shoreline Analysis System (DSAS) Version 5.0 User Guide; U.S. Geological Survey: Reston, VA, USA, 2018. [Google Scholar] [CrossRef]
- Inman, D.L. Littoral Cells BT—Encyclopedia of Coastal Science; Schwartz, M.L., Ed. Springer: Dordrecht, The Netherlands, 2005; pp. 594–599. [Google Scholar] [CrossRef]
- Uyanık, G.K.; Güler, N. A study on multiple linear regression analysis. Procedia Soc. Behav. Sci. 2013, 106, 234–240. [Google Scholar] [CrossRef]
- Oke, J.A.; Akinkunmi, W.B.; Etebefia, S.O. Use of correlation, tolerance and variance inflation factor for multicollinearity test. Glob. Sci. J. 2019, 7, 652–659. [Google Scholar]
- Belsley, D.; Kuh, E.; Welsch, R. Regression Diagnostics: Identifying Influential Data and Sources of Collinearity; John Wiley & Sons: Hoboken, NJ, USA, 1980; Volume 144. [Google Scholar] [CrossRef]
- Farrar, D.; Glauber, R. Multicollinearity in Regression Analysis: The Problem Revisited. Rev. Econ. Stat. 1967, 49, 92–107. [Google Scholar] [CrossRef]
- Haitovsky, Y. Multicollinearity in Regression Analysis: Comment. Rev. Econ. Stat. 1969, 51, 486–489. [Google Scholar] [CrossRef]
- Mohammadi, S. A test of harmful multicollinearity: A generalized ridge regression approach. Commun. Stat. Theory Methods 2020, 51, 724–743. [Google Scholar] [CrossRef]
- Romero, A. A Note on the Use of R-squared in Model Selection; College of William and Mary: Williamsburg, VA, USA, 2007. [Google Scholar]
- Mitchell, J.; Allman, E.; Rhodes, J. A generalized AIC for models with singularities and boundaries. arXiv 2022, arXiv:2211.04136. [Google Scholar]
- Lorah, J.; Womack, A. Value of sample size for computation of the Bayesian information criterion (BIC) in multilevel modeling. Behav. Res. Meth. 2019, 51, 440–450. [Google Scholar] [CrossRef] [PubMed]
- Yulistiani, S.; Suliadi, S. Deteksi Pencilan pada Model ARIMA dengan Bayesian Information Criterion (BIC) Termodifikasi. Stat. J. Theor. Stat. Appl. 2019, 19, 29–37. [Google Scholar] [CrossRef]
- Lee, Y. A Note on Performance of Conditional Akaike Information Criteria in Linear Mixed Models. Commun. Stat. Appl. Meth. 2015, 22, 507–518. [Google Scholar] [CrossRef]
- Pouye, I. Modification des Conditions Climatiques et Avancée de la Mer au Niveau de la Côte Nord de la Presqu’île du Cap-Vert (De Yoff à Guédiawaye) de 1984 à 2014: Enjeux et Perspectives; Universié Cheikh Anta Diop de Dakar: Dakar, Senegal, 2016. [Google Scholar]
- Adjoussi, P. Impacts du Prélèvement du Sable Marin sur L’évolution du Trait de Côte a Yoff: Essai D’étude de Vulnérabilité, (Presqu’île du Cap Vert, Sénégal); Universite Cheikh Anta Diop: Dakar, Senegal, 2001. [Google Scholar]
- Diallo, S. Evolution géomorphologique du littoral de la Petite Côte à Rufisque. Ph.D. Thesis, Faculté des Sciences Humaines, Université Cheikh Anta Diop, Dakar, Senegal, 1982. [Google Scholar]
- Dieye, A. Traitement informatique de photographies aériennes combiné à l’utilisation de systèmes d’information géographique pour l’étude de la ligne de rivage entre Rufisque et Bel Air durant la période 1968–1997. In Mémoire DEA en Géosciences Environnements Sédimentaires; Université Cheikh Anta Diop: Dakar, Senegal, 2000. [Google Scholar]
- Ndour, A. Evolution morpho-sédimentaire et impacts des ouvrages de protection sur le littoral de Rufisque, Petite côte, Senegal. Ph.D. Thesis, Université Cheikh Anta Diop, Dakar, Senegal, 2015. [Google Scholar]
- Arnaud, K.K.; Gustave, F.P.; Fulbert, T.K.; Romain, N.J.; Stephan, T.J. Modelisation de la Dynamique du Trait de Cote sur une Portion de la Cote Ouest Cameroun Allant de Batoke a Seme Beach par Imagerie Landsat de 1979 a 2018. Eur. Sci. J. 2019, 15, 1857–7431. [Google Scholar] [CrossRef]
- Jonah, F.; Mensah, E.; Edziyie, R.; Agbo, N.; Adjei-Boateng, D. Coastal Erosion in Ghana: Causes, Policies, and Management. Coast. Manag. 2016, 44, 116–130. [Google Scholar] [CrossRef]
- Rodrigues, B.A.; Angnuureng, D.B.; Almar, R.; Louarn, A.; Rossi, P.L.; Corsini, L.; Morand, P. Compendium: Coastal Management Practices in West Africa: Existing and Potential Solutions to Control Coastal Erosion, Prevent Flooding and Mitigate Damage to Society; World Bank: Washington, DC, USA, 2022. [Google Scholar]
- Fall, M.; Ndiaye, M.; Niang, I. Geological and Geotechnical Investigation of the Residual swelling Soils of Rufisque (Senegal). J. Earth Sci. Geotech. Eng. 2016, 6, 29–47. [Google Scholar]
- Bird, E. Coastal Geomophology: An Introduction, 2nd ed.; Willey: Hoboken, NJ, USA, 2008. [Google Scholar]
- Boggs, S. Principles of Sedimentology and Stratigraphy; Pearson: London, UK, 2012; pp. 119–135. [Google Scholar]
- Boggs, S.; Krinsley, D. Application of Cathodoluminescence Imaging to the Study of Sedimentary Rocks; Cambridge University Press: Cambridge, UK, 2006. [Google Scholar]
- Quensière, J.; Retière, A.; Kane, A.; Gaye, A.; Ly, I.; Seck, S. Vulnérabilités de la Région de Dakar au Changement Climatique: PCTI-Dakar. 2013. Available online: https://www.documentation.ird.fr/hor/fdi:010064383 (accessed on 16 April 2022).
Disclaimer/Publisher’s Note: The statements, opinions and data contained in all publications are solely those of the individual author(s) and contributor(s) and not of MDPI and/or the editor(s). MDPI and/or the editor(s) disclaim responsibility for any injury to people or property resulting from any ideas, methods, instructions or products referred to in the content. |
© 2023 by the authors. Licensee MDPI, Basel, Switzerland. This article is an open access article distributed under the terms and conditions of the Creative Commons Attribution (CC BY) license (https://creativecommons.org/licenses/by/4.0/).