Article

Assessment of Infiltration Swale Performance as a Low-Impact Development Technique in Tropical Coastal Environments

by
Alexandra Rodrigues Finotti
*,
Elisa Ferreira Pacheco
and
Patricia Kazue Uda
Urban Stormwater and Compensatory Technique Laboratory—LAUTEC, Sanitary Engineering Department, Federal University of Santa Catarina, Florianópolis 88040-970, SC, Brazil
*
Author to whom correspondence should be addressed.
Coasts 2023, 3(1), 74-92; https://doi.org/10.3390/coasts3010005
Submission received: 30 December 2022 / Revised: 6 February 2023 / Accepted: 14 February 2023 / Published: 20 February 2023

Abstract

:
Operation of source control measures (SCM) in urban drainage in tropical/transitional climates are still a challenge because of higher rain volumes and more intense rains, as well as constraints from sea-level interference. In this study, the performance of a swale to control runoff was detailed and monitored in such an environment. The data on rain, runoff, and sea levels were acquired at a site located in an island in the south coast of Brazil. The results showed that even with higher rain volumes and more intense rains, the mean capture of the swale was 51.7% of the entrance runoff volume, but it depended on seasonal rain variation and interference of sea/tide level. As a result, the swale might be undersized in summer and oversized in winter. Peak flow retardation was observed in 97% of monitored events. The interference of sea/tide level was not directly correlated with infiltration volumes, but in the principal component analysis, the parameters of sea/tide level, along with the hydrological parameters of rain duration, height, and intensity, explained 60% of the variance in the data. In conclusion, the application of SCMs in tropical regions is suitable, but seasonality should be incorporated in the design. The interference of sea/tide level must be further investigated to verify how to incorporate its influence in the design.

1. Introduction

Rapid urban development increases impervious surfaces and consequently induces an increase in the peak flow and total volume of surface runoff. Stormwater runoff can result in both water pollution and urban flooding. Therefore, it is imperative to efficiently manage urban stormwater runoff in order to reduce such impacts. Several stormwater control measures (SCMs) have been applied worldwide. SCMs are structural facilities used to store or treat urban stormwater runoff to reduce flooding, remove pollution, and provide other amenities. Some SCM examples are detention or retention facilities, infiltration facilities, wetlands, vegetative strips, filters, water quality inlets, and others [1,2,3].
A well-known SCM is infiltration swale [4,5,6]. Swales are shallow, open vegetated drains/channels that are designed to convey, filter, and infiltrate stormwater runoff [7,8]. They present several benefits as runoff control, groundwater recharge, and water quality enhancement, and they can provide amenities in urban landscape [9,10]. The linear structure of swales favors their use in the treatment of runoff from highways, residential roadways, and common areas in residential subdivisions, as well as along property boundaries and in parking lots [11]. In a study to develop a database to guide SCM construction in China, vegetated swales are among the five most used facilities to implement the concept of sponge cities [12]. Some studies focus on the optimization of project parameters to improve the cost effectiveness of SCMs to enforce their application in runoff control and ecological services [13,14].
These facilities require few structural elements, may take advantage of native plants to use in the cover, and can be considered a low-cost and low-maintenance option to manage volumes and reduce pollutants in runoff. Meanwhile, in coastal areas, additional restrictions may apply due to environmental constraints, as great biological diversity, high degree of environmental sensitivity, presence of shallow aquifer, and interference with sea level rise [15]. The use of SCMs in coastal areas depends on local physical and social vulnerabilities, cost constraints, and the nature of storm or rising sea level [16,17,18]
More than 40% of the global population lives within 100 km of coastal areas [19]. Moreover, these environments are very sensitive to the impacts of climate change. Few studies have evaluated the performance of infiltration facilities in coastal regions. In Savage, which is located on the northeast coast of the State of Maryland, United States, Davis [20] compared two types of infiltration swales: with and without treatment filter. The volume control efficiency ranged from 27.1 to 62.7%. Stagge [8] compared 22 precipitation events in Maryland and reported a significant peak flow (50–53%) and total volume (46–54%) reduction. Revit et al. [21] showed volume reduction varying from 30% to 48% (estimated from six studies conducted in the United States, France, and Sweden), representing the typical efficiency of grass swales in reducing flow volume. Additionally, the majority of studies involve swale monitoring cases in temperate climates, where rain presents lower volumes and intensities than in tropical or transitional climates.
In Brazil, infiltration swales were only tested in three pilot-scale studies and presented optimistic results, considering the particularities of these tropical regions; however, the performance of runoff abatement was not the mainly objective of these studies, and so abatement values were not published in them [22,23,24,25]. The hydrologic performance of swales in mitigating runoff volumes, especially from small storms, is well documented [26], but the use of SCMs, including swales, is still a challenge in tropical regions, where high precipitation intensity and volumes are common. Furthermore, none of the previous studies were conducted in coastal regions.
The main obstacle to the safe application of this kind of structure is a project’s infiltration rate determination and maintenance, which depend on the particular aspects of the watershed, such as soil type, moisture, groundwater depth, and hydraulic conductivity [25]. In addition, in coastal regions with shallow aquifers, SCM technologies may be influenced by fluctuations in groundwater levels due to ocean tide variations. In shallow porous water tables, infiltrated water can recharge the groundwater more quickly due to a shorter traveled distance [27], and the accumulation of groundwater can consequently affect the land, damaging or influencing the function of infiltration structures.
The goal of this study is to quantify the overall performance of an infiltration swale in a transitional tropical/subtropical region in a coastal environment. The facility has been in operation for a long period (50 years), but its performance had never been evaluated until this study. Detailed data on water balance in the infiltration swale are presented and show the overall performance in controlling runoff in real-life conditions with constraints. This study presents contribution in the systematic monitoring of a swale to control runoff, quantifying the volume abstraction and retardation of peak flow in the conditions of a transitional/tropical climate and coastal zone with shallow aquifers. In addition, we present a synthesis matrix of the structure’s performance patterns in response to precipitation events to improve the understanding of its role in controlling runoff.

2. Materials and Methods

2.1. Study Area

The infiltration swale was installed in Florianópolis (Figure 1a), an island located in the south of Brazil. According to the Köppen climate classification, this region is Cfa (humid temperate with hot summer) [28,29], with annual medium precipitation from around 1400 to 1600 mm and an average of 160 rainy days per year (Figure 1b—climatological data from [30]). This study was conducted with support from the city hall of Florianópolis in a swale that they had projected and operated for the last 50 years. The swale flows into a system of channels and lagoons excavated in natural soil and is at a distance almost 2 km from the sea (Figure 1a).

2.2. Infiltration Swale Description and Monitoring

The details of the swale are provided in [31]. In summary, the swale presents a direct contribution area of 17.91 ha, which is predominantly residential occupancy with approximately 80% of impermeable surfaces and intense car traffic. The swale’s cross section is trapezoidal (Figure 1c) with a bottom area of 16.83 m2, a side slope of 1.6:1, and an approximately 2.1% longitudinal slope. Runoff inlet by a concrete tube of 0.6 m is placed at the bottom, and outlet by a concrete tube with 0.5 m is placed 0.3 m above the bottom. Two pressure sensors were installed in the entry and outlet tubes of the swale. Groundwater was accessed in a well, PM2, where a pressure sensor was installed. Due to malfunctioning, only four months of data were available for the well. Rain was monitored in a tipping bucket rain gauge (SL2000P Solar Instruments, Florianópolis, Brazil, with 1% accuracy) placed 2 m far from the side of the swale (Figure 1c). The data collected from the pressure sensors and the rain gauge were stored in a Datalogger with solar panel.

2.3. Hydrology Flow Calculation and Data Evaluation

2.3.1. Runoff

Runoff enters the swale through a concrete tube of 0.6 m diameter placed at the swale bottom. The non-infiltrated flow parcel leaves the swale through a concrete tube of 0.5 m diameter at the opposite side (Figure 1c). Two pressure sensors (SL2000NV Solar Instruments) were installed in the entry and outlet tubes. The inflow and outflow rates were calculated from the water levels obtained from the respective sensors using Manning’s Equation, with coefficient n adjusted in the field by the float method for the inflow and from the literature for the outflow [31]. The float method [32] was used to access the velocity of flow in the inlet tube that drives runoff into the swale. The geometric parameter and the tube slope measured in the field enabled the calculation of n coefficient based on the equation of Chezy/Manning (Equation (1)). The inflow and outflow volumes were calculated for each sensor time step ( t = 5   min ) using the Chezy/Manning Equation (2). The infiltrated volume was calculated by the differences between the swale inlet and outlet volumes (Equation (3)).
n = v−1 · R2/3 I1/2
Qe(or Qo) = A · n−1 · R2/3 I1/2
Ve t   ( or   Vo t ) = Qe t   ( or   Qo t ) · t · 60   and   Vi = Vo Ve
where v is the flow velocity in the inlet tube (m/s); n is Manning coefficient; R is the hydraulic radius (m); I is the slope of the hydraulic grade line (m/m); Qe,t and Qot are, respectively, the flow rates for inlet and outlet in sensor time step t (m³/s); Ve,t and Vot are, respectively, the volumes of entry and outflow between two sensor time steps; t is the interval between two time steps; and Vi is the infiltrated volume (m³).
The hydraulic performance of the swale was obtained from the water balance calculated according to Equation (4). Variation in the storage volume of the swale was estimated by the difference in elevation recorded by the level sensors in the inlet and outlet of the swale, according to Equation (5), considering that the cross section of the swale is trapezoidal (Figure 1c). The water balance was converted to a flow balance taking the form of Equation (3). The data were used to estimate the swale water balance, in which the estimated variable was the infiltration. Initially, we calculated evapotranspiration from the data of the nearest meteorological station (São José) using the Penman method, but we observed that its values were low (less than 5% of the water balance), that the values were constant in relation to the month with the use of monthly temperatures, and that its estimation would be one more source of uncertainty in the balance calculation. Thus, it was decided to remove the calculation of evapotranspiration from the hydrologic balance and to calculate its value in future works with measurement of a more precise parameter at the site. Equation (1) was then used while suppressing the ET term in Equation (4) and Vevap in Equation (6).
P + Qe = ET + Qo + ΔS,
Varm = (He − Hs) · Ab,
Vi = Ve − Varm − Vevap − Vo,
where P is precipitation; Qe and Qo are the water flow entering and leaving the swale; ET is evapotranspiration; ΔS is the change in water storage in the swale; Varm is the stored volume; He is the inlet sensor level; Hs is the outlet sensor level; Ab is the area of the base of the infiltration swale; Ve is the volume entering the swale; Vo is the output volume; Vi is the infiltrated volume; and Vevap is the evaporated volume from ET.
The swale was monitored for 17 months (August 2014–January 2016), with 60 storm event occurrences; in 38 of these events, it was possible to evaluate all parameters necessary for the water balance analysis. Events were discarded due to technical failures of the level sensors located upstream or downstream of the swale. Dunkerley [33] states that rainfall events must be determined deterministically by local climatology of rainfall that systematically affects the properties of this kind of event. Thus, in this study, rainfall events were delimited by the performance of the swale and runoff generation, according to the following criteria: (i) start and end of the runoff flow records in the entry of the infiltration swale; (ii) two events were considered to be independent when they occurred with a difference of at least six hours [3,33], and (iii) water level was greater than 5 cm (level sensor detection limit).

2.3.2. Soil Sampling, Hydraulic Conductivity Measure, Groundwater, and Sea Level Monitoring

The soil at the bottom of the swale was sampled at 3 points (entrance P1, middle P2, and outlet P3) at two different depths (surface and 40 cm deep) to address the sedimentation profile in the swale. The textural analysis was performed using Sieve Analysis according to the Brazilian Association of Technical Standards [34].
The hydraulic conductivity of the soil was measured using two different methods: slug test and concentric ring infiltrator. Groundwater level was measured in the pressure sensor installed in PM2. The level of the tubes, the points of collection of the soil, and the location of the rain gauge are shown in Figure 1b.
Daily sea level data were acquired from the Imbituba–SC Station equipped with a DIGILEVEL and an absolute pressure sensor (Druck/GE 1880, with squitter datalogger), installed 08/2001 and operated by IBGE (Brazilian Institute of Geography and Statistics, Brazil). Daily tide level was taken from the Caieira I Station in Florianópolis operated by Epagri/Ciram. The daily average was calculated from 5 min data in both stations. The daily sea level takes into account the astronomical tide average over the day, and the daily tide level takes into account the astronomical tide and the meteorological tide.

2.3.3. Data Processing

From the precipitation record series, it was possible to calculate precipitation characteristics that might affect swale performance: duration, mean intensity, accumulated and effective precipitation, and previous days without rainfall for each event. The concentration time (Tc) of the contributing area was calculated using the Schaake equation (Equation (7)), indicated by [35] as the more suitable equation for urban basins smaller than 70 hectares. Tc was used to evaluate the advance of flood peak in the basin due to the greater vulnerability of coastal ecosystems to seasonality (demographic density, rainfall indices, and local climatic variations).
T c = 0.0828   L   0.24 S 3 S 0.16 A i m p 0.26 ,
where L is length of the stormwater collector or main channel (km); S is the average slope of the stormwater collector or main channel (m/m); and Aimp is the fraction of the impermeable area, ranging from 0 to 1 (dimensionless).
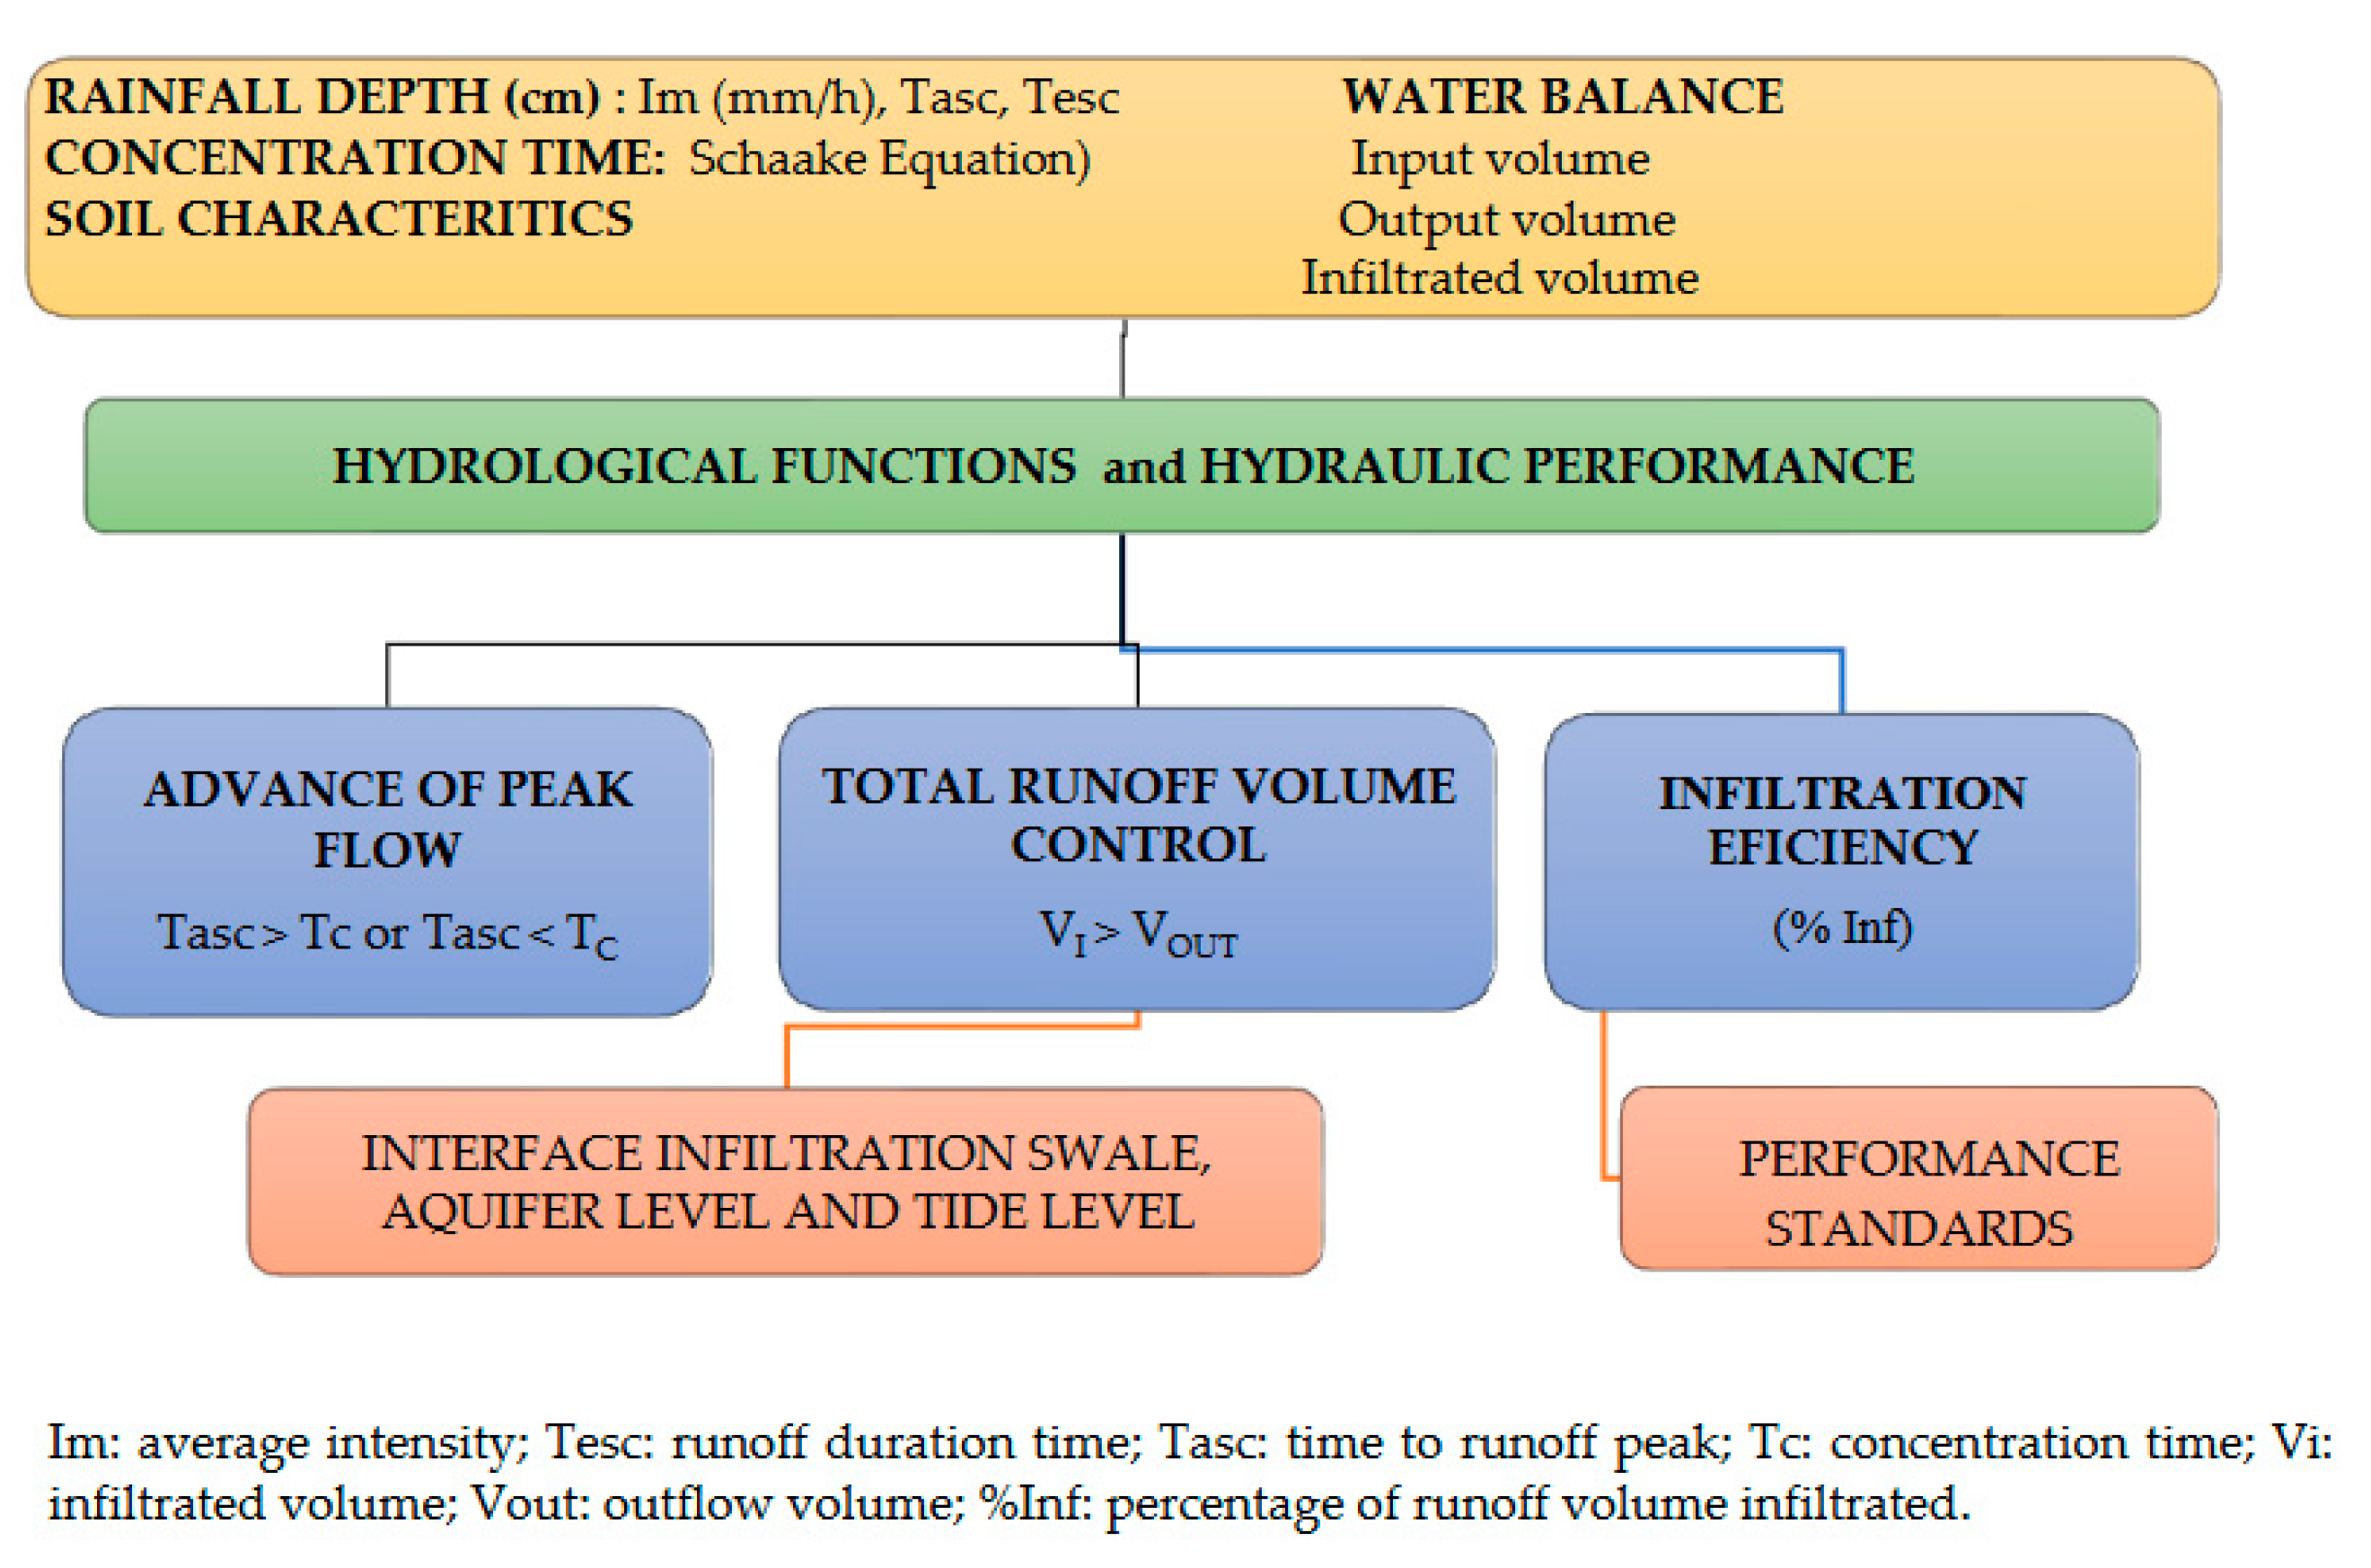
Finally, the hydrological and hydraulic swale variables were statistically tested for direct correlation and in a multivariate analysis using principal component analysis. We investigated the following questions about the use of swales in coastal environments, under the influence of tide and under a shallow aquifer (Figure 2):
  • Is the infiltration process predominant in the swale or the structure functions as a drainage channel?
  • If the infiltration process is predominant, what are the swale performance patterns in the face of seasonal variations in rainfall indices and tide/sea level?

3. Results and Discussion

3.1. Sampled Rainfall Characteristics

The storm events captured by the swale during the monitoring period were representative of the typical variability in rainfall in Florianópolis [36]. A comparison was established between the swale rain gauge data and the date from the São José Station (INMET national climatic station of Florianópolis city), the same one used in the studies of [36]. However, as small events (<2 mm) do not generate runoff in the swale catchment, this class of events do not appear in the list of monitored events (Table 1) even though they are registered in the swale rain gauge because of our choice of event definition. Rainfall depths varied between 2.4 to 97.6 mm (Table 1), with a mean depth of 18.5 mm. Storm duration ranged from 30 to 1347 min. Rainfall intensity (average per event) ranged from 0.34 to 10.46 mm/h, with a medium value of 3.56 mm/h. Davis et al. [20], in their pilot swales, recorded medium rains of 10.5 and 12.2 mm in Maryland, which presents subtropical climate. The swale that we monitored controls rains that are on average almost 55% higher than the pilot swales in [20] due to our tropical/transitional climate.

3.2. Soil and Infiltration Characteristics

The physical characteristics of soil directly influence the quantitative impacts of SCMs in aquifers. The analysis shows that the soil is classified as Quartzarenic Neosol according to the EMBRAPA Brazilian Soil Classification [37]. This category is similar to Arenosol in the FAO classification [38] or Loamy Soil in the USDA Texture Triangle [39]. The soil presented very good infiltration capacity according to hydraulic conductivity, which was measured as 5.18 × 10⁻⁶ m/s in the slug test [40] and estimated as 5.83 × 10⁻⁵ m/s as the constant final rate in the infiltration curve from the concentric ring infiltrator [41]. These values are within the ranges expected for soil type in coastal zones and correspond to fine sands with good infiltration capacity. They can indicate the impact of infiltration structures in coastal aquifers where a high infiltration rate is associated with a shallow depth of the water table and with the types of precipitations in regions of tropical climates.

3.3. Hydrologic Functions and Hydraulic Performance of the Infiltration Swale

3.3.1. Precipitation and Swale’s Percentage of Infiltration

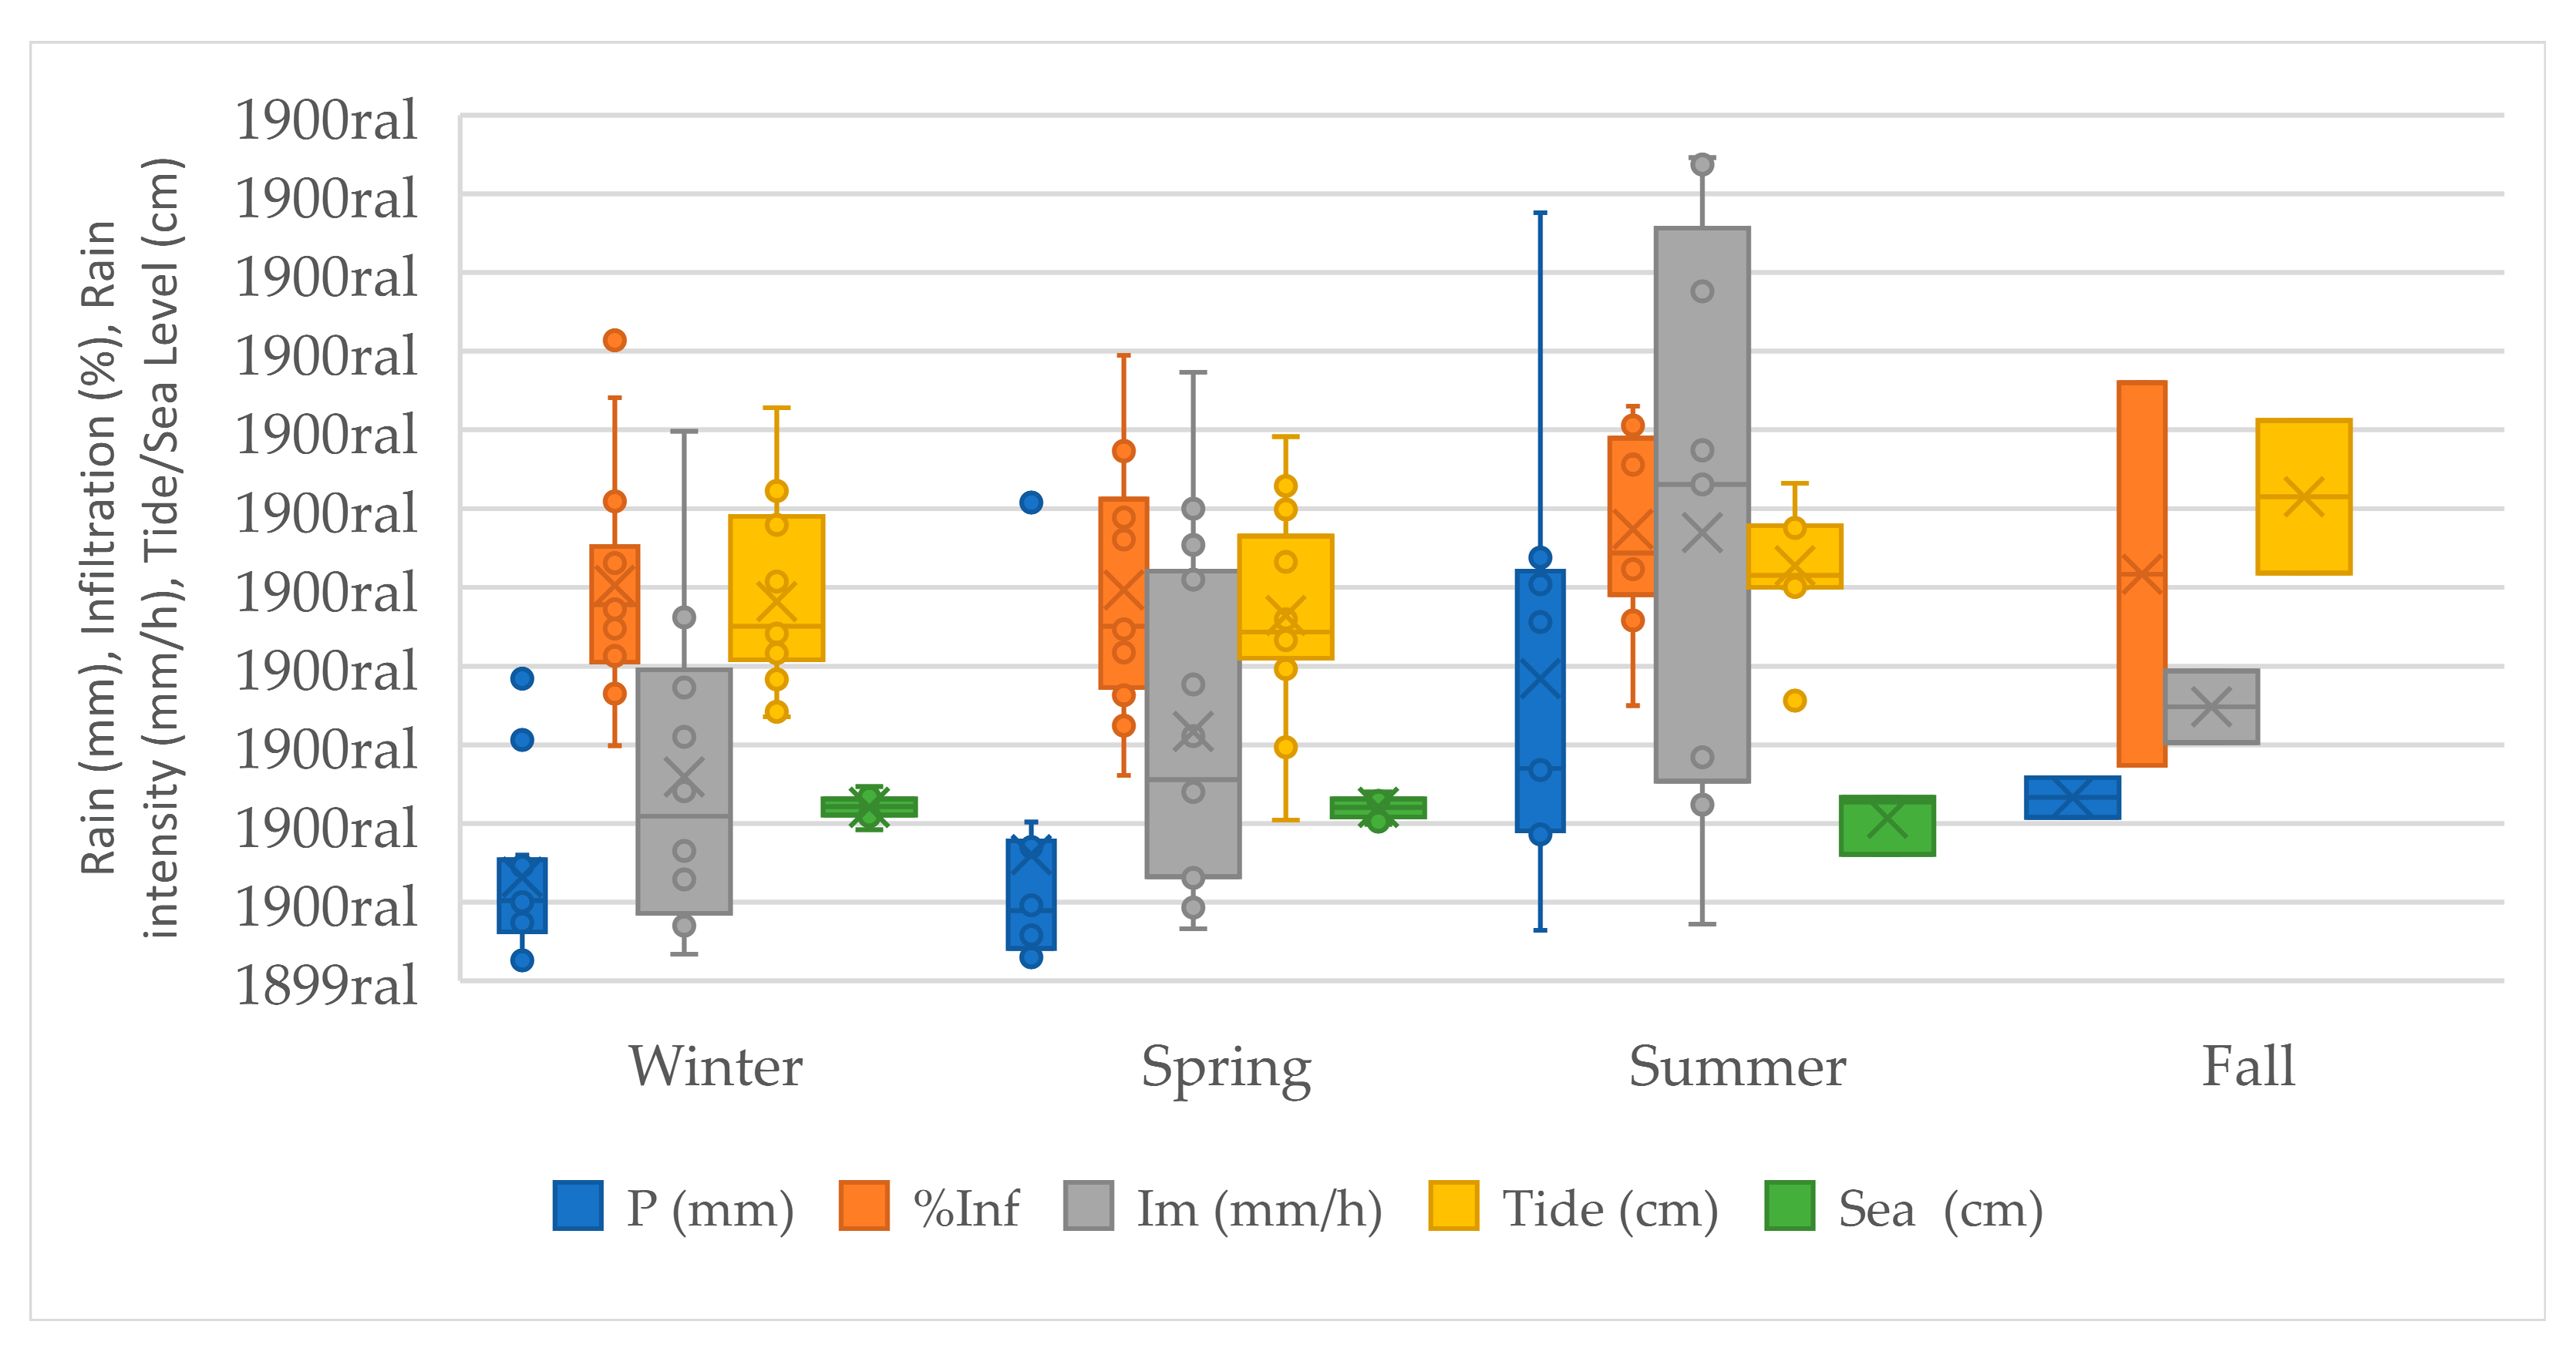
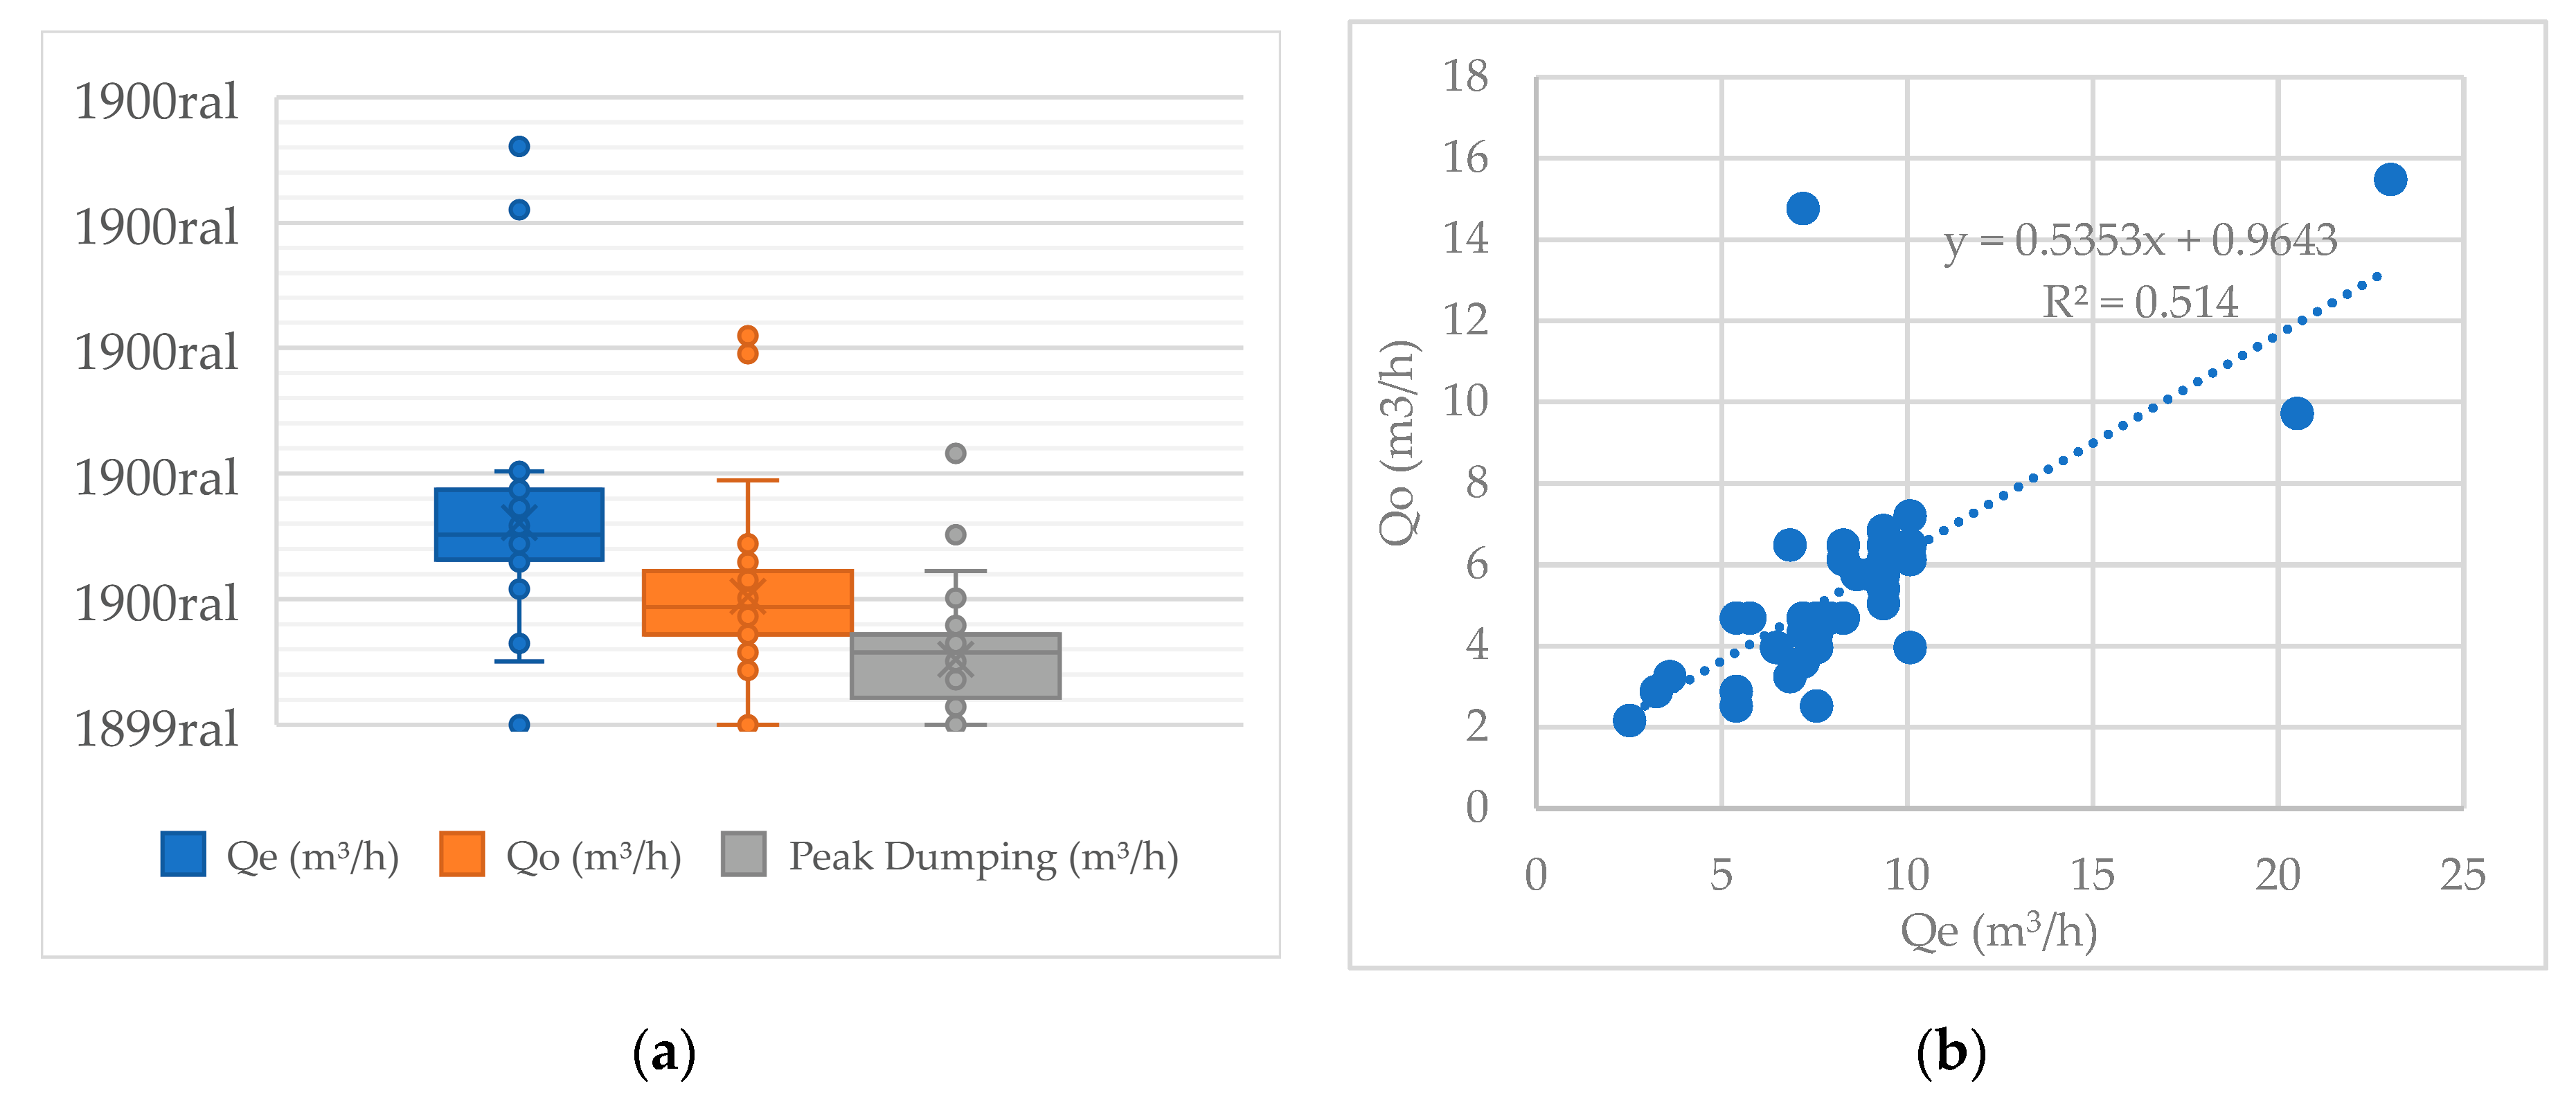
The distribution of rainfall depth (Figure 3) presents much more variation and higher values in summer than in winter and spring. The average intensity presents a similar behavior but with more variation in these three seasons. Summer precipitations are convective with great volumes and intensities. In winter, frontal systems are predominant with small volumes, more constancy, and little intensity. (Fall data are not so representative because only two events have been registered, and without the tide/sea level values due to equipment failure). The infiltration percentage in the swale presents higher maximum values in spring and winter than in summer. Although variability is lower in summer, the average of infiltration is higher in this season than in spring and almost equal to winter. This is due to the major infiltration capacity in winter because of less volumes, but as events are longer, soil humidity is higher in winter. The mean average infiltration is higher in summer. The number of previous days without rain (DNR) were not found to correlate directly with the infiltration percentage in the swale. Although the volume of rainfall is greater in summer and spring, rainfall is well distributed throughout the days of all seasons.
During the summer of 2015, the highest daily precipitation (97.6 mm) and the maximum intensity (10.46 mm/h) were recorded (Table 1). During this summer, the convective rains were normally marked by high precipitation. Consequently, the soil moisture was close to saturation, which caused an overflow in the swale in some events.
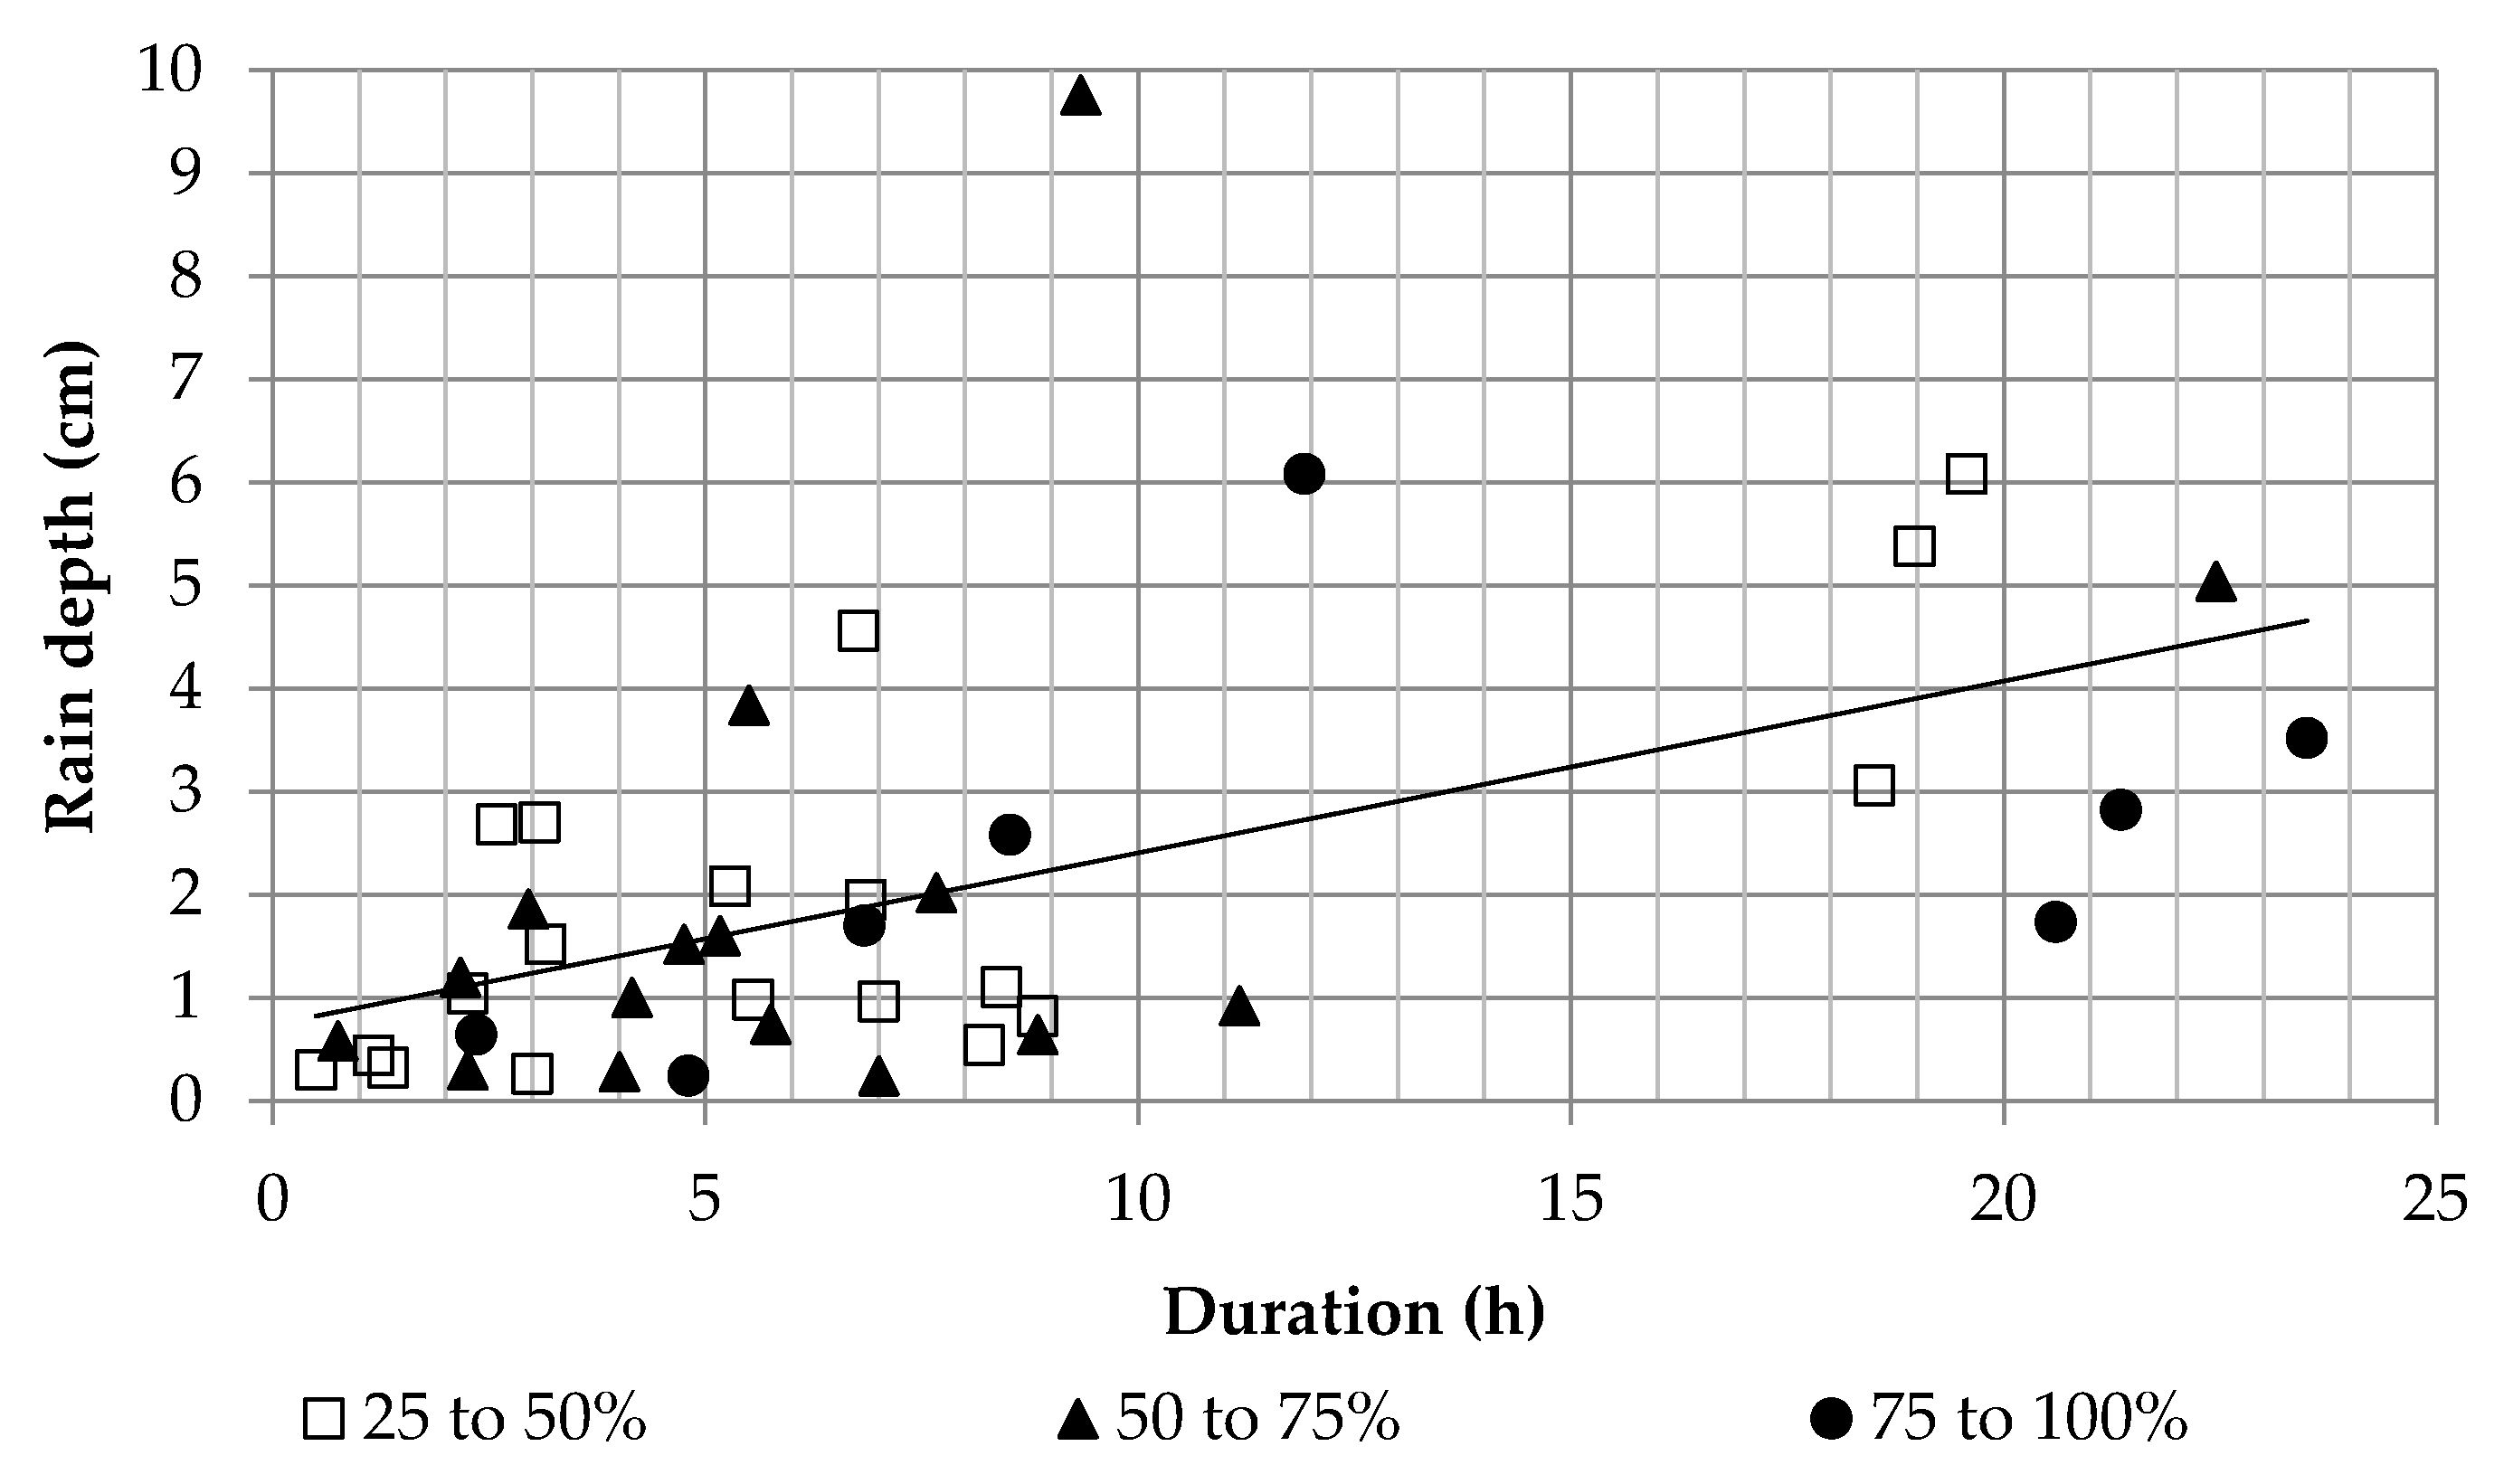
The hydrological performance of the swale was determined by the size of rainfall event. Small events are completely captured by the swale (Figure 4). Larger events normally present certain volume reduction. In very large events, the swale can even function as a passing channel to runoff. After plotting a tendency line to linearly regress duration and rainfall depth (Figure 4), we found that P = 0.1667D + 0.74. Davis et al. [20] found a regression of P = 0.11D + 0.56 for their pilot swales in Maryland. It means that for a duration of 0.1 h, the difference in rainfall depth is 32% higher in Florianópolis, and for a duration of 3 h, the difference augments to 39%; these high values are characteristic of the tropical/transitional climate and indicate that our monitored swale works under heavy volumes of rain.
Capture is the infiltrated volume in the swale. The distribution of capture is also shown in Figure 4. The regression line of P × D represents a baseline for better capture. Most of the events that infiltrate more than 75% of runoff volume are below the regression line (six out of eight events). The same behavior is noted for the range of 50 to 75% of capture (11 out of 15 events). It means that 73.9% of the events that infiltrate appreciable volumes of runoff are below the regression line. The regression line reflects the intensity of rain. Capture varies along the duration of an event because of decreasing infiltration storage of the soil. It goes from the maximum infiltration rate when the soil is dry and decays asymptotically toward the saturated hydraulic conductivity. This is why the intensity of rainfall also determines the swale’s capacity for runoff capture. If the intensity of rain is greater than the infiltration capacity of the soil, runoff will occur even if the saturated hydraulic conductivity has not been achieved.

3.3.2. Runoff Volume Control

The total volume of the infiltration swale was approximately 27 m3, and the average entrance volume was 35.0 m3 for the 38 events analyzed. The swale showed overflow in only two events: 13 February 2015 and 8 March 2015 (Table 1, lines shadowed in dark gray), even with an infiltration efficiency of 52.34% and 45.83%, respectively, in this summer. The mean daily sea level in these days were high and very high (49.9 and 55.7). It was observed that the increase in the channel level downstream of the swale was responsible for the back water effect, which indicates sensitivity to coastal drainage (tidal interference).
The volume of infiltration in the swale did not change significantly over the seasons, having prevailed over the output volume. In 51.2% of events, the infiltrated volume was higher than the output volume. However, these volumes practically became equal when there was a low number of previous days without rain (Table 1), which evidences a greater interference of the water table level in these events. Despite this observation, it was found that infiltration did not completely cease, although it was greatly reduced. In addition, the clogging process was considered negligible in this swale during the monitoring period. Vegetation growth in the swale is very important in preventing clogging (see photos in Figure 1b). Although the swale is not planted, vegetation grows naturally throughout the year and is removed by the municipality once a year. The growth of roots and the movement of stems and leaves with the wind helps to keep the soil pores open for infiltration. The infiltration rate was greater than 50% of the inflow volume in 39.47% of the monitored events.
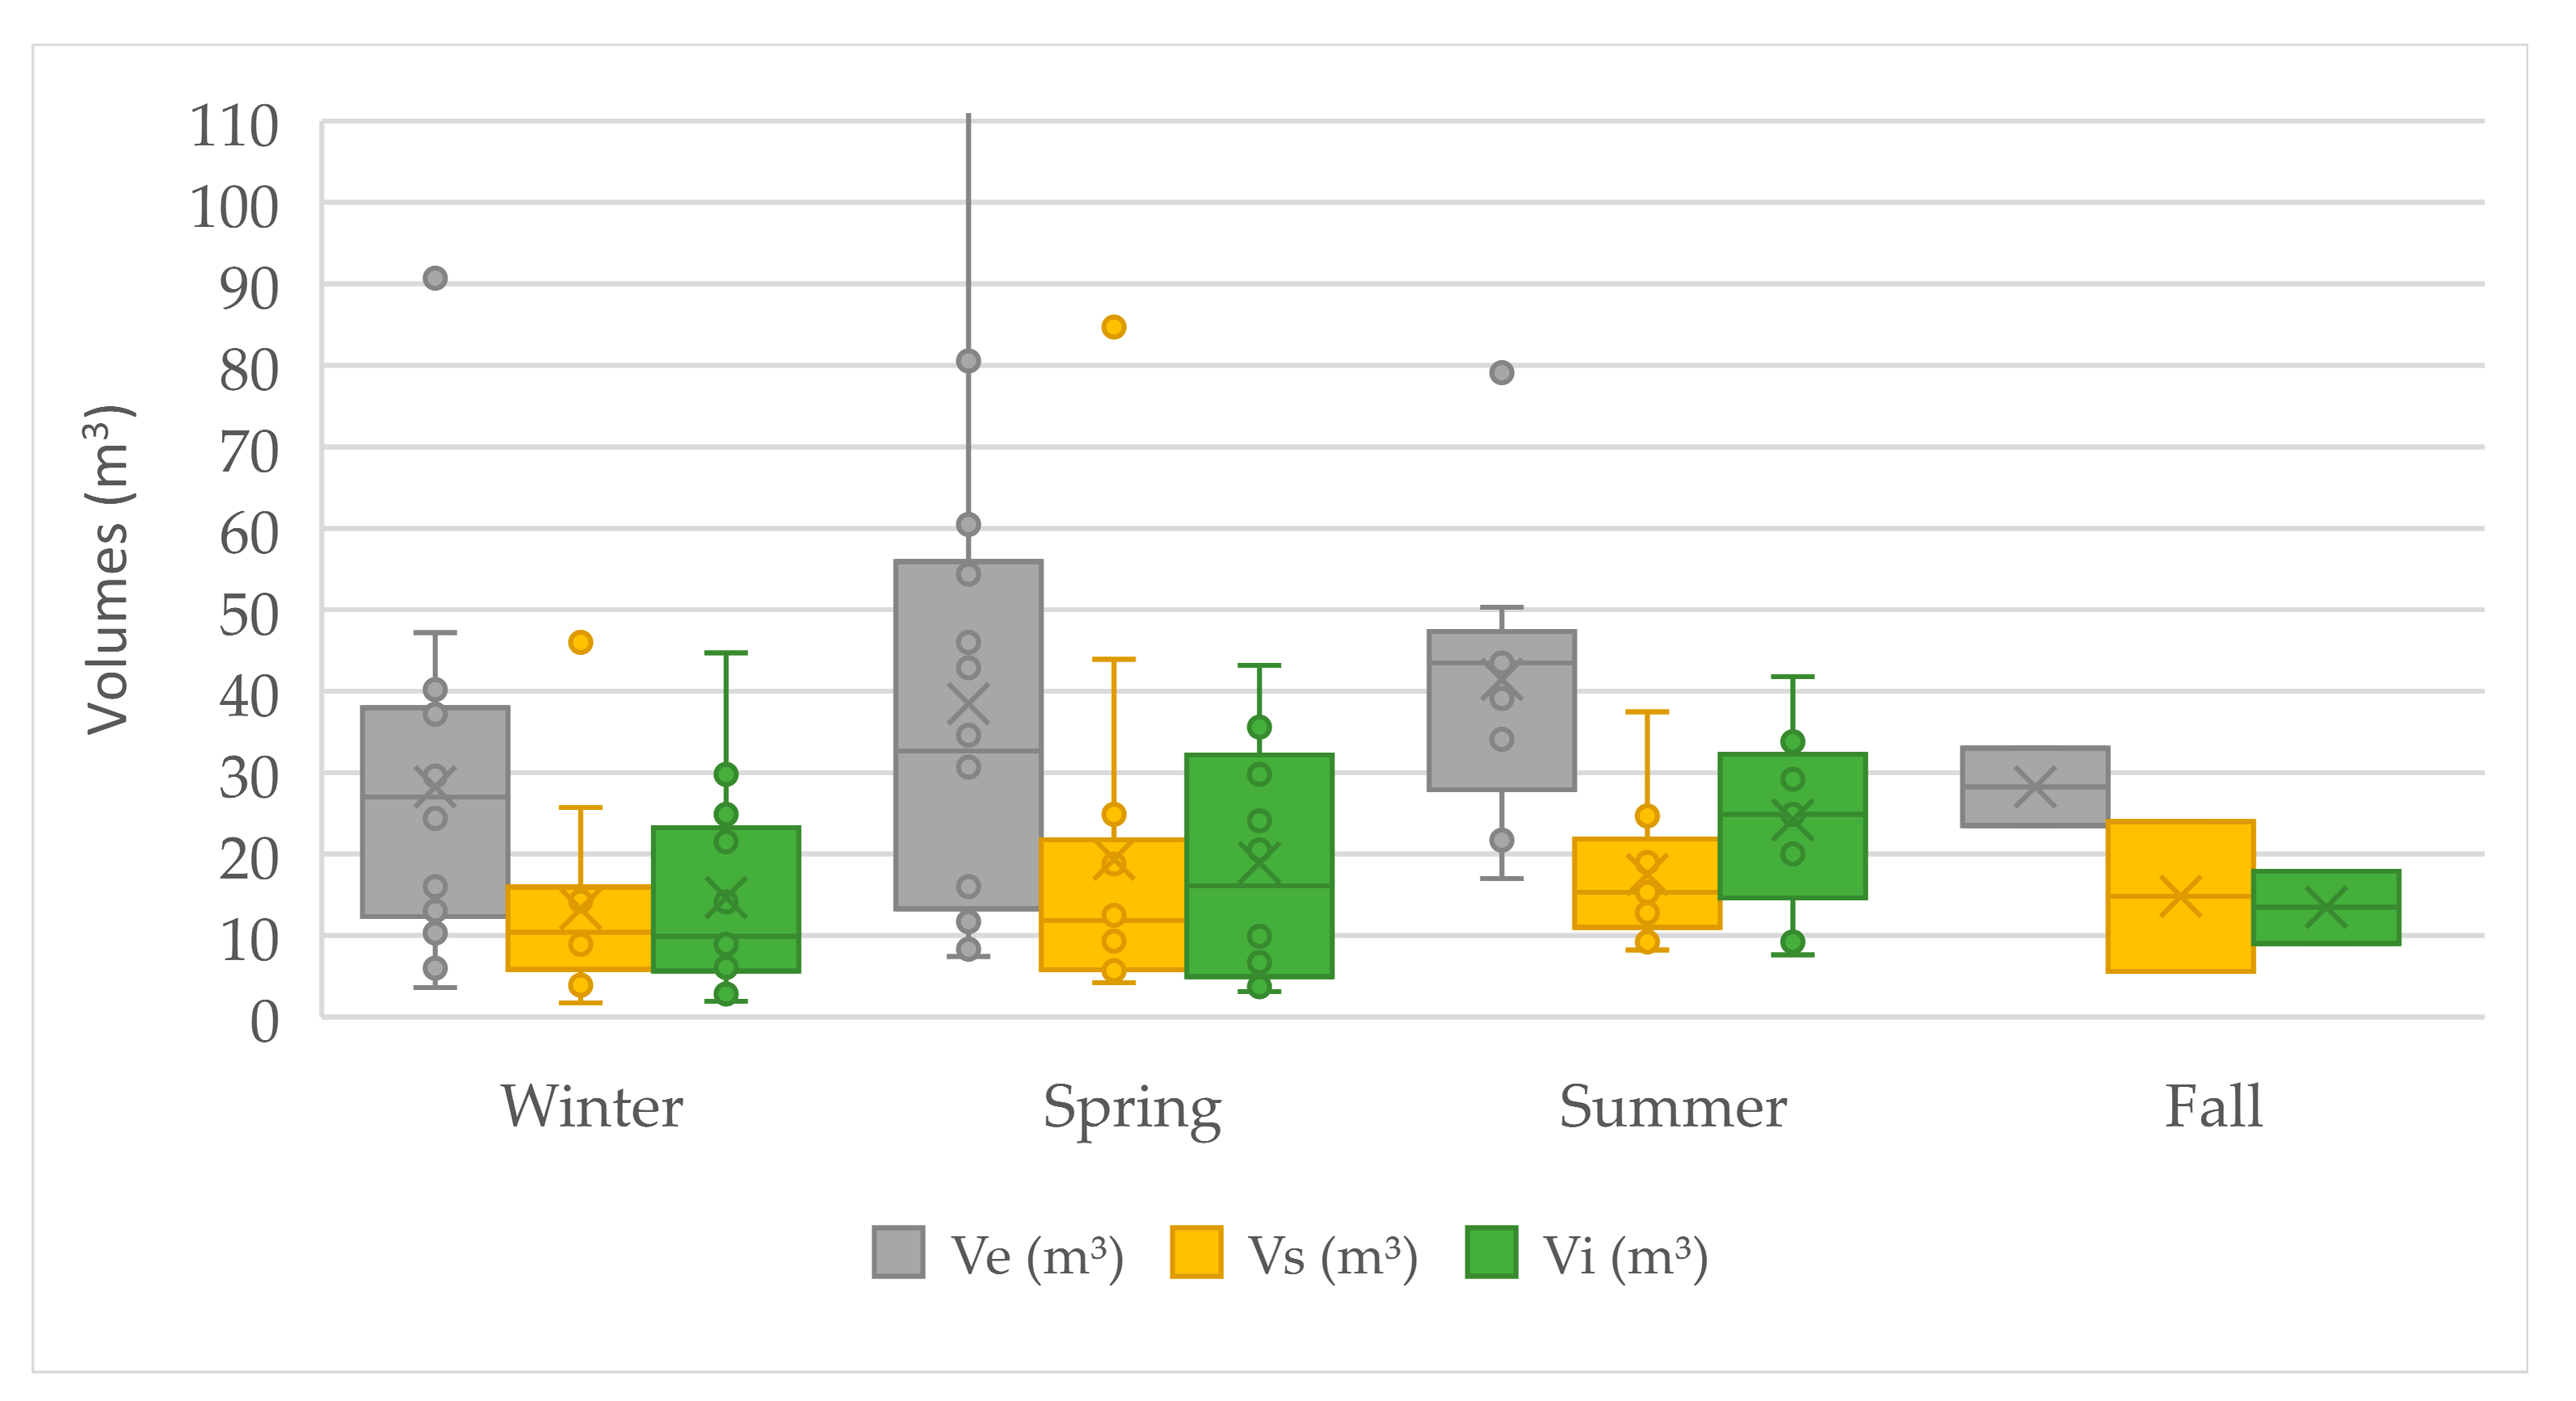
Infiltration percentage is a measure of efficiency in volume control. The distributions by season are in Figure 5 The average infiltration percentage does not vary greatly by season: 50.2 in winter, 49.6 in spring, 57.4 in summer, and 51.5 in fall. However, the degree of variation is quite different, especially in summer.
The average infiltrated volume over the monitoring period is 18.3 m3. The average per season is more variable, with a volume of 24 m3 in summer (Figure 5); the lowest seasonal average is detected in winter and fall (14.7 and 13.5 m3), and an intermediate value of 19 m3 is detected in spring. The inflow volume is much higher in summer (41 m3) than in winter (28 m3) and similar to spring (38 m3). According to [42], precipitation characteristics influence infiltration structures in two ways. The most efficient aquifer recharge and infiltration events are generated by stratiform precipitation (when soil saturation increases without generation of flow) and intense convective precipitation events, in which recharge rates are more inefficient due to both an excess saturation with the flow generation and an increase in the evapotranspiration rate. That was not observed in Florianópolis. Even with major intensities in summer, the average infiltrate volume is higher in this season. This is probably due to the fact that the infiltration capacity of the coastal soil of Campeche in Florianópolis is high and the aquifer, although shallow, is large. Thus, soil infiltration capacity frequently does not present an impediment to infiltration even in hight-intensity precipitations. It is as if the higher volume of available precipitation in summer is able to force more infiltration in the soil, which does not present resistance to infiltration due to its sandy characteristic. The large aquifer of Campeche absorbs and distributes the infiltrated water from the swale relatively fast.
The runoff control volume varies from 26 to 81%, and it is greater than the average value of 52% in 19 events. This performance can be considered very good for urban runoff control.

3.3.3. Peak Flow Analysis

The advance of flood peak influences the response time in the flow volume attenuation or in the peak discharge from the swale (Figure 6). Thus, the time of concentration (Equation (1)) estimated for the basin for the pre-development and current urbanization periods is 15 min and 9 min, respectively. It was observed that the ascending limbs of the hydrographs are lower than the concentration time in 2.56% of rainfall events in the current urbanization period (Table 1). The majority of these events present a delay in the peak flow during the monitored period, in relation to concentration time. This may indicate that the infiltration swale presents a contribution in the retardation of peak flow, ensuring its hydrological function and compensating for the impermeabilization process and the impact of infiltration losses in the urban hydrologic cycle.
Peak flow reduction was observed in almost all monitored events (Table 1, Qe and Qo), except for the summer event of 2/13/15; in this occasion, the swale overflowed. Peak dumping varied from 5.3 to 66.7% and was, on average, 36.6% smaller in the output of the swale than in the input. The SCM showed very good peak attenuation, proving it to be very effective in urban flood control. A regression between the input and output peak flow could be established with a quadratic error of 51.4%, allowing the estimation of the output peak flow from the input peak flow using the equation Op = 0.53 Ip + 0.96.
In autumn, a greater infiltration (76%) of the flow was observed (Table 1), an observation that was also made by other authors. Lewellyn et al. [43] observed, for example, that climate has a direct influence on the infiltration rate for soil thicknesses less than 0.6 m, that is, the higher the atmospheric temperature, the higher the infiltration rate in the soil. Thus, the swale efficiently fulfilled its function even in seasons of greater rains; these are periods that have a greater obstruction of storm drains and an increase in both runoff and aquifer level volume due to soil type and high hydraulic conductivity, which are typical in coastal regions.

3.3.4. Hydraulic Performance Patterns of the Swale

In order to analyze the hydraulic performance patterns of the infiltration swale, the water balance of the structure was performed, which was synthesized with the other parameters monitored in the evaluation matrix (Table 2). The salmon colored lines represent good runoff control; dark green indicates retardation in peak flow; and infiltration efficiency is shown as medium and strong yellow. For light yellow, infiltration is under 50%. It is possible to verify the efficiency of the structure in surface runoff control as well as the time advance of peak flow. The water balance of compensatory techniques is important for the knowledge of its true hydraulic retention capacity and its influence on the process of infiltration of rainwater in the soil, involving the drained, infiltrated, and stored volumes [44,45].
The attenuation in surface runoff volume in the monitored events ranged from 26.14% to 81.4%, and the average infiltration was 51.7% in surface runoff control. This value is higher than other studies with grassed swales: 30% [46], 33% [47], 45% [20], 45% [48], 46% [49], and 47% [6]. The average observed in this study (51.7%) may be considered very good given the conditions under which the swale works (without maintenance, shallow aquifer, and tropical rains). The high infiltration rate of the soil and the sandy large aquifer are part of the reasons for the good performance.
Some anomalous events occurred during the monitoring period. On 25 November 2014, it rained 60.8 mm, but the infiltrated volume was only 26% due to soil saturation by previous rains. In the case of very intense rains recorded on 4 November 2014, 13 February 2014, 15 March 2014, 2 September 2014, 4 November 2014, 13 February 2015 and 15 March 2015, the swale remained within the efficiency standards (50–75%) in the first three events, but in the last three events, it worked as a drainage channel, controlling only 4% of the input flow. The number of previous days with rain, the aquifer height, and the intensity of precipitation are the causes for the deficient performance.
The overall performance of the swale in controlling volumes and retarding peaks is presented in the matrix of Table 2. The infiltration phenomenon (in which the infiltrated volume was higher than the output volume) occurred in 48.72% of all events, and the infiltration rate ranged from 25 to 50% in slightly more than half of these events (51%). It was observed that there was an interference from soil moisture state, even with the swale having sandy soil with a high rate of infiltration (20 mm/h). This efficiency is close to that found by [6], who attested that swales can infiltrate 50% of runoff volume in semi-arid regions if the soil is permeable and the initial moisture content is low.

3.4. Interface between Infiltration Swale, Aquifer Level, and Tide Level

3.4.1. Tide and Sea Level Analysis

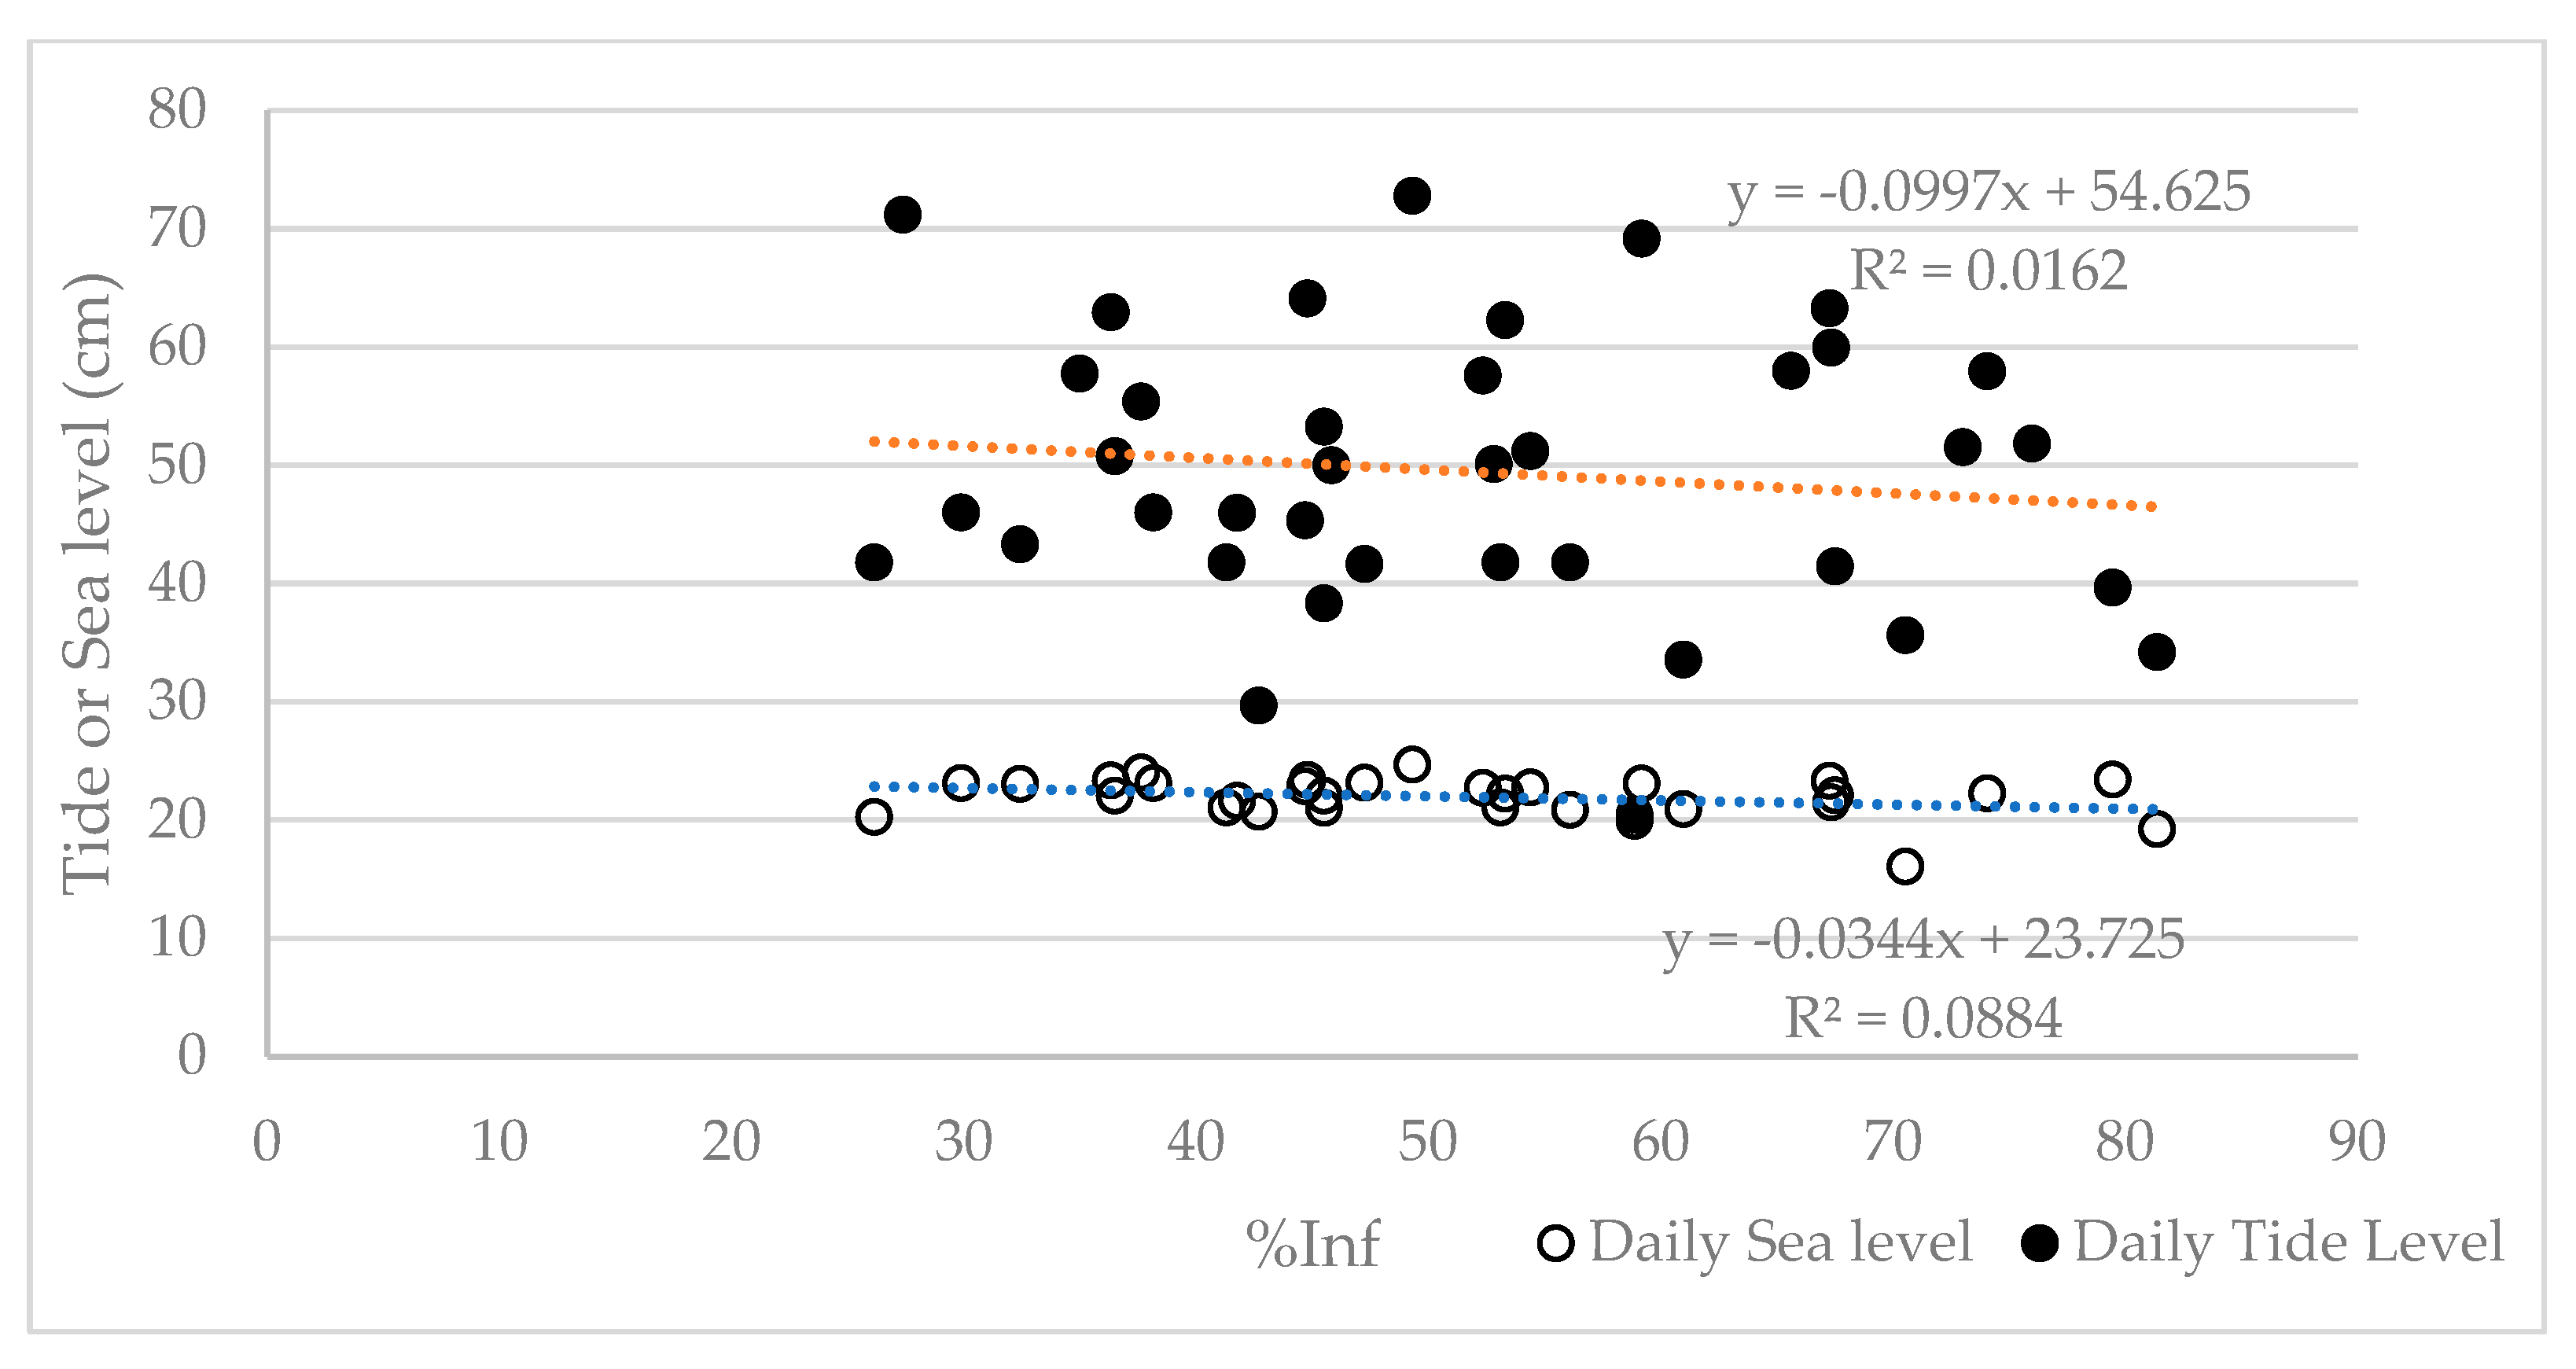
The distribution of the mean daily tide and sea levels (Figure 3) during the period of swale operation shows that the mean sea level is lower in summer (20 cm) but more variable than in winter and spring (22 cm). Sea level mainly reveals the astronomic tide (syzygy cycles). Daily tide level encompasses the interference of meteorological phenomena, and so its variation is much higher, specially in winter, spring, and fall due to winds and cold fronts that are characteristic of the south of Brazil. An exception is when there is a combination of heavy rains and high sea/tide levels, as observed in the summer events when the swale overflowed. Thus, it is recommended that this parameter (tidal variation) should be considered in drainage network and design of compensatory techniques, such as infiltration structures, in order to reduce flooding risk in coastal regions.
In Figure 7, an exploration of the regression of tide and sea levels with the percentage of infiltration is presented. The lines show that the relation is not linear and is not direct as the regression coefficient is very low. The multiple regression analysis is presented in Section 3.5 below. The effects of tide level have been registered in Florianópolis in multiples events of coastal flooding [50].

3.4.2. Performance of the System in Coastal Ecosystems

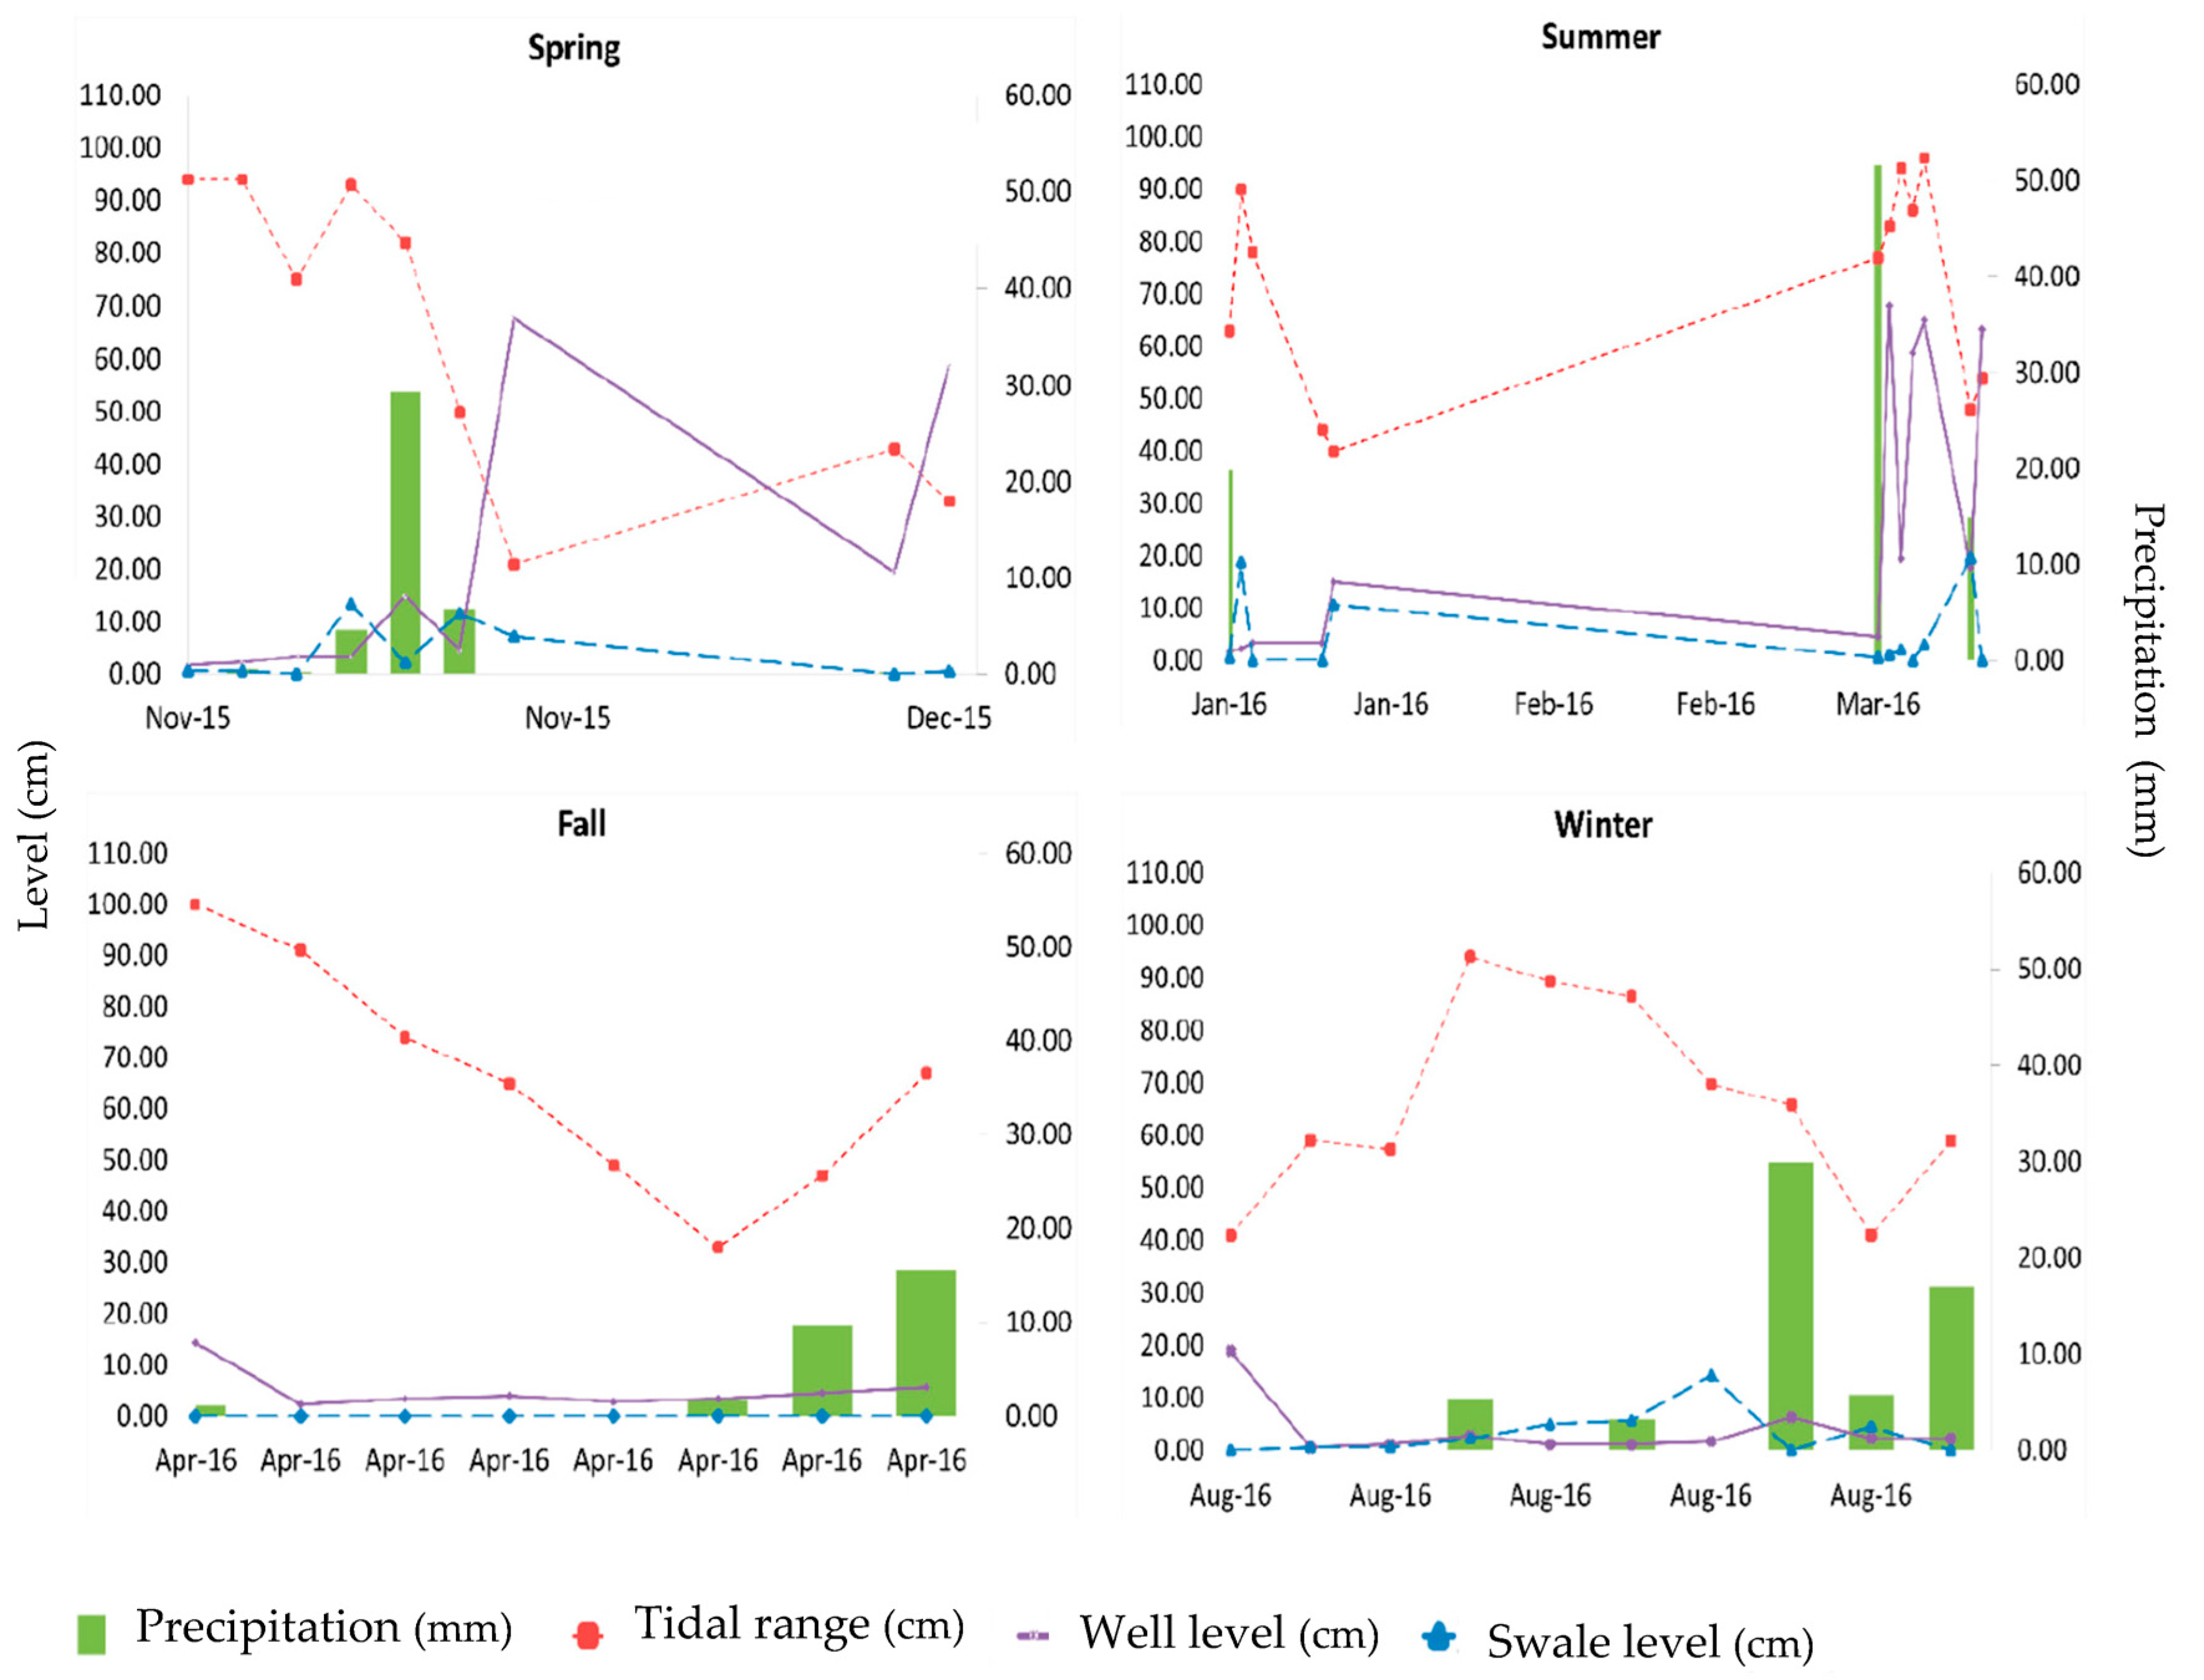
In the period from November 2015 to August 2016, the interface of rainfall, tide level, water depth in the swale, and height of the aquifer were evaluated (Figure 8). Based on the analysis of the performance of the structure, with tidal fluctuations and aquifer level, the greatest influence on the variation of the aquifer level is in the number of previous days without rain, which depends directly on the soil moisture conditions and the infiltration rate.
However, on 7 January 2016 (summer in the southern hemisphere), 70% of the runoff volume was infiltrated in the swale, with an average rate of infiltration equalled to 8.40 × 10⁻⁵ m/s. This value was higher than the value estimated by the concentric ring infiltrator method, which was 5.83 × 10⁻⁵ (test performed in the autumn during the periods of greatest drought), with an increase in the water table of 62 cm (Figure 8). The other events with the highest infiltration rate occurred in the fall and winter seasons. As autumn is one of the driest seasons, with an average rainfall of 90 mm in April, there is no formation of water in the swale. Unfortunately, the well sensor did not operate adequately during the entire project observation period, and more precise analysis of aquifer level interference in swale performance could not be better established.

3.5. Global Evaluation with Principal Component Analysis (PCA)

A principal component analysis was run with the entire set of data, but the importance of some variables was overlapped, such as the three volumes (Ve, Vi, and Vo). After eliminations of the overlapping variables, the PCA was performed again. The results (Table 3) group the explanation of the entire set of data into three principal components, which explain 67.46% of the total variance. The hydrological parameters are grouped in the first component: total duration of precipitation (Tp), total precipitation depth (P), and the volume infiltrated (Vi) in the swale. The second component includes the mean intensity (Im). Finally, the third component includes the sea and tide daily mean levels. This analysis reveals that the hydrological parameters related to the volume of rain and its distribution along the events are the variables more important, followed by its relation to soil infiltration capacity due to the mean intensity. Additionally, it is important to note that, even though the direct correlation of swale infiltration and sea level parameters is low (Figure 7), the multivariate analyses reveal its importance in the global performance of the swale. The third component of the PCA, which is composed of sea level and tide level, explains 17.57% more of the variances of the group of parameters. In coastal areas, the interference of sea and tide levels must be taken into account to design better SCM techniques. The question that arises is how to incorporate this information to the design process of SCMs in coastal areas, which should be the subject of future investigations.

4. Conclusions

In this study, an infiltration swale designed for runoff control and located in a coastal tropical/transitional zone was analyzed. In this kind of areas, the insertion of a SCM should be carefully evaluated due to environmental constraints, such as a high degree of environmental sensitivity, interference of sea level rise, and sometimes great variation in altitude in small areas. The monitored swale has been in use for almost 50 years, but there were no studies on its effectiveness. The swale operates in a tropical/transitional climate (1480 mm of rain/year) with convective intense rains in summer and frontal long-duration systems in winter. Coastal soil is sandy and presents good infiltration capacity (5.18 × 10⁻⁶ to 5.83 × 10⁻⁵ m/s). An extensive shallow aquifer is presented below the swale, and the variation in its level is significant. The aim of this study was to quantify the general performance of an infiltration swale in a tropical transitional region in a coastal environment. It detailed the water balance in the infiltration swale and showed the swale’s general performance in controlling the flow in real conditions.
The swale presented very good performance in total runoff control even when under a volume of rain higher than the majority of the literature published; most of the previous studies were conducted in subtropical climates. Rain depth is 55% higher in our case than in [20], if we compare regression lines adjusted to rain depth, duration, and capture of that study and ours, and the difference in rains depths is around 35% higher in our study. In Florianópolis, we monitored a case where the swale is submitted to significantly higher rain volumes.
It was observed that the average infiltration was 51.8% of surface runoff in 38 events sampled. In half of the events, capture was between 50 and 75% of total runoff. Even during the summer events that presented more intensity, the mean percentage infiltration was 57%, which was associated with a lower mean sea level in the period. Otherwise, when intensity was high and was accompanied by high sea level, the swale overflowed (in two events, both in summer).
The summer and spring months presented larger global rainfall per event, as well as higher volume variations between events. Autumn and winter rains were characterized by lower volumes and less variation between events.
It was found that, in larger events, the swale showed some volume reduction, but the output volume was higher than the input; only 19.68% of the events presented this characteristic when the swale functioned as a passage channel for the flow. The capture varied over the duration of events due to the decrease in soil infiltration storage. It went from the maximum infiltration rate when the soil was dry and decreased asymptotically toward the saturated hydraulic conductivity.
A reduction in runoff peak flow was observed in this study. The peak dumping was, on average, 36.6% smaller in the output of the swale, and it was observed in 38 out of 39 events, attesting the swale’s good ability in storing and controlling runoff.
During the monitoring period, a direct correlation between the sea and tide data, the swale infiltration, and the level variation after precipitation events was not found. On the other hand, in the multivariate PCA analyses, the daily average sea and tide levels, along with the hydrological data, explain 60% of the global variance in the swale’s performance in controlling runoff. More details on how this interference drives swale performance are important to investigate to allow the consideration of these phenomena when designing SCMs in coastal areas.
Therefore, even though the structure has been in operation for 50 years, the results demonstrate an excellent performance, both in controlling the flow and in retarding the peak flow, satisfactorily fulfilling its hydrological regulatory functions for a coastal ecosystem. The risk of aquifer and soil contamination is always present when infiltration is the major process. This question is important to investigate in this coastal tropical area; it is out of the scope of this paper but is presented in other publication [31].
For future studies, a more detailed characterization of the events occurring in autumn is necessary since we were only able to monitor two events. Likewise, more accurate monitoring of the aquifer level is necessary to better understand its relationship with tide level and SCM performance. In this case, special focus should be given to meteorological high-tide events. Sea level monitoring is conducted by government entities and has been improved in recent years. We expect to obtain hourly data for sea level and tide level as opposed to the daily data used in this study.

Author Contributions

A.R.F.: Conceptualization, investigation, methodology, writing—original draft preparation, writing—review and editing, project administration, funding acquisition. E.F.P.: Conceptualization, methodology, investigation, writing—original draft preparation; P.K.U.: methodology, data curation, writing—review and editing. All authors have read and agreed to the published version of the manuscript.

Funding

This research was funded by the Brazilian research agencies CAPES (Coordenação de Aperfeiçoamento de Pessoal de Nível Superior) and CNPQ (Conselho Nacional de Desenvolvimento Científico e Tecnológico) edital MCTI/CNPq No 14/2013–Universal.

Institutional Review Board Statement

Not applicable.

Informed Consent Statement

Not applicable.

Data Availability Statement

The publicly available datasets presented in this study are available at https://repositorio.ufsc.br/handle/123456789/124868; https://repositorio.ufsc.br/xmlui/handle/123456789/176122; and https://repositorio.ufsc.br/handle/123456789/191295 (accessed on 20 October 2021).

Acknowledgments

The authors are very grateful to the CAPES (Coordenação de Aperfeiçoamento de Pessoal de Nível Superior) for financing a PhD scholarship, the CNPQ (Conselho Nacional de Pesquisa) for supporting research activities, and the Municipal Prefecture of Florianópolis for the partnership in this research.

Conflicts of Interest

The authors declare no conflict of interest. The funders had no role in the design of the study; in the collection, analyses, or interpretation of data; in the writing of the manuscript; or in the decision to publish the results.

References

  1. Fletcher, T.D.; Shuster, W.; Hunt, W.F.; Ashley, R.; Butler, D.; Arthur, S.; Trowsdale, S.; Barraud, S.; Semadeni-Davies, A.; Bertrand-Krajewski, J.L.; et al. SUDS, LID, BMPs, WSUD and more—The evolution and application of terminology surrounding urban drainage. Urban Water J. 2015, 12, 525–542. [Google Scholar] [CrossRef]
  2. Fu, G.; Butler, D.; Khu, S.T. The impact of new developments on river water quality from an integrated system modelling perspective. Sci. Total Environ. 2009, 407, 1257–1267. [Google Scholar] [CrossRef] [PubMed]
  3. Todeschini, S. Hydrologic and Environmental Impacts of Imperviousness in an Industrial Catchment of Northern Italy. J. Hydrol. Eng. 2016, 21, 05016013. [Google Scholar] [CrossRef]
  4. Ahmed, F.; Gulliver, J.S.; Nieber, J.L. Field infiltration measurements in grassed roadside drainage ditches: Spatial and temporal variability. J. Hydrol. 2015, 530, 604–611. [Google Scholar] [CrossRef]
  5. Allen, D.; Olive, V.; Arthur, S.; Haynes, H. Urban Sediment Transport through an Established Vegetated Swale: Long Term Treatment Efficiencies and Deposition. Water 2015, 7, 1046–1067. [Google Scholar] [CrossRef]
  6. Lantin, A.; Barrett, M. Design and pollutant reduction of vegetated strips and swales. In Impacts of Global Climate Change; Walton, R., Ed.; ASCE: Reston, VI, USA, 2005; p. 172. [Google Scholar] [CrossRef]
  7. Deletic, A.; Fletcher, T.D. Performance of grass filters used for stormwater treatment—A field and modelling study. J. Hydrol. 2006, 317, 261–275. [Google Scholar] [CrossRef]
  8. Stagge, J.H. Field Evaluation of Hydrologic and Water Quality Benefits of Grass Swales for Managing Highway Runoff. Ph.D. Thesis, University of Maryland, College Park, MA, USA, 2006. [Google Scholar]
  9. Abida, H.; Sabourin, J.F. Grass Swale-Perforated Pipe Systems for Stormwater Management. J. Irrig. Drain. Eng. 2006, 132, 55–63. [Google Scholar] [CrossRef]
  10. Saniei, K.; Yazdi, J.; Majdzadehtabatabei, M.R. Optimal size, type and location of low impact developments (LIDs) for urban stormwater control article history. Urban Water J. 2021, 18, 585–597. [Google Scholar] [CrossRef]
  11. Borst, M.; Asce, S.D.S.A.M.; Muthukrishnan, S.; Selvakumar, A. Swale Performance for Stormwater Runoff. In Proceedings of the World Environmental and Water Resources Congress 2007: Restoring Our Natural Habitat, Tampa, FL, USA, 15–19 May 2007; pp. 182–190. [Google Scholar] [CrossRef]
  12. Xu, C.; Shi, X.; Jia, M.; Han, Y.; Zhang, R.; Ahmad, S.; Jia, H. China Sponge City database development and urban runoff source control facility configuration comparison between China and the US. J. Environ. Manag. 2022, 304, 114241. [Google Scholar] [CrossRef]
  13. Demirezen, K.I.; Kazezylmaz-Alhan, C.M. Evaluation of the Hydrological Performance of Infiltration Trench with Rainfall-Watershed-Infiltration Trench Experimental Setup. J. Hydrol. Eng. 2022, 27, 04021050. [Google Scholar] [CrossRef]
  14. Peng, J.; Ouyang, J.; Yu, J. The model of low impact development of a sponge airport: A case study of Beijing Daxing International Airport. J. Water Clim. Chang. 2021, 12, 116–126. [Google Scholar] [CrossRef]
  15. Poleto, C. SUDS (Sustainable Urban Drainage Systems): Uma Contextualização Histórica. Rev. Thema 2011, 8, 38–58. [Google Scholar] [CrossRef]
  16. Arkema, K.K.; Guannel, G.; Verutes, G.; Wood, S.A.; Guerry, A.; Ruckelshaus, M.; Kareiva, P.; Lacayo, M.; Silver, J.M. Coastal habitats shield people and property from sea-level rise and storms. Nat. Clim. Chang. 2013, 3, 913–918. [Google Scholar] [CrossRef]
  17. Barbier, E.B.; Hacker, S.D.; Kennedy, C.; Koch, E.W.; Stier, A.C.; Silliman, B.R. The value of estuarine and coastal ecosystem services. Ecol. Monogr. 2011, 81, 169–193. [Google Scholar] [CrossRef]
  18. Ruckelshaus, M.H.; Guannel, G.; Arkema, K.; Verutes, G.; Griffin, R.; Guerry, A.; Silver, J.; Faries, J.; Brenner, J.; Rosenthal, A. Evaluating the benefits of green infrastructure for coastal areas. Coast. Manag. 2016, 44, 504–516. [Google Scholar] [CrossRef]
  19. Zonn, I. Atlas of the Oceans. In The Eastern Arctic Seas Encyclopedia; Springer: Berlin/Heidelberg, Germany, 2016; p. 31. [Google Scholar]
  20. Davis, A.P.; Stagge, J.H.; Jamil, E.; Kim, H. Hydraulic performance of grass swales for managing highway runoff. Water Res. 2012, 46, 6775–6786. [Google Scholar] [CrossRef]
  21. Revitt, D.M.; Ellis, J.B.; Lundy, L. Assessing the impact of swales on receiving water quality. Urban Water J. 2017, 14, 839–845. [Google Scholar] [CrossRef]
  22. Silva, A.H.C.L. Controle da Poluição Difusa de Origem Pluvial em uma via de Tráfego Intenso por Meio de Trincheira de Infiltração e Vala de Detenção. Ph.D. Thesis, Universidade Federal de Minas Gerais, Belo Horizote, Brazil, 2009. [Google Scholar]
  23. Gutierrez, L.A.R. Avaliação da Qualidade da Agua de Chuva e de um Sistema Filtro-Vala-Trincheira de Infiltração no Tratamento do Escomaento Superficial Direto Predial em Escala real em São Carlos-SP. Ph.D. Thesis, Universidade Federal de São Carlos, São Paulo, Brazil, 2011. [Google Scholar]
  24. Lucas, A.H. Monitoramento e Modelagem de um Sistema Filtro—Vala—Trincheira de Infiltração em Escala Real. Ph.D. Thesis, Universidade Federal de São Carlos, São Carlos, Brazil, 2011. [Google Scholar]
  25. Lucas, A.H.; Sobrinha, L.A.; Moruzzi, R.B.; Barbassa, A.P. Avaliação da construção e operação de técnicas compensatórias de drenagem urbana: O transporte de finos, a capacidade de infiltração, a taxa de infiltração real do solo e a permeabilidade da manta geotêxtil. Eng. Sanit. Ambient. 2015, 20, 17–28. [Google Scholar] [CrossRef]
  26. Ekka, S.A.; Rujner, H.; Leonhardt, G.; Blecken, G.-T.; Viklander, M.; Hunt, W.F. Next generation swale design for stormwater runoff treatment: A comprehensive approach. J. Environ. Manag. 2021, 279, 111756. [Google Scholar] [CrossRef]
  27. Zhang, K.; Chui, T.F.M. A review on implementing infiltration-based green infrastructure in shallow groundwater environments: Challenges, approaches, and progress. J. Hydrol. 2019, 579, 124089. [Google Scholar] [CrossRef]
  28. Andrade, S.F. Estudo de Estratégias Bioclimáticas no Clima de Florianópolis. Ph.D. Thesis, Universidade Federal de Santa Catarina, Florianópolis, Brazil, 1996. [Google Scholar]
  29. Peel, M.C.; Finlayson, B.L.; McMahon, T.A. Updated world map of the Köppen-Geiger climate classification. Hydrol. Earth Syst. Sci. 2007, 11, 1633–1644. [Google Scholar] [CrossRef]
  30. Inmet Web Base e Dados Climatológicos do Brasil. Available online: https://portal.inmet.gov.br/normais (accessed on 5 December 2022).
  31. Rech, A.; Pacheco, E.; Caprario, J.; Rech, J.C.; Finotti, A.R. Low-Impact Development (LID) in Coastal Watersheds: Infiltration Swale Pollutant Transfer in Transitional Tropical/Subtropical Climates. Water 2022, 14, 238. [Google Scholar] [CrossRef]
  32. Maidment, D.R. Handbook of Hydrology; McGraw Hill Companies: New York, NY, USA, 1993. [Google Scholar]
  33. Dunkerley, D. Identifying individual rain events from pluviograph records: A review with analysis of data from an Australian dryland site. Hydrol. Process. 2008, 22, 5024–5036. [Google Scholar] [CrossRef]
  34. ABNT Brazilian Technical Standard 07181: Soil Particle Size Determination with Sieves and Sedimentation. Water 1984, 14, 238.
  35. Silveira, A. Desempenho de Fórmulas de Tempo de Concentração em Bacias Urbanas e Rurais. Rev. Bras. Recur. Hídricos. 2005, 10, 5–29. [Google Scholar] [CrossRef]
  36. Back, Á.J.; Henn, A.; Oliveira, J.L.R. Heavy Rainfall Equations for Santa. Rev. Bras. Ciência Solo 2011, 35, 2127–2134. [Google Scholar] [CrossRef]
  37. Santos, H.G.; Jacomine, P.K.; Anjos, L.H.C.; Oliveira, V.A.; Lumbreras, J.F.; Coelho, M.R.; Almeida, J.A.; Araujo Filho, J.C.; Oliveira, J.B.; Cunha, T.J.F. Brazilian Soil Classification System; Embrapa: Brasilia, Brazil, 2018. [Google Scholar]
  38. Food and Agriculture Organization of the United Nations. World Reference Base for Soil Resouces 2014; FAO ONU: Rome, Italy, 2015. [Google Scholar]
  39. Pacheco, E.F. Avaliação quali-quantitativa do desempenho de uma vala de infiltração de águas pluviais implantada em Florianópolis. In Dissertação de Mestrado Apresentada ao Programa de Pós-Graduação em Engenharia Ambiental; Universidade Federal de Santa Catarina: Florianópolis, Brazil, 2015. [Google Scholar]
  40. Butler, J.J. The Design of Slug Tests. Des. Performance, Anal. Slug Tests, 2nd ed.; CRC Press: Boca Raton, FL, USA, 2019; pp. 9–28. [Google Scholar]
  41. Johnson, A.I. A Field Method for Measurement of Infiltration; US Geological Survey: Washington, DC, USA, 1963.
  42. Nasta, P.; Adane, Z.; Lock, N.; Houston, A.; Gates, J.B. Links between episodic groundwater recharge rates and rainfall events classified according to stratiform-convective storm scoring: A plot-scale study in eastern Nebraska. Agric. For. Meteorol. 2018, 259, 154–161. [Google Scholar] [CrossRef]
  43. Lewellyn, C.; Lyons, C.E.; Traver, R.G.; Wadzuk, B.M. Evaluation of Seasonal and Large Storm Runoff Volume Capture of an Infiltration Green Infrastructure System. J. Hydrol. Eng. 2016, 21, 4015047. [Google Scholar] [CrossRef]
  44. Ronquim, J. Gestão da Drenagem Urbana em Palmas PR; Universidade Estadual de Maringá: Maringá, Brazil, 2014. [Google Scholar]
  45. Macedo, M.B.; Rosa, A.; Mendiondo, E.M.; Souza, V.C.B. Otimização da eficiência de técnicas compensatórias de biorretenção em clima subtropical. In Proceedings of XXI Simpósio Brasileiro de Recursos Hídricos; ABRH: Brasilia, Brazil, 2015. [Google Scholar]
  46. Rushton, B.T. Low-Impact Parking Lot Design Reduces Runoff and Pollutant Loads. J. Water Resour. Plan. Manag. 2001, 127, 172–179. [Google Scholar] [CrossRef]
  47. Bäckström, M. Sediment transport in grassed swales during simulated runoff events. Water Sci. Technol. 2002, 45, 41–49. [Google Scholar] [CrossRef] [PubMed]
  48. Ackerman, D.; Stein, E.D. Evaluating the Effectiveness of Best Management Practices Using Dynamic Modeling. J. Environ. Eng. 2008, 134, 628–639. [Google Scholar] [CrossRef]
  49. Deletic, A. Modelling of water and sediment transport over grassed areas. J. Hydrol. 2001, 248, 168–182. [Google Scholar] [CrossRef]
  50. Caprario, J.; Finotti, A.R. Socio-technological tool for mapping susceptibility to urban flooding. J. Hydrol. 2019, 574, 574–1152. [Google Scholar] [CrossRef]
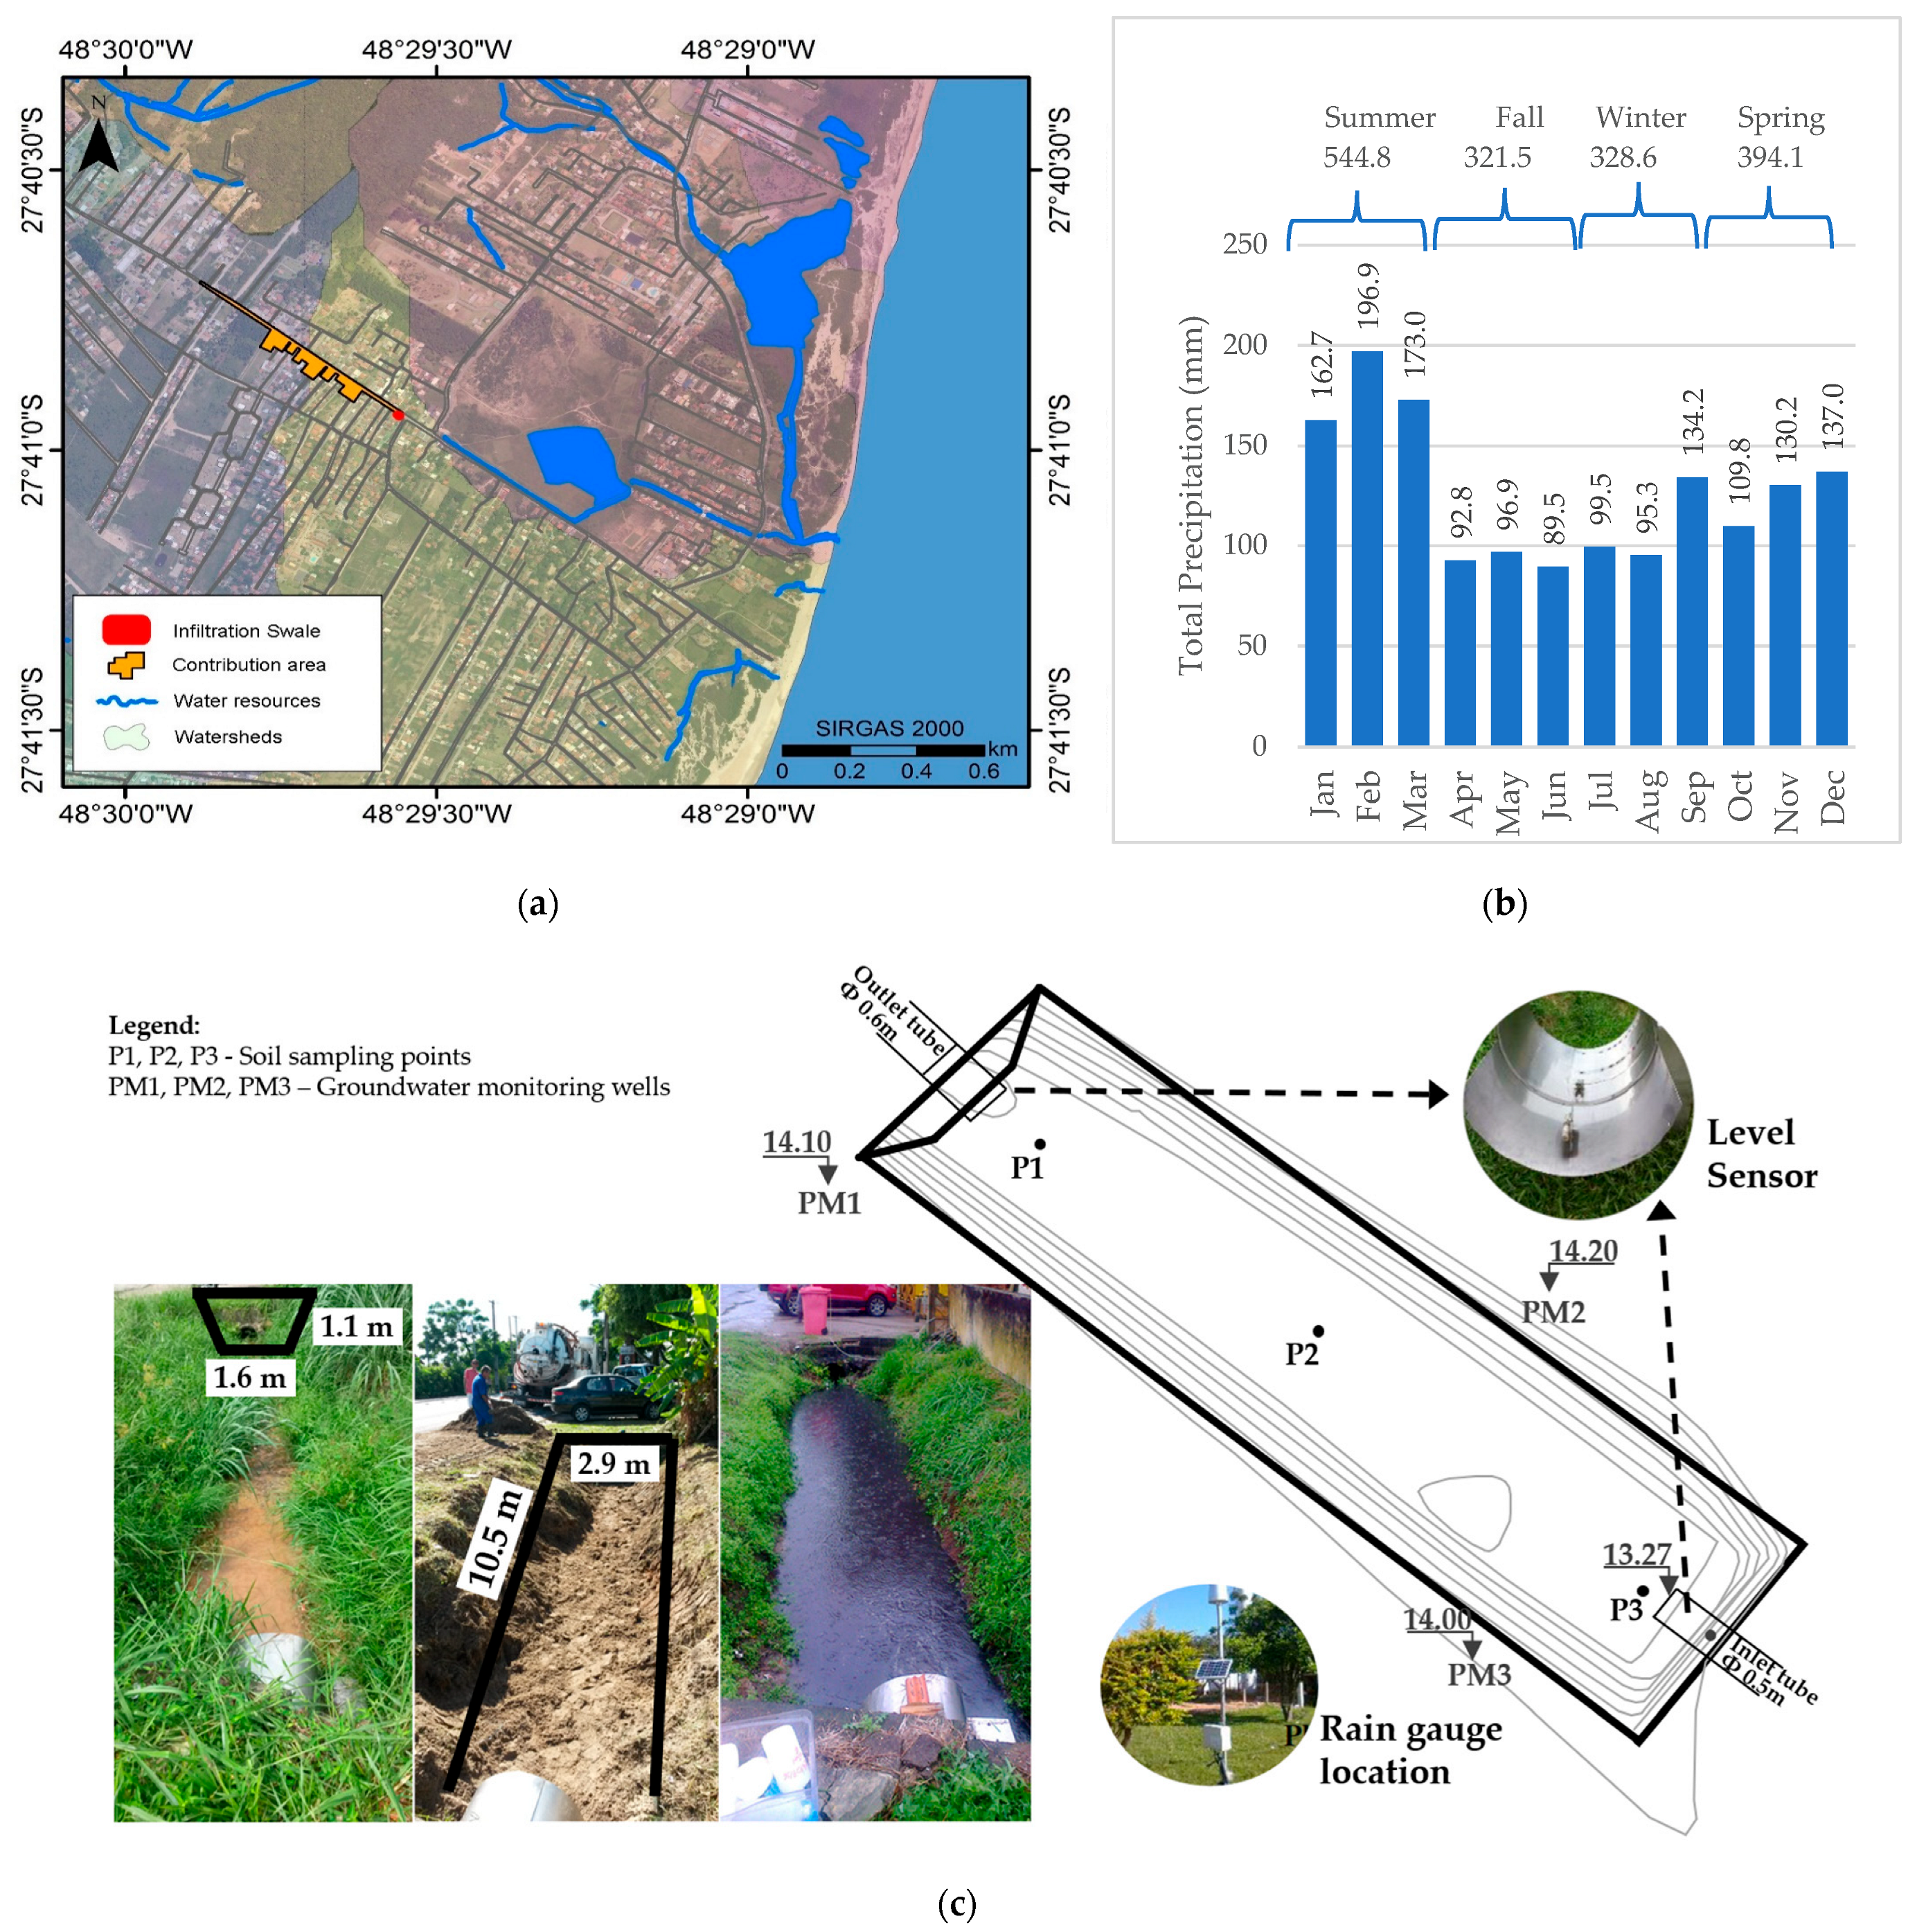
Figure 1. Location and climatological aspects of study area: (a) the swale located in Florianópolis in the south of Brazil and its connecting channels to the sea; (b) normal climatology of precipitation in Florianópolis (1981–2010) [30] with rainfall depth accumulated by season; and (c) swale instrumentation [31].
Coasts 03 00005 g001
Figure 2. Data processing schema for water balance, and hydrological and hydraulic swale performance calculations.
Coasts 03 00005 g002
Figure 3. Variation in rain height (P), medium intensity (Im), daily sea level (cm), daily tide level (cm), and percentage volume infiltrated (%Inf) in the swale.
Coasts 03 00005 g003
Figure 4. Correlation of rainfall depth and duration with percentage of infiltration in the swale.
Coasts 03 00005 g004
Figure 5. Balance of volumes in the swale inlet, outlet, and infiltrated volume distribution.
Coasts 03 00005 g005
Figure 6. Swale inflow/outflow (a) volumes and peak dumping distribution, (b) inflow and outflow volumes regression.
Coasts 03 00005 g006
Figure 7. Correlation of infiltration efficiency with tide/sea level.
Coasts 03 00005 g007
Figure 8. Interface between swale level (difference between maximum level at the swale inlet and outlet height), aquifer level, and tide level.
Coasts 03 00005 g008
Table 1. Rainfall runoff data from the monitored events grouped by season.
EventsTascDascDNRPImQeQoVeVotViTldSlm%Inf Inf
days(min)(min) (mm)(mm/h)(m³/s)(m³/s)(m³)(m³)(m³)(cm)(cm)
Winter1 Aug 14 23510714.63.737.23.66.03.92.844.121.748.43
4 Aug 14135202.510.44.629.05.816.910.26.250.722.036.50
12 Aug 14310407163.108.36.124.414.210.964.023.344.79
16 Aug 142491454102.417.24.716.08.96.145.923.138.16
16 Aug 143454407.41.297.24.329.616.48.945.923.129.87
25 Aug 14285145915.23.207.64.729.915.814.141.623.447.25
31 Aug 14330213638.46.989.46.147.225.721.538.321.045.51
2 Sept 141896015.24.838.36.513.05.96.962.222.253.30
3 Sept 141806302.60.872.52.23.61.71.941.721.053.10
3 Sept 143332709.81.773.63.210.36.04.241.721.041.31
21 Aug 15670110 9.20.825.42.540.210.629.857.922.274.07
22 Aug 152407502.80.705.42.930.65.724.934.119.281.38
25 Aug 151110220330.61.656.54.090.746.044.772.724.649.32
26 Aug 154203502.40.346.54.037.214.522.733.720.960.97
Spring24 Sept 1446035520.22.635.84.760.524.935.620.419.958.88
26 Sept 1442014509.61.377.64.030.720.79.943.223.332.42
27 Sept 1413545031.333.22.911.75.84.262.923.336.32
11 Oct 145054155111.3110.16.554.411.243.239.623.479.47
13 Oct 14715455260.85.1020.59.780.543.936.653.222.045.50
4 Nov 14701514.43.775.44.77.44.23.129.620.642.70
6 Nov 14130452125.5410.16.113.89.55.255.324.037.63
8 Nov 14452525.87.738.34.716.09.36.745.921.641.76
22 Nov 1480851.53.22.407.64.38.35.73.745.322.844.69
25 Nov 141174700260.83.119.46.8114.184.729.841.720.426.14
3 Dec 1453042098.20.939.46.542.918.824.141.720.856.11
14 Dec 144102859172.499.45.034.614.120.569.123.059.19
13 Dec 143020036.008.65.817.45.711.759.921.467.34
26 Nov 154935115.40.667.23.646.012.531.041.422.067.51
Summer15 Jan 15185308278.7610.17.250.316.433.863.223.367.28
4 Feb 151138252.553.82.846.83.217.08.29.251.222.754.40
13 Feb 15406130245.66.747.214.839.119.020.457.522.752.34
8 Mar 15560115397.610.4623.015.543.724.720.049.9 45.83
9 Mar 151347415050.42.249.45.879.137.541.850.0 52.81
15 Mar 151554153.2526.810.379.45.444.415.329.257.9 65.62
19 Mar 155302026.40.727.24.734.19.224.951.5 73.02
21 Mar 1517723218.66.316.86.521.714.47.657.7 34.99
7 Jan 1641169119.522.8510.14.043.512.830.735.61670.55
Fall28 Mar 15317312220.83.947.94.733.024.09.071.2 27.37
29 Mar 15511475025.83.037.62.523.55.617.951.8 76.00
Medium 409.4151.92.720.58.35.43.635.016.518.321.949.351.8
Maximum1347.0700.09.097.623.015.510.5114.184.744.724.772.881.4
Minimum30.06.00.02.42.52.20.33.61.71.916.120.426.1
D: rainfall duration; Tasc: time to peak; DNR: number of previous days without rain; P: rainfall depth; Im: mean rain intensity; Qe and Qo: water flow entering and leaving the swale; Ve: swale entry volume; Vo: swale output volume; Vi: infiltrated volume; Tld: mean daily tide level; Slm: mean daily sea level; and %Inf: infiltrated percentage. Vi in bold indicates infiltration volumes above 50% of the runoff and very good swale performance in runoff control.
Table 2. Overall swale performance in controlling runoff.
EVENTSRunoff ReductionAdvance of Peak FlowInfiltration Efficiency (% inf)
Vinf > VoTasc < TcTasc > Tc25–5050–7575–100
1 Aug 14 xx
4 Aug 14 xx
12 Aug 14 xx
16 Aug 14 xx
16 Aug 14 xx
25 Aug 14 xx
31 Aug 14 xx
2 Sept 14xx x
3 Sept 14x x x
3 Sept 14 xx
24 Aug 14x x x
26 Aug 14 xx
11 Oct 14x x x
13 Oct 14 xx
4 Nov 14 xx
6 Nov 14 xx
8 Nov 14 xx
22 Nov 14 xx
25 Nov 14 xx
3 Dec 14x x x
12 Dec 14x x x
13 Dec 14x x x
15 Jan 15x x x
4 Feb 15x x x
13 Feb 15x x x
8 Mar 15 xx
9 Mar 15x x x
15 Mar 15x x x
19 Mar 15x x x
21 Mar 15 xx
28 Mar 15 xx
29 Mar 15x x x
21 Aug 15x x x
22 Aug 15x x x
25 Aug 15 xx
26 Aug 15x x x
26 Nov 15x x x
7 Jan 16x x x
No. occurrences1913719154
% Occurrences50.00%2.63%97.37%50.00%39.47%10.53%
Salmon colored lines represent good runoff control; dark green indicates retardation in peak flow; infiltration efficiency is shown yellow, light yellow for 25 to 50% infiltration, medium yellow for 50 to 75% infiltration and strong yellow for 75 to 100% infiltration.
Table 3. Principal component loading and explained variance for the three components.
Factors Principal
Components
PC1PC2PC3
Tasc0.7390.287−0.283
D 0.357−0.3040.059
P (mm)0.776−0.358−0.177
Qe0.660−0.445−0.033
Im (mm/h)0.069−0.8680.108
Vi (m³)0.7150.246−0.483
Sea level0.4340.2850.780
Tide level0.4910.0940.774
% Inf0.3190.572−0.107
Eigenvalue2.761.731.58
Explained variance (%)30.6619.2417.57
Cumulative Eigenvalue2.764.496.07
Cumulative % of variance30.6649.9067.46
Bold represents the variance of the factors that compose the principal component.
Disclaimer/Publisher’s Note: The statements, opinions and data contained in all publications are solely those of the individual author(s) and contributor(s) and not of MDPI and/or the editor(s). MDPI and/or the editor(s) disclaim responsibility for any injury to people or property resulting from any ideas, methods, instructions or products referred to in the content.