Article

Processing Water-Based Lithium Iron Phosphate (LiFePO4) Cathodes with CMC Binder: The Impact of Dispersing Methods

by
Leah Jalowy
*,
Henry Lehmann
,
Patrick Rassek
,
Olga Fromm
,
Marc Entenmann
and
Dominik Nemec
*
Fraunhofer Institute for Manufacturing Engineering and Automation IPA, 70569 Stuttgart, Germany
*
Authors to whom correspondence should be addressed.
AppliedChem 2025, 5(4), 33; https://doi.org/10.3390/appliedchem5040033
Submission received: 12 August 2025 / Revised: 30 September 2025 / Accepted: 24 October 2025 / Published: 5 November 2025

Abstract

Lithium-ion batteries (LIBs) are vital for modern energy storage applications. Lithium iron phosphate (LFP) is a promising cathode material due to its safety, low cost, and environmental friendliness compared to the widely used nickel manganese cobalt oxide (NMC), which contains hazardous nickel and cobalt compounds. However, challenges remain in enhancing the performance of LFP cathodes due to their low electronic and ionic conductivity. To improve both the safety and sustainability of the battery, this work presents a water-based LFP cathode utilizing the bio-based binder carboxymethyl cellulose (CMC), eliminating the need for polyvinylidene fluoride (PVDF) and the toxic solvent N-methyl-2-pyrrolidone (NMP). This study investigates the impact of different dispersing methods—dissolver mixing and wet jet milling—on slurry properties, electrode morphology, and battery performance. Slurries were characterized by rheology, particle size distribution, and sedimentation behavior, while coated and calendered electrodes were examined via thickness measurements and scanning electron microscopy (SEM). Electrochemical performance of the electrodes was evaluated by means of C-Rate testing. The results reveal that dispersing methods significantly influence slurry characteristics but marginally affect electrochemical performance. Compared to dissolver mixing, wet jet milling reduced the median particle size by 39% (ΔD50 = 3.1 µm) and lowered viscosity by 96% at 1 s−1, 80% at 105 s−1, and 64% at 1000 s−1. In contrast, the electrochemical performance of the resulting electrodes differed only slightly, with discharge capacity varying by approximately 12.8% at 1.0 C (Δcapacity = 10.7 mAh g−1). This research highlights the importance of optimizing not only material selection but also processing techniques to advance safer and more sustainable energy storage solutions.

1. Introduction

Lithium-ion batteries (LIBs) have revolutionized energy storage solutions, making them indispensable in modern technology due to their advantageous attributes like high energy density, long cycle life, and reduced greenhouse gas emissions [1,2,3]. They are the most common power source for portable devices and are crucial in the development of electric vehicles and plug-in hybrid electric vehicles [2,4,5]. However, the performance and safety of LIBs vary significantly depending on the materials used, and several challenges remain, particularly in terms of energy and power density, fast charge capability, cost, lifetime, and safety [2,3,6,7].
LIBs can be classified into different types based on their characteristics and properties. The most commonly used cathode chemistries at present are lithium cobalt oxide (LCO), lithium nickel manganese cobalt oxide (NMC), and lithium iron phosphate (LFP) [8,9]. Among these various types of LIBs, LFP batteries have gained significant attention due to their low cost, low toxicity, long cycle life (generally around 2000 cycles at 1 C, with some cells achieving more than 3500 cycles [10]), thermal stability (chemically stable up to ~200 °C and decomposing between ~300–400 °C [11]), and environmental friendliness, as it avoids the use of scarce and toxic metals such as cobalt and nickel [8,12,13]. Despite these advantages, LFP suffers from low intrinsic electronic and ionic conductivity, which induces poor high-rate performance and strongly impacts its electrochemical performance [8,14]. Additionally, a main disadvantage of LFP is its lesser energy density compared to other cathode materials [2].
To mitigate these limitations and improve performance, attention has increasingly turned to optimizing electrode processing. One often overlooked but critical aspect in improving the performance of LFP cathodes is the slurry preparation process, particularly the dispersing technique used to mix the active materials, conductive additives, and binders. The choice of dispersing method affects key slurry characteristics such as particle size distribution, homogeneity, viscosity, and stability—all of which have downstream effects on electrode morphology, coating quality, and ultimately, battery performance [15,16,17,18]. Inhomogeneous dispersions can lead to poor electrode uniformity, inadequate conductive networks, and lower utilization of the active material [19,20].
Since effective dispersion also depends on the chemical environment and solvent system used during slurry preparation, the choice of binder plays a critical role in determining the overall processability and stability of water-based systems. Slurry mixing and electrode coatings manufacturing rely heavily on the binder material, as it dictates the choice of solvent in slurry formation and coating process [21]. Polyvinylidene fluoride (PVDF) is a standard high-performance binder in LIBs. It is valued for its excellent adhesion as well as chemical and electrochemical stability and is often selected as a suitable binder in LFP cathodes [12,21]. However, PVDF has notable drawbacks, including its tendency to react with anode lithium metal and electrolyte at high temperatures, leading to the formation of lithium fluoride and hydrofluoric acid, which can degrade the internal structure of the battery [12]. Fluoropolymers are not only expensive but also require toxic solvents such as N-methyl-2-pyrrolidone (NMP) to dissolve PVDF [22,23,24]. Furthermore, the use of NMP for dissolving PVDF introduces additional safety and environmental concerns due to its toxicity and high boiling point of 203 °C [21]. To address these issues, there has been a shift towards the development of water-processable or aqueous batteries [12]. Water-soluble or water-dispersible binders are emerging as a viable alternative to PVDF, offering benefits such as safety, environmental friendliness, and cost-effectiveness [22,25]. Carboxymethyl cellulose (CMC) in combination with styrene butadiene rubber (SBR) is a binder system, which has been investigated aiming to replace PVDF and realizing water-based processing of LFP cathodes [26,27]. The substitution of PVDF with CMC not only enhances the safety profile of the battery but also allows for water-based processing, thereby eliminating the need for toxic solvents like NMP. This shift towards aqueous processing holds significant promise for the future of LIBs, aligning with the broader goals of environmental sustainability and safety [28]. Studies have shown that water-processable binders can maintain comparable performance to their solvent-based counterparts while offering additional benefits such as lower cost and reduced environmental impact [22,28].
Although CMC-based binders are commonly used in anode formulations, a few studies have investigated their application in LFP cathodes. For example, Zhang et al. demonstrated that CMC—both alone and in combination with other water-processable binders—can be used in LFP cathodes with acceptable electrochemical performance [29]. These results confirm the basic viability of CMC in such systems. However, prior studies have primarily focused on achieving acceptable electrochemical performance, with limited attention to the role of processing parameters in these systems. In particular, the influence of different dispersing methods on slurry characteristics—such as viscosity, particle distribution, and stability—remains underexplored. While some work has explored the role of CMC in particle dispersion [30,31,32], there is a lack of systematic comparisons of multiple dispersing techniques using the same CMC binder in aqueous LFP slurries. Since slurry performance of aqueous slurries is highly dependent on dispersion homogeneity, understanding how different dispersing methods affect electrode morphology and electrochemical behavior is essential. Addressing this knowledge gap is critical for advancing sustainable and reproducible production of high-performance LFP electrodes.
This study specifically investigates the impact of different dispersing methods on the slurry properties and electrochemical performance of CMC-based, water-processed LFP cathodes. By comparing dispersing techniques such as dissolver mixing and wet jet milling, and evaluating their effects on rheology, particle dispersion, coating uniformity, and electrochemical behavior, this research aims to provide a deeper understanding of how processing parameters influence battery performance. By positioning processing techniques—rather than material selection—as the central focus, this work contributes to the development of more efficient, environmentally safer, and sustainable lithium-ion battery manufacturing practices.

2. Materials and Methods

2.1. Materials

Two different cathode pastes were prepared using lithium iron phosphate (LFP, IBUvolt LFP200, IBU-tec Advanced Materials AG, Weimar, Germany) as active material (BET surface area: 19–25 m2 g−1; median particle size: D50 = 5–8 µm), carbon black (C-NERGY Super C65, Imerys Graphite & Carbon Belgium SA, Willebroek, Belgium) as conductive additive (BET surface area: 57–67 m2 g−1), carboxymethyl cellulose (CMC, SunRose MAC500LC, Nippon Paper Industries Co., Ltd., Tokyo, Japan) as binder material, and deionized water as solvent. Phosphoric acid (Phosphoric acid, 85 wt% in H2O, 99.99% trace metals basis, Sigma-Aldrich Chemie GmbH, Taufkirchen, Germany) was used to adjust the pH for all slurries.
For coating the slurries, aluminum foil with a thickness of 20 µm (Aluminum foil, soft, smooth, silver/silver, 0.020 mm × 150 mm, Korff AG, Oberbipp, Switzerland) was used as the current collector.
For cell assembly, the following materials were used: punched LFP cathodes (16 mm diameter); bare lithium chips with dimensions of 15.6 mm × 0.25 mm (Lithium discs, purity 99.9%, 15.6 mm diameter × 0.25 mm thickness, PI-KEM Limited, Tamworth, UK); fiber glass separators with dimensions of 18.0 mm × 1.25 mm (ECC1-01-0012-C/L, EL-Cell GmbH, Hamburg, Germany); and electrolyte (VP1168 1M LiPF6, EC:DMC (30:70 wt%) + 2 wt% VC, E-Lyte Innovations GmbH, Kaiserslautern, Germany).

2.2. Slurry Production

For the preparation of the LFP cathode slurry, two different dispersing methods were tested: dissolver mixing and wet jet milling. Dissolver mixing involves the high-speed rotation of a toothed disc in the slurry, generating high shear forces that break up agglomerates and disperse solid particles in the liquid medium. It is widely used due to its operational simplicity [33]. Wet jet milling, by contrast, is a more advanced high-pressure dispersing process that forces the slurry through a micro-nozzle at pressures up to 2450 bar. This process induces intense particle collisions and efficient deagglomeration, enabling the production of slurries with reduced particle sizes [34].
For Paste A, 300 g of a 2.5 wt% CMC binder solution was prepared beforehand using a dissolver (Dispermat Dissolver, VMA-Getzmann GmbH, Reichshof, Germany). To this binder solution, 237.5 g of LFP was added continuously over a period of 30 min while dispersing with the dissolver at a speed of 6000 rpm, using a disc with a diameter of 4 cm. If necessary, deionized water was added to adjust the viscosity, along with CMC powder to maintain a consistent solids content and pigment-to-binder ratio across all two pastes. In this instance, 150 mL of deionized water and 0.49 g of CMC were added. Subsequently, 15.6 g of carbon black was introduced and dispersed for 15 min at 6000 rpm. After the carbon black was fully incorporated, the mixture was dispersed for an additional 15 min at 6000 rpm. The pH of the slurry was adjusted to 6.3 using diluted phosphoric acid to stabilize the aluminum oxide layer on the current collector and minimize the risk of corrosion in contact with the aqueous slurry [35]. All paste preparation steps were carried out at ambient laboratory temperature without active temperature control. The composition of Paste A is shown in Table 1.
For Paste B, 700 g of a 50 wt% slurry of LFP in deionized water was prepared using a dissolver equipped with a 4 cm disc, operating at 400 rpm for 5 min to ensure proper mixing prior to high-pressure dispersion. The slurry was then dispersed using a high-pressure wet jet milling system (Star Burst Mini, Sugino Machine Limited, Tokyo, Japan), equipped with a 0.12 mm nozzle, at a pressure of 2200 bar for two passes. The processed slurry was subsequently mixed with 140 g of a 2.5 wt% CMC binder solution using the dissolver at 400 rpm for 5 min. Deionized water, carbon black, and CMC powder were added to adjust the solids content and the pigment-to-binder ratio. The mixture was then dispersed for 5 min at 400 rpm. The pH of the slurry was then adjusted to 6.3 using diluted phosphoric acid. All paste preparation steps were carried out at ambient laboratory temperature without active temperature control. The solids content of Paste B was increased to achieve comparable dry film thicknesses to those of Paste A in the subsequent coating process. The composition of Paste B is shown in Table 2.
The fully formulated pastes, including carbon black, were used for all subsequent process steps following slurry production and characterization, such as coating process and electrochemical characterization. Slurry characterization was conducted using intermediate pastes prior to the addition of carbon black to specifically investigate the behavior of LFP particles in the slurry.

2.3. Slurry Characterization

The characterization of the slurries was conducted to evaluate their physical properties, which are crucial for the performance of the electrodes.
Particle size distribution was analyzed using laser diffraction analysis in a wet cell setup with water as the dispersant (Mastersizer 2000, Hydro 2000 SM, Malvern Panalytical Ltd., Malvern, UK). The laser obscuration was maintained between 10% and 15% to ensure accurate measurements.
The rheology of the slurries was investigated using a rotational rheometer (Modular Compact Rheometer MCR 301, Anton Paar Germany GmbH, Ostfildern-Scharnhausen, Germany). Viscosity measurements of the LFP pastes were performed with a cone-plate geometry (CP50-1: 50 mm diameter, 1° angle) at a measuring gap of 0.101 mm and a constant temperature of 20 °C, covering shear rates from 1 s−1 to 1000 s−1.
For sedimentation analysis, each paste was filled into a sample container, sealed, and allowed to sediment for 14 days at room temperature. To investigate the paste stability, the stored pastes were stirred using a dissolver at 400 rpm with a 2 cm disc for 15 min, after which the particle size distribution and viscosity were measured.

2.4. Coating Process

For the preparation of the LFP electrodes, aluminum foil with a thickness of 20 µm was selected as the substrate. Coating experiments were conducted using a semi-automatic film coater (Automatic Film Applicator, BYK Gardner, Geretsried, Germany) equipped with a doctor blade (coating width: 6 cm), applying slurries using a fixed nominal coating gap of 250 µm. The coating speed was set to 50 mm s−1. After application, the electrode sheets with wet electrode layers were immediately transferred to a thermal drying procedure, which was carried out using a hotplate (Hotplate HT22, Harry Gestigkeit GmbH, Düsseldorf, Germany) at 50 °C for 15 min.

2.5. Electrode Calendering

Electrode sheets with dry LFP electrode layers were mechanically compacted by calendering. A semi-automatic two-roll calender with unheated rollers (Laboratory calender, Ingecal constructeur, Chassieu, France) and maximal pressure between the rolls of 4000 N cm−1 was employed for this procedure (Figure 1a). The manually adjustable gap between the rolls was set to 80 µm to achieve an electrode layer thickness reduction of ~30%. To determine the electrode thickness before and after the calendering procedure, a dial indicator (Digital Indicator ID-F 25.4 mm, 0.0005 mm, with CEE AC-Adapter, Mitutoyo Corporation, Kawasaki, Japan) equipped with a carbide ball (Figure 1b) was used. Measurements were taken at predefined positions (Figure 1c).

2.6. Coating Characterization

In addition to determining the electrode thickness, the characterization of the LFP coatings was further conducted using scanning electron microscopy (SEM). The SEM analysis was performed to evaluate the morphological characteristics of the LFP electrodes coated with different pastes. The cross-sectional images were obtained using a high-resolution scanning electron microscope (Helios NanoLab 600i DualBeam SEM/FIB, FEI Company, a part of Thermo Fisher Scientific, Hillsboro, OR, USA), which allowed for a detailed examination of the electrode structure. The samples were cut to size, embedded in acrylic resin, ground, and polished to obtain cross-sections. They were then sputtered with gold to ensure good conductivity.

2.7. Electrode Punching and Drying

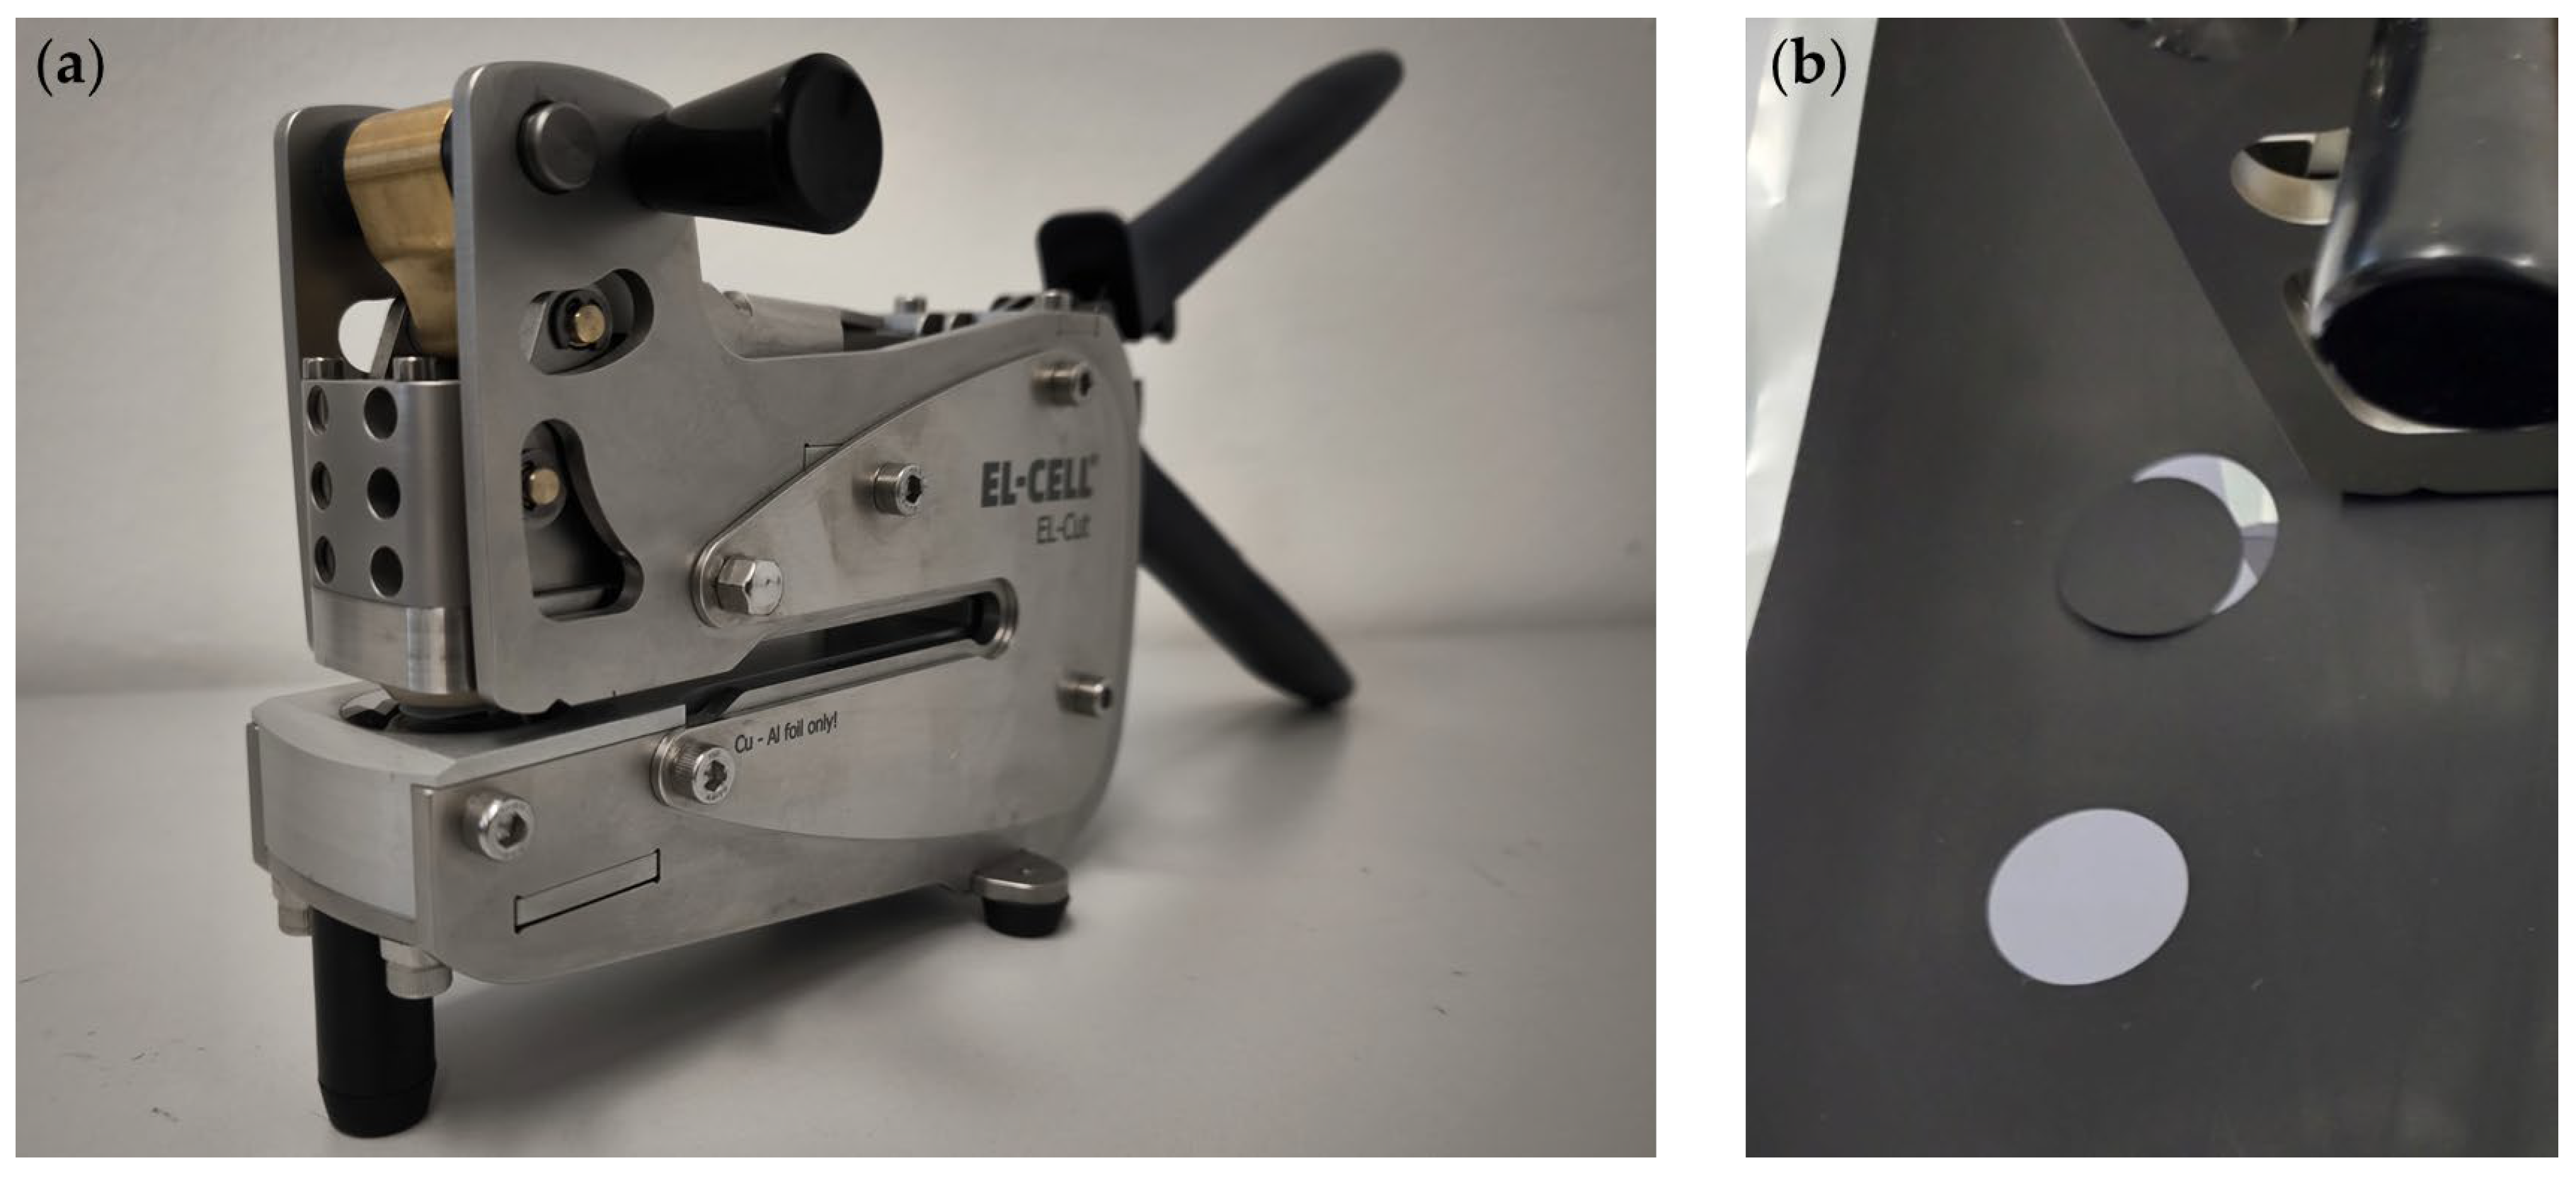
Round electrodes (16 mm in diameter) were punched from the calendered electrode sheets using specialized punching equipment (EL-Cut 16, EL-Cell GmbH, Hamburg, Germany) (Figure 2).
The electrode masses were subsequently determined gravimetrically to calculate the theoretical electrode capacities. To minimize residual moisture in the active material, the LFP electrodes were transferred to a vacuum oven (Glass Oven for Drying B-585, Vacuum Pump V-100, Interface I-100, BÜCHI Labortechnik GmbH, Essen, Germany) and dried under vacuum atmosphere (25 mbar) at a temperature of 100 °C for 16 h. The separators were also dried under vacuum (25 mbar) at 220 °C for 68 h.

2.8. Cell Assembly

Battery test cells (ECC-Std, EL-Cell GmbH, Hamburg Germany) in half-cell configuration were assembled in a glovebox under an argon atmosphere to conduct electrochemical experiments and record vital battery performance parameters of the manufactured electrodes (Figure 3a). Bare lithium chips were placed into the EL-Cells, followed by fiber glass separators, which were positioned on top of the lithium chips. The LFP electrodes were then placed on the separators and 400 µL of electrolyte was inserted. Three EL-Cells were assembled for each paste and subsequently transferred from the glovebox to the battery test system (Cell Test System CTS-Lab, BaSyTec GmbH, Asselfingen, Germany) (Figure 3b).

2.9. Electrochemical Characterization

The electrochemical characterization of the half-cells was carried out by C-Rate tests within a voltage range of 2.8 V vs. Li/Li+ (lower cut-off potential) and 3.6 V vs. Li/Li+ (upper cut-off potential). The cycling procedure was set to C-Rates of 0.1 C, 0.33 C, 0.5 C, 1.0 C, 3.0 C, and 0.1 C, with the theoretical capacity of LFP (150 mAh g−1). Three cycles were performed for each C-Rate at an ambient temperature of 23 °C. The stop criterion for the start cycle was set to U > 4.3 V and t > 10 s. Between the individual C-Rate steps, the stop criteria were set to U > 3.6 V and t > 5 s for the upper cut-off potential, and U < 2.8 V and t > 5 s for the lower cut-off potential. No additional CCCV step was performed between charging and discharging.

3. Results

3.1. Slurry Properties

The performance of LFP electrodes is closely linked to the quality of the slurry used in their fabrication. The physical properties of the slurry, including particle size distribution, viscosity, and stability, influence the uniformity of the electrode coating, the formation of conductive networks, and the overall structural integrity of the electrode film. These factors ultimately affect how efficiently lithium ions and electrons can move within the electrode during battery operation. To evaluate how different dispersing methods impact these critical parameters, LFP pastes prior to the addition of carbon black were examined in terms of particle size distribution, rheological behavior, and sedimentation characteristics. This approach allows for isolating the influence of dispersing method on the dispersion quality of the LFP particles.

3.1.1. Particle Size Distribution

Laser diffraction analysis in a wet cell setup was employed to evaluate the particle size distribution of the LFP slurries. The measurements were conducted immediately after slurry production, revealing distinct characteristics among the samples (Figure 4). Paste A, produced using a dissolver, exhibits a distribution centered around larger particle sizes, with a D10 of 2.23 µm, D50 of 7.91 µm, and D90 of 15.56 µm. The calculated span of 1.69 (width of the size distribution; span = (D90 − D10)/D50) indicates a relatively narrow size distribution. In contrast, Paste B, processed via wet jet milling, shows significantly finer particles with a D10 of 0.67 µm, D50 of 4.78 µm, and D90 of 12.30 µm. Its span of 2.43 reflects a broader overall distribution. Thus, compared to dissolver mixing, wet jet milling reduced the median particle size by 39% (ΔD50 = 3.1 µm).
These results indicate that wet jet milling not only reduces the median particle size but also enhances dispersion efficiency by breaking down larger agglomerates. While Paste B shows a broader distribution span, it maintains a finer overall particle population and a more efficient deagglomeration of larger structures. This suggests improved homogenization, which is beneficial for achieving a more uniform electrode.
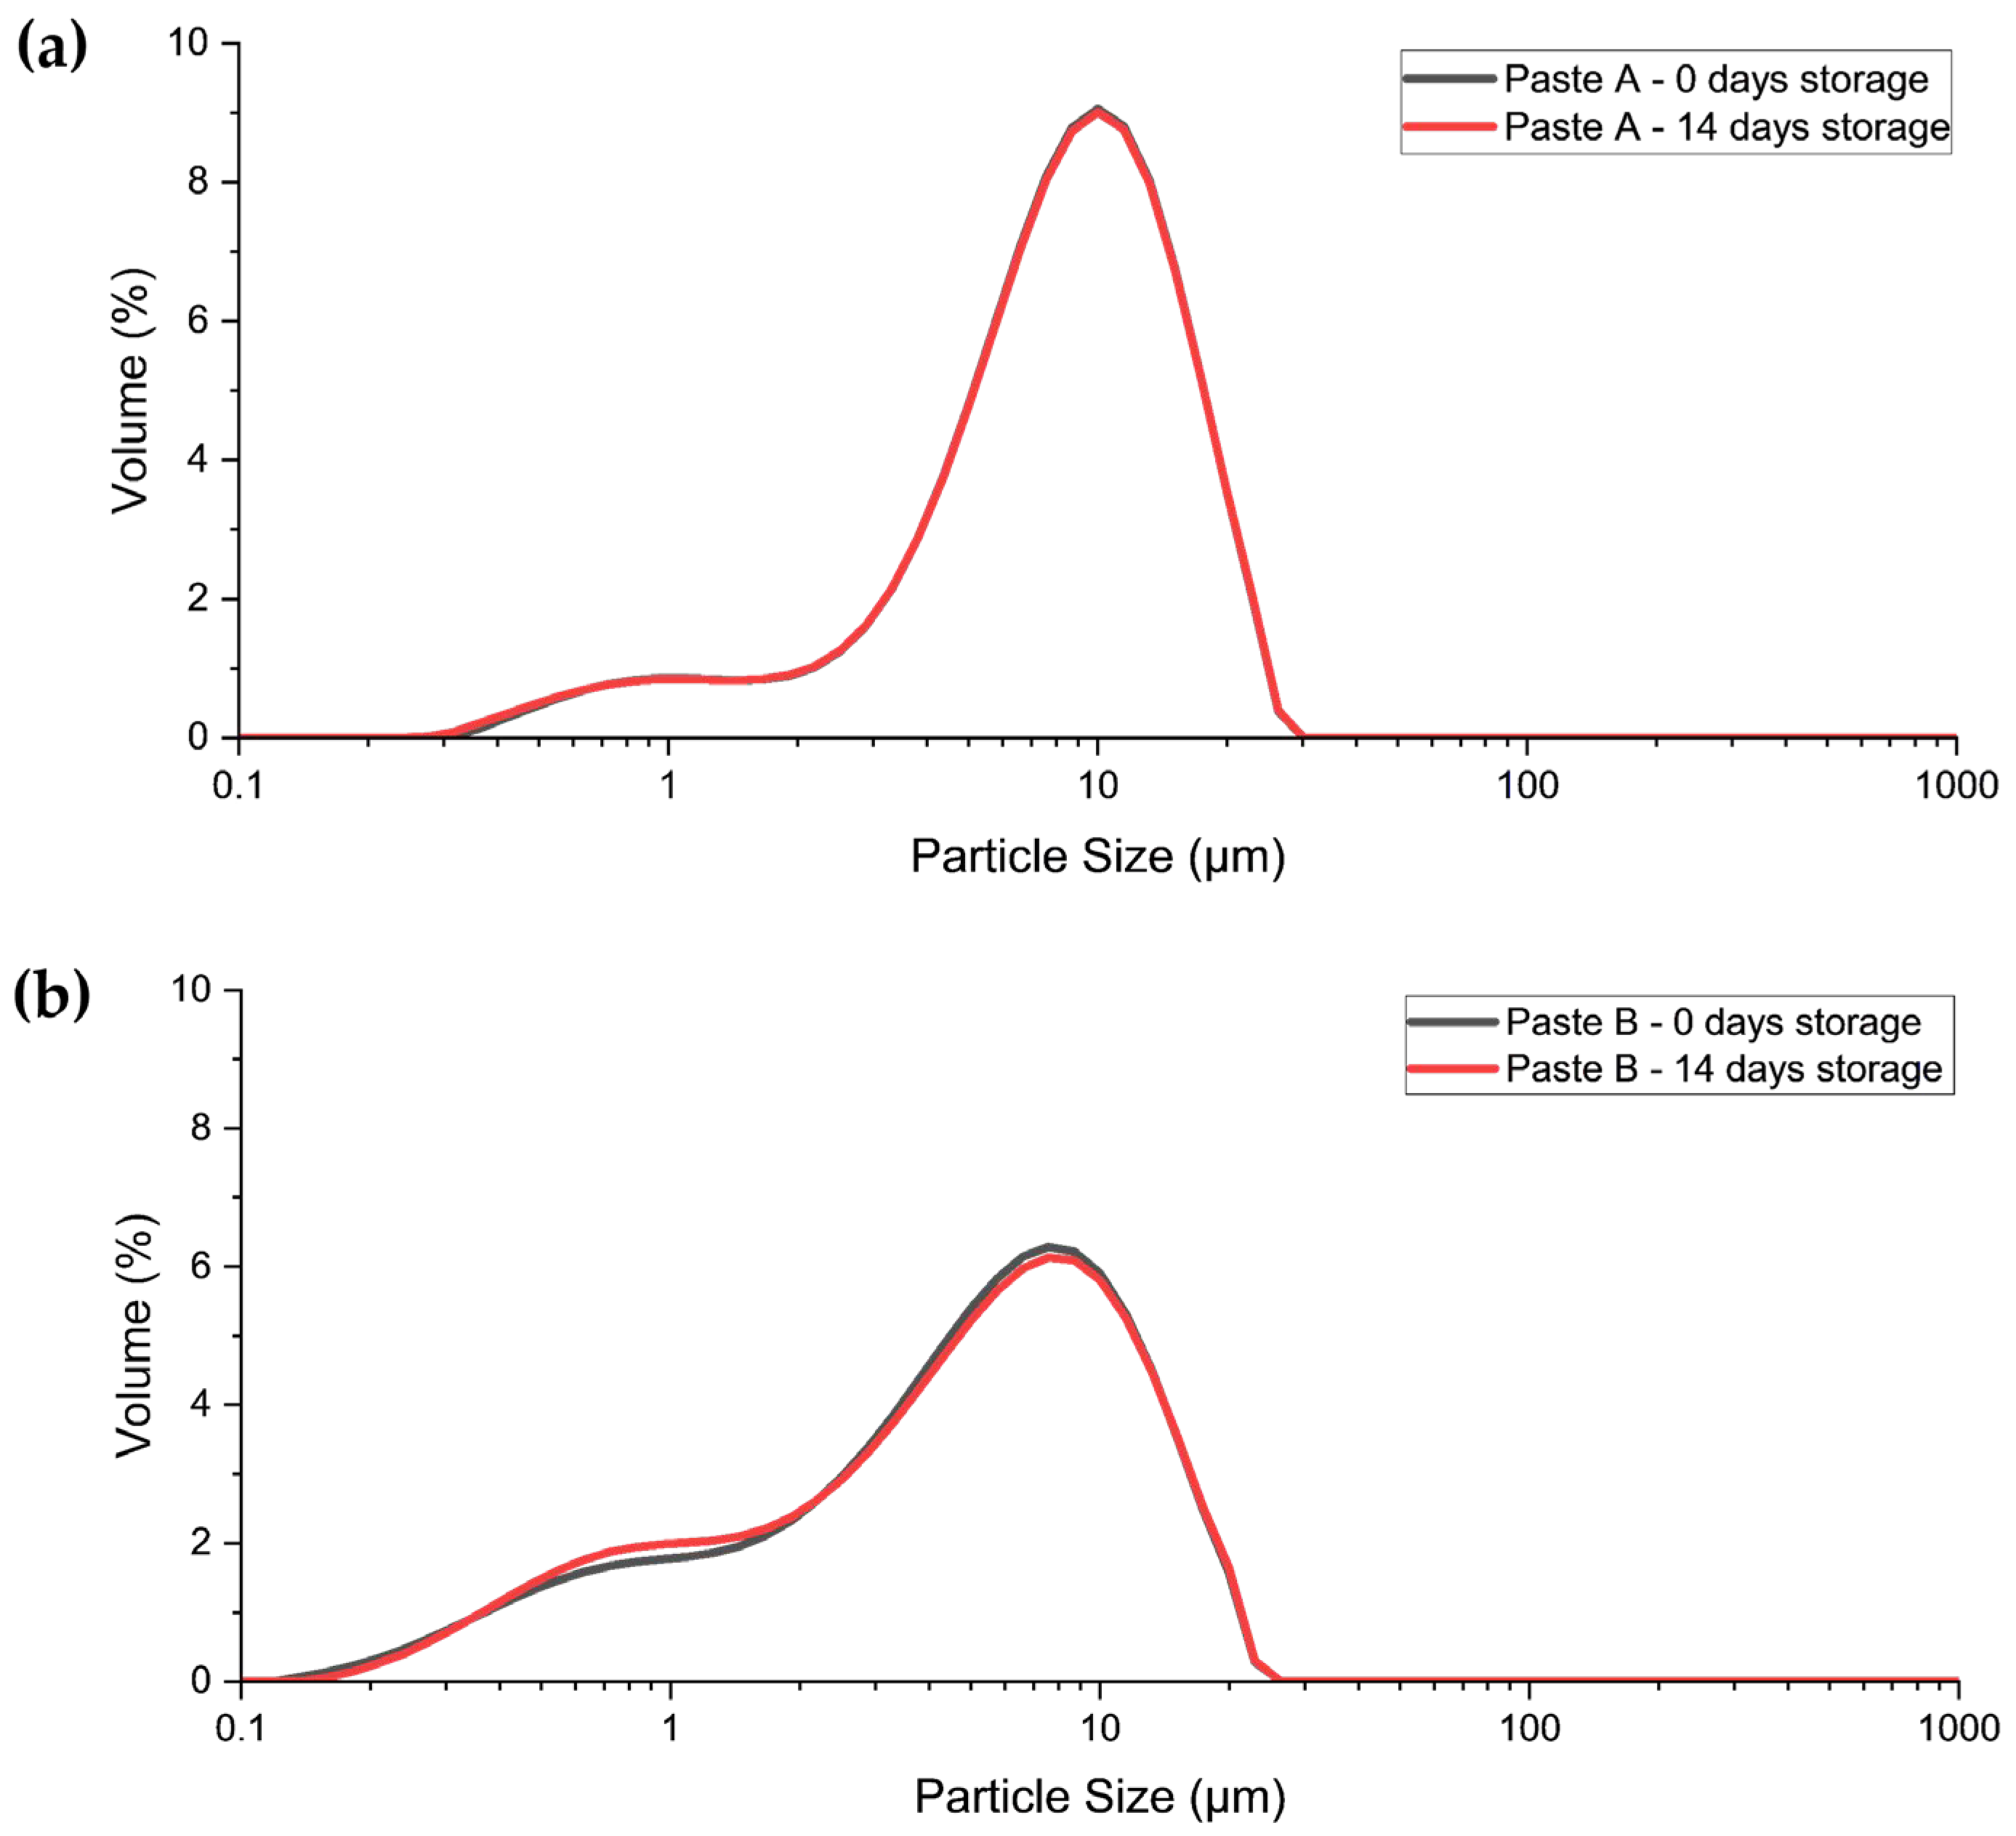
After 14 days of storage at room temperature, each paste was stirred for 15 min at 400 rpm using a dissolver with a 2 cm disc prior to particle size measurement. The particle size distribution curves of the freshly produced slurries are compared with those of the slurries stored for 14 days to investigate the redispersibility of the LFP slurries after storage. The results show that the particle size distribution of Paste A remains stable after 14 days of storage, with no signs of agglomeration, as evidenced by the identical curves (Figure 5a). For Paste B, while the particle size is largely stable after storage, slight differences between the curves are observed, suggesting minor changes in the distribution but no significant agglomeration (Figure 5b).
Overall, these findings indicate that the particle size stability of the LFP slurries is maintained after 14 days of storage at room temperature, and that the pastes can be easily redispersed after sedimentation. This underscores their suitability for applications requiring consistent performance.

3.1.2. Rheology

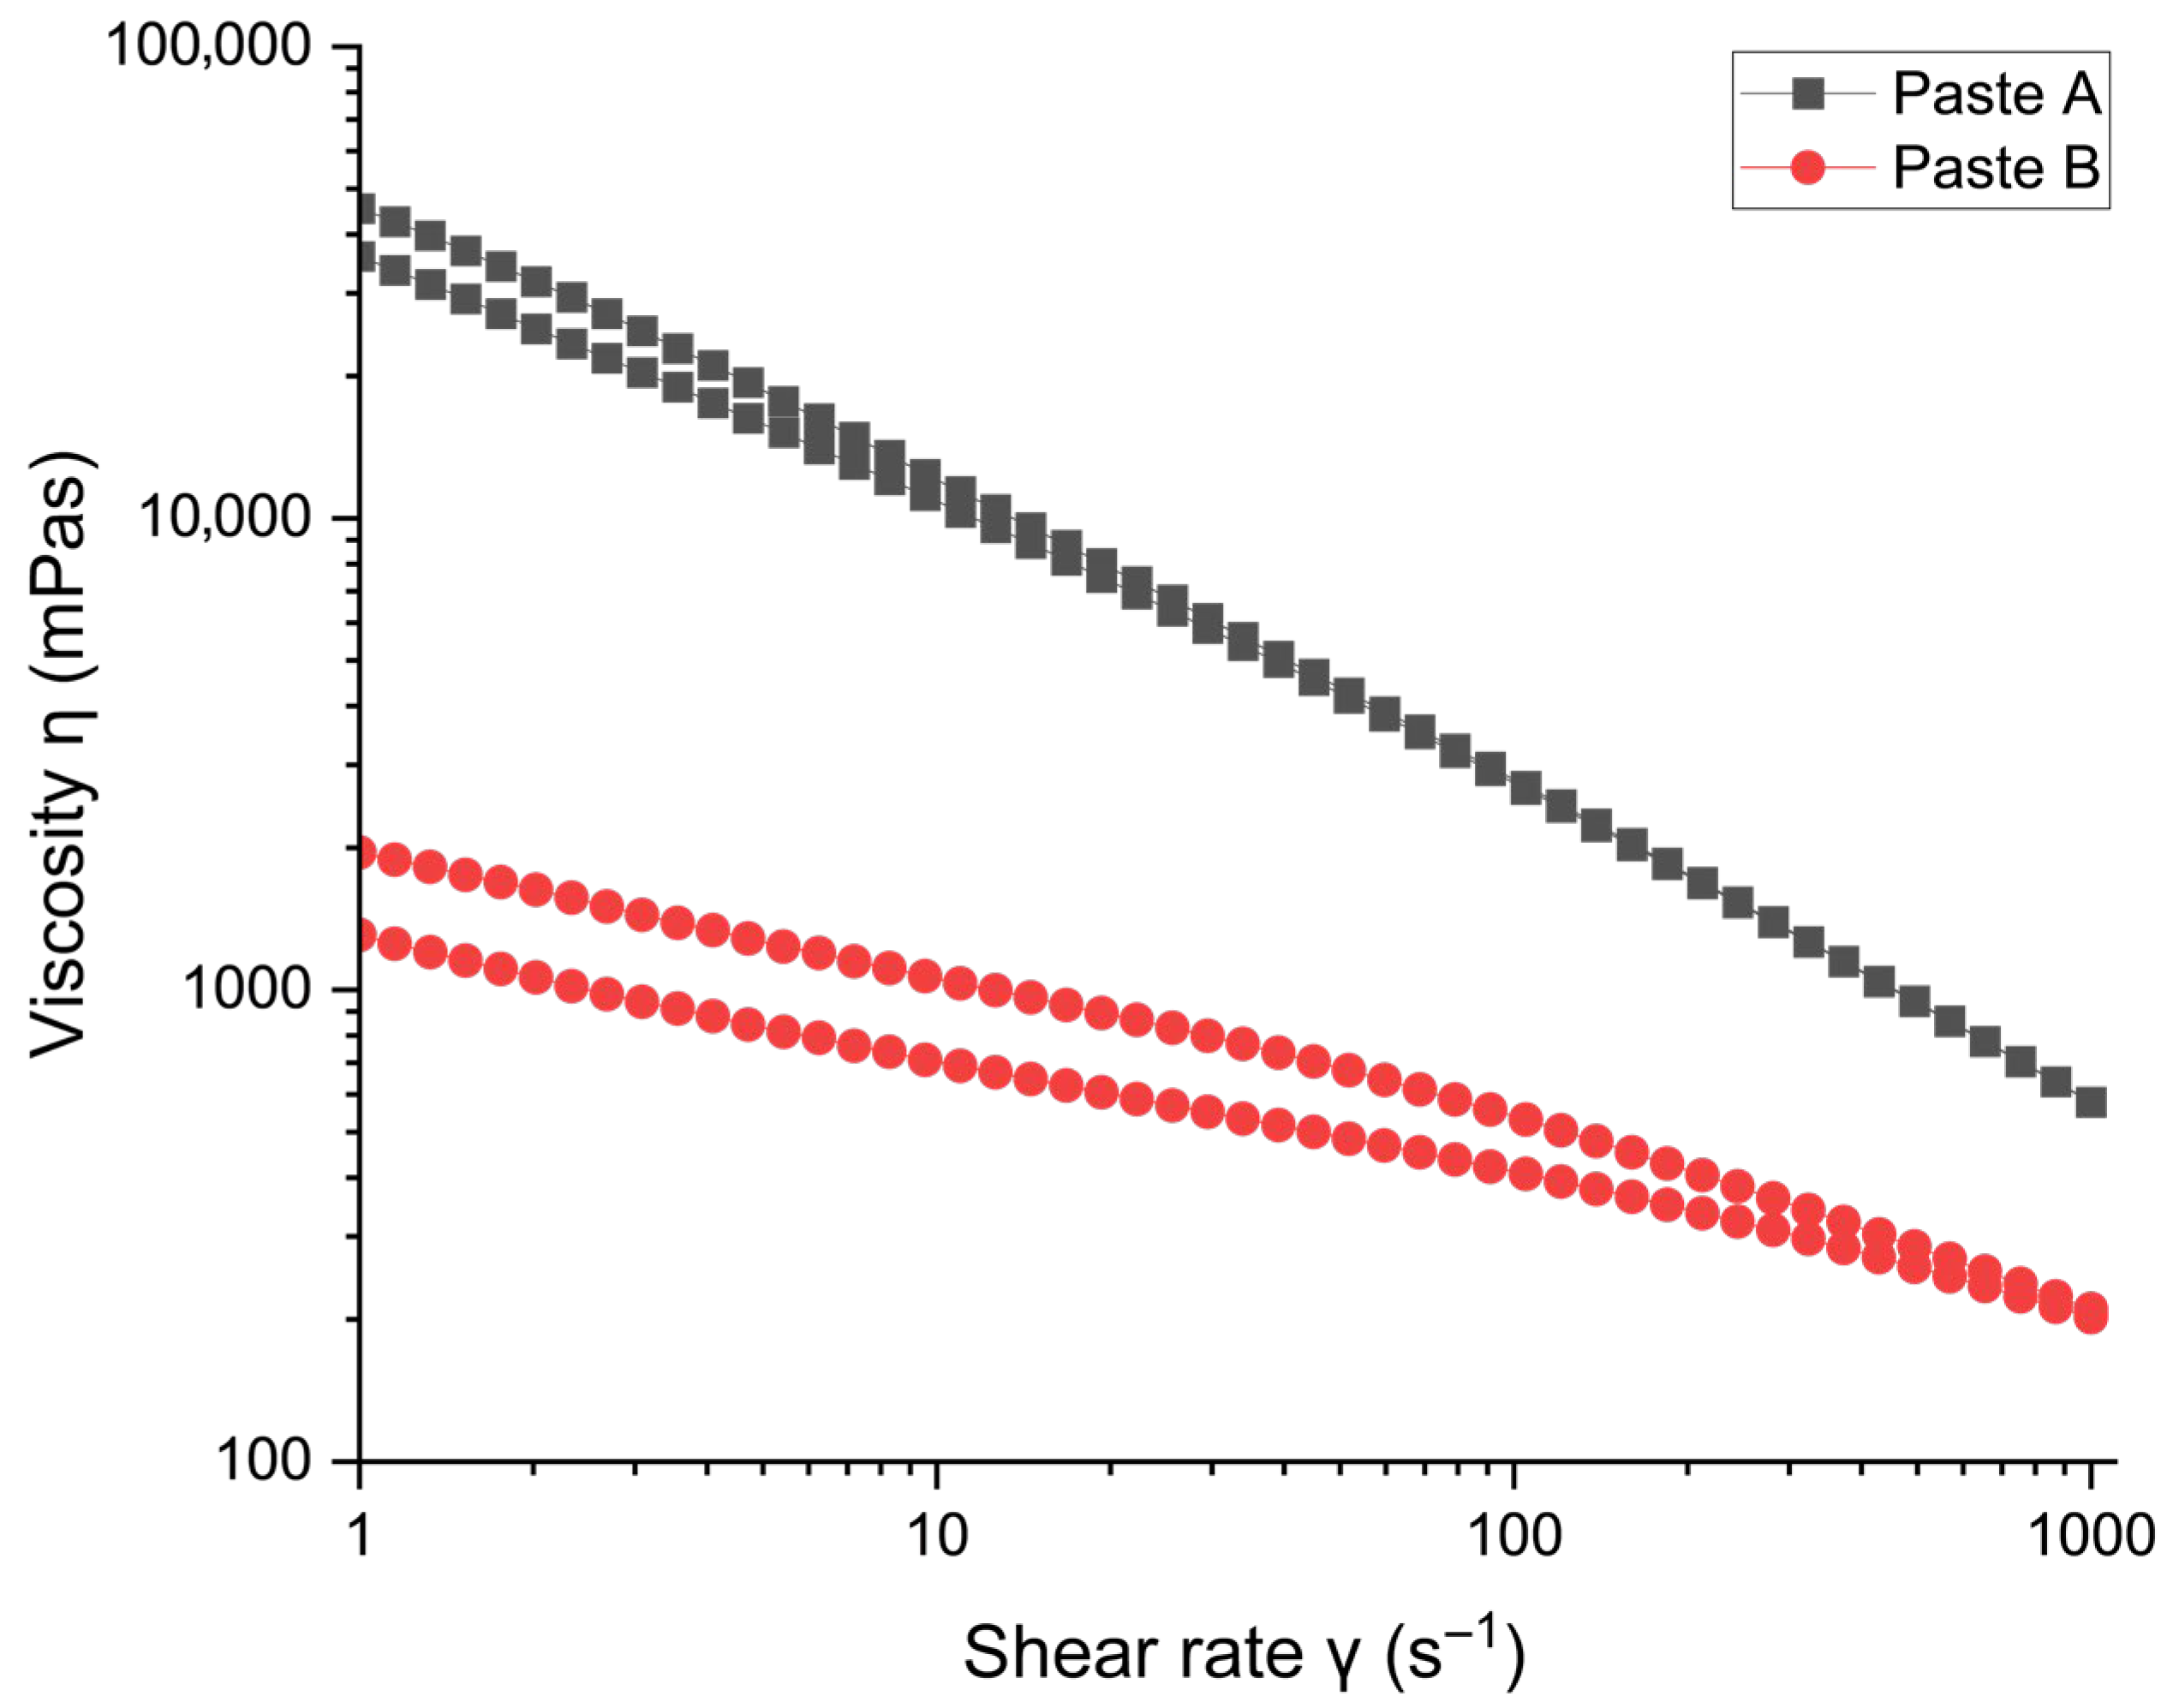
The rheological measurements of LFP pastes were performed using a cone-plate rheometer. Measurements conducted across shear rates from 1 s−1 to 1000 s−1 demonstrated a shear-thinning behavior, which is essential for the processing and application of the pastes. The investigation of the viscosity hysteresis loops (viscosity η over shear rate γ for both up- and down-sweep) reveals significant differences among the two prepared pastes (Figure 6). The measured viscosity curves exhibit typical shear-thinning profiles for battery pastes, where viscosity decreases with increasing shear rate [36].
Paste A, which was produced using a dissolver, exhibits significantly higher viscosity across the entire shear rate range compared to Paste B, which was produced via wet jet milling. For example, at a shear rate of 1 s−1, Paste A had a viscosity of 45,793 mPas (up-sweep) and 35,880 mPas (down-sweep), while Paste B showed only 1943 mPas (up-sweep) and 1308 mPas (down-sweep). At 105 s−1, these values decreased to 2705 mPas (up-sweep) vs. 2665 mPas (down-sweep) for Paste A and 530 mPas (up-sweep) vs. 407 mPas (down-sweep) for Paste B. At the highest tested shear rate of 1000 s−1, Paste A exhibited a viscosity of 579 mPas, whereas Paste B reached 211 mPas.
This corresponds to a viscosity reduction of 96% at 1 s−1, 80% at 105 s−1, and 64% at 1000 s−1 when comparing wet jet milling to dissolver mixing, based on up-sweep data. Including the down-sweep data, a hysteresis loop is observed for both pastes, indicating thixotropic behavior. Notably, the differences in viscosity between up-sweep and down-sweep at low shear rates are pronounced: 1 s−1, Δη = 9913 mPas (22%) for Paste A and Δη = 635 mPas (33%) for Paste B. This indicates that Paste B exhibits slower recovery after shearing compared to Paste A. The higher Δη for Paste B reflects a more pronounced thixotropic behavior. At 105 s−1, these differences decrease to Δη = 40 mPas (2%) for Paste A and Δη = 123 mPas (23%) for Paste B.
These differences correlate with the measured particle size distributions: Paste B shows a shift toward smaller particles, which enhances flowability. Thus, it can be concluded that the wet jet milling dispersing method using the Star Burst Mini effectively results in well dispersed and smaller particles, leading to lower viscosity. The hysteresis loops further reveal that wet jet milling changes the thixotropic and viscoelastic behavior of the pastes beyond simple viscosity reduction. Paste B exhibits a larger Δη, indicating slower structural recovery after application of shear and more pronounced thixotropy. These changes in flow behavior are critical for doctor blade and slot-die coating processes, as they influence not only flowability but also layer uniformity and surface quality.
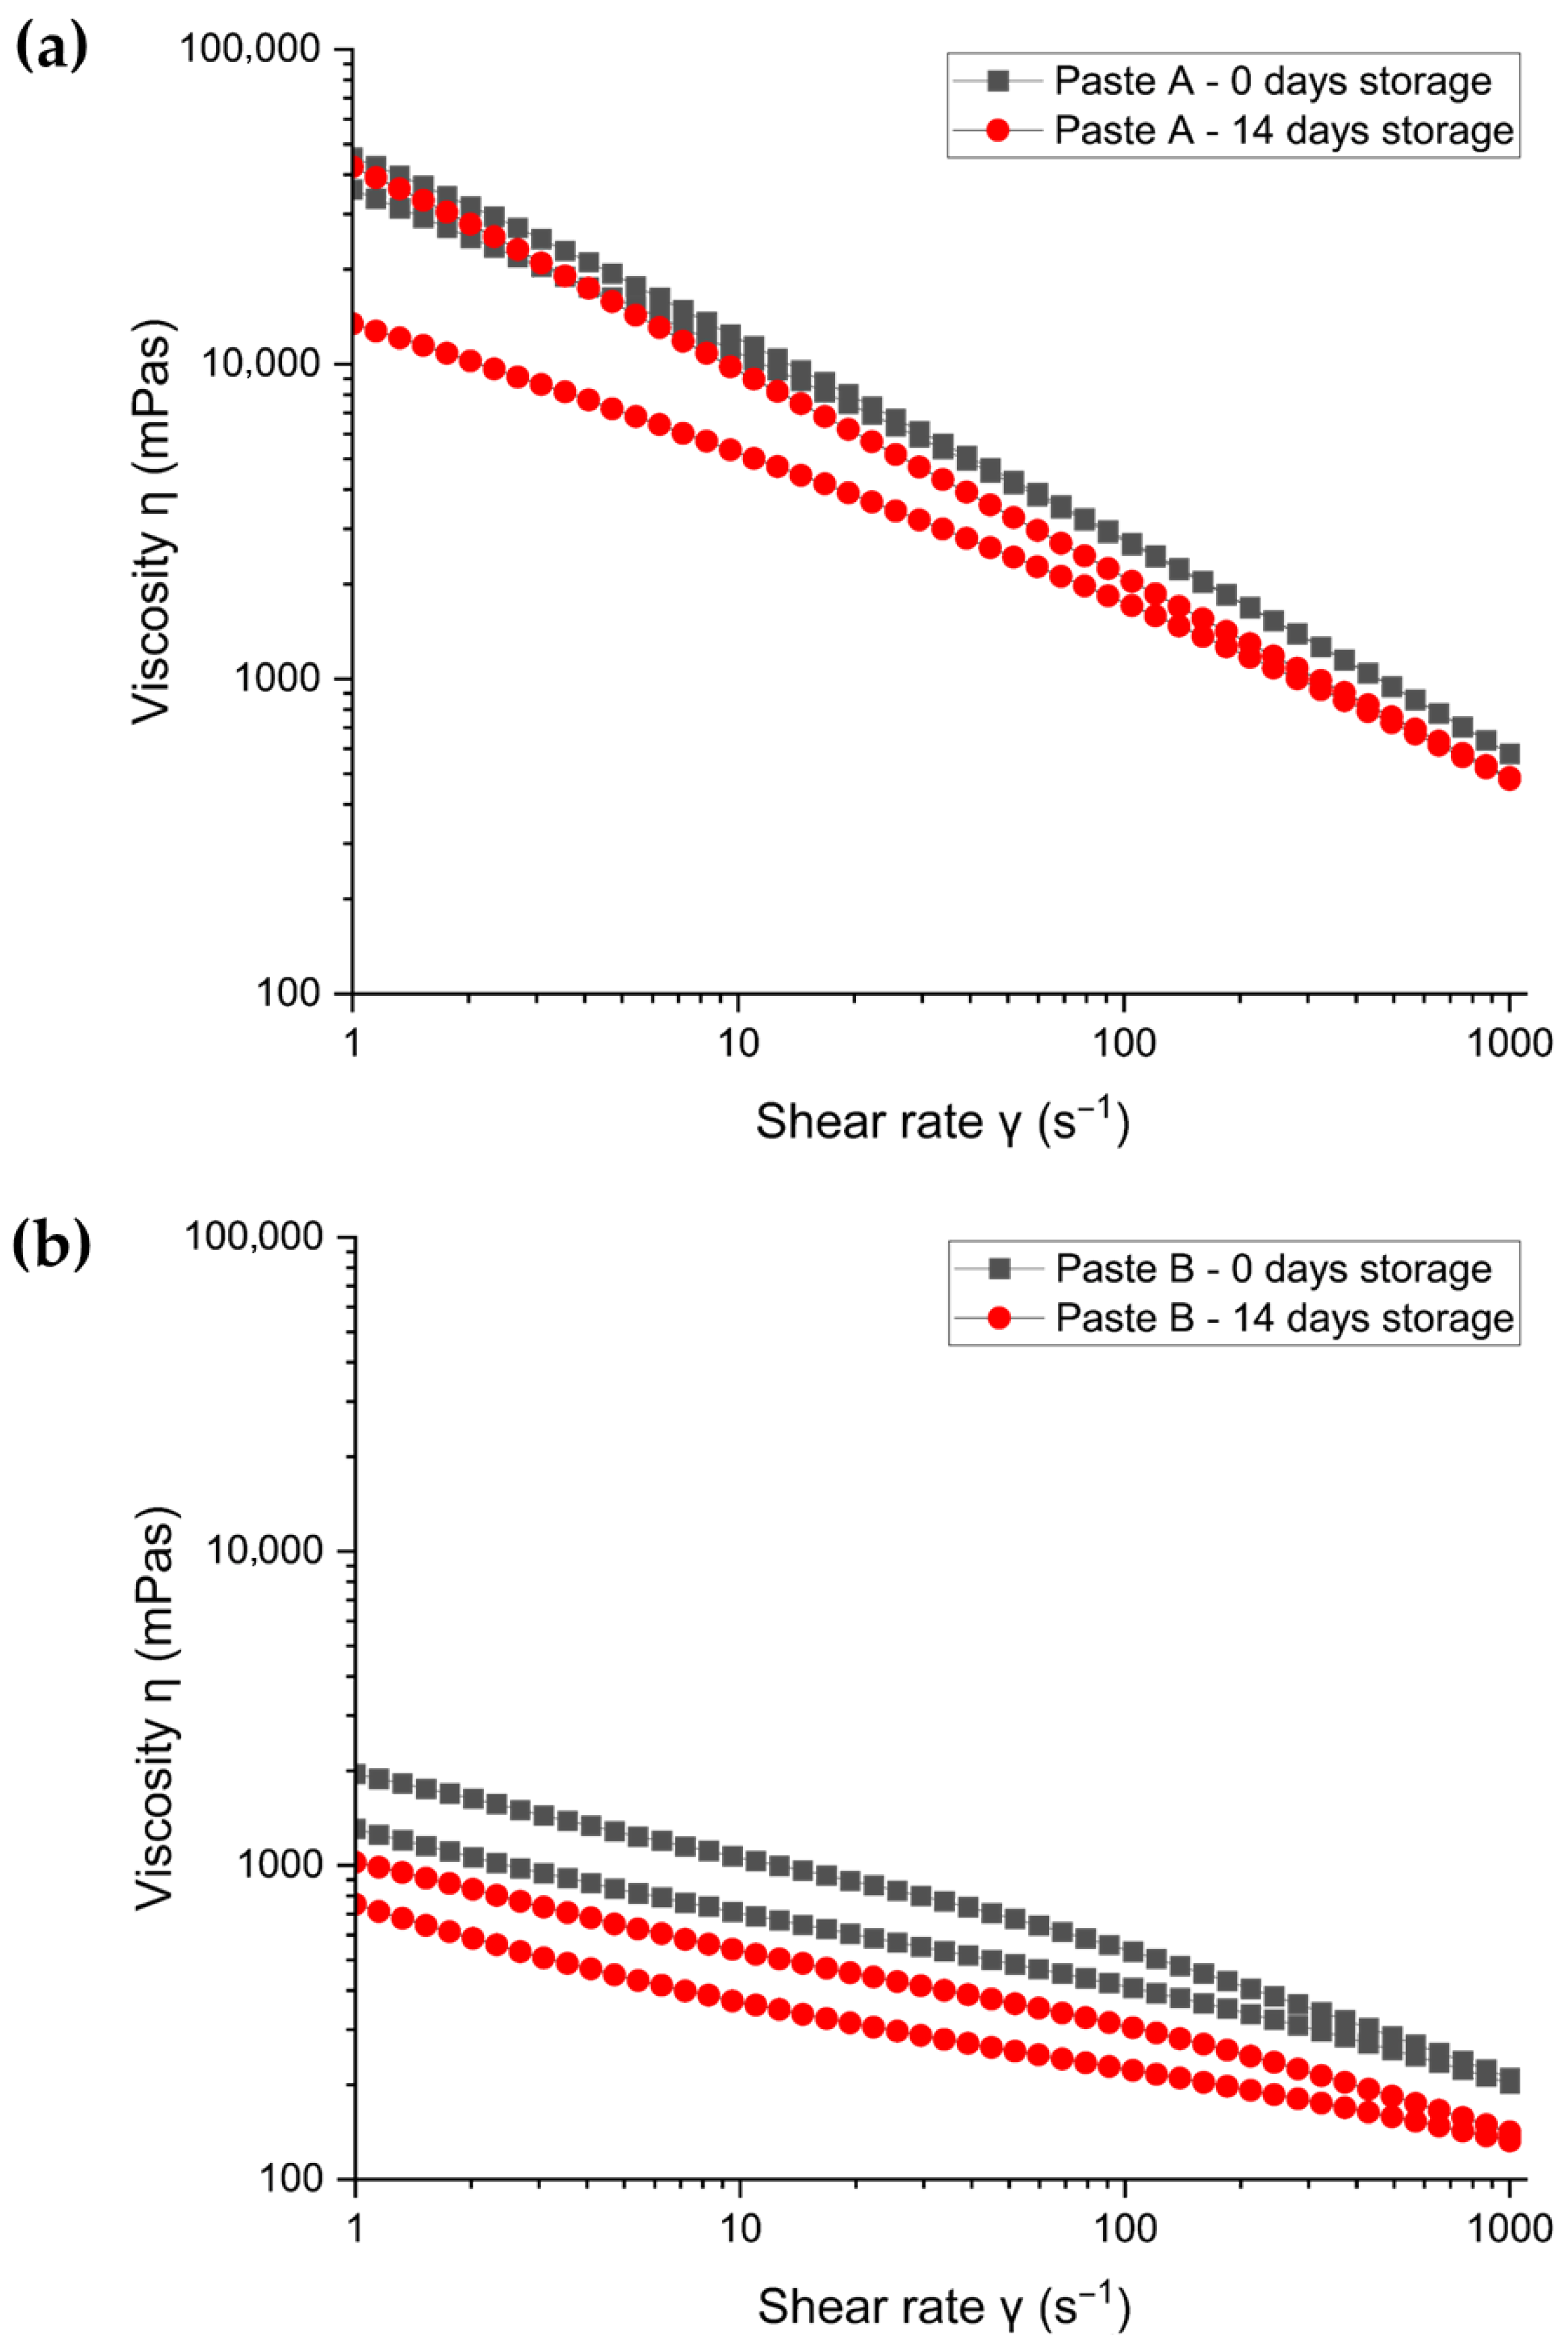
After 14 days of storage, the pastes were redispersed and the viscosity was measured, including both up- and down-sweep cycles to evaluate hysteresis behavior (Figure 7). For Paste A (Figure 7a), viscosity decreased slightly from 45,793 mPas to 42,253 mPas (up-sweep) at a shear rate of 1 s−1 (3% reduction), and from 35,880 mPas to 13,440 mPas (down-sweep) (63% reduction), indicating a pronounced change in hysteresis behavior after storage. At 105 s−1, viscosity decreased from 2705 mPas to 2043 mPas (up-sweep) (25% reduction) and from 2665 mPas to 1708 mPas (down-sweep) (36% reduction). At 1000 s−1, viscosity decreased from 578 mPas to 481 mPas (16% reduction). In contrast, Paste B (Figure 7b) showed a more significant viscosity decrease: from 1943 mPas to 1008 mPas (up-sweep) at 1 s−1 (48% reduction) and from 1308 mPas to 753 mPas (down-sweep) (43% reduction). At 105 s−1, viscosity decreased from 530 mPas to 304 mPas (up-sweep) (43% reduction) and from 407 mPas to 222 mPas (down-sweep) (45% reduction). At 1000 s−1, viscosity decreased from 211 mPas to 142 mPas at 1000 s−1 (33% reduction).
The hysteresis analysis further highlights the different effects of storage stability on both pastes. For Paste A, the hysteresis difference at 1 s−1 increased markedly from Δη = 9913 mPas (22%) to Δη = 30,813 mPas (~70% after storage), indicating a significantly enhanced thixotropic behavior after 14 days. At 105 s−1, Δη increased from 40 mPas (2%) to 335 mPas (16%). These results suggest that storage strongly affects the structure recovery of Paste A, leading to slower rebuilding of its internal structure after shear. For Paste B, hysteresis differences changed less markedly after storage: at 1 s−1, Δη decreased from 635mPas (33%) to 256 mPas (25%), and at 105 s−1 from 123 mPas (23%) to 82 mPas (27%). This indicates only a slight change in the structural recovery of Paste B before and after storage.
Despite these viscosity changes, particle size distributions remained stable for both pastes, indicating that the viscosity loss in Paste B is not due to agglomeration but is likely related to different particle surface wetting kinetics. The smaller particles in Paste B have an increased surface area compared to the particles of Paste A, which automatically lead to longer wetting times in the wetting process and, as a result, delayed structural recovery.

3.2. Electrode Coating Characteristics

Following slurry preparation, the next critical step in electrode manufacturing is the coating process, where the slurry is applied to the current collector and subsequently calendered. The quality and uniformity of the electrode coating plays a vital role in determining the electrode’s structural integrity, electronic conductivity, and overall electrochemical performance. Variations in slurry dispersion can significantly influence how the material distributes, adheres, and compacts during calendering. This section evaluates how different dispersing methods affect the thickness and the morphology of the LFP electrode coatings, based on layer thickness and SEM measurements.

3.2.1. Electrode Layer Thickness

The layer thickness of the different electrodes was determined before and after calendering. The calender gap width was adjusted to 80 µm to achieve approximately 30% compaction of each electrode coating layer by the end of the process. The measured total electrode thicknesses and electrode layer thickness before and after calendering as well as the thickness compaction are presented in Table 3 for Paste A and in Table 4 for Paste B. It should be noted that the measured total electrode thickness values include the 20 µm aluminum current collector. To obtain the actual electrode coating layer thickness, 20 µm were subtracted from each measurement.
The coating thickness along the length of the electrode exhibits variability due to manual application and the associated run-in and run-out effects. As seen in Table 3 and Table 4, the uncalendared coating thickness of the achieved electrodes is comparable for both pastes, with 88.5 ± 2.5 µm for Paste A and 87.8 ± 5.0 µm for Paste B.

3.2.2. SEM Analysis

SEM analysis was conducted to examine the morphological characteristics of the calendered LFP cathodes. Cross-sectional SEM images are presented in Figure 8, with Paste A shown in Figure 8a and Paste B in Figure 8b at 1000× magnification; Figure 8c,d display the same pastes at 2000× magnification. Figure 8b,d show that the cross-section of the LFP cathode obtained from the wet jet milling dispersion (Paste B) is more homogenous and densely packed compared to the sample prepared using the dissolver (Paste A). Paste B shows a more continuous and compact interface with the aluminum substrate.

3.3. Electrochemical Performance

This section presents the electrochemical performance characterization of three fabricated half-cells for each of both investigated pastes. The evaluation includes C-Rate testing, which is critical for assessing the electrochemical behavior and efficiency of LFP electrodes in battery applications.
Table 5 presents the mass loading of the active material (mg cm−2) and the areal capacity (mAh cm−2) for the three cells of Paste A and Paste B.
The areal capacity was calculated by multiplying the mass loading of the LFP active material by the theoretical capacity of 150 mAh g−1.

C-Rate Tests

The electrochemical characterization began with the formation phase, consisting of three charge/discharge cycles at a C-Rate of 0.1 C within a voltage range of 2.8 V vs. Li/Li+ to 3.6 V vs. Li/Li+. This initial cycling process facilitates the development of the solid electrolyte interface (SEI) on the electrode surface. Table 6 shows the discharge capacities at different C-Rates for the three cells of Paste A and Paste B. For each cell, the mean value from three cycles including standard deviation is provided. To enhance the comparability of the results of cells produced from Paste A and Paste B, the mean values including standard deviation of the three cells are calculated.
Table 7 presents the initial Coulombic efficiency of three cells each of Paste A and Paste B at 0.1 C, along with the mean values and standard deviations of the respective three cells.
For the first cycle, an initial Coulombic efficiency of 98.31 ± 3.31% for Paste A and 99.07 ± 1.29% for Paste B was observed. In the following cycle, the Coulombic efficiency was 101.17 ± 1.33% for Paste A and 101.09 ± 0.26% for Paste B, respectively. The third cycle showed the following results: 96.71 ± 3.36% for Paste A and 100.34 ± 0.25% for Paste B. Thus, overall, the Coulombic efficiencies for Paste B are both higher and more consistent compared to Paste A. In general, higher initial Coulombic efficiencies are advantageous, and thus the dispersing method of wet jet milling applied for preparing Paste B appears to be more beneficial in terms of Coulombic efficiencies compared to the dissolver mixing technique used for Paste A. The results of initial Coulombic efficiencies above 100% are attributed to residual capacities from previous cycles and are negligible.
During the formation process for the charging and discharging process at 0.1 C, as illustrated in Figure 9, a stable performance of specific capacity was observed. No significant capacity loss occurred during this formation process, indicating stable initial performance of the active material. Following the formation phase, C-Rate testing was conducted to evaluate the performance of the half-cells at varying C-Rates of 0.33 C, 0.5 C, 1.0 C, and 3.0 C. At the end of the procedure, the 0.1 C test was repeated to verify the ability of the active material to recall the initial discharge capacities after very fast C-Rate cycling at 3.0 C. It is evident that the active material is still able to achieve similar discharge capacities as in the initial 0.1 C cycles. Figure 9 presents the C-Rate testing results for cells equipped with electrodes made from Pastes A and Paste B.
The findings indicate that electrodes formulated with Paste B demonstrate superior performance at 1.0 C compared to electrodes containing Paste A, in terms of operating voltage window and capacity retention. However, some cells utilizing Paste A struggled to maintain a capacity of 73.1 ± 12.3 mAh g−1 at 1.0 C, while still retaining an initial capacity of ca. 111.4 ± 7.9 mAh g−1 at 0.1 C by the end of the test. It is assumed that the superior performance of Paste B at 1.0 C is due to its dispersing method (wet jet milling), which produces smaller particles and consequently a higher total surface area, resulting in higher capacity and shorter electrochemical reaction times. Considering the results for C-Rates of 0.1 C, 0.33 C, 0.5 C and 3.0 C for both formulations, it can be concluded that the discharge capacities result in very similar outcomes, except for performance at 1.0 C. For example, discharge capacities of 99.4 ± 6.2 mAh g−1 for Paste A and 102.5 ± 3.8 mAh g−1 for Paste B were obtained at 0.33 C. At 0.5 C, Paste A and Paste B exhibited capacities of 92.5 ± 6.6 mAh g−1 and 96.5 ± 3.8 mAh g−1, respectively. Both formulations demonstrate inadequate performance in terms of fast charging and discharging at a rate of 3.0 C, resulting in a negligible discharge capacity (1.5 ± 0.2 mAh g−1 for Paste A; 1.7 ± 0.2 mAh g−1 for Paste B) for both electrode types. Nevertheless, upon returning to 0.1 C, the electrodes recovered a sufficient discharge capacity of 111.4 ± 7.9 mAh g−1 for Paste A and 117.7 ± 6.1 mAh g−1 for Paste B. The slightly higher discharge capacities observed after returning to 0.1 C following the 3.0 C cycles are presumably due to residual capacity that was not retrieved because of slow kinetics at 3.0 C.

4. Discussion

Section 3.1.2. presented detailed results of rheological measurements, revealing significant differences in viscosities between the formulations of Paste A and Paste B. Paste A exhibited a viscosity of 2705 mPas, which was considerably higher than that of Paste B at 530 mPas at 105 s−1. These findings are consistent with previous studies showing that lower-viscosity pastes enable the preparation of pastes with higher solids content, which in turn reduces the required solvent content and enhances production efficiency. Such higher solids contents, as achieved with Paste B, are particularly advantageous for electrode manufacturing, since they not only allow higher active material loadings but also lower drying energy demand and shorten production times [37,38,39]. In the following, these effects are quantified by comparing the dispersing and drying energy requirements of both formulations.
Based on the solids and solvent contents of Paste A (37.1 wt% solids, 62.9 wt% water) and Paste B (41.1 wt% solids, 58.9 wt% water), the drying energy (Edrying) required to evaporate the solvent was estimated using the formula:
Edrying = msolvent × Lvaporization
where msolvent is the mass fraction of water in the paste (kg per kg of paste) and Lvaporization is the latent heat of water (2.26 MJ kg−1 = 0.63 kWh kg−1). Using this approach, the estimated drying energy is 0.40 kWh kg−1 paste for Paste A and 0.37 kWh kg−1 paste for Paste B, corresponding to a modest reduction of 0.03 kWh kg−1 or 7.5%. While this energy saving is relatively small at the laboratory scale, it demonstrates the expected trend that higher-solids-content pastes reduce solvent evaporation requirements.
In addition to drying energy, the energy consumption of the dispersing processes was estimated for both pastes. For Paste A, dispersing with the dissolver at 6000 rpm (1.30 kWh kg−1) for a total of 60 min required 0.92 kWh per batch (703.6 g), corresponding to 1.30 kWh kg−1 paste. For Paste B, two passes (10 min in total) with the high-pressure wet jet milling step (2.2 kW) consumed 0.37 kWh per batch (700 g processed). Since only 475 g of the aqueous 50 wt% LFP dispersion was used for further processing, the energy contribution for the wet jet milling is 0.25 kWh. The wet jet milled dispersion was then combined with the remaining formulation components—water, carbon black, and CMC—for dissolver mixing. Dissolver mixing at 400 rpm (0.88 kWh kg−1) for 15 min consumed 0.14 kWh per batch (635.1 g). Thus, the total dispersing energy (wet jet mill and dissolver) per batch for Paste B is 0.39 kWh, corresponding to 0.61 kWh kg−1 paste. Despite the higher instantaneous power demand of wet jet milling, Paste B shows a significantly lower overall dispersing energy per kilogram of paste, primarily due to shorter mixing times and higher solids content.
Combining both dispersing and drying energy, Paste B requires a total energy of 0.98 kWh kg−1 compared to 1.70 kWh kg−1 for Paste A, corresponding to a net energy saving of 0.72 kWh kg−1 or 42.4%. Such a substantial energy saving at the laboratory scale indicates that the benefits of Paste B could be even greater in industrial-scale production. The markedly lower total energy requirement for Paste B is complemented by the fact that its combined dispersing steps—wet jet milling and dissolver mixing—require considerably less time than the dissolver mixing used for Paste A, further improving productivity. These findings demonstrate that higher-solids-content pastes processed by wet jet milling offer benefits in both energy efficiency and process performance. This underscores their potential advantage for sustainable electrode manufacturing, although further scale-up studies are needed to confirm these findings for industrial electrode production.
The electrochemical results in Section 3.3. demonstrate similar discharge capacities for both formulations (Paste A and Paste B), with discharge capacities for the investigated C-Rates of 0.1 C, 0.33 C, 0.5 C, and 3.0 C falling within the margin of error. However, at 1.0 C, the capacity of Paste B was slightly higher at 83.8 ± 3.0 mAh g−1 compared to 73.1 ± 12.3 mAh g−1 for Paste A. While this represents a difference of only 10.7 mAh g−1 (~12.8% relative to Paste B), it is assumed that the dispersing method for Paste B leads to smaller particles and, consequently, a higher active surface area. This leads to higher capacity and shorter electrochemical reaction times, particularly under the more demanding conditions at 1.0 C. Although the electrochemical reactions are improved, this effect appears to be compensated for by the limited permeation of lithium ions into the layers at higher C-Rates. This effect, along with the behavior of the full cells during long-term cycling, should be investigated in more detail in future studies.

Author Contributions

Conceptualization, L.J., M.E. and D.N.; methodology, L.J., H.L., P.R., O.F., M.E. and D.N.; investigation, L.J., H.L., P.R. and O.F.; data curation, L.J., H.L., P.R. and O.F.; writing—original draft preparation, L.J., H.L. and P.R.; writing—review and editing, L.J., H.L., O.F., M.E. and D.N.; visualization, L.J., H.L., P.R. and O.F.; supervision, M.E. and D.N. All authors have read and agreed to the published version of the manuscript.

Funding

This research received no external funding.

Institutional Review Board Statement

Not applicable.

Informed Consent Statement

Not applicable.

Data Availability Statement

The original contributions presented in this study are included in the article material. Further inquiries can be directed to the corresponding authors.

Acknowledgments

The authors would like to thank Naoki Sawamura of Sugino Machine Limited for providing access to the wet jet milling machine Star Burst Mini and for their technical support in the preparation of LFP slurries.

Conflicts of Interest

The authors declare no conflicts of interest.

Abbreviations

The following abbreviations are used in this manuscript:
CMCCarboxymethyl cellulose
LCOLithium cobalt oxide
LFPLithium iron phosphate
LIBsLithium-ion batteries
NMCNickel manganese cobalt oxide
NMPN-methyl-2-pyrrolidone
PVDFPolyvinylidene fluoride
SBRStyrene butadiene rubber
SDStandard deviation
SEISolid electrolyte interface
SEMScanning electron microscopy

References

  1. Ahmed, D.; Maraz, K.M. Revolutionizing energy storage: Overcoming challenges and unleashing the potential of next generation Lithium-ion battery technology. Mater. Eng. Res. 2023, 5, 265–278. [Google Scholar] [CrossRef]
  2. de la Torre-Gamarra, C.; Sotomayor, M.E.; Sanchez, J.-Y.; Levenfeld, B.; Várez, A.; Laïk, B.; Pereira-Ramos, J.-P. High mass loading additive-free LiFePO4 cathodes with 500 μm thickness for high areal capacity Li-ion batteries. J. Power Sources 2020, 458, 228033. [Google Scholar] [CrossRef]
  3. Khan, F.M.N.U.; Rasul, M.G.; Sayem, A.S.M.; Mandal, N.K. Design and optimization of lithium-ion battery as an efficient energy storage device for electric vehicles: A comprehensive review. J. Energy Storage 2023, 71, 108033. [Google Scholar] [CrossRef]
  4. Jeon, J.-W.; Biswas, M.C.; Patton, C.L.; Wujcik, E.K. Water-processable, sprayable LiFePO4/graphene hybrid cathodes for high-power lithium ion batteries. J. Ind. Eng. Chem. 2020, 84, 72–81. [Google Scholar] [CrossRef]
  5. Liu, W.; Placke, T.; Chau, K.T. Overview of batteries and battery management for electric vehicles. Energy Rep. 2022, 8, 4058–4084. [Google Scholar] [CrossRef]
  6. Gao, Y.; Pan, Z.; Sun, J.; Liu, Z.; Wang, J. High-Energy Batteries: Beyond Lithium-Ion and Their Long Road to Commercialisation. Nano-Micro Lett. 2022, 14, 94. [Google Scholar] [CrossRef]
  7. Masias, A.; Marcicki, J.; Paxton, W.A. Opportunities and Challenges of Lithium Ion Batteries in Automotive Applications. ACS Energy Lett. 2021, 6, 621–630. [Google Scholar] [CrossRef]
  8. Suttison, S.; Pengpat, K.; Intatha, U.; Fan, J.; Zhang, W.; Eitssayeam, S. Preparation of LFP-based cathode materials for lithium-ion battery applications. Mater. Today Proc. 2022, 65, 2347–2350. [Google Scholar] [CrossRef]
  9. Wulandari, T.; Fawcett, D.; Majumder, S.B.; Poinern, G.E.J. Lithium-based batteries, history, current status, challenges, and future perspectives. Battery Energy 2023, 2, 20230030. [Google Scholar] [CrossRef]
  10. Chen, T.; Li, M.; Bae, J. Recent Advances in Lithium Iron Phosphate Battery Technology: A Comprehensive Review. Batteries 2024, 10, 424. [Google Scholar] [CrossRef]
  11. Boozula, A.R.; Bagheri, K.; Lampuse, R.G.; Shah, S.; Thakkar, J.J. Review of thermal runaway risks in Na-ion and Li-ion batteries: Safety improvement suggestions for Na-ion batteries. J. Eng. Appl. Sci. 2025, 72, 106. [Google Scholar] [CrossRef]
  12. Weng, J.; Peng, L. Improving the electrochemical performance of LiFePO4 cathode with novel water-soluble binders. Mater. Chem. Phys. 2022, 290, 126530. [Google Scholar] [CrossRef]
  13. Zhao, T.; Mahandra, H.; Marthi, R.; Ji, X.; Zhao, W.; Chae, S.; Traversy, M.; Li, W.; Yu, F.; Li, L.; et al. An overview on the life cycle of lithium iron phosphate: Synthesis, modification, application, and recycling. Chem. Eng. J. 2024, 485, 149923. [Google Scholar] [CrossRef]
  14. El Moutchou, S.; Aziam, H.; Mansori, M.; Saadoune, I. Thermal stability of Lithium-ion batteries: Case study of NMC811 and LFP cathode materials. Mater. Today Proc. 2022, 51, A1–A7. [Google Scholar] [CrossRef]
  15. Bitsch, B.; Dittmann, J.; Schmitt, M.; Scharfer, P.; Schabel, W.; Willenbacher, N. A novel slurry concept for the fabrication of lithium-ion battery electrodes with beneficial properties. J. Power Sources 2014, 265, 81–90. [Google Scholar] [CrossRef]
  16. Hawley, W.B.; Li, J. Electrode manufacturing for lithium-ion batteries—Analysis of current and next generation processing. J. Energy Storage 2019, 25, 100862. [Google Scholar] [CrossRef]
  17. Jalowy, L.; Nemec, D.; Ilhan, O. Comparison of Dispersing Processes of Bio-Based and Synthetic Materials: A Review. ChemEngineering 2025, 9, 36. [Google Scholar] [CrossRef]
  18. Zhang, W.; He, X.; Pu, W.; Li, J.; Wan, C. Effect of slurry preparation and dispersion on electrochemical performances of LiFePO4 composite electrode. Ionics 2011, 17, 473–477. [Google Scholar] [CrossRef]
  19. Kim, Y.; Nam, S.; Jeon, Y.; Jung, J.; Han, D.-Y.; Park, S. Improving silicon anode durability through uniform dispersion and binding enhancement with polyacrylamide-grafted carbon nanotubes. Energy Mater. 2025, 5, 500071. [Google Scholar] [CrossRef]
  20. Komoda, Y.; Ishibashi, K.; Kuratani, K.; Suzuki, K.; Ohmura, N.; Kobayashi, H. Effects of drying rate and slurry microstructure on the formation process of LiB cathode and electrochemical properties. J. Power Sources 2023, 568, 232983. [Google Scholar] [CrossRef]
  21. Baboo, J.P.; Yatoo, M.A.; Dent, M.; Hojaji Najafabadi, E.; Lekakou, C.; Slade, R.; Hinder, S.J.; Watts, J.F. Exploring Different Binders for a LiFePO4 Battery, Battery Testing, Modeling and Simulations. Energies 2022, 15, 2332. [Google Scholar] [CrossRef]
  22. Bresser, D.; Buchholz, D.; Moretti, A.; Varzi, A.; Passerini, S. Alternative binders for sustainable electrochemical energy storage—The transition to aqueous electrode processing and bio-derived polymers. Energy Environ. Sci. 2018, 11, 3096–3127. [Google Scholar] [CrossRef]
  23. Cuesta, N.; Ramos, A.; Cameán, I.; Antuña, C.; García, A.B. Hydrocolloids as binders for graphite anodes of lithium-ion batteries. Electrochim. Acta 2015, 155, 140–147. [Google Scholar] [CrossRef]
  24. Kuenzel, M.; Choi, H.; Wu, F.; Kazzazi, A.; Axmann, P.; Wohlfahrt-Mehrens, M.; Bresser, D.; Passerini, S. Co-Crosslinked Water-Soluble Biopolymers as a Binder for High-Voltage LiNi0.5Mn1.5O4|Graphite Lithium-Ion Full Cells. ChemSusChem 2020, 13, 2650–2660. [Google Scholar] [CrossRef]
  25. Liu, M.; Ye, C.; Peng, L.; Weng, J. Influence of Binder on Impedance of Lithium Batteries: A Mini-review. J. Electr. Eng. Technol. 2022, 17, 1281–1291. [Google Scholar] [CrossRef]
  26. Li, C.-C.; Lin, Y.-S. Interactions between organic additives and active powders in water-based lithium iron phosphate electrode slurries. J. Power Sources 2012, 220, 413–421. [Google Scholar] [CrossRef]
  27. Tsai, F.-Y.; Jhang, J.-H.; Hsieh, H.-W.; Li, C.-C. Dispersion, agglomeration, and gelation of LiFePO4 in water-based slurry. J. Power Sources 2016, 310, 47–53. [Google Scholar] [CrossRef]
  28. Chang, H.J.; Rodríguez-Pérez, I.A.; Fayette, M.; Canfield, N.L.; Pan, H.; Choi, D.; Li, X.; Reed, D. Effects of water-based binders on electrochemical performance of manganese dioxide cathode in mild aqueous zinc batteries. Carbon Energy 2021, 3, 473–481. [Google Scholar] [CrossRef]
  29. Zhang, X.; Ge, X.; Shen, Z.; Ma, H.; Wang, J.; Wang, S.; Liu, L.; Liu, B.; Liu, L.; Zhao, Y. Green water-based binders for LiFePO4/C cathodes in Li-ion batteries: A comparative study. New J. Chem. 2021, 45, 9846–9855. [Google Scholar] [CrossRef]
  30. Gordon, R.; Kassar, M.; Willenbacher, N. Effect of Polymeric Binders on Dispersion of Active Particles in Aqueous LiFePO4-Based Cathode Slurries as well as on Mechanical and Electrical Properties of Corresponding Dry Layers. ACS Omega 2020, 5, 11455–11465. [Google Scholar] [CrossRef]
  31. Park, J.H.; Kim, S.H.; Ahn, K.H. Role of carboxymethyl cellulose binder and its effect on the preparation process of anode slurries for Li-ion batteries. Colloids Surf. A Physicochem. Eng. Asp. 2023, 664, 131130. [Google Scholar] [CrossRef]
  32. Yoon, J.; Lee, J.; Kim, H.; Kim, J.; Jin, H.-J. Polymeric Binder Design for Sustainable Lithium-Ion Battery Chemistry. Polymers 2024, 16, 254. [Google Scholar] [CrossRef] [PubMed]
  33. NETZSCH-Feinmahltechnik GmbH. MasterMix® Dissolver. Available online: https://grinding.netzsch.com/en/products-and-solutions/mixing-de-aerating/mastermix-dissolver (accessed on 4 August 2025).
  34. Sugino Machine Limited. Star Burst Wet Pulverizing and Dispersing. Available online: https://www.suginocorp.com/star-burst/ (accessed on 4 August 2025).
  35. Bauer, W.; Çetinel, F.A.; Müller, M.; Kaufmann, U. Effects of pH control by acid addition at the aqueous processing of cathodes for lithium ion batteries. Electrochim. Acta 2019, 317, 112–119. [Google Scholar] [CrossRef]
  36. Reynolds, C.D.; Hare, S.D.; Slater, P.R.; Simmons, M.J.H.; Kendrick, E. Rheology and Structure of Lithium-Ion Battery Electrode Slurries. Energy Technol. 2022, 10, 2200545. [Google Scholar] [CrossRef]
  37. Ibing, L.; Gallasch, T.; Schneider, P.; Niehoff, P.; Hintennach, A.; Winter, M.; Schappacher, F.M. Towards water based ultra-thick Li ion battery electrodes—A binder approach. J. Power Sources 2019, 423, 183–191. [Google Scholar] [CrossRef]
  38. Ouyang, L.; Wu, Z.; Wang, J.; Qi, X.; Li, Q.; Wang, J.; Lu, S. The effect of solid content on the rheological properties and microstructures of a Li-ion battery cathode slurry. RSC Adv. 2020, 10, 19360–19370. [Google Scholar] [CrossRef]
  39. Reynolds, C.D.; Walker, H.; Mahgoub, A.; Adebayo, E.; Kendrick, E. Battery electrode slurry rheology and its impact on manufacturing. Energy Adv. 2025, 4, 84–93. [Google Scholar] [CrossRef]
Figure 1. (a) Semi-automatic two-roll laboratory calender; (b) Electrode thickness measurement setup using a dial indicator; (c) Schematic of calendering procedure at predefined positions.
Appliedchem 05 00033 g001
Figure 2. (a) Electrode punching equipment EL-Cut 16; (b) Finished electrode with sharp edges.
Appliedchem 05 00033 g002
Figure 3. (a) Assembly of battery test cells (EL-Cell Std) in half-cell configuration in a glovebox; (b) EL-Cells connected to the battery cycler.
Appliedchem 05 00033 g003
Figure 4. Particle size distribution of Paste A and Paste B immediately after production.
Appliedchem 05 00033 g004
Figure 5. Comparison of particle size distribution immediately after production and after 14 days of storage at room temperature for: (a) Paste A; (b) Paste B.
Appliedchem 05 00033 g005
Figure 6. Viscosity hysteresis loops of Paste A and Paste B measured during up-sweep and down-sweep shear rates of 1 s−1 up to 1000 s−1.
Appliedchem 05 00033 g006
Figure 7. Comparison of viscosity hysteresis loops immediately after production and after 14 days of storage at room temperature for: (a) Paste A; (b) Paste B.
Appliedchem 05 00033 g007
Figure 8. SEM cross-sections of calendered LFP electrodes on aluminum substrates: (a) Paste A; (b) Paste B at 1000× magnification; (c) Paste A, (d) Paste B at 2000× magnification.
Appliedchem 05 00033 g008
Figure 9. Electrochemical characterization of LFP cathodes: Discharge capacity vs. cycle number at varying C-Rates for three cells each of Paste A and Paste B including error bars.
Appliedchem 05 00033 g009
Table 1. Composition of LFP Paste A produced using a dissolver.
Paste ASolids (g)wsolid (%) 1Total Weight (g)wtotal (%) 2
LFP237.591.0Solids261.137.1
Carbon black15.66.0
CMC8.03.0
Deionized water00Solvents442.562.9
Total261.1100.0 703.6100.0
1 Mass percentage of solid components. 2 Total mass percentage of solid and liquid components.
Table 2. Composition of LFP Paste B produced using a wet jet milling machine.
Paste BSolids (g)wsolid (%) 1Total Weight (g)wtotal (%) 2
LFP237.591.0Solids261.141.1
Carbon black15.66.0
CMC8.03.0
Deionized water00Solvents374.058.9
Total261.1100.0 635.1100.0
1 Mass percentage of solid components. 2 Total mass percentage of solid and liquid components.
Table 3. Measured total electrode thickness and electrode layer thickness of Paste A before and after calendering, including thickness compaction.
Paste A
Total Electrode ThicknessElectrode Layer Thickness
Measuring
Position
Uncalendared
(µm)
Calendered
(µm)
Compaction
(%)
Uncalendared
(µm)
Calendered
(µm)
Compaction
(%)
Start1128623.2926628.3
Middle left1088025.9886031.8
Middle right1098125.7896131.5
End1058023.8856029.4
Mean ± SD 1108.5 ± 2.981.8 ± 2.924.7 ± 1.488.5 ± 2.961.8 ± 2.930.2 ± 1.7
1 Mean value including standard deviation.
Table 4. Measured total electrode thickness and electrode layer thickness of Paste B before and after calendering, including thickness compaction.
Paste B
Total Electrode ThicknessElectrode Layer Thickness
Measuring
Position
Uncalendared
(µm)
Calendered
(µm)
Compaction
(%)
Uncalendared
(µm)
Calendered
(µm)
Compaction
(%)
Start1058023.8856029.4
Middle left1128623.2926628.3
Middle right1138227.4936233.3
End1017624.8815630.9
Mean ± SD 1107.8 ± 5.781.0 ± 4.224.8 ± 1.987.8 ± 5.761.0 ± 4.230.5 ± 2.2
1 Mean value including standard deviation.
Table 5. Mass loading of the active material and areal capacity of three cells each of Paste A and Paste B, including mean values and standard deviation.
CellMass Loading
(mg cm−2)
Areal Capacity
(mAh cm−2)
Paste ACell 19.051.36
Cell 29.141.37
Cell 38.501.28
Mean ± SD 18.90 ± 0.351.34 ± 0.05
Paste BCell 19.281.39
Cell 29.281.39
Cell 38.681.30
Mean ± SD 19.08 ± 0.351.36 ± 0.05
1 Mean value including standard deviation.
Table 6. Discharge capacities of three cells each of Paste A and Paste B at various C-Rates, including mean values and standard deviation.
Discharge Capacity (mAh g−1) at
0.1 C0.33 C0.5 C1.0 C3.0 C0.1 C
Paste ACell 1114.9 ± 2.699.3 ± 6.592.7 ± 7.273.0 ± 12.61.7 ± 0.2112.0 ± 8.0
Cell 2116.6 ± 0.799.7 ± 6.092.4 ± 6.872.6 ± 12.51.7 ± 0.2111.4 ± 7.7
Cell 3111.6 ± 5.199.2 ± 6.092.5 ± 5.873.6 ± 11.71.7 ± 0.2110.7 ± 8.0
Mean ± SD 1114.4 ± 2.899.4 ± 6.292.5 ± 6.673.1 ± 12.31.7 ± 0.2111.4 ± 7.9
Paste BCell 1112.5 ± 4.2102.9 ± 4.695.9 ± 3.384.5 ± 3.51.5 ± 0.3120.2 ± 4.8
Cell 2114.1 ± 4.1102.5 ± 3.496.6 ± 4.083.6 ± 2.61.5 ± 0.2117.0 ± 5.9
Cell 3114.6 ± 4.2102.0 ± 3.397.0 ± 4.183.2 ± 2.81.5 ± 0.1115.8 ± 7.4
Mean ± SD 1113.7 ± 4.2102.5 ± 3.896.5 ± 3.883.8 ± 3.01.5 ± 0.2117.7 ± 6.1
1 Mean value including standard deviation.
Table 7. Initial Coulombic efficiency at 0.1 C of three cells each of Paste A and Paste B, including mean values and standard deviation.
Initial Coulombic Efficiency (%) at 0.1 C
1st Cycle2nd Cycle3rd Cycle
Paste ACell 196.81102.3095.10
Cell 296.02101.52100.57
Cell 3102.1099.7094.46
Mean ± SD 198.31 ± 3.31101.17 ± 1.3396.71 ± 3.36
Paste BCell 197.76100.84100.06
Cell 299.12101.09100.48
Cell 3100.34101.35100.49
Mean ± SD 199.07 ± 1.29101.09 ± 0.26100.34 ± 0.25
1 Mean value including standard deviation.
Disclaimer/Publisher’s Note: The statements, opinions and data contained in all publications are solely those of the individual author(s) and contributor(s) and not of MDPI and/or the editor(s). MDPI and/or the editor(s) disclaim responsibility for any injury to people or property resulting from any ideas, methods, instructions or products referred to in the content.