Article

Hydrothermal Carbonization of Sugarcane Tip (Saccharum officinarum L.) for Pb (II) Removal: Synthesis, Characterization, and Adsorption Equilibrium

by
Dulce Carolina Acosta-Pintor
1,*,
Candy Carranza-Álvarez
2,
Habacuc Lorenzo-Márquez
1,
Cynthia Wong-Arguelles
1 and
Cuitláhuac Mojica-Mesinas
1
1
Posgrado Maestría en Ingeniería, Tecnológico Nacional de México, Instituto Tecnológico de Ciudad Valles, Ciudad Valles 79010, San Luis Potosí, Mexico
2
Laboratorio de Investigación en Ciencias Ambientales, Facultad de Estudios Profesionales Zona Huasteca, Universidad Autónoma de San Luis Potosí, Ciudad Valles 79060, San Luis Potosí, Mexico
*
Author to whom correspondence should be addressed.
AppliedChem 2025, 5(4), 24; https://doi.org/10.3390/appliedchem5040024
Submission received: 7 June 2025 / Revised: 5 August 2025 / Accepted: 2 September 2025 / Published: 29 September 2025

Abstract

Water contamination by heavy metals, particularly lead, derived from industrialization, climate change, and urbanization, represents a critical risk to human health and the environment. Several agricultural biomass residues have demonstrated efficacy as contaminant adsorbents. In this context, the study aimed to evaluate the potential of sugarcane tip (ST) waste biomass treated by hydrothermal carbonization (HTC) to produce hydrochar as an adsorbent material for Pb2+ in aqueous solutions. Samples were synthesized from the waste biomass at temperatures of 180 °C, 215 °C, and 250 °C, with a constant pressure of 6 MPa. Aqueous solutions of Pb2+ were prepared at concentrations of 10, 25, 50, 75, and 100 mg/L. Each solution was stirred at 1 g of hydrochar at 150 rpm, 25 °C, and pH 5 for 15 to 120 min. The solutions were filtered and stored at 4 °C for flame atomic absorption spectrophotometry analysis. In all cases, equilibrium was reached rapidly—within 15 min or less—as indicated by the stabilization of qt values over time. At an initial concentration of 100 mg L−1, the highest equilibrium uptake was observed for the hydrochar synthesized at ST HTC 180 °C (4.90 mg g−1), followed by 4.58 mg g−1 and 4.52 mg g−1 for ST HTC 215 °C and ST HTC 250 °C, respectively. For the ST HTC 180 °C, the Sips model provided the best correlation with the experimental data, exhibiting a high maximum capacity (qmax = 240.8 mg g−1; Ks = 0.007; n = 1.09; R2 = 0.975), which reinforces the heterogeneous nature of the material’s surface. Hydrothermal synthesis increased the amount of acidic active sites in the ST HTC 180 °C material from 1.3950 to 3.8543 meq g−1, which may influence the electrical charge of the Pb2+ adsorption process. HTC-treated sugarcane tip biomass represents a promising alternative for the synthesis of adsorbent materials, contributing to water remediation and promoting the circular economy by sustainably utilizing agricultural waste.

1. Introduction

Lignocellulosic biomasses are very common in all ecosystems and are materials that have been studied for their valorization in diverse areas of application. The estimated annual biomass production worldwide is 181.5 billion tons [1]. Agricultural residues are biomasses that have high contents of lignin, cellulose, and hemicellulose, which have been used to generate products with important sustainable, economic, renewable, and remediation benefits [2]. Materials with lignocellulosic content have been used for their porous structure and the number of active sites to adsorb heavy metal ions [3]. Several studies have identified agricultural biomasses as potential raw materials for the remediation of contaminated waters and for their use in agricultural productivity, with important results [4,5].
In Mexico, it was estimated that in 2015, 45 million tons of dry matter were generated, derived from crop residues that remain in the field after the harvest of grains and seeds. There are some important agro-industrial residues such as fruit peel remains, fruit trees with stones, stubbles, bagasse, and biomass from crops [6]. Sugarcane (Saccharum officinarum L.) was the second most important perennial crop nationwide during 2022–2023 with a total production of 29,074,000 tons and an industrialized area of 806,193 hectares [7]. Currently, this crop is mostly transformed to produce saccharose as a sweetener and the waste generated in the field such as stems, tips, or buds, and leaves are minimally used to produce organic fertilizers, livestock feed, and fuels [8]. Sugarcane tips represent 40% of the total waste generated in the field [9]. In the state of San Luis Potosí, it is the main crop with a production of 4,061,589 tons in 2022–2023, occupying the third place nationwide [7], so the agricultural waste generated during the harvest can be usable materials for its valuation.
For this study, biomass residues from sugarcane tips (STs) were treated with hydrothermal carbonization to produce hydrochar (HTC). For the hydrochar preparation process through hydrothermal carbonization, hydration conditions, temperature, and residence time must be considered; water provides an excellent medium for heat transfer in exothermic reactions [10]. The hydrothermal carbonization process involves the application of high temperatures (180 °C to 250 °C) and pressure (2 to 10 MPa) to convert biomasses into carbonaceous materials. It can utilize organic waste with high moisture contents (70–90%) without the need for pre-drying, thereby reducing energy costs. The resulting solid material has applications in the remediation of contaminated water, soil improvement, and bioenergy production [11,12]. Hydrochar obtained from the hydrothermal carbonization of sugarcane tips is used as an option for sustainable use and removal of heavy metal contaminants from water.
Several studies have reported on the use of agricultural biomass to produce hydrochar and its use in the removal of contaminants in water. Malool et al., 2023 [13] mention in their research the production of hydrochar from sugarcane bagasse by conventional method with a synthesis condition with the treatment temperature of 180 °C, retention time of 9.6 h, and a biomass/water ratio 3:1 used to remove Pb2+ with adsorption capacity of 137.12 mg g−1. Izquierdo et al., 2023 [14] mention the use of the Castanea sativa dome for the production of hydrochar by conventional synthesis at a temperature of 180 °C with a retention time of 24 h and a biomass/water ratio of 1:6 used as an adsorbent for the removal of PFAS from contaminated water, with a adsorption capacity of 1029.47 mg g−1. On the other hand, Koprivica et al., 2023 [15] mention the production of hydrochar from paulownia leaf waste (Paulownia tomentosa) by the conventional method at a temperature of 220 °C, with a retention time of 1 h and a biomass/water ratio of 1:15 to remove Pb2+ and with adsorption capacity of 174.75 mg g−1. Khushk et al., 2020 [16] conduct a study on hydrochar derived from furfural from corn, cotton, oat, and sugarcane husks obtained by microwave synthesis with a temperature condition of 200 °C, retention time of 30 min, and a biomass/water ratio of 1:7 with the purpose of adsorbing Cr(VI) in previously prepared solutions; the resulting adsorption capacity is 36.91 mg g−1.
Previous research has not explored the use of sugarcane tops as a feedstock for hydrothermal carbonization (HTC), despite representing a substantial proportion of harvest residues, nor has it examined the specific relationships between the physicochemical properties and the adsorption capacity of hydrochar derived from this biomass. Studies conducted using sugarcane agricultural residues through HTC for the removal of heavy metal contaminants have focused exclusively on the use of sugarcane bagasse [17,18]. This study contributes new insights into the physicochemical and textural characteristics of hydrochar produced from sugarcane tops and its Pb2+ adsorption capacity, utilizing a residue that is typically discarded or openly burned.
Therefore, the objective of the study is to evaluate the potential of residual biomass from sugarcane tips (Saccharum officinarum L.) treated by hydrothermal carbonization (HTC) to produce hydrochar as an adsorbent material for Pb2+ in aqueous solutions and to relate the physical, chemical, and textural properties with the adsorption mechanism. The relevance of this work lies in the fact that these residues, existing in high volumes within the agricultural sector, can be used by promoting a circular approach in its production model and sustainably impacting by presenting a proposal for the remediation of contaminated water, reducing the risks of diseases associated with the consumption of water with heavy metals and improving agricultural productivity.

2. Materials and Methods

2.1. Harvesting and Processing Sugarcane Tip

Sugarcane tip residues (STs) were collected from a plantation located in the Municipality of Ciudad Valles, S.L.P. during the first cane cut on the plantation during the month of November 2024. The samples were reduced in size between 10 and 15 cm with a manual cutter to facilitate handling and washed with distilled water. They were taken to a Thermo Electron Corporation drying oven for 24 h at a temperature of 65 °C [19,20]. They were then manually ground and sieved with a 50-mesh sieve. Finally, the samples were weighed on a Mettler analytical balance and stored for later use in polypropylene bags.

2.2. FTIR-ATR and TGA Analyses

Fourier Transform Infrared Spectroscopy (FTIR) and Thermogravimetric (TGA) analyses were applied exclusively to the sugarcane tip biomass to characterize its properties prior to hydrochar synthesis. FTIR analysis allowed the identification of functional groups on the surface of the material. Meanwhile, TGA provided information on the thermal stability of the biomass, which is essential for understanding its behavior during thermal treatment and for defining appropriate conditions for its conversion into hydrochar [21].
FTIR analysis was performed on sugarcane tip biomass using a Thermo Scientific Smart TR spectrophotometer equipped with attenuated total reflectance (ATR) to qualitatively identify the organic functional groups present on the biomass surface. Samples were ground to fine particles and oven-dried at 65 °C for 24 h. Spectra were recorded in the range of 4000 to 500 cm−1, with a resolution of 8 cm−1 and 16 scans [22]. A background scan was carried out beforehand to eliminate interferences caused by moisture and instrument noise before placing the sample in the infrared light beam.
Thermogravimetric analysis (TGA) was conducted to assess the thermal stability and weight loss behavior of sugarcane tip biomass. The experiment was performed using a Setaram Setsys Evolution TGA-DTA/DSC analyzer, calibrated at two temperature intervals between 600 °C and 1063 °C. A 13.2 mg sample was weighed using the instrument’s internal balance and heated from 29 °C to 600 °C at a constant rate of 10 °C/min under an inert atmosphere. Weight loss and its associated rate were recorded through thermogravimetric (TGA) and differential thermal analysis (DTA) data provided by the instrument software [23].

2.3. Hydrochar Synthesis

The hydrothermal carbonization process involves the application of high temperatures (180 °C to 250 °C) and pressures (2 to 10 MPa) to convert biomass into carbonaceous materials. The resulting products are hydrochar, which is a solid carbon material with superior properties in mass and energy density compared to raw biomass; an aqueous fraction rich in highly biodegradable organic and inorganic compounds; and a gaseous fraction composed of CO2, H2, CO, and CH4. The resulting solid material has applications in the remediation of contaminated water, soil improvement, and bioenergy production [11,12]. For the preparation process of hydrochar through hydrothermal carbonization, the hydration conditions, temperature, and residence time must be considered; water provides an excellent medium for heat transfer in exothermic reactions [10]. For the experiment, temperatures were set to be variable (180 °C, 215 °C and 250 °C) and residence time (24 h), pressure (6 MPa), and biomass/deionized water ratio (5 g/50 mL) remained constant, following the methods of González et al., 2020 and Garrido et al., 2021 [24,25]. For the synthesis of the hydrochar, 5 g of ST biomass was placed with 50 mL of deionized water in a 50 mL PTFE Teflon beaker inside a BAOSHISHAN brand stainless steel autoclave, which was placed inside a Memmert TwinDISPLAY oven at temperatures of 180 °C, 215 °C, and 250 °C. Once the hydrochar was obtained under the established conditions, the autoclave was cooled to room temperature for the necessary time. The hydrochar and the aqueous fraction were separated by vacuum filtration and the solid obtained was washed five times with deionized water and then dried in an oven at 110 °C for 24 h. The process is shown in Figure 1.
The biomass yield was analyzed and the amount of aqueous fraction obtained was recorded. The percentage hydrochar yield (%R HYR) of each synthesized sample was calculated according to the following equation:
% R   H Y R = D r y   h y d r o c h a r   w e i g h t   g D r y   b i o m a s s   w e i g h t   g 100        
The hydrochar was stored and labeled in polypropylene tubes for later use, and the aqueous fraction obtained was stored in a freezer for future experiments focused on evaluating its potential use as an organic fertilizer to promote plant growth.

2.4. Proximate Analysis of ST Hydrochar

Proximate analysis was performed in duplicate on ST hydrochar samples obtained at 180 °C, 215 °C, and 250 °C. Moisture (%) was determined according to ISO 18134-3:2015 [26]; ash content was calculated from that described in ISO 18122:2022 [27]; volatile matter content (%VM) was calculated from ISO 18123:2023 [28]; and the percentage of fixed carbon (%CF) was determined by the difference of the percentage of dry basis of biomass, ash, and volatile solids previously calculated according to the following equation:
% C F = 100 [ W m   % 100 W m   % + %   A s h e s + %   V o l a t i l e   S o l i d s ]

2.5. Adsorption Equilibrium Experiment

A certified 1000 mg L−1 Pb2+ stock solution was used to prepare 50 mL working solutions at 10, 25, 50, 75, and 100 mg L−1 by dilution with deionized water in Class A volumetric flasks, following Medellín et al. (2017) [20]. The effect of adsorption capacity was studied in duplicate using 1 g of the three synthesized materials (HTC 180 °C, HTC 215 °C, HTC 250 °C) in 50 mL of Pb2+ aqueous solution at different concentrations. The solutions were maintained at a pH of 5 under constant stirring in a Corning LSE Benchtop orbital shaker at a temperature of 25 °C for periods of 15, 30, 45, 60, 100, and 120 min, according to the method of Mahmood et al., 2015 [29]. Aliquots of 1 mL of the suspensions were taken at each time interval, which were filtered and stored at a temperature of 4 °C for analysis by flame atomic absorption spectrophotometry of the Thermo Scientific Model iCE 3000 Series. Data analysis for modeling the adsorption isotherms was performed using Python 3.12.11. The experimental adsorption data were fitted using Equations (3)–(5), corresponding to the Freundlich, Langmuir, and Sips isotherm models:
q e = K F C e 1 / n
For the Freundlich model, qe (mg/g) represents the amount of solute adsorbed at equilibrium per unit mass of adsorbent; KF (L1/n mg1−1/n g–1) is Freundlich adsorption constant related to adsorption capacity; Ce (mg L−1) is equilibrium concentration of the solute in solution, and n (dimensionless) is adsorption intensity, which reflects the heterogeneity of the adsorbent surface. The Freundlich isotherm is an empirical model describing adsorption on heterogeneous surfaces, and it assumes that the adsorption energy decreases logarithmically with increasing site occupancy [30].
q e = q m a x   K L C e 1 + K L C e
In the Langmuir isotherm model, qe (mg g−1) denotes the amount of solute adsorbed at equilibrium per unit mass of adsorbent, while Ce (mg L−1) represents the equilibrium concentration of the solute in the solution. The parameter qmax (mg g−1) corresponds to the maximum adsorption capacity of the adsorbent, indicating monolayer coverage. Finally, KL (L mg−1) is the Langmuir constant, which reflects the affinity between the adsorbent and the adsorbate [30].
q e = q m a x ( K C e ) n 1 + ( K s C e ) n
The Sips isotherm (Langmuir–Freundlich) describes adsorption on energetically heterogeneous surfaces. In the Sips equation, qe (mg g−1) is the adsorbed amount at equilibrium and Ce (mg L−1) is the equilibrium concentration. The parameter qmax (mg g−1) denotes the monolayer capacity; Ks (L mg−1) is the affinity constant; and n (dimensionless) is the heterogeneity factor. When n = 1, Sips reduces to Langmuir (homogeneous surface, monolayer). Deviations n ≠ 1 reflect surface heterogeneity [30,31].

2.6. Active Site Analysis of ST Biomass and Hydrochar

Duplicate analysis of active sites, zero charge point, and texture was performed on sugarcane tip biomass and hydrochar synthesized at 180 °C, which demonstrated the highest Pb2+ adsorption capacity to determine whether there was an increase in active sites when applying hydrothermal synthesis to the biomass. To ascertain the active sites of ST biomass and hydrochar, the acid-base titration method developed by Hanss-Peter Boehm, 1994 [32] was used. To determine the active sites in the ST biomass, 0.0200 ± 0.0050 g of ST were added to 50 mL polypropylene tubes with neutralizing solutions of Na2CO3 and NaHCO3. They were immersed in a water bath at 25 °C for 5 days and stirred at 110 rpm for 30 min per day. The same procedure was used for the analysis of active sites on the hydrochar, but in this case, 0.1000 ± 0.0080 g of sample was added to the polypropylene tubes. A greater mass of hydrochar was used compared to ST biomass to ensure detectable and reliable pH changes during Boehm titration. This adjustment was based on the higher surface functionality and buffering capacity of hydrochar, which require a larger sample to accurately quantify the total active sites, as also reported by Tan et al., 2015 [33]. In both cases, the concentrations of the active sites on the surface of the materials were calculated using the following equation:
C a s = V i n C i n C f n 1000 m
In the active site equation, Cas represents the concentration of active sites expressed in meq/g. The variables Cin and Cfn correspond to the initial and final concentrations, respectively, of the neutralizing solution, both measured in eq/L. The parameter m denotes the mass of the adsorbent material in grams, while Vin refers to the initial volume of the neutralizing solution in liters.
The point of zero charge (PZC) was evaluated using the potentiometric titration method proposed by Cruz-Briano et al., 2021 [34]. Acidic and basic neutralizing solutions were prepared in 50 mL volumetric flasks from 0.1 mL to 5.0 mL of HCl and 0.1 N NaOH and were made up to volume with a 0.1 N NaCl solution. A total of 0.0200 ± 0.0050 g of ST biomass and 25 mL of each of the prepared solutions were added, the other 25 mL of the solutions were used as a reference blank. For the case of the hydrochar synthesized at 180 °C, the same procedure was used, but with 0.1000 ± 0.0080 g of sample. In both cases, the titration curve was performed.

2.7. Texture Analysis of ST Hydrochar

Surface texture analysis was only performed on the hydrochar synthesized at 180 °C, which demonstrated the highest Pb2+ adsorption capacity. It was characterized using a Thermo Fisher Scientific INSPECT-F50 field emission scanning electron microscope, which allowed taking high-resolution microphotographs, through a semiquantitative analysis using energy-dispersive X-ray spectroscopy (EDAX) coupled to the SEM, where the surface chemical composition and the presence of other ions in the sample were studied through spectrograms.

3. Results and Discussion

3.1. FTIR-ATR and TGA Analyses

The FTIR spectra of the sugarcane tip biomass were obtained in the spectral range of 4000–500 cm−1. As shown in Figure 2, the infrared spectrum displays the presence of various functional groups.
In the spectrum, a broad band around 3300 cm−1 is observed, corresponding to O–H stretching vibrations from carboxylic groups located between 3490 and 3175 cm−1, which are involved in intramolecular hydrogen bonding in cellulose. The bands in the 2850–2950 cm−1 region are related to C–H stretching vibrations present in cellulose molecules. The IR spectrum shows a C=O stretching band at 1750 cm−1, associated with acetyl and ester linkages such as lactones in lignin and hemicellulose, as well as a C–O stretching band at 1250 cm−1 due to aryl groups in lignin, associated with phenolic structures [35]. The pronounced transmittance band at 1040 cm−1 can be attributed to C–O–C stretching vibrations, which are characteristic of carbohydrate–lignin linkages [22,36].
The FTIR analysis of the sugarcane tip biomass revealed characteristic absorption bands indicative of carboxylic, phenolic, and lactonic groups. These oxygen-containing functional groups are commonly found in lignocellulosic materials and play a significant role in surface adsorption mechanisms.
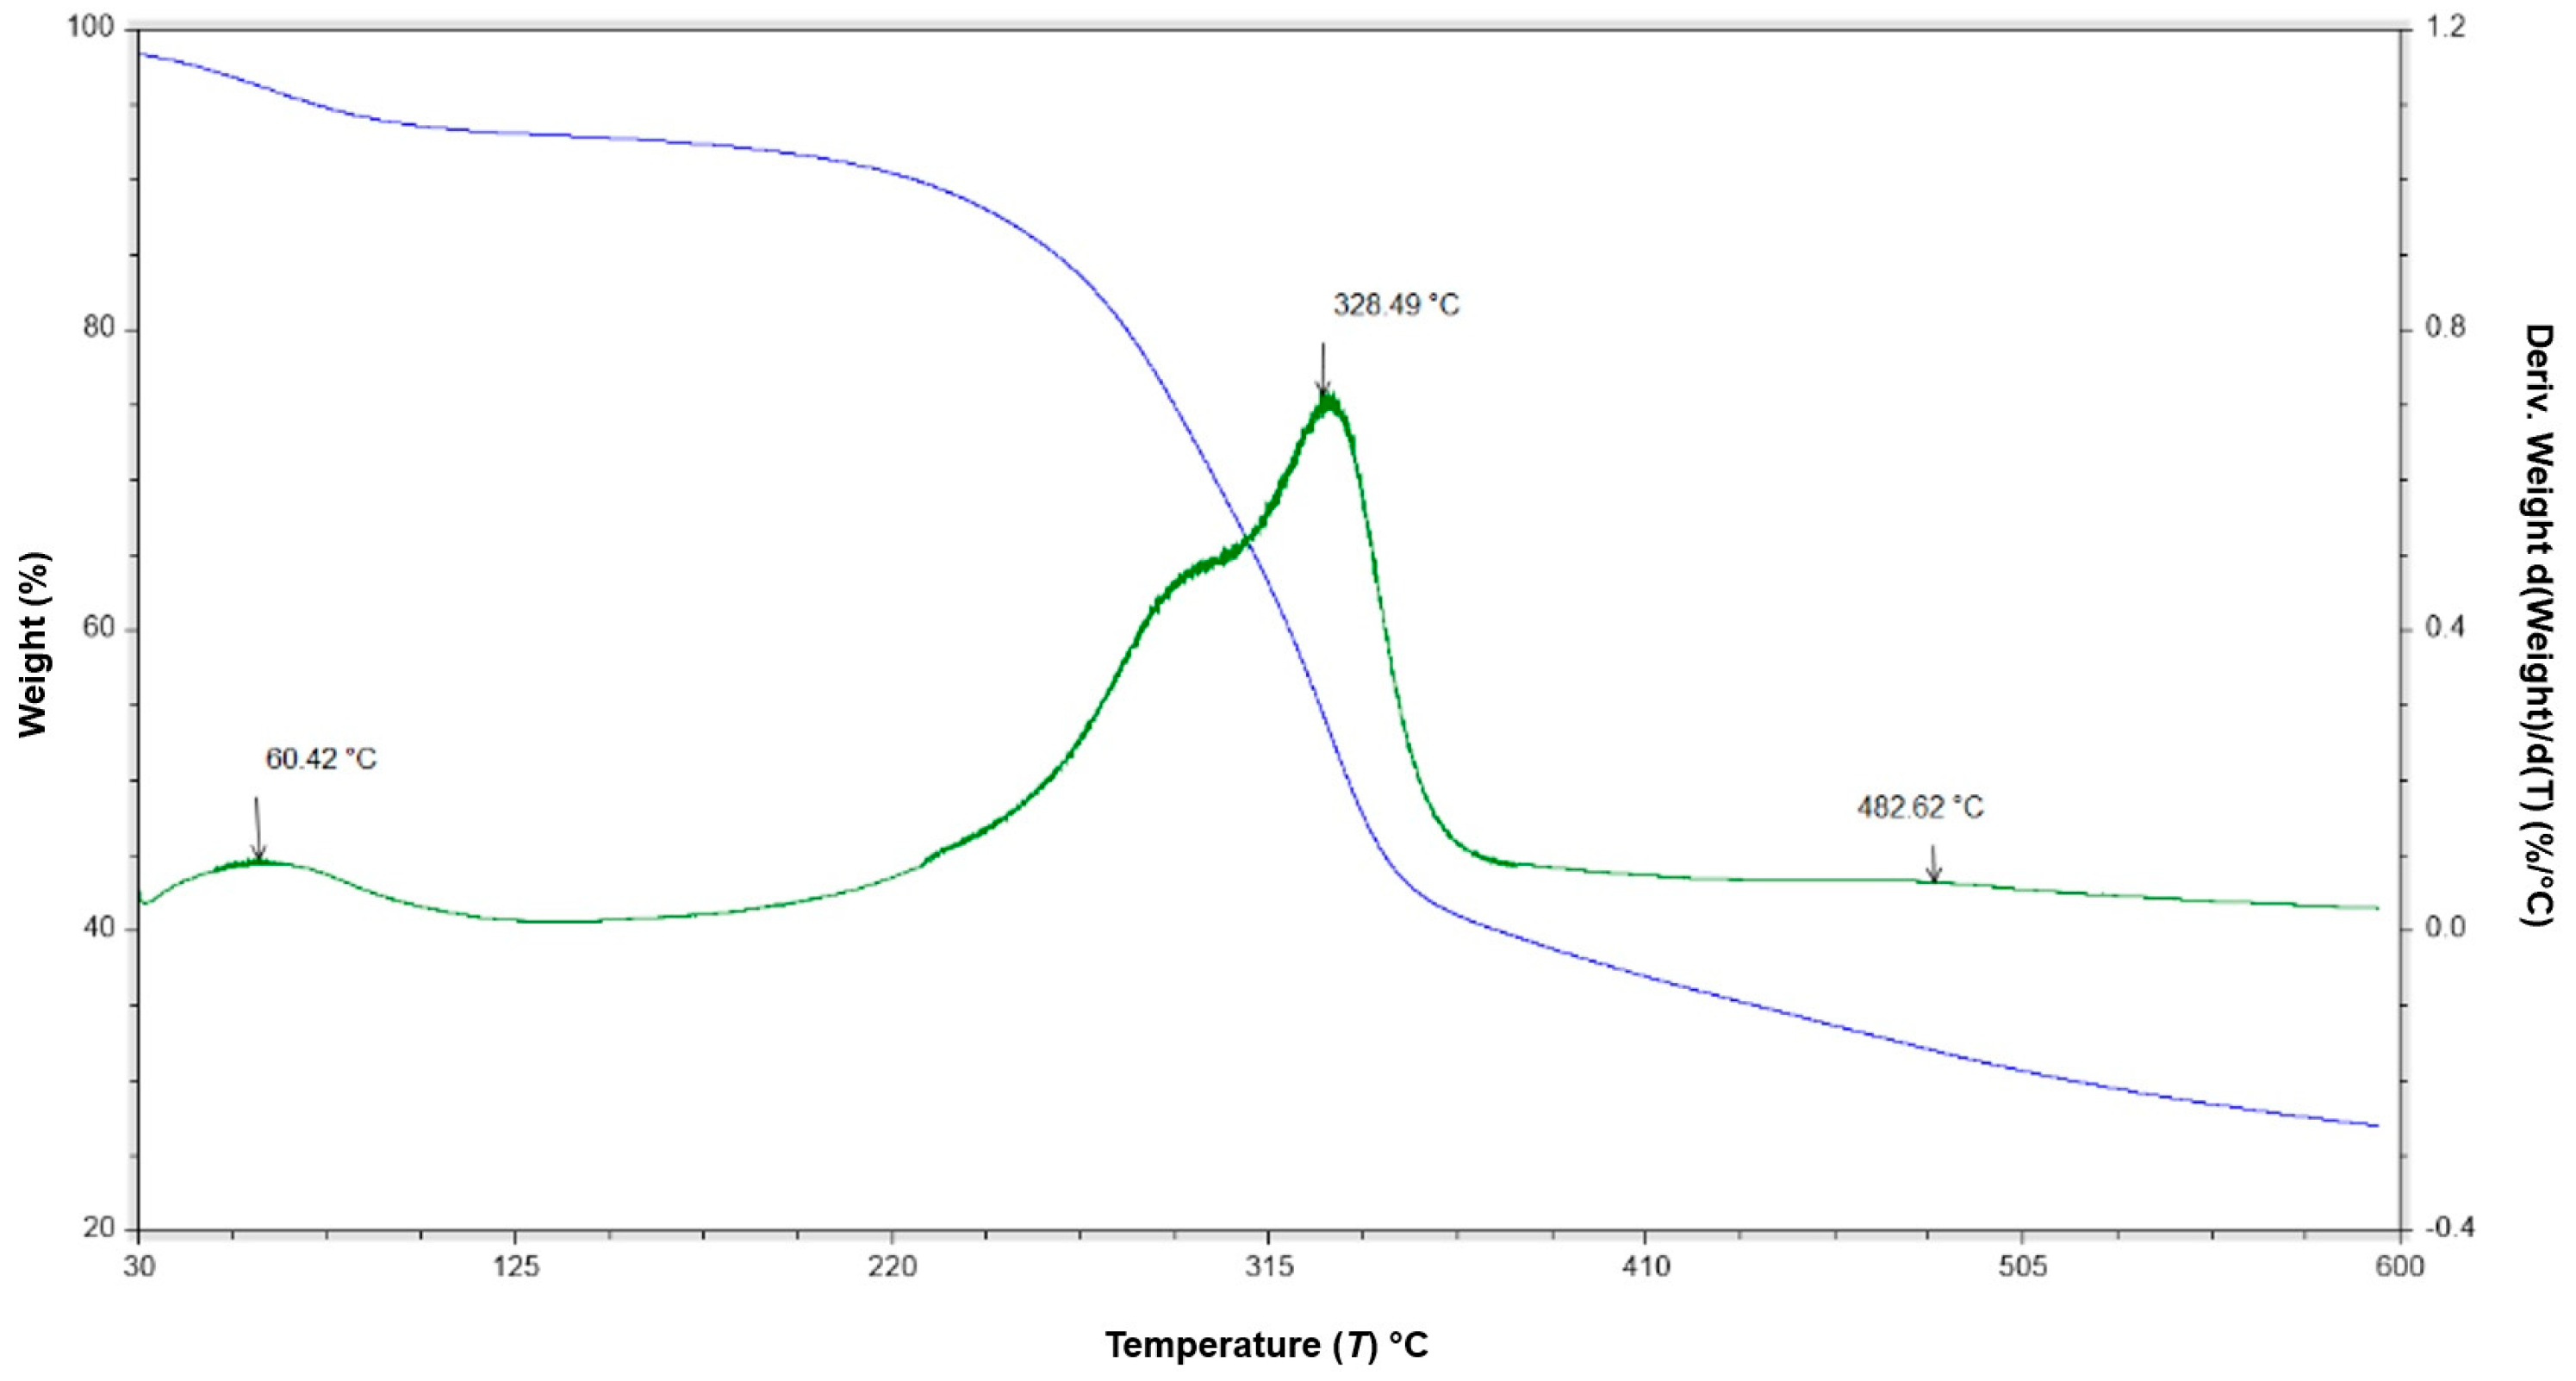
In the thermogravimetric (TGA) and first derivative thermogravimetric (DTGA) curves presented in Figure 3, it can be observed that the first degradation stage of the sugarcane tip biomass (dehydration) appears at 60.42 °C, where the weight loss corresponds to a 3.74% decrease due to the moisture content in the sample [21]. In the second stage (devolatilization), the highest peak is observed at 328.49 °C, associated with the volatilization of cellulose, hemicellulose, and lignin [37], as well as the greatest weight loss of 45.50%. In the final stage (degradation), another decomposition point is noted at 482.62 °C, attributed to the degradation of lignin present in the biomass [38].
At the end of the analysis, the total weight loss was 67.99% as a result of carbonaceous material formation. The DTGA results, indicating the weight loss rate as a function of temperature (dW/dt), were −0.094, −0.713, and −0.064 for the first, second, and third stages, respectively. The results obtained for the sugarcane tip biomass are characteristic of lignocellulosic fibrous materials, where the most significant weight loss with respect to temperature occurs around 300 °C.
These findings support the suitability of sugarcane tip biomass as a precursor for hydrothermal carbonization aimed at adsorption applications. Its lignocellulosic composition, evidenced by the presence of carboxylic, phenolic, and lactonic functional groups, provides chemically active sites capable of interacting with metal ions. Moreover, its thermal behavior, marked by significant devolatilization and carbonaceous residue formation at relevant temperatures, suggests good potential for conversion into hydrochar with desirable surface properties. Therefore, this biomass presents not only structural and chemical characteristics favorable for the synthesis of functionalized adsorbents but also the advantage of being an abundant and underutilized agricultural residue.

3.2. ST Hydrochar Synthesis Yields

For the synthesis of ST biomass hydrochar, four hydrothermal carbonization processes were performed at different temperatures (180 °C, 215 °C, and 250 °C). The hydrochar yield response (%R HYR) and the aqueous fraction yield (%R AF) from the synthesis process were analyzed to identify the most favorable conditions for achieving the highest hydrochar yield. The results are shown in Table 1.
According to the results obtained, the lower the synthesis temperature, the higher the hydrochar yield percentage. For ST biomass, the %R HYR was higher in the synthesis applied at a temperature of 180 °C with an average of 64.21%, whereas at 250 °C the average decreased to 39.98%. At temperatures below 200 °C, the biomass does not undergo complete decomposition of its moisture content and organic compounds, resulting in a hydrochar with a low degree of carbonization. In contrast, increasing the temperature above 200 °C promotes the transformation of organic matter into a more stable carbon structure, favored by the release of volatile compounds and the molecular reorganization of components such as cellulose and lignin [39]. There are previous studies on the synthesis of other biomasses where it is mentioned that higher reaction temperatures within the hydrothermal carbonization process lead to lower mass yields [24,25]; they also consider that the decrease in the solid material yield can be attributed to a greater primary decomposition of the biomass at high temperatures or to the hydrolysis of cellulose and hemicellulose [40]. This behavior reflects increased decomposition and solubilization of organic compounds at higher temperatures, which causes greater carbon redistribution toward the liquid phase [41]. Similar trends have been observed in HTC systems involving lignocellulosic biomass, where hemicellulose and cellulose depolymerize under subcritical conditions, generating soluble products.
Regarding the aqueous fraction, the highest yield percentage was presented at high temperatures. For the case of the synthesis applied at 250 °C, the average %R AF was 60.36%, corresponding to the lowest hydrochar yield. The aqueous fraction obtained from ST turned light yellow to brown. During the HTC synthesis process, the liquid phase acts as a heat transfer medium and degrades carbohydrates during biomass hydrolysis; due to dehydration reactions, the liquid content at the end of each HTC experiment is usually higher than the original water contribution [42], which coincides with the HTC synthesis of ST. These results highlight the importance of understanding the hydrochar synthesis process to appropriately select the most suitable conditions based on the desired product.

3.3. Characterization of ST Hydrochar

The results obtained from the proximate analysis carried out on samples resulting from the synthesis of hydrochar are shown in Table 2.
The data presented demonstrate the progressive transformation of sugarcane tip biomass into a carbon-rich material through hydrothermal carbonization (HTC). As the synthesis temperature increased from 180 °C to 250 °C, a significant decrease in volatile matter content was observed (from 83.09% to 60.19%), while the fixed carbon content increased markedly (from 13.48% to 33.02%). The reduction in hydrochar yield and volatile matter content with rising temperature may be attributed to the intensification of hydrolysis, depolymerization, dehydration, decarboxylation, and deoxygenation reactions. In contrast, the increase in fixed carbon content is likely associated with enhanced polymerization and aromatization processes [43]. Additionally, the ash content increased from 2.86% to 6.66%, possibly reflecting a relative concentration of inorganic compounds due to the loss of volatiles. This rise in ash percentage with increasing HTC temperature may be linked to an intensified depolymerization of the raw material [44]. Other studies mention that the composition of the proximate analysis of hydrochars varies according to the reaction temperature and residence time for each biomass studied; in the case of fixed carbon, this shows a minimal increase as the synthesis temperature and residence time increase [25].

3.4. Adsorption Equilibrium Experiment

Table 3 presents the equilibrium data obtained from batch adsorption experiments using hydrochars produced at 180, 215, and 250 °C through hydrothermal carbonization (HTC). The experiments were conducted with initial Pb2+ concentrations (C0) ranging from 10 to 100 mg L−1. The residual equilibrium concentration (Ce) and the corresponding adsorption capacity at time t (qt) were calculated for each condition.
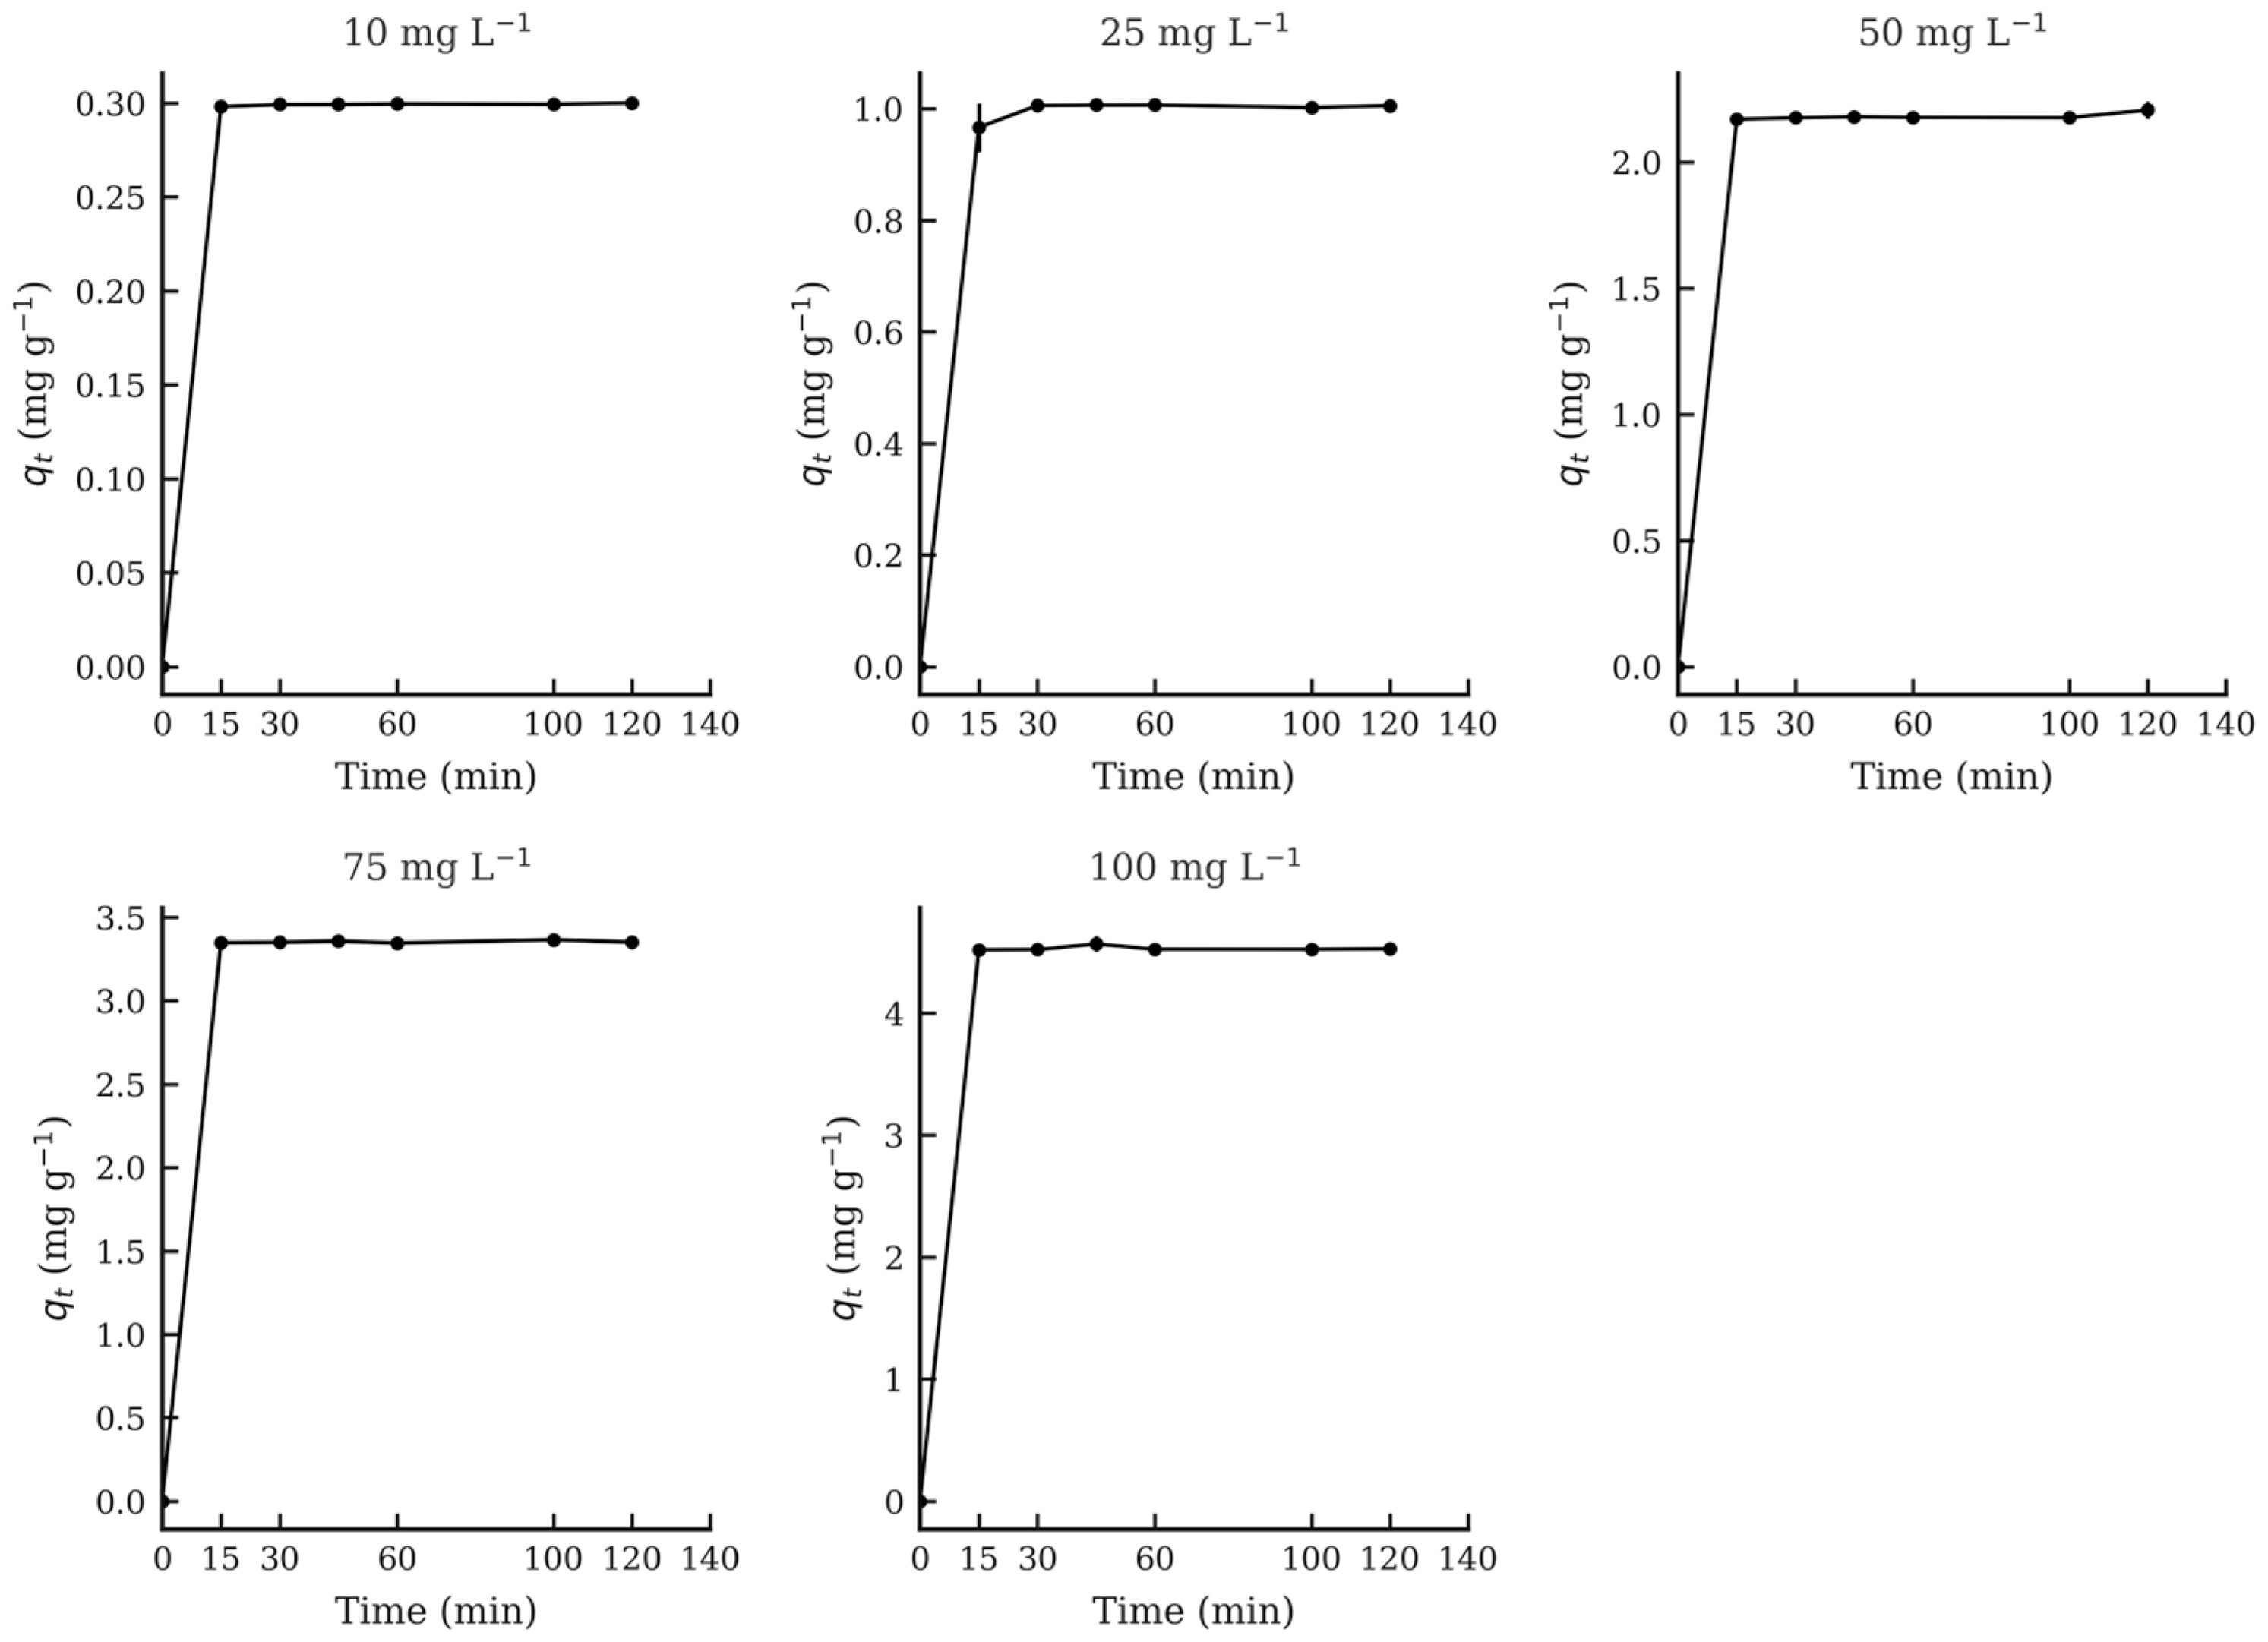
In all cases, equilibrium was reached rapidly—within 15 min or less—as indicated by the stabilization of qt values over time. At an initial concentration of 100 mg L−1, the highest equilibrium uptake was observed for the hydrochar synthesized at 180 °C (4.90 mg g−1), followed by 4.58 mg g−1 and 4.52 mg g−1 for 215 °C and 250 °C, respectively (Table 3). These values confirm the superior performance of the 180 °C material in terms of adsorption capacity and kinetics. Time-course adsorption profiles are shown in Figure 4 for the 180 °C material, with corresponding profiles for the 215 °C and 250 °C materials presented in Figure 5 and Figure 6, respectively.
At C0 = 100 mg L−1, the removal efficiencies were ≈96% (180 °C), 92% (215 °C), and 90% (250 °C), consistent with Table 3. The combination of high removal with low qe values is expected at the 1 g/50 mL dose because mass balance limits the mg g−1 loading; this also explains the poor Langmuir fit within 10–100 mg L−1.
To further investigate the adsorption mechanism and surface interaction behavior, isotherm models were fitted using Freundlich, Langmuir, and Sips equations. For the 180 °C hydrochar (Figure 7a–c), the Freundlich model exhibited a good fit (KF = 1.396; 1/n = 0.813; R2 = 0.943), suggesting a heterogeneous surface with favorable binding sites. The Langmuir model, however, showed a poor fit (qmax = 1.531 mg g−1; KL = 10; R2 = −0.361), which is likely due to its assumption of monolayer adsorption on a homogeneous surface. In contrast, the Sips model provided the best correlation to experimental data, with a high maximum capacity (qmax = 240.8 mg g−1; KS = 0.007; n = 1.09; R2 = 0.975), reinforcing the heterogeneous nature of the material surface.
Figure 8a–c illustrates the isotherm fitting for the 215 °C hydrochar. The Freundlich model again showed predictive reliability (KF = 0.005752; 1/n = 3.12; R2 = 0.961), while the Langmuir model failed to yield meaningful parameters (qmax = 0.06044 mg g−1; KL = −8.98; R2 = −2.07), with negative values indicating model invalidity. The Sips model outperformed the others, yielding qmax = 228.9 mg g−1; KS = 0.0293; n = 2.84; and R2 = 0.969, indicating energetic heterogeneity in the adsorption sites rather than multilayer coverage under higher HTC severity.
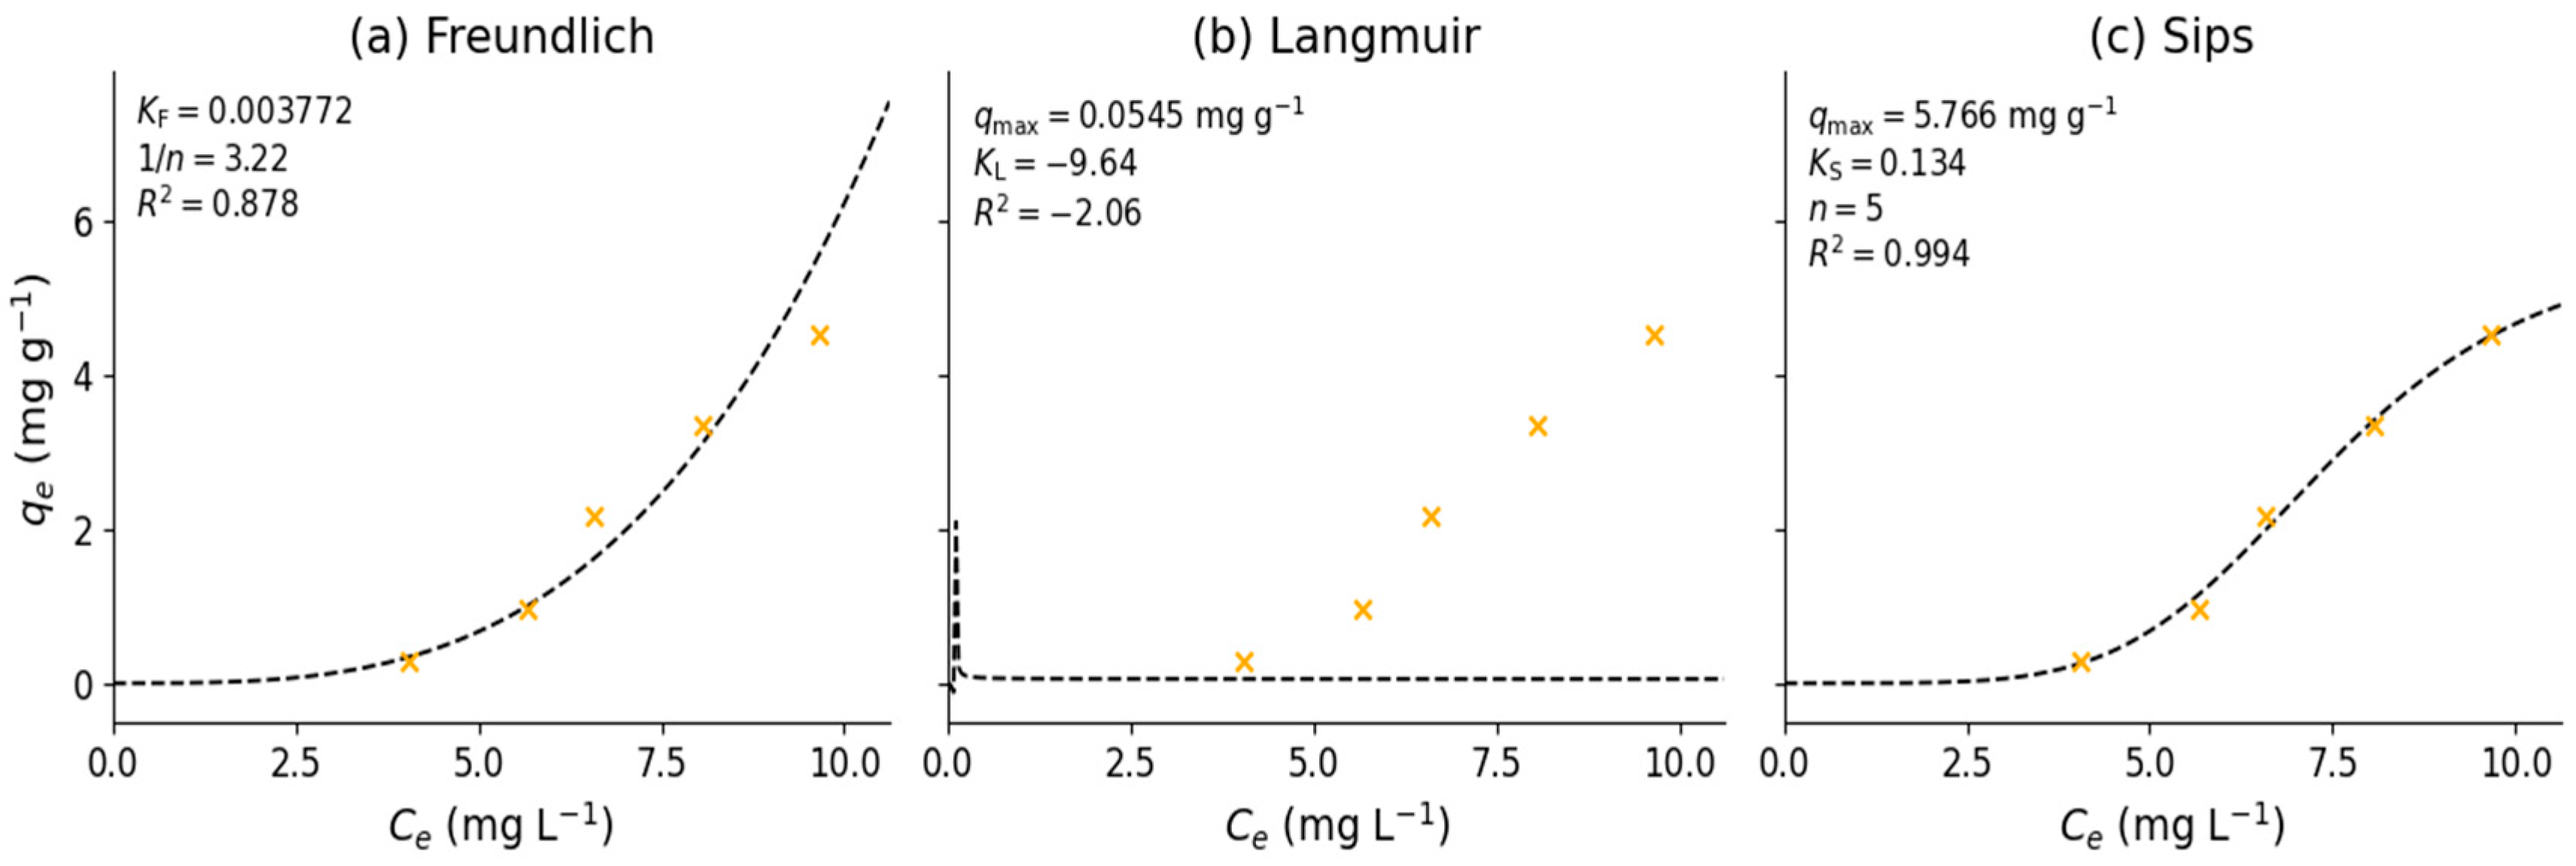
At 250 °C (Figure 9a–c), the isotherm trends remained consistent. The Freundlich model maintained a moderately good fit (KF = 0.003772; 1/n = 3.22; R2 = 0.878), whereas the Langmuir model again failed to capture the adsorption behavior accurately (qmax = 0.0545 mg g−1; KL = −9.64; R2 = −2.06). The Sips model continued to show excellent descriptive power, achieving qmax = 5.766 mg g−1; KS = 0.134; n = 5; and R2 = 0.994.
Across all studied conditions, the Sips model proved to be the most suitable for representing the adsorption equilibrium in materials synthesized at different HTC temperatures (Figure 7, Figure 8 and Figure 9). The Freundlich model provided an acceptable fit, particularly at lower HTC temperatures, whereas the Langmuir model was unsuitable in all cases, yielding negative or unrealistic parameter values. Among the evaluated hydrochars, the material synthesized at 180 °C exhibited the highest adsorption capacity and the most favorable kinetics, with low variability across replicates (Table 3), confirming its suitability for further applications and advanced characterization.
The adsorption capacity systematically decreases as the synthesis temperature increases. The hydrochar produced at 180 °C combines the highest adsorption capacity, the fastest equilibrium time, and the most favorable morphological evidence while also requiring less energy for production. Although the modeled qmax at 215 °C is similar, its initial affinity is lower, and equivalent microscopic characterization is not available. Therefore, 180 °C remains the optimal synthesis temperature.
The instantaneous uptake (<15 min) is consistent with other lignocellulosic biomasses hydrothermally treated at ≤200 °C, where the abundance of carboxyl and phenolic groups facilitates Pb2+/H+ exchange [18]. In our 180 °C hydrochar, the density of acidic sites (3.85 meq g−1, Boehm data) and the PZC ≈ 5 favor electrostatic interactions at pH 5, conditions identical to those used in analogous studies with sugarcane bagasse [4]. The progressive decline with increasing temperature is attributed to aromatization and the loss of surface oxygen, a phenomenon documented in hydrochars derived from agricultural residues [1]. Koprivica et al., 2023 [15] observed a 22% decrease in qmax when increasing the temperature from 180 to 250 °C; our data show a 35% drop, consistent with greater thermal severity. The good fit with the Sips model (n > 2) confirms the inherent heterogeneity of hydrochars [45]. Given the high adsorbent dose (1 g in 50 mL) and the limited C0 range (10–100 mg L−1), the plateau region was not reached; consequently, Langmuir qmax estimates should be interpreted cautiously. We therefore emphasize the empirical fits (Freundlich/Sips) without inferring a mechanistic monolayer capacity.
In this study, the evaluation of surface acidic groups, point of zero charge, and surface morphology using SEM and EDX was carried out only for the hydrochar synthesized at 180 °C. This decision was based on the fact that this sample exhibited the most consistent values with the least variability in adsorption equilibrium, as well as the highest yield during hydrochar synthesis. These experimental results provide the basis for proposing potential adsorption mechanisms, which are detailed in Section 3.7.

3.5. Active Sites in ST and Hydrochar Biomass

For the analysis of active sites and the point of zero charge (PZC), the study was conducted using the hydrochar synthesized at 180 °C, as it exhibited the highest yield and the greatest Pb2+ adsorption capacity. Table 4 compares the surface-active sites and the point of zero charge (PZC) between raw sugarcane tip biomass (ST) and the hydrochar produced at 180 °C. A significant increase in the total concentration of acidic sites is observed, rising from 1.3950 meq g−1 in the raw biomass to 3.8543 meq g−1 in the hydrochar (ST HTC 180 °C).
The active sites on the surface of ST biomass are found in the following relationship: phenolic sites > lacton sites > carboxylic sites, so the amount of acid sites is greater than the basic sites. In the case of hydrochar synthesized at 180 °C, the amount of acid sites is greater than the number of basic sites on the surface of the material, which can positively influence the electrical charge of the adsorption process. The concentration of total active sites is in the following order: lacton sites > phenolic sites > carboxylic sites. The presence of lactonic groups is attributed to aromatization and polymerization reactions on the surface of the hydrochar. The predominance of acidic sites, particularly lactonic groups, suggests a higher potential for the adsorption of cationic metal ions, especially under slightly acidic conditions [46].
Biomasses are composed of lignin that contains functional groups on its surface, such as carboxylic and phenolic acids, which adsorb heavy metal ions by deprotonation [47]. Acid sites (carboxylic, phenolic, and lactone) on the adsorbent surface tend to interact with metal cations, favoring the adsorption of heavy metals. These interactions generally occur through electron donation or electrostatic forces. Basic sites, such as amine groups, deprotonated hydroxyls, or oxygenated sites of a basic nature, can interact with metal anions or act as bases in the adsorption of cations depending on the acid-base balance of the system [48]. These sites, when present in solutions and depending on their pH, favor the uptake of metal ions in the solution [49]. Moreover, the point of zero charge (PZC) decreased from 6.9 to 5.0, indicating that the hydrochar surface becomes more negatively charged under slightly acidic conditions. Since the adsorption experiments were conducted at pH 5, these surface characteristics favor the electrostatic attraction of Pb2+ ions [18]. This supports the suitability of HTC-treated biomass for the remediation of heavy metals in water.

3.6. SEM and EDAX Analysis

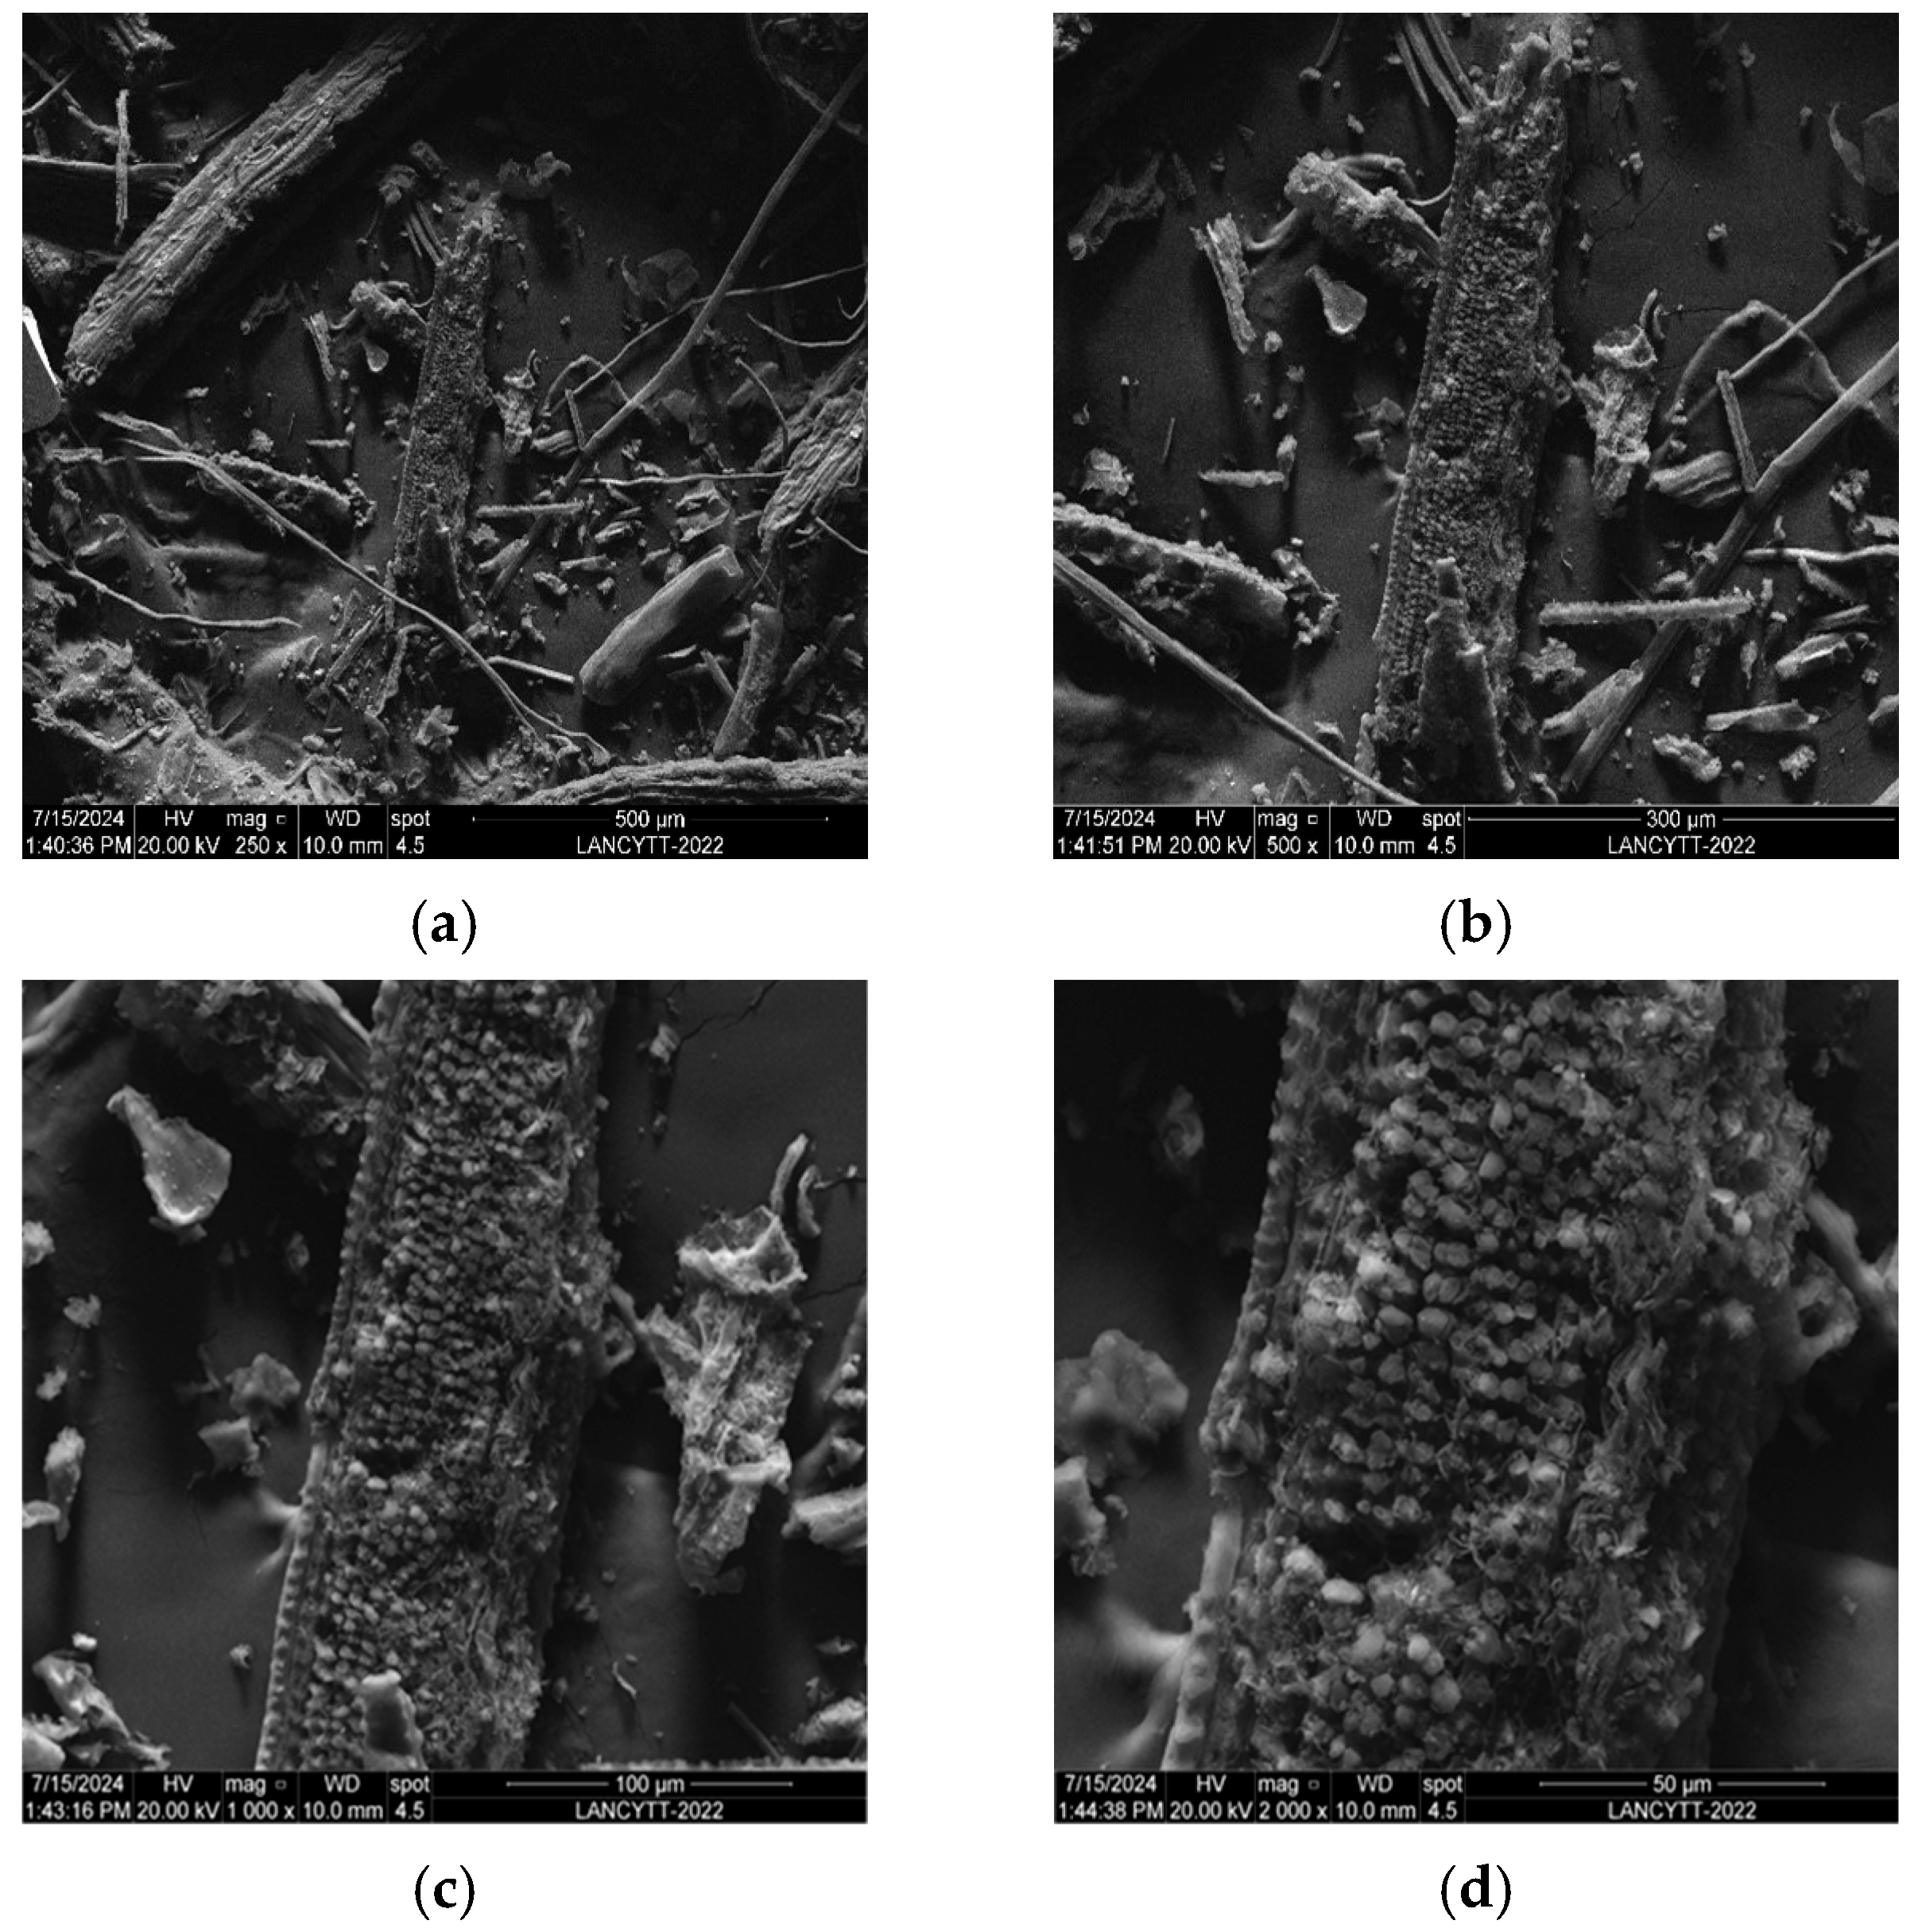
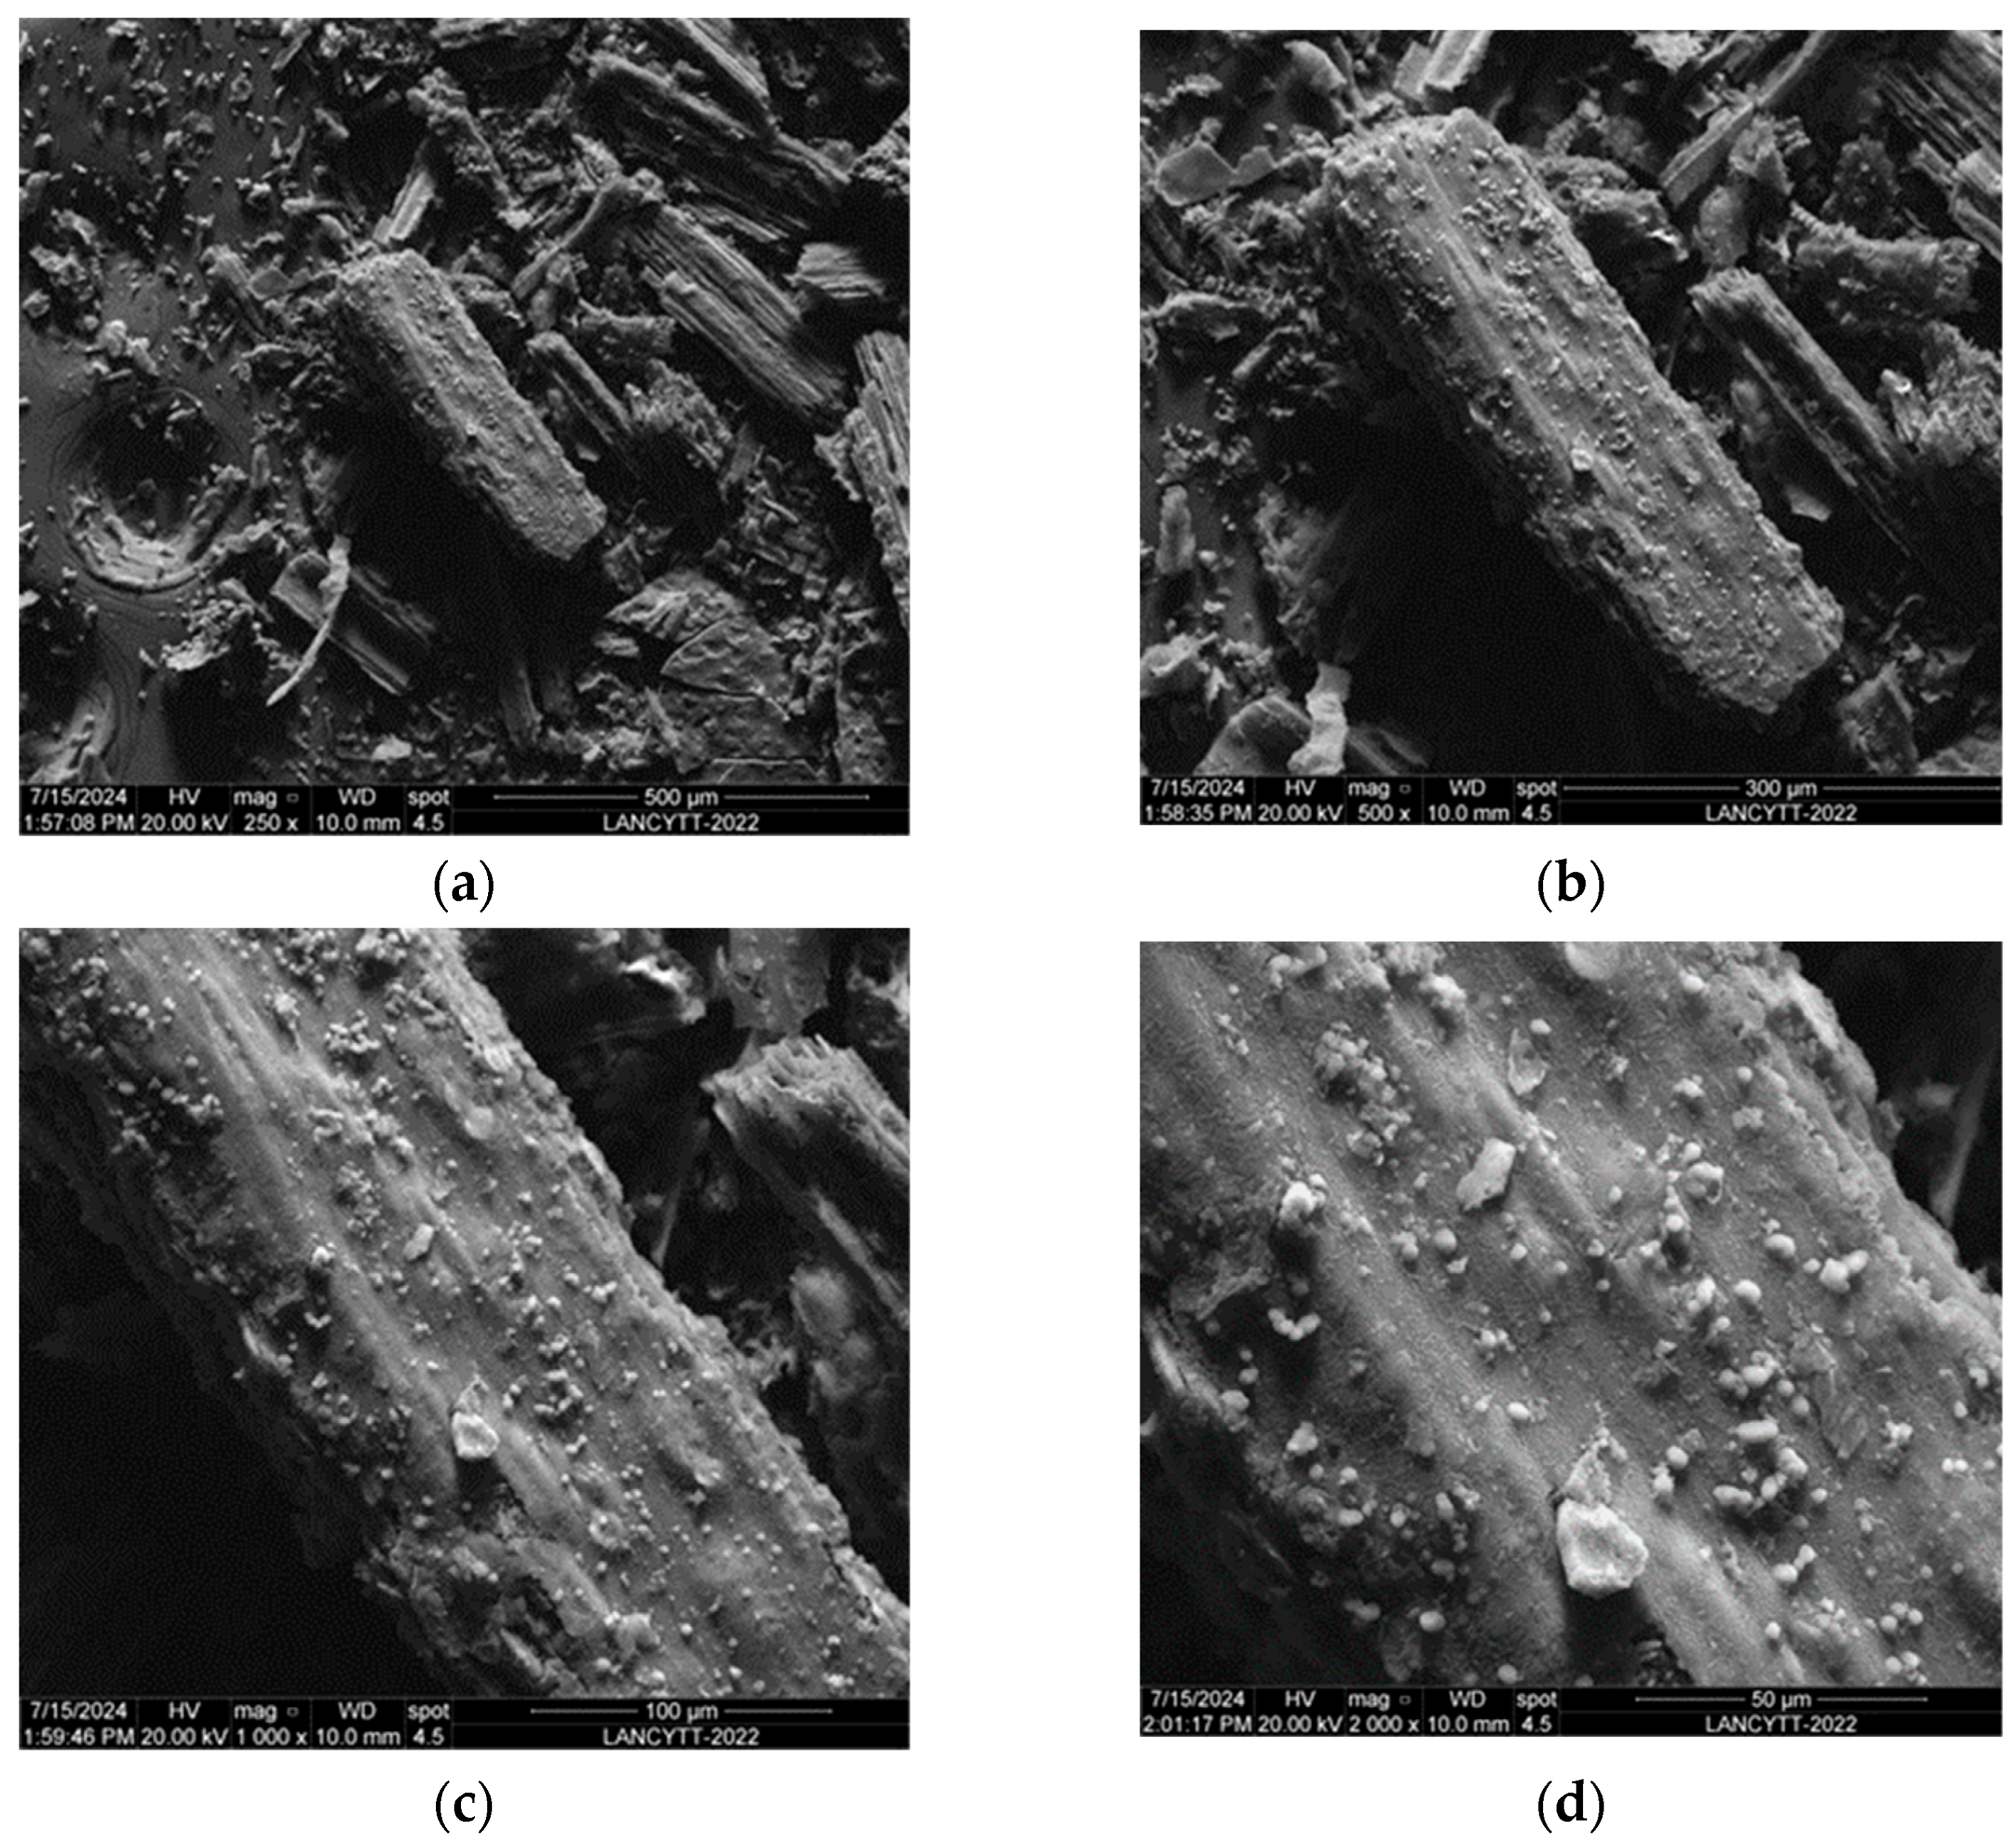
Scanning electron microscopy (SEM) analysis was performed to identify changes in the surface morphology of HTC sugarcane tip hydrochar at 180 °C (ST HTC 180 °C), as it was the material with the best results in the Pb2+ adsorption equilibrium process in the various aqueous solutions. Figure 10 (Section 1) and Figure 11 (Section 2) show the microphotographs taken of the hydrochar samples before Pb2+ adsorption. In the two sections analyzed, irregular and rough grooved amorphous particles can be observed, with fragmented fibrous structures and spongy particles with small pores predominating. This porosity is due to the compression exerted by the temperature of the hydrothermal carbonization process to which they were subjected. In the case of hydrochar materials derived from sugarcane bagasse, hydrothermal carbonization generated spongy structures with disordered structural cracks and irregular channels [18].
A semiquantitative analysis was performed using energy-dispersive X-ray spectroscopy (EDAX) coupled with an SEM to determine the elemental composition and the presence of other ions in the samples.
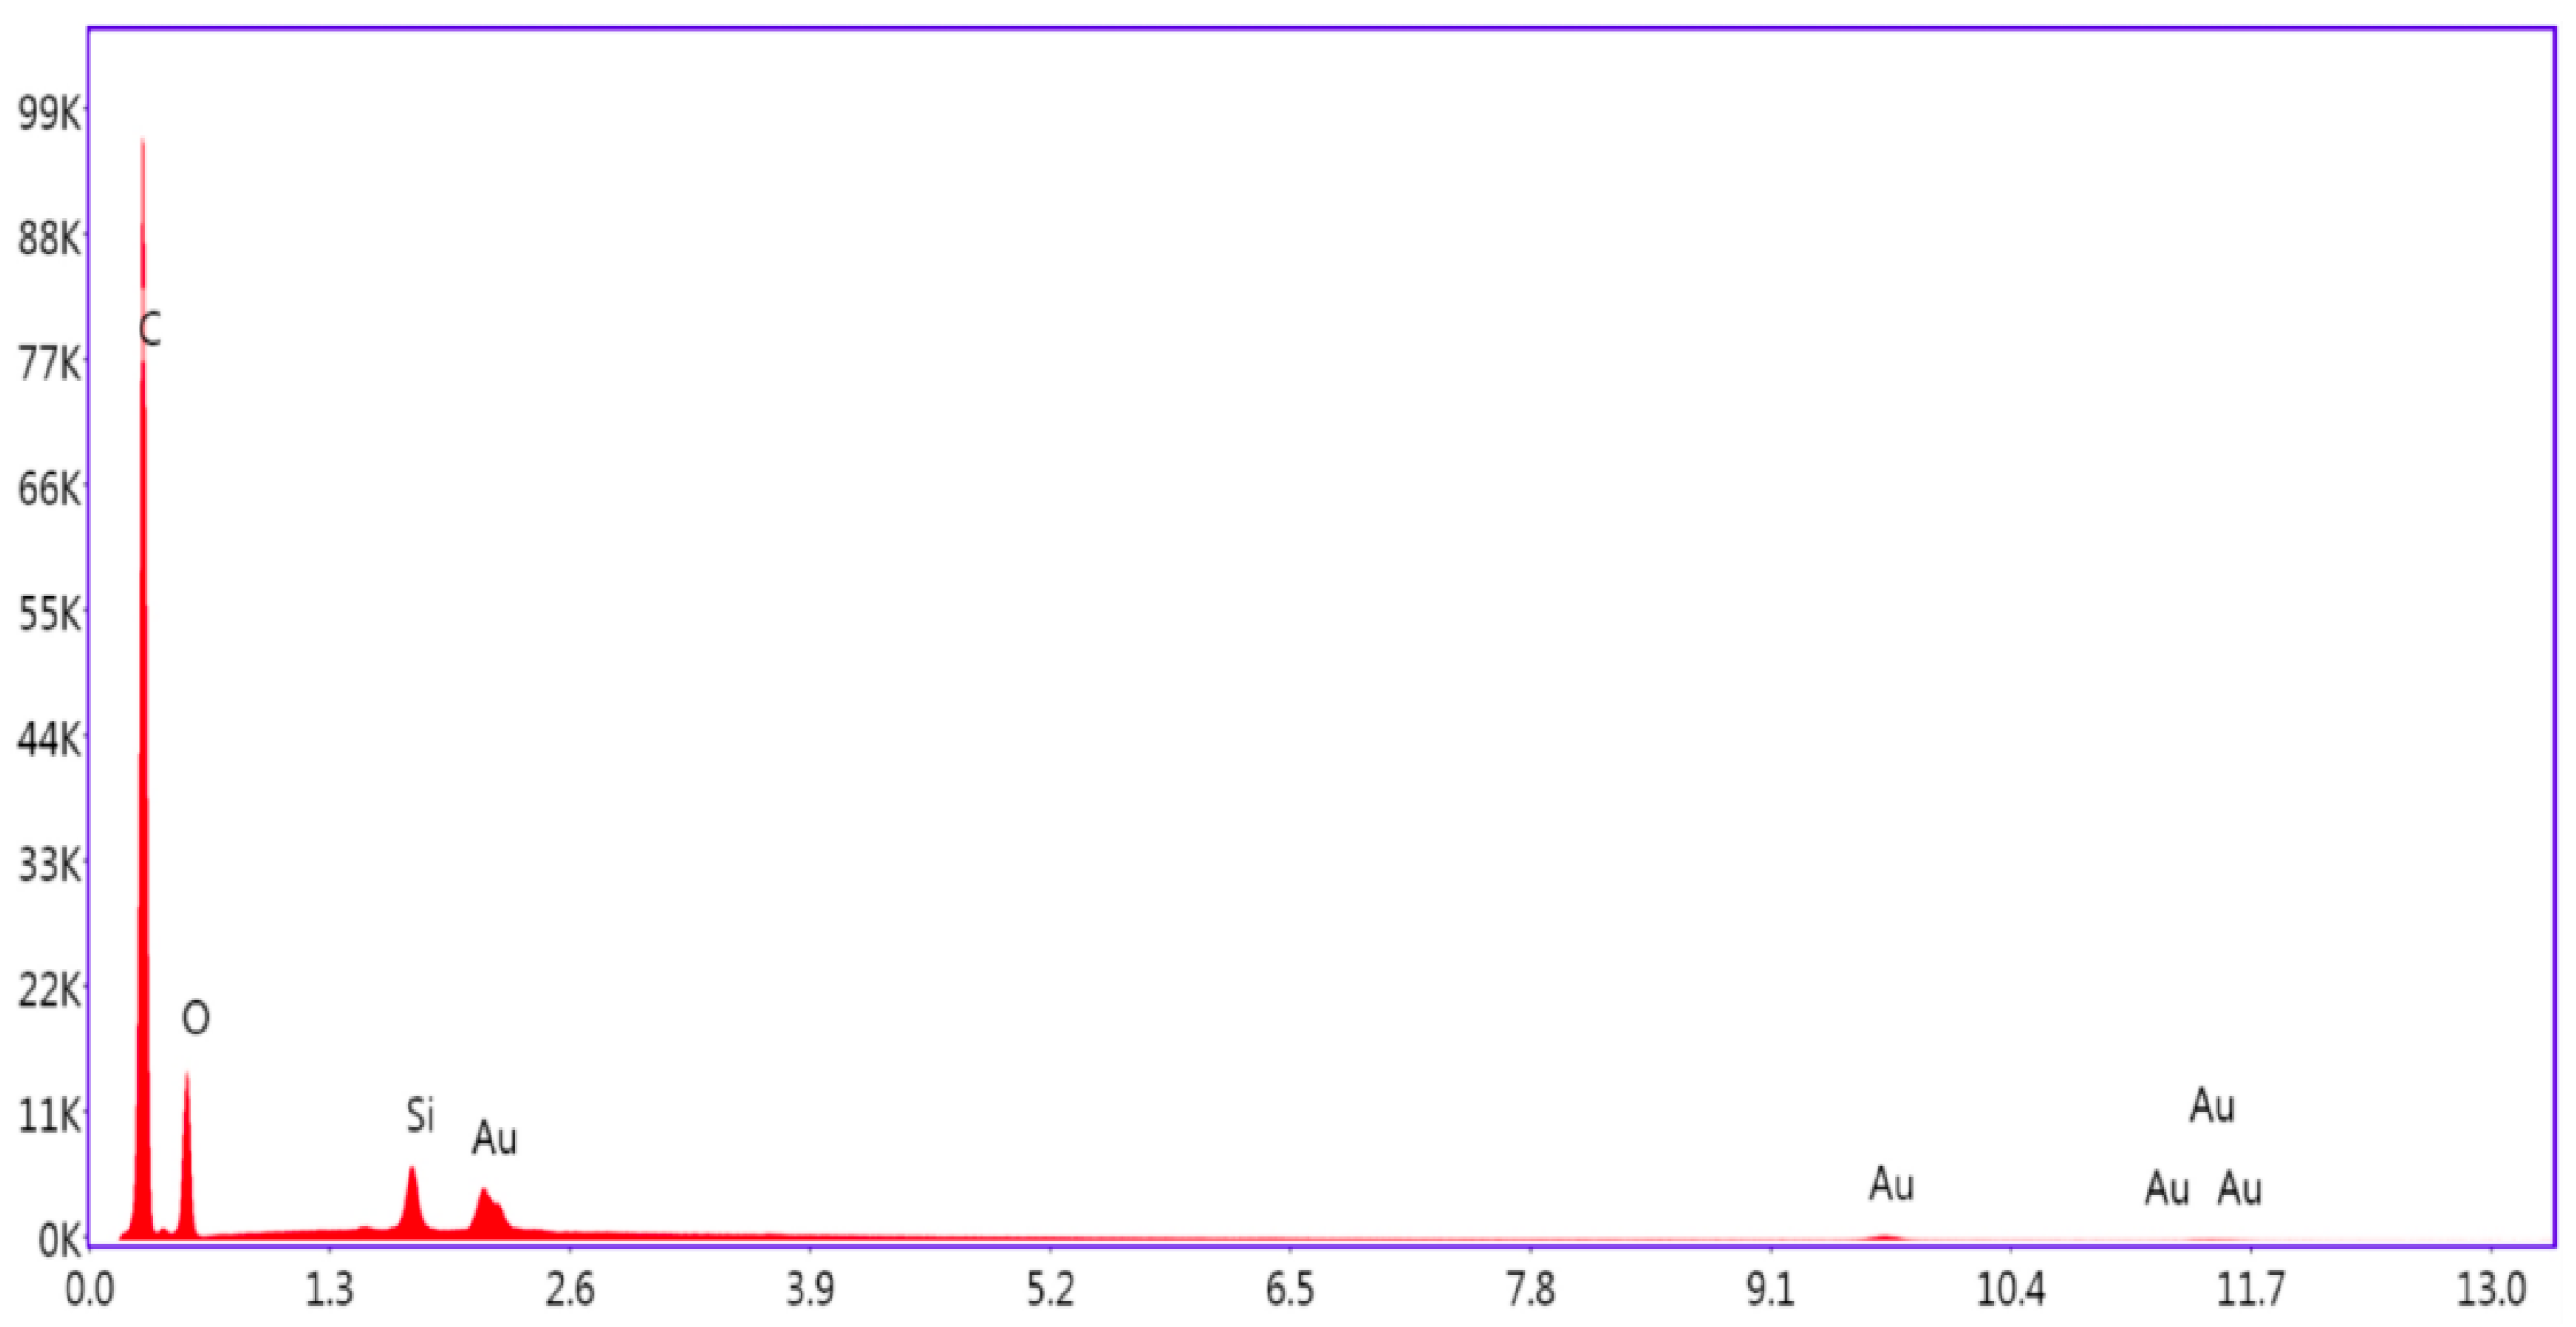
Analysis of the spectrogram shown in Figure 12 determined that the average amount of carbon (C) present in the hydrochar was 70.26%, oxygen (O) 23.70%, silicon (Si) 1.30%, and gold (Au) 4.75%, the latter element due to the coating used for electron detection. It is important to note that the presence of silica in the hydrochar can influence the porous structure of the material, helping to form a more stable and resistant porous matrix, which can improve adsorption properties. In biomasses such as rice husk, sugarcane residue, or wheat straw, which are commonly used to produce hydrochar, the silicon content is particularly high due to the accumulation of silica in the plant from silicate-rich soils [1].
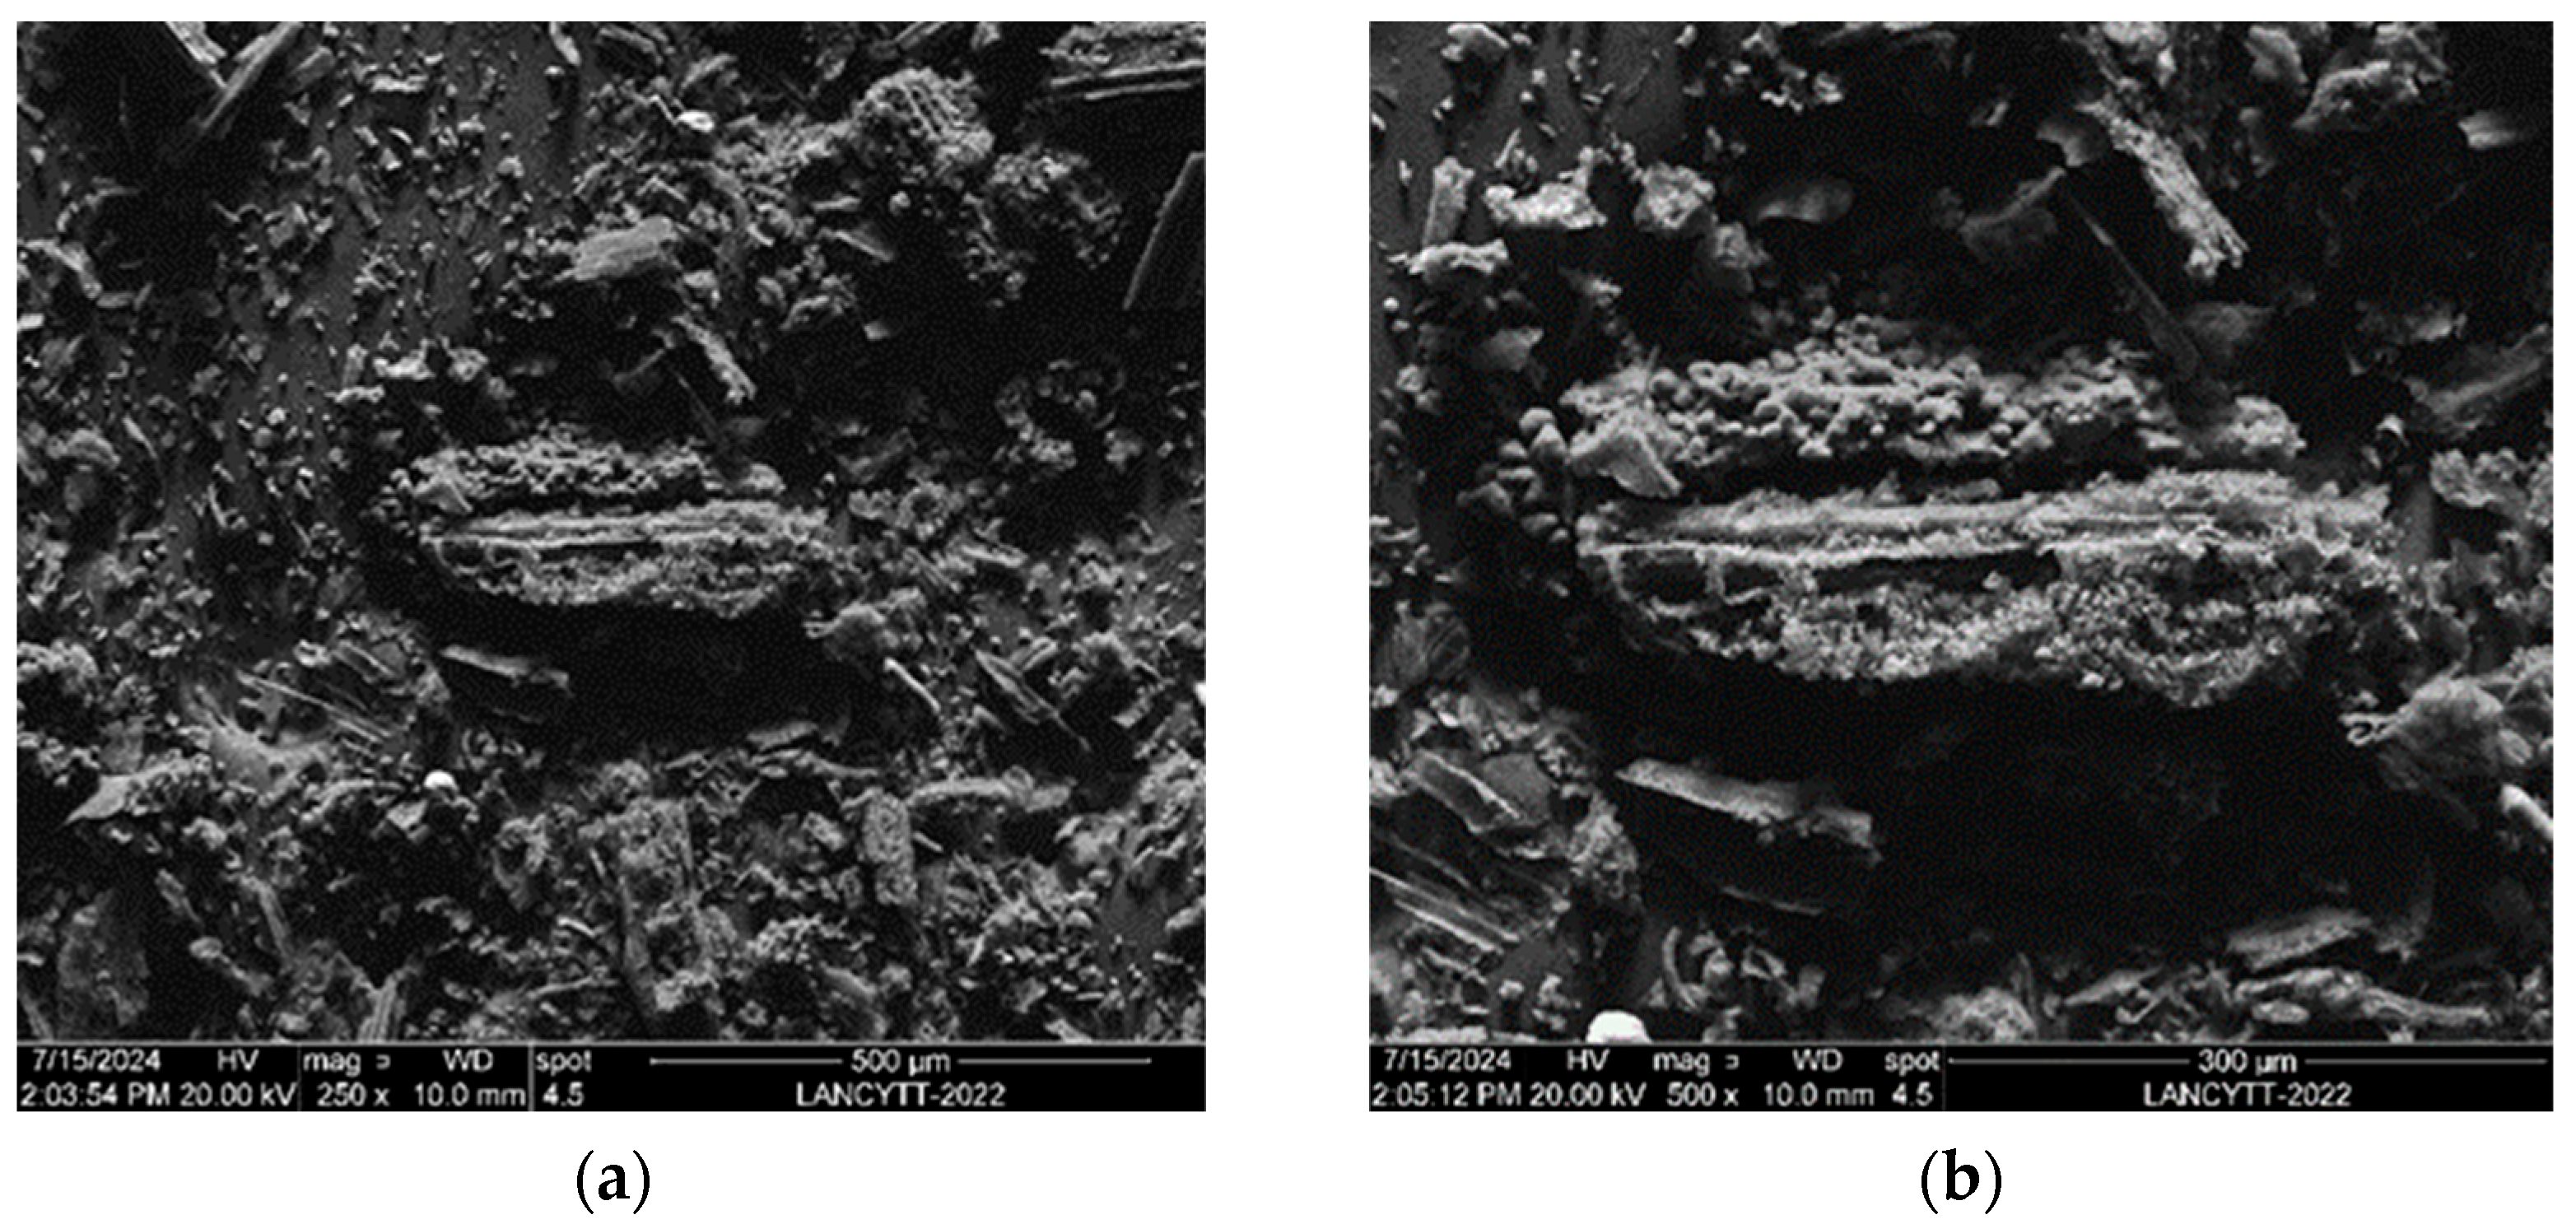
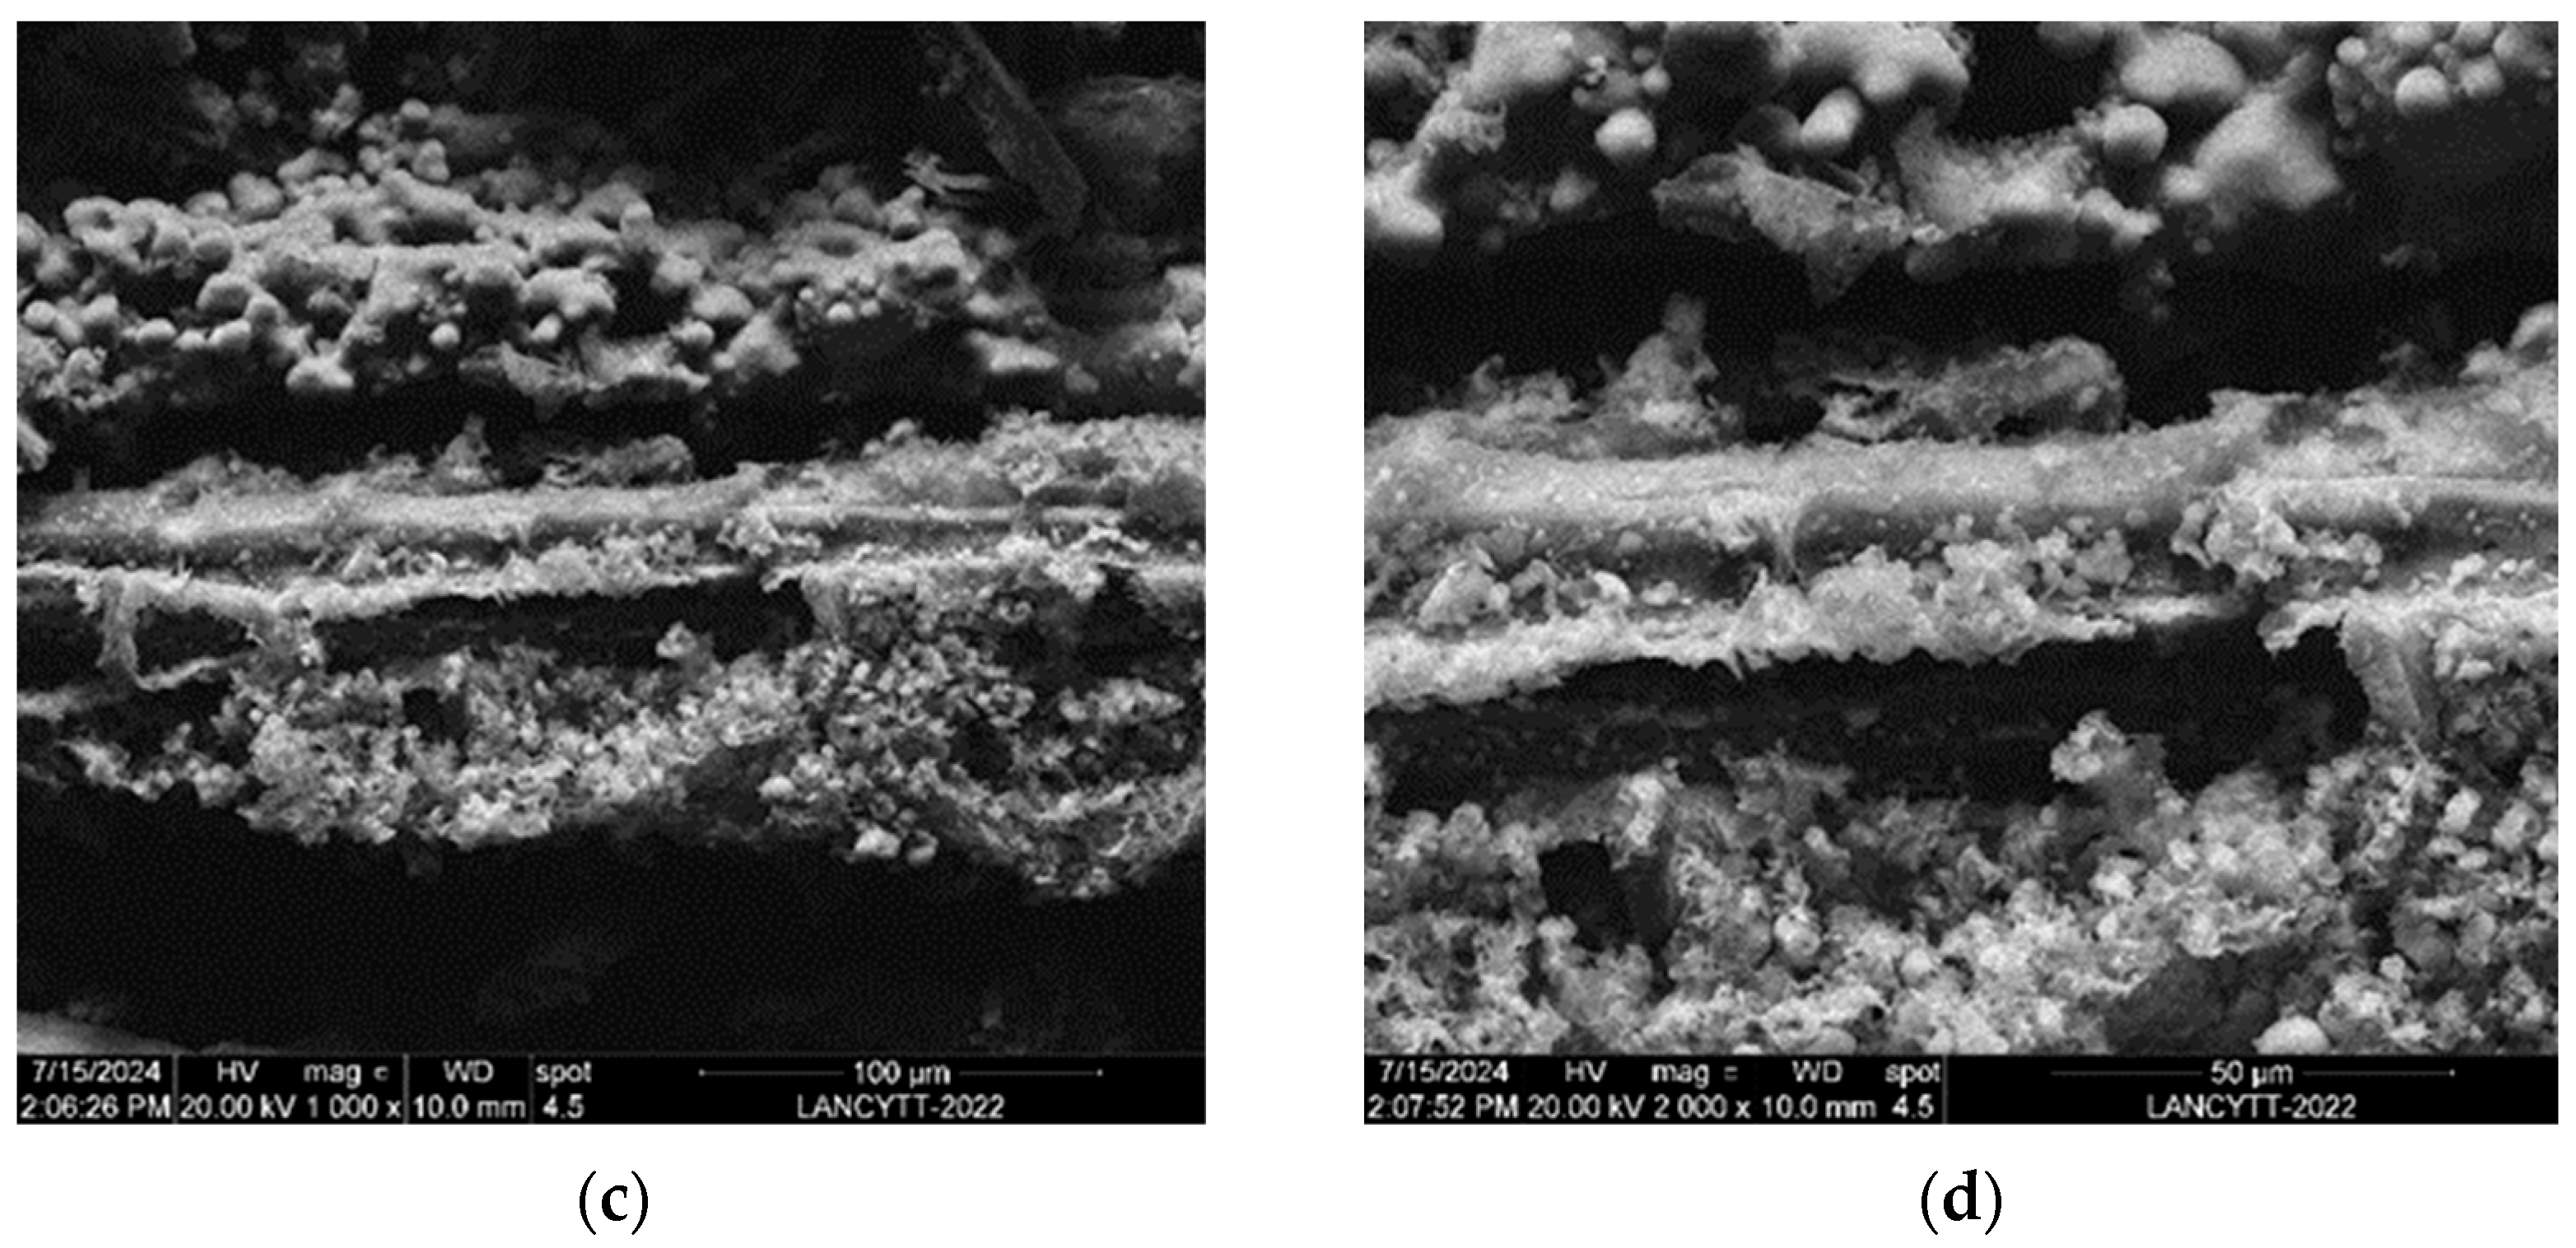
Figure 13 (Section 1) and Figure 14 (Section 2) show the photomicrographs of the hydrochar samples after Pb2+ adsorption. They show that the morphology of the material particles maintains its irregular shape and presents a porous and elongated structure.
The SEM micrographs reveal that the hydrochar obtained at 180 °C exhibits a predominantly porous and irregular surface morphology, with sponge-like textures and some spherical or semi-spherical structures. These morphological features can be attributed to the thermochemical conversion of lignocellulosic biomass during the hydrothermal carbonization (HTC) process, which involves the partial decomposition of structural polymers such as cellulose, hemicellulose, and lignin. As reported by Martín-Lorenzo et al., 2025 [50], formation of spherical particles is frequently observed on the surface of hydrochar, which is a common phenomenon during HTC of lignocellulosic materials. This is mainly due to the thermal degradation of hemicellulose and cellulose, which generates partially water-soluble compounds such as furfural, levulinic acid, and formic acid. These intermediate compounds undergo polycondensation reactions, leading to the formation of carbon-rich microspheres of various shapes and sizes. The presence of such microspheres in the 180 °C hydrochar supports the occurrence of these mechanisms under the applied synthesis conditions.
The chemical transformations that occur during hydrothermal carbonization include the degradation of soluble compounds and the polymerization of lignocellulosic monomers, resulting in carbon-rich structures with microsphere-like morphologies. Moreover, the biomass-to-water ratio plays a significant role in the morphological development of the final hydrochar. Specifically, more diluted ratios—such as the one used in this study (5 g biomass/50 mL deionized water)—have been associated with greater porosity and surface cracking, as the higher water content enhances heat and mass transfer in the reaction medium [51].
In this context, the anatomical characteristics of sugarcane tip biomass, which is defined by a fibrovascular and medullary structure with high water retention capacity, likely favored the observed formation of porous, sponge-like particles. This morphology, in turn, may explain the superior adsorption performance of the hydrochar in Pb2+ adsorption experiments by facilitating greater accessibility to active sites and an increased surface area.
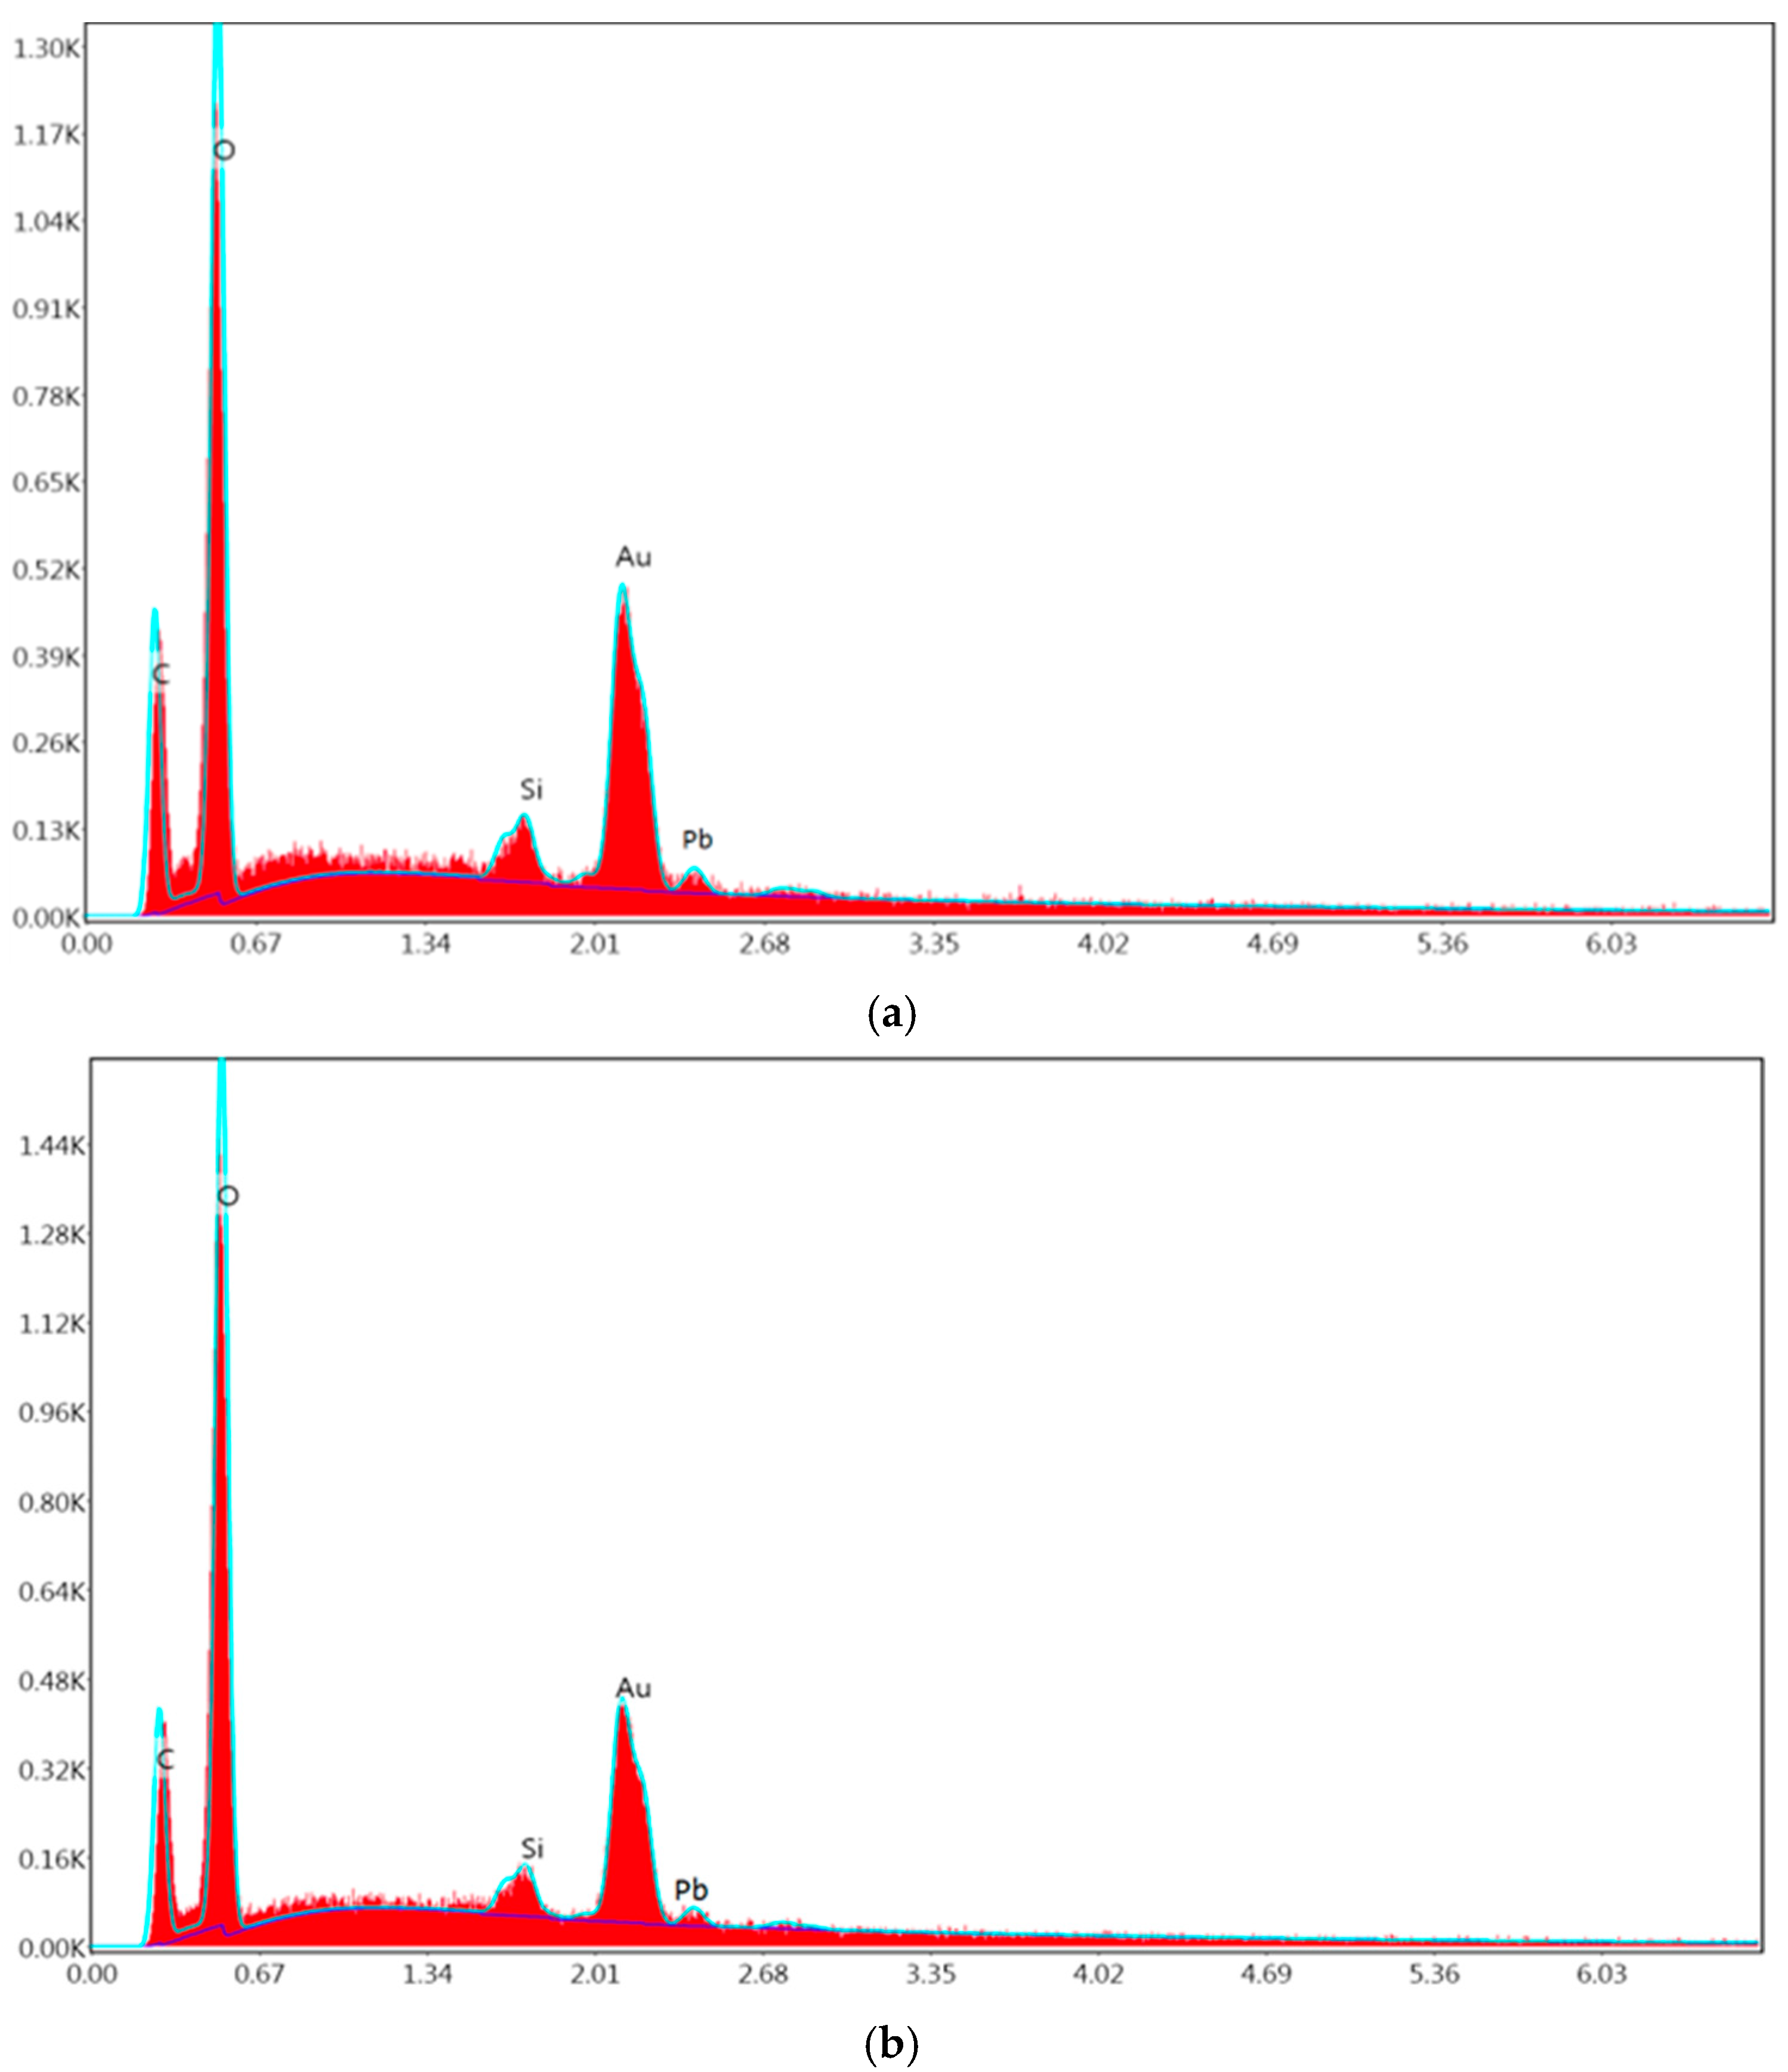
Figure 15a,b shows the spectrograms of the adsorbents with the presence of lead analyzed in duplicate by HTC at 180 °C, where the corresponding signals of the various elements are observed: C, O, Si, Au, and Pb. The presence of the lead was confirmed in both EDAX runs.
It is also observed in the spectrograms that the appearance of the characteristic peaks of the presence of lead is found in the range of energy values of 2.4 keV and 0.10 K. In the case of lead, the transition energies appear in the Lα peak around 10.551 keV; this is one of the highest and strongest peaks, and it is crucial to identify this metal. The peaks of the Mα series appear at lower energies, around 2.342 keV. These peaks are useful to detect lead at lower energies [52].

3.7. Proposed Adsorption Mechanism Based on Experimental Evidence

The potential mechanisms governing Pb2+ adsorption onto hydrochar derived from sugarcane tip biomass include electrostatic attraction and ion exchange. The initial FTIR-ATR and TGA analyses of the sugarcane tip biomass further support these proposed mechanisms by confirming the presence of oxygen-containing functional groups and suitable thermal behavior for hydrochar formation under the selected synthesis conditions. The analysis of active sites revealed a significant increase in acidic functional groups (lactonic, phenolic, and carboxylic) after hydrothermal carbonization, which are known to interact with divalent metal ions. The point of zero charge (PZC) determined for the hydrochar indicates a negatively charged surface at pH 5, favoring electrostatic interactions with Pb2+ [18]. Furthermore, SEM images taken after adsorption revealed morphological changes—such as open, fractured, and whitish surface structures—that suggest the physical retention of lead. This observation is corroborated by EDAX analysis, which confirmed the presence of Pb on the hydrochar surface, showing characteristic peaks at approximately 2.4 keV and 0.10 K.

4. Conclusions

ST biomass residues from Saccharum officinarum L. may be an alternative to consider for the development of adsorbent materials for environmental remediation. Sugarcane tip hydrochar has acidic characteristics on its surface, with the presence of mainly lactone, phenolic, and carboxylic groups. The treatment applied to the natural sugarcane tip biomass by hydrothermal carbonization increased the amount of acidic active sites from 1.3950 to 3.8543 meq g−1, which is considered a positive finding for the objective stated in the research. Regarding the study of the ST hydrochar charging point, the analyses suggest that the surface charge of the hydrochar became more negative with an increasing pH of the solution. These results demonstrate that the variation in the distribution with respect to the zero charge point of the materials is attributed to the electrostatic attraction to the negatively charged surface of the hydrochars, which explains the adsorption mechanisms for this study by ion exchange and electrostatic attractions. For the experimentation of the hydrochar adsorption equilibrium, the ST HTC 180 °C demonstrated greater efficiency. The residual concentration of Pb2+ decreased rapidly during the first 15 min and remained virtually constant up to 120 min. The adsorption capacity stabilized at 4.9 mg g−1 after 15 min for the initial 100 mg L−1 solution. The ST HTC 180 °C showed more consistent values with the lowest variability for Pb2+ removal in aqueous solutions at temperatures of 25 °C and a pH of 5. Scanning electron microscopy (SEM) analysis showed that the ST hydrochar has a fibrous structure with irregular, grooved, rough amorphous particles, and has cracked spongy particles. This structure does not change in shape with the adsorption of Pb2+; however, it is perceived that the spongy particles are open and fractured and are whitish in color, which suggests that this is due to the fixation of the metal on the surface of the hydrochar. These structures could allow the reception of other elements that enhance the adsorption capacity of the material. In the evaluation of the spectrograms by EDAX, it was observed that Pb2+ is present in the energy value range of 2.4 keV and 0.10 K. It was also observed that in the components of the hydrochar, there are silicates that can influence the porous structure of the material and help to form a more stable and resistant porous matrix. Although ST hydrochar showed effective adsorption of Pb2+, its regeneration and reusability were not evaluated in this study. Additionally, the adsorption performance was assessed in a single-cation system using a certified lead standard solution. Therefore, further investigation is needed to evaluate both the material’s adsorption efficiency over multiple regeneration cycles and its performance in multi-ion systems, which are more representative of real wastewater conditions. The absence of spectroscopic characterization before and after adsorption is a limitation that should be addressed in future studies to confirm the specific chemical interactions involved. In addition, future work should include a systematic kinetic evaluation (e.g., pseudo-first/second-order and intraparticle diffusion analyses across a broader C0 range) to decouple film-diffusion effects from intrinsic site heterogeneity. Finally, a complete thermodynamic analysis was not conducted due to the scope of this study being limited to constant temperature and pH; thus, future research should explore the thermodynamics of the process under varying conditions to improve understanding of system behavior.

Author Contributions

Conceptualization: D.C.A.-P., C.C.-Á., H.L.-M., C.W.-A. and C.M.-M.; methodology: D.C.A.-P., C.C.-Á., H.L.-M., C.W.-A. and C.M.-M.; software: H.L.-M. and D.C.A.-P.; validation: D.C.A.-P., C.C.-Á., H.L.-M., C.W.-A. and C.M.-M.; formal analysis: D.C.A.-P., C.C.-Á. and C.W.-A.; investigation:, D.C.A.-P., C.C.-Á., H.L.-M., C.W.-A. and C.M.-M.; resources: D.C.A.-P. and C.C.-Á.; data curation: D.C.A.-P. and H.L.-M.; writing—original draft preparation: D.C.A.-P., H.L.-M. and C.W.-A.; writing—review and editing: D.C.A.-P., C.C.-Á., H.L.-M. and C.W.-A.; visualization: D.C.A.-P., H.L.-M. and C.M.-M.; supervision: D.C.A.-P. and C.C.-Á.; project administration: D.C.A.-P.; funding acquisition: D.C.A.-P., C.C.-Á., H.L.-M., C.W.-A. and C.M.-M. All authors have read and agreed to the published version of the manuscript.

Funding

This research was funded by the Call for Scientific Research, Technological Development and Innovation Projects of the National Institute of Technology of Mexico 2025, through the project: “Hydrothermal carbonization of sugarcane biomass (Saccharum officinarum L.): innovation for water remediation and agricultural productivity” Key 22210.25-P.

Institutional Review Board Statement

Not applicable.

Informed Consent Statement

Not applicable.

Data Availability Statement

The original contributions presented in the study are included in the article, further inquiries can be directed to the corresponding author.

Conflicts of Interest

The authors declare no conflicts of interest.

References

  1. Kambo, H.S.; Dutta, A. A comparative review of biochar and hydrochar in terms of production, physico-chemical properties and applications. Renew. Sustain. Energy Rev. 2015, 45, 359–378. [Google Scholar] [CrossRef]
  2. Brito, G.M.; Cipriano, D.F.; Schettino, M.Â.; Cunha, A.G.; Coelho, E.R.C.; Freitas, J.C.C. One-Step Methodology for Preparing Physically Activated Biocarbons from Agricultural Biomass Waste. Environ. Chem. Eng. 2019, 7, 103113. [Google Scholar] [CrossRef]
  3. Hoang, A.T.; Kumar, S.; Lichtfouse, E.; Cheng, C.K.; Varma, R.S.; Senthilkumar, N.; Nguyen, P.Q.P.; Nguyen, X.P. Remediation of Heavy Metal Polluted Waters Using Activated Carbon from Lignocellulosic Biomass: An Update of Recent Trends. Chemosphere 2022, 302, 134825. [Google Scholar] [CrossRef] [PubMed]
  4. Abdelhafez, A.A.; Li, J. Removal of Pb (II) from Aqueous Solution by Using Biochars Derived from Sugar Cane Bagasse and Orange Peel. J. Taiwan Inst. Chem. Eng. 2016, 61, 367–375. [Google Scholar] [CrossRef]
  5. Ezeonuegbu, B.A.; Machido, D.A.; Whong, C.M.Z.; Japhet, W.S.; Alexiou, A.; Elazab, S.T.; Qusty, N.; Yaro, C.A.; Batiha, G.E.S. Agricultural Waste of Sugarcane Bagasse as Efficient Adsorbent for Lead and Nickel Removal from Untreated Wastewater: Biosorption, Equilibrium Isotherms, Kinetics and Desorption Studies. Biotechnol. Rep. 2021, 30, e00614. [Google Scholar] [CrossRef]
  6. Secretaría de Agricultura y Desarrollo Rural. Planeación Agrícola Nacional 2017–2030. Gobierno de México. 2017. Available online: https://www.gob.mx/agricultura/acciones-y-programas/planeacion-agricola-nacional-2017-2030-126813 (accessed on 15 March 2024).
  7. Servicio de Información Agroalimentaria y Pesquera (SIAP). Sistema de Información Agroalimentaria de Consulta (SIACON). Gobierno de México. 2023. Available online: https://www.gob.mx/agricultura/dgsiap/prensa/sistema-de-informacion-agroalimentaria-de-consulta-siacon?idiom=es (accessed on 20 March 2024).
  8. Aguilar, R.N. Value Chain of the Diversification of the Sugar Cane Agroindustry in México. Agroproductividad 2017, 10, 21–27. [Google Scholar]
  9. Sampaio, I.L.M.; Cardoso, T.F.; Souza, N.R.D.; Watanabe, M.D.B.; Carvalho, D.J.; Bonomi, A.; Junqueira, T.L. Electricity Production from Sugarcane Straw Recovered Through Bale System: Assessment of Retrofit Projects. BioEnergy Res. 2019, 12, 865–877. [Google Scholar] [CrossRef]
  10. Funke, A.; Ziegler, F. Hydrothermal Carbonization of Biomass: A Summary and Discussion of Chemical Mechanisms for Process Engineering. Biofuels 2010, 4, 160–177. [Google Scholar] [CrossRef]
  11. Biller, P.; Ross, A.B. Hydrothermal Processing of Algal Biomass for the Production of Biofuels and Chemicals. Biofuels 2012, 3, 603–623. [Google Scholar] [CrossRef]
  12. Wang, T.; Yunbo, Z.; Zhu, Y.; Caiting, L.; Guangming, Z. A Review of the Hydrothermal Carbonization of Biomass Waste for Hydrochar Formation: Process Conditions, Fundamentals, and Physicochemical Properties. Renew. Sustain. Energy Rev. 2018, 90, 223–247. [Google Scholar] [CrossRef]
  13. Malool, M.E.; Keshavarz, M.; Shayegan, J. Co-hydrothermal Carbonization of Digested Sewage Sludge and Sugarcane Bagasse: Integrated Approach for Waste Management, Optimized Production, Characterization and Pb(II) Adsorption. Alexandria Eng. J. 2023, 74, 79–105. [Google Scholar] [CrossRef]
  14. Izquierdo, S.; Pacheco, N.; Durán-Valle, C.J.; López-Coca, I.M. From Waste to Resource: Utilizing Sweet Chestnut Waste to Produce Hydrothermal Carbon for Water Decontamination. C 2023, 9, 57. [Google Scholar] [CrossRef]
  15. Koprivica, M.; Simić, M.; Petrović, J.; Ercegović, M.; Dimitrijević, J. Evaluation of Adsorption Efficiency on Pb(II) Ions Removal Using Alkali-Modified Hydrochar from Paulownia Leaves. Processes 2023, 11, 1327. [Google Scholar] [CrossRef]
  16. Khushk, S.; Zhang, L.; Li, A.; Irfan, M.; Zhang, X. Microwave-Assisted Hydrothermal Carbonization of Furfural Residue for Adsorption of Cr(VI): Adsorption and Kinetic Study. Pol. J. Environ. Stud. 2020, 29, 1671–1681. [Google Scholar] [CrossRef] [PubMed]
  17. Prasannamedha, G.; Senthil Kumar, P.; Mehala, R.; Sharumitha, T.J.; Surendhar, D. Enhanced Adsorptive Removal of Sulfamethoxazole from Water Using Biochar Derived from Hydrothermal Carbonization of Sugarcane Bagasse. J. Hazard. Mater. 2021, 407, 124825. [Google Scholar] [CrossRef] [PubMed]
  18. Malool, M.E.; Keshavarz Moraveji, M.; Shayegan, J. Optimized Production, Pb(II) Adsorption and Characterization of Alkali Modified Hydrochar from Sugarcane Bagasse. Sci. Rep. 2021, 11, 22328. [Google Scholar] [CrossRef]
  19. Dos Santos, W.N.L.; Cavalcante, D.D.; da Silva, E.G.P.; das Virgens, C.F.; de Souza Dias, F. Biosorption of Pb(II) and Cd(II) ions by Agave sisalana (sisal fiber). Microchem. J. 2011, 97, 269–273. [Google Scholar] [CrossRef]
  20. Medellín, N.A.; Hernández, M.G.; Salazar, J.J.; Labrada, G.J.; Aragón, A. Bioadsorción de Plomo (II) Presente en Solución Acuosa sobre Residuos de Fibras Naturales Procedentes de la Industria Ixtlera (Agave lechuguilla Torr. y Yucca carnerosana). Rev. Int. Contam. Ambient. 2017, 33, 269–280. [Google Scholar] [CrossRef]
  21. Xiang, A.; Ebdon, J.R.; Horrocks, A.R.; Kandola, B.K. On the Utility of Thermogravimetric Analysis for Exploring the Kinetics of Thermal Degradation of Lignins. Bioresour. Technol. Rep. 2022, 20, 101214. [Google Scholar] [CrossRef]
  22. Karn, A.; Thakur, S.; Shrestha, B. Extraction and Characterization of Cellulose from Agricultural Residues: Wheat Straw and Sugarcane Bagasse. J. Nepal Chem. Soc. 2022, 43, 89–94. [Google Scholar] [CrossRef]
  23. Sofana, I.; Wijayanti, W.; Hamidi, N. Study of Thermal Behavior in Mixed Scrap Tires (ST) and Polypropylene (PP) Plastic Using Thermogravimetry Analysis (TGA) and Differential Scanning Calorimetry (DSC). Int. J. Mech. Eng. Technol. Appl. 2022, 7, 122–129. [Google Scholar] [CrossRef]
  24. González, J.; Sánchez, M.E.; Martínez, E.J.; Covalski, C.; Alonso-Simón, A.; González, R.; Cara, J. Hydrothermal Carbonization of Olive Tree Pruning as a Sustainable Way for Improving Biomass Energy Potential: Effect of Reaction Parameters on Fuel Properties. Processes 2020, 8, 1201. [Google Scholar] [CrossRef]
  25. Garrido, R.A.; Lagos, C.; Luna, C.; Sánchez, J.; Díaz, G. Study of the Potential Uses of Hydrochar from Grape Pomace and Walnut Shells Generated from Hydrothermal Carbonization as an Alternative for the Revalorization of AgriWaste in Chile. Sustainability 2021, 13, 12600. [Google Scholar] [CrossRef]
  26. ISO 18134-3:2015; Solid Biofuels—Determination of Moisture Content. Oven Dry Method. ISO (International Organization for Standardization): Geneva, Switzerland, 2015.
  27. ISO 18122:2022; Solid Biofuels—Determination of Ash Content. ISO (International Organization for Standardization): Geneva, Switzerland, 2022.
  28. ISO 18123:2023; Solid Biofuels—Determination of Volatile Matter. ISO (International Organization for Standardization): Geneva, Switzerland, 2023.
  29. Mahmood-ul-Hassan, M.; Suthar, V.; Rafique, E.; Ahmad, R.; Yasin, M. Kinetics of cadmium, chromium, and lead sorption onto chemically modified sugarcane bagasse and wheat straw. Environ. Monit. Assess. 2015, 187, 470. [Google Scholar] [CrossRef]
  30. Wang, J.; Guo, X. Adsorption Isotherm Models: Classification, Physical Meaning, Application and Solving Method. Chemosphere 2020, 258, 127279. [Google Scholar] [CrossRef]
  31. Hummadi, K.K.; Luo, S.; He, S. Adsorption of Methylene Blue Dye from the Aqueous Solution via Bio-adsorption in the Inverse Fluidized-Bed Adsorption Column Using the Torrefied Rice Husk. Chemosphere 2022, 287 Pt 1, 131907. [Google Scholar] [CrossRef]
  32. Boehm, H.P. Some aspects of the surface chemistry of carbon blacks and other carbons. Carbon 1994, 32, 759–769. [Google Scholar] [CrossRef]
  33. Tan, X.; Liu, Y.; Zeng, G.; Wang, X.; Hu, X.; Gu, Y.; Yang, Z. Application of Biochar for the Removal of Pollutants from Aqueous Solutions. Chemosphere 2015, 125, 70–85. [Google Scholar] [CrossRef]
  34. Cruz, S.A.; Medellín, N.A.; Torres, A. Bone Char from an Invasive Aquatic Specie as a Green Adsorbent for Fluoride Removal in Drinking Water. Water Air Soil Pollut. 2021, 232, 346. [Google Scholar] [CrossRef]
  35. Kumar, A.; Negi, Y.S.; Choudhary, V.; Bhardwaj, N.K. Characterization of Cellulose Nanocrystals Produced by Acid-Hydrolysis from Sugarcane Bagasse as Agro-Waste. J. Mater. Phys. Chem. 2014, 2, 1–8. [Google Scholar] [CrossRef]
  36. Kumari, S.; Das, D. Biohythane Production from Sugarcane Bagasse and Water Hyacinth: A Way towards Promising Green Energy Production. J. Clean. Prod. 2019, 207, 689–701. [Google Scholar] [CrossRef]
  37. Mohammed, I.Y.; Kabir, G.; Abakr, Y.A.; Apasiku, M.A.A.; Kazi, F.K.; Abubakar, L.G. Bioenergy Potential of Millet Chaff via Thermogravimetric Analysis and Combustion Process Simulation Using Aspen Plus. Clean. Chem. Eng. 2022, 3, 100046. [Google Scholar] [CrossRef]
  38. Rueda-Ordóñez, Y.J.; Tannous, K. Drying and Thermal Decomposition Kinetics of Sugarcane Straw by Nonisothermal Thermogravimetric Analysis. Bioresour. Technol. 2018, 264, 131–139. [Google Scholar] [CrossRef]
  39. Wang, J.; Zhang, S.; Wei, C.; Hou, H.; Song, G.; Cao, L.; Zhang, J. Hydrothermal Carbonization of Heavy Metal-Contaminated Biomass: Migration, Transformation, and Ecological Stability Changes of Metals. Int. J. Mol. Sci. 2025, 26, 2551. [Google Scholar] [CrossRef]
  40. Parshetti, G.K.; Hoekman, S.K.; Balasubramanian, R. Chemical, Structural and Combustion Characteristics of Carbonaceous Products Obtained by Hydrothermal Carbonization of Palm Empty Fruit Bunches. Bioresour. Technol. 2013, 135, 683–689. [Google Scholar] [CrossRef]
  41. Devnath, B.; Khanal, S.; Shah, A.; Reza, T. Influence of Hydrothermal Carbonization (HTC) Temperature on Hydrochar and Process Liquid for Poultry, Swine, and Dairy Manure. Environments 2024, 11, 150. [Google Scholar] [CrossRef]
  42. Mendoza-Martinez, C.L.; Sermyagina, E.; Saari, J.; de Jesus, M.S.; Cardoso, M.; de Almeida, G.M.; Vakkilainen, E. Hydrothermal Carbonization of Lignocellulosic Agro-Forest Based Biomass Residues. Biomass Bioenergy 2021, 147, 106004. [Google Scholar] [CrossRef]
  43. Karim, A.A.; Martínez-Cartas, M.L.; Cuevas-Aranda, M. Production of Hydrochar Fuel by Microwave-Hydrothermal Carbonisation of Olive Pomace Slurry from Olive Oil Industry for Combustion Application. J. Anal. Appl. Pyrolysis 2024, 183, 106801. [Google Scholar] [CrossRef]
  44. Krysanova, K.O.; Krylova, A.Y.; Zaichenko, V.M.; Lavrenov, V.; Khaskhachikh, V. Influence of the parameters of the hydrothermal carbonization of the biomass on the biocoal obtained from peat. E3S Web Conf. 2019, 114, 07003. [Google Scholar] [CrossRef]
  45. Foo, K.Y.; Hameed, B.H. Insights into the Modeling of Adsorption Isotherm Systems. Chem. Eng. J. 2010, 156, 2–10. [Google Scholar] [CrossRef]
  46. Licursi, D.; Raspolli Galletti, A.M.; Bertini, B.; Ardemani, L.; Scotti, N.; Di Fidio, N.; Fulignati, S.; Antonetti, C. Design Approach for the Sustainable Synthesis of Sulfonated Biomass-Derived Hydrochars and Pyrochars for the Production of 5-(Hydroxymethyl)furfural. Sustain. Chem. Pharm. 2023, 35, 101216. [Google Scholar] [CrossRef]
  47. Guo, S.; Zhang, W.; Liu, Y.; Tan, S.; Cai, H.; Geng, J.; Liu, X. Effective Removal of Pb(II) from Multiple Cationic Heavy Metals—An Inexpensive Lignin-Modified Attapulgite. Sustainability 2024, 16, 5831. [Google Scholar] [CrossRef]
  48. Ho, Y.S.; McKay, G. Pseudo-second order model for sorption processes. Process Biochem. 1999, 34, 451–465. [Google Scholar] [CrossRef]
  49. Salazar, J.J.; Leyva, R. Novel biosorbent with high adsorption capacity prepared by chemical modification of white pine (Pinus durangensis) sawdust. Adsorption of Pb (II) from aqueous solutions. J. Environ. Manag. 2016, 169, 303–312. [Google Scholar] [CrossRef]
  50. Martín–Lorenzo, A.; Hoyos, M.; Álvarez–Gómez, A. The Influence of Hydrothermal Carbonization Parameters on the Textural and Physicochemical Properties of Highly Porous Activated Carbons Derived from Garlic Peel Biowaste. J. Anal. Appl. Pyrolysis 2025, 192, 107280. [Google Scholar] [CrossRef]
  51. Moreno-Chocontá, L.N.; Lozano-Pérez, A.S.; Guerrero-Fajardo, C.A. Evaluation of the Effect of Particle Size and Biomass-to-Water Ratio on the Hydrothermal Carbonization of Sugarcane Bagasse. ChemEngineering 2024, 8, 43. [Google Scholar] [CrossRef]
  52. Goldstein, J.I.; Newbury, D.E.; Michel, J.R.; Ritchie, N.W.; Scott, J.H.; Joy, D.C. Scanning Electron Microscopy and X-Ray Microanalysis, 4th ed.; Springer: Berlin/Heidelberg, Germany, 2018; 550p, ISBN 978-1-4939-6674-5. [Google Scholar]
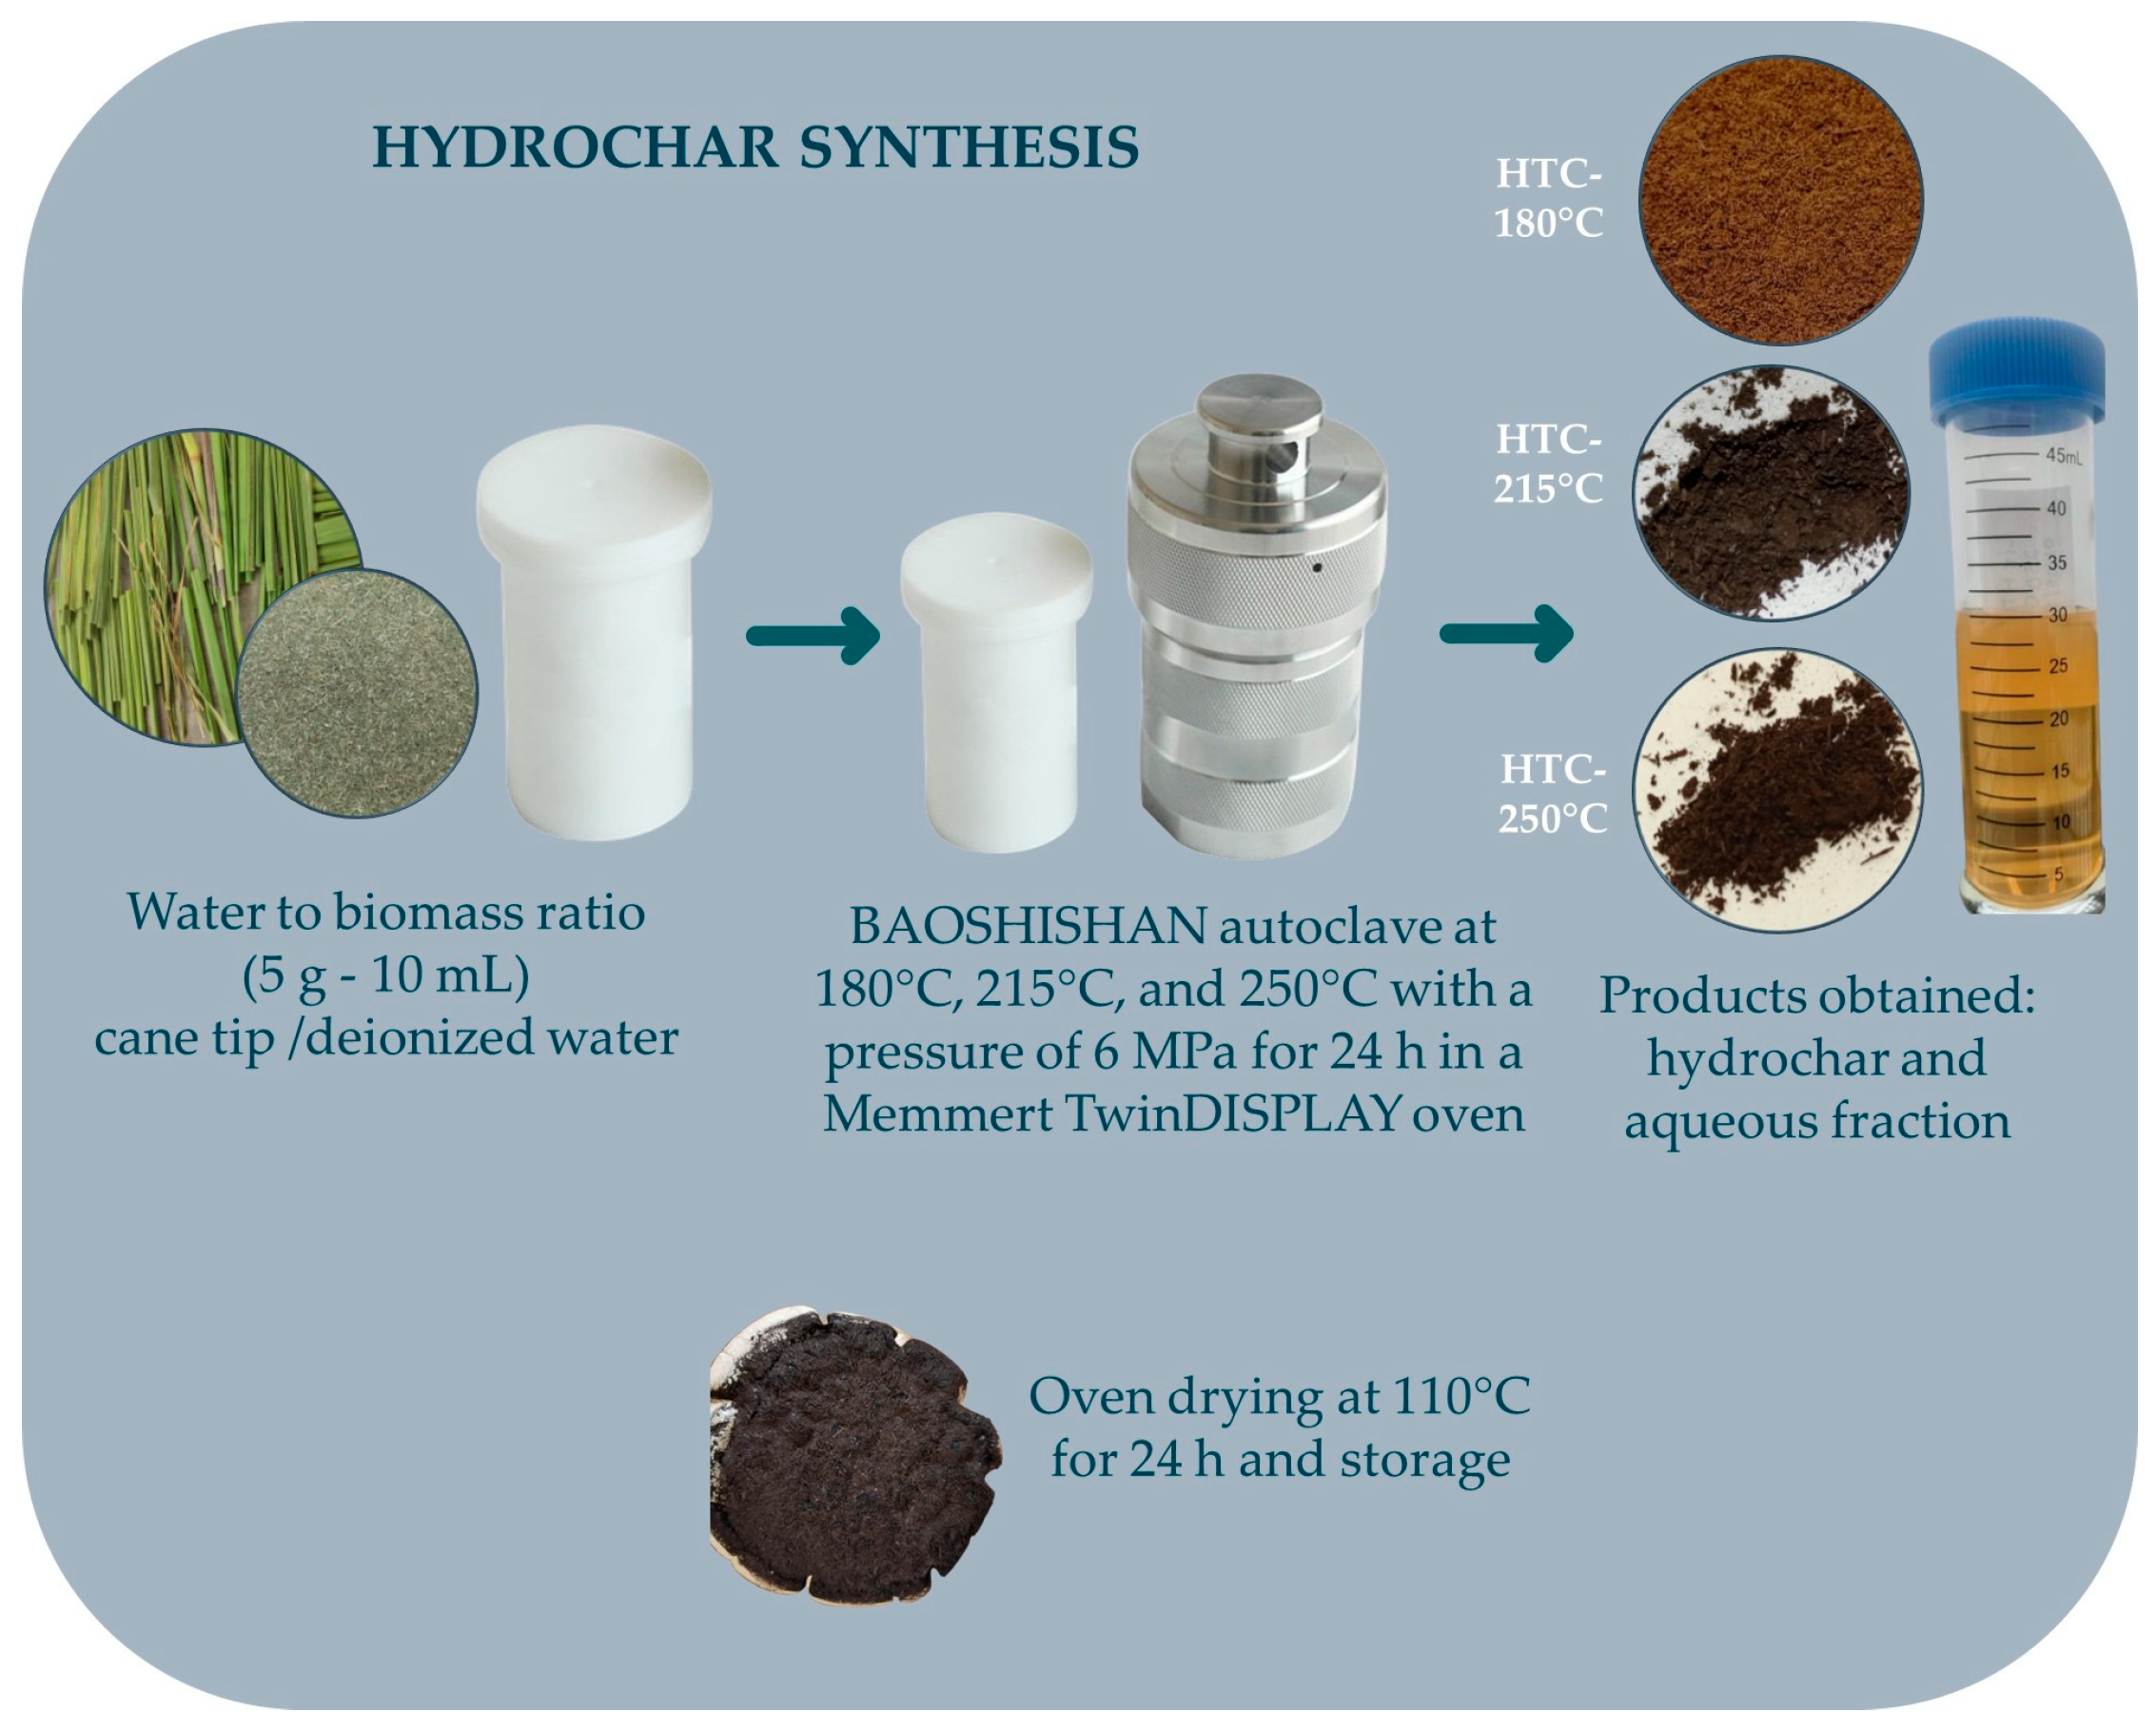
Figure 1. Sugarcane tip biomass hydrochar synthesis process (ST HTC).
Appliedchem 05 00024 g001
Figure 2. FTIR-ATR spectra of ST.
Appliedchem 05 00024 g002
Figure 3. Thermogravimetry of ST.
Appliedchem 05 00024 g003
Figure 4. Adsorption capacity qt of Pb2+ as a function of contact time for initial concentrations of 10, 25, 50, 75, and 100 mg L−1 in ST HTC 180 °C.
Appliedchem 05 00024 g004
Figure 5. Adsorption capacity qt of Pb2+ as a function of contact time for initial concentrations of 10, 25, 50, 75, and 100 mg L−1 in ST HTC 215 °C.
Appliedchem 05 00024 g005
Figure 6. Adsorption capacity qt of Pb2+ as a function of contact time for initial concentrations of 10, 25, 50, 75, and 100 mg L−1 in ST HTC 250 °C.
Appliedchem 05 00024 g006
Figure 7. Adsorption equilibrium data of Pb2+ fitted to (a) Freundlich, (b) Langmuir, and (c) Sips isotherm models for ST HTC 180 °C.
Appliedchem 05 00024 g007
Figure 8. Adsorption equilibrium data of Pb2+ fitted to (a) Freundlich, (b) Langmuir, and (c) Sips isotherm models for ST HTC 215 °C.
Appliedchem 05 00024 g008
Figure 9. Adsorption equilibrium data of Pb2+ fitted to (a) Freundlich, (b) Langmuir, and (c) Sips isotherm models for ST HTC 250 °C.
Appliedchem 05 00024 g009
Figure 10. Photomicrographs of the hydrochar (ST HTC 180 °C) from the sugarcane tip at different magnitudes: (a) 250×, (b) 500×, (c) 1000× and (d) 2000× Section 1.
Appliedchem 05 00024 g010
Figure 11. Photomicrographs of the hydrochar (ST HTC 180 °C) of the sugarcane tip at different magnitudes: (a) 250×, (b) 500×, (c) 1000× and (d) 2000× Section 2.
Appliedchem 05 00024 g011
Figure 12. Energy-dispersive X-ray (EDAX) spectrograms of the surface of the sugarcane tip hydrochar (ST HTC 180 °C).
Appliedchem 05 00024 g012
Figure 13. Photomicrographs of the sugarcane tip hydrochar (ST HTC 180 °C) after Pb2+ adsorption at different magnifications: (a) 250×, (b) 500×, (c) 1000× and (d) 2000× Section 1.
Appliedchem 05 00024 g013
Figure 14. Photomicrographs of the sugarcane tip hydrochar (ST HTC 180 °C) after Pb2+ adsorption at different magnifications: (a) 250×, (b) 500×, (c) 1000× and (d) 2000× Section 2.
Appliedchem 05 00024 g014aAppliedchem 05 00024 g014b
Figure 15. Energy-dispersive X-ray (EDAX) spectrograms of the sugarcane tip hydrochar (ST HTC 180 °C) surface after Pb2+ adsorption (a,b).
Appliedchem 05 00024 g015
Table 1. Yields of synthesis of sugarcane tip hydrochar (ST HTC).
ST
HTC
Temperature
(°C)
Time
(h)
Hydrochar Yield
(%R HYR)
Aqueous Fraction Yield
(% R AF)
11802464.2133.45
21802459.1139.82
31802460.7336.63
41802465.1633.45
52152444.9747.78
62152441.3255.75
72152443.3652.56
82152443.2054.15
92502441.8858.93
102502436.4062.12
112502438.2360.52
122502439.9860.36
Table 2. Proximate analysis of sugarcane tip hydrochar (ST HTC).
ST
HTC
Moisture
(%)
Ash
(%)
Volatile
Matter
(%VM)
Fixed
Carbon
(%CF)
180 °C0.572.8683.0913.48
215 °C0.625.4871.3422.56
250 °C0.136.6660.1933.02
Table 3. Adsorption equilibrium data of Pb2+ on hydrochars synthesized at different HTC temperatures.
ST
HTC (°C)
C0
(mg L−1)
Ce
(mg L−1)
qt
(mg g−1)
ST
HTC (°C)
C0
(mg L−1)
Ce
(mg L−1)
qt
(mg g−1)
ST
HTC (°C)
C0
(mg L−1)
Ce
(mg L−1)
qt
(mg g−1)
180100.240.49215103.830.31250104.040.30
180251.091.20215254.801.01250255.660.97
180502.042.40215506.522.17250506.592.17
180753.293.59215758.093.35250758.063.35
1801003.704.902151008.424.582501009.664.52
Table 4. Concentration of total active sites present in ST biomass and ST HTC 180 °C.
SampleLactonic Sites
(meq g−1)
Carboxylic Sites
(meq g−1)
Phenolic Sites
(meq g−1)
Total Acid Sites (meq g−1)Total Basic Sites
(meq g−1)
Point Zero Charge
(PZC)
ST0.21360.09961.08171.39500.14336.9
ST HTC 180 °C1.87170.88661.09583.85430.17575.0
Disclaimer/Publisher’s Note: The statements, opinions and data contained in all publications are solely those of the individual author(s) and contributor(s) and not of MDPI and/or the editor(s). MDPI and/or the editor(s) disclaim responsibility for any injury to people or property resulting from any ideas, methods, instructions or products referred to in the content.