
Group Contribution Revisited: The Enthalpy of Formation of Organic Compounds with “Chemical Accuracy” Part VI


Abstract
1. Introduction
j = 1,N
2. Materials and Methods
2.1. Experimental Data
2.2. Computational Methods
3. Results
3.1. The Group Contribution Method with Chemical Accuracy
3.2. Further Classes of Molecules
3.2.1. Acetals
3.2.2. Benzyl Ethers
3.2.3. Bicyclic Hydrocarbons
3.2.4. Alkanediols and Glycerol
3.2.5. Polycyclic Aromatic Hydrocarbons

| Polycyclic Aromatic Hydrocarbons | Experiment | GC Model | GC Model-Exp | ABS (GC Model-Exp) |
|---|---|---|---|---|
| biphenyl | 180.3 ± 3.3 | 181 | 0.70 | 0.7 |
| diphenylmethane | 165 | 160.4 | −4.63 | 4.6 |
| triphenylmethane | 276.1 | 267.5 | −8.60 | 8.6 |
| tetraphenylmethane | 398.1 ± 6.9 | 361 | −37.10 | 37.1 |
| p-terphenyl | 284.4 ± 3.8 | 284 | −0.40 | 0.4 |
| o-terphenyl | 282.8 ± 3.2 | 284 | 1.20 | 1.2 |
| m-terphenyl | 280. ± 3.9 | 284 | 4.00 | 4.0 |
| 1,3,5-triphenylbenzene | 371.8 ± 3.8 | 374 | 2.20 | 2.2 |
| p-tetraphenyl | 400. ± 11 | 387 | −13.00 | 13.0 |
| averaged absolute difference | 7.98 | |||
| averaged absolute difference with two tetraphenyl-containing species disregarded | 3.10 |
| Polycyclic Aromatic Hydrocarbons | Experiment [39] | G4 [18] | GC Model |
|---|---|---|---|
| Indene | 161.2 ± 2.3 | 158.2 | |
| Anthracene | 229.4 ± 2.9 | 221 | |
| naphthacene | 342.6 ± 5.9 | ||
| phenanthrene | 202.2 ± 2.3 | 197.9 | |
| Fluorene | 176.7 ± 3.1 | 180.6 | |
| 175.0 ± 1.5 [42] | |||
| pyrene | 225.5 ± 2.5 | 213.9 | |
| perylene | 318.3 ± 3.7 | ||
| triphenylene | 270.1 ± 4.4 | 255.8 | |
| bianthracene | 475 | 470.8 |
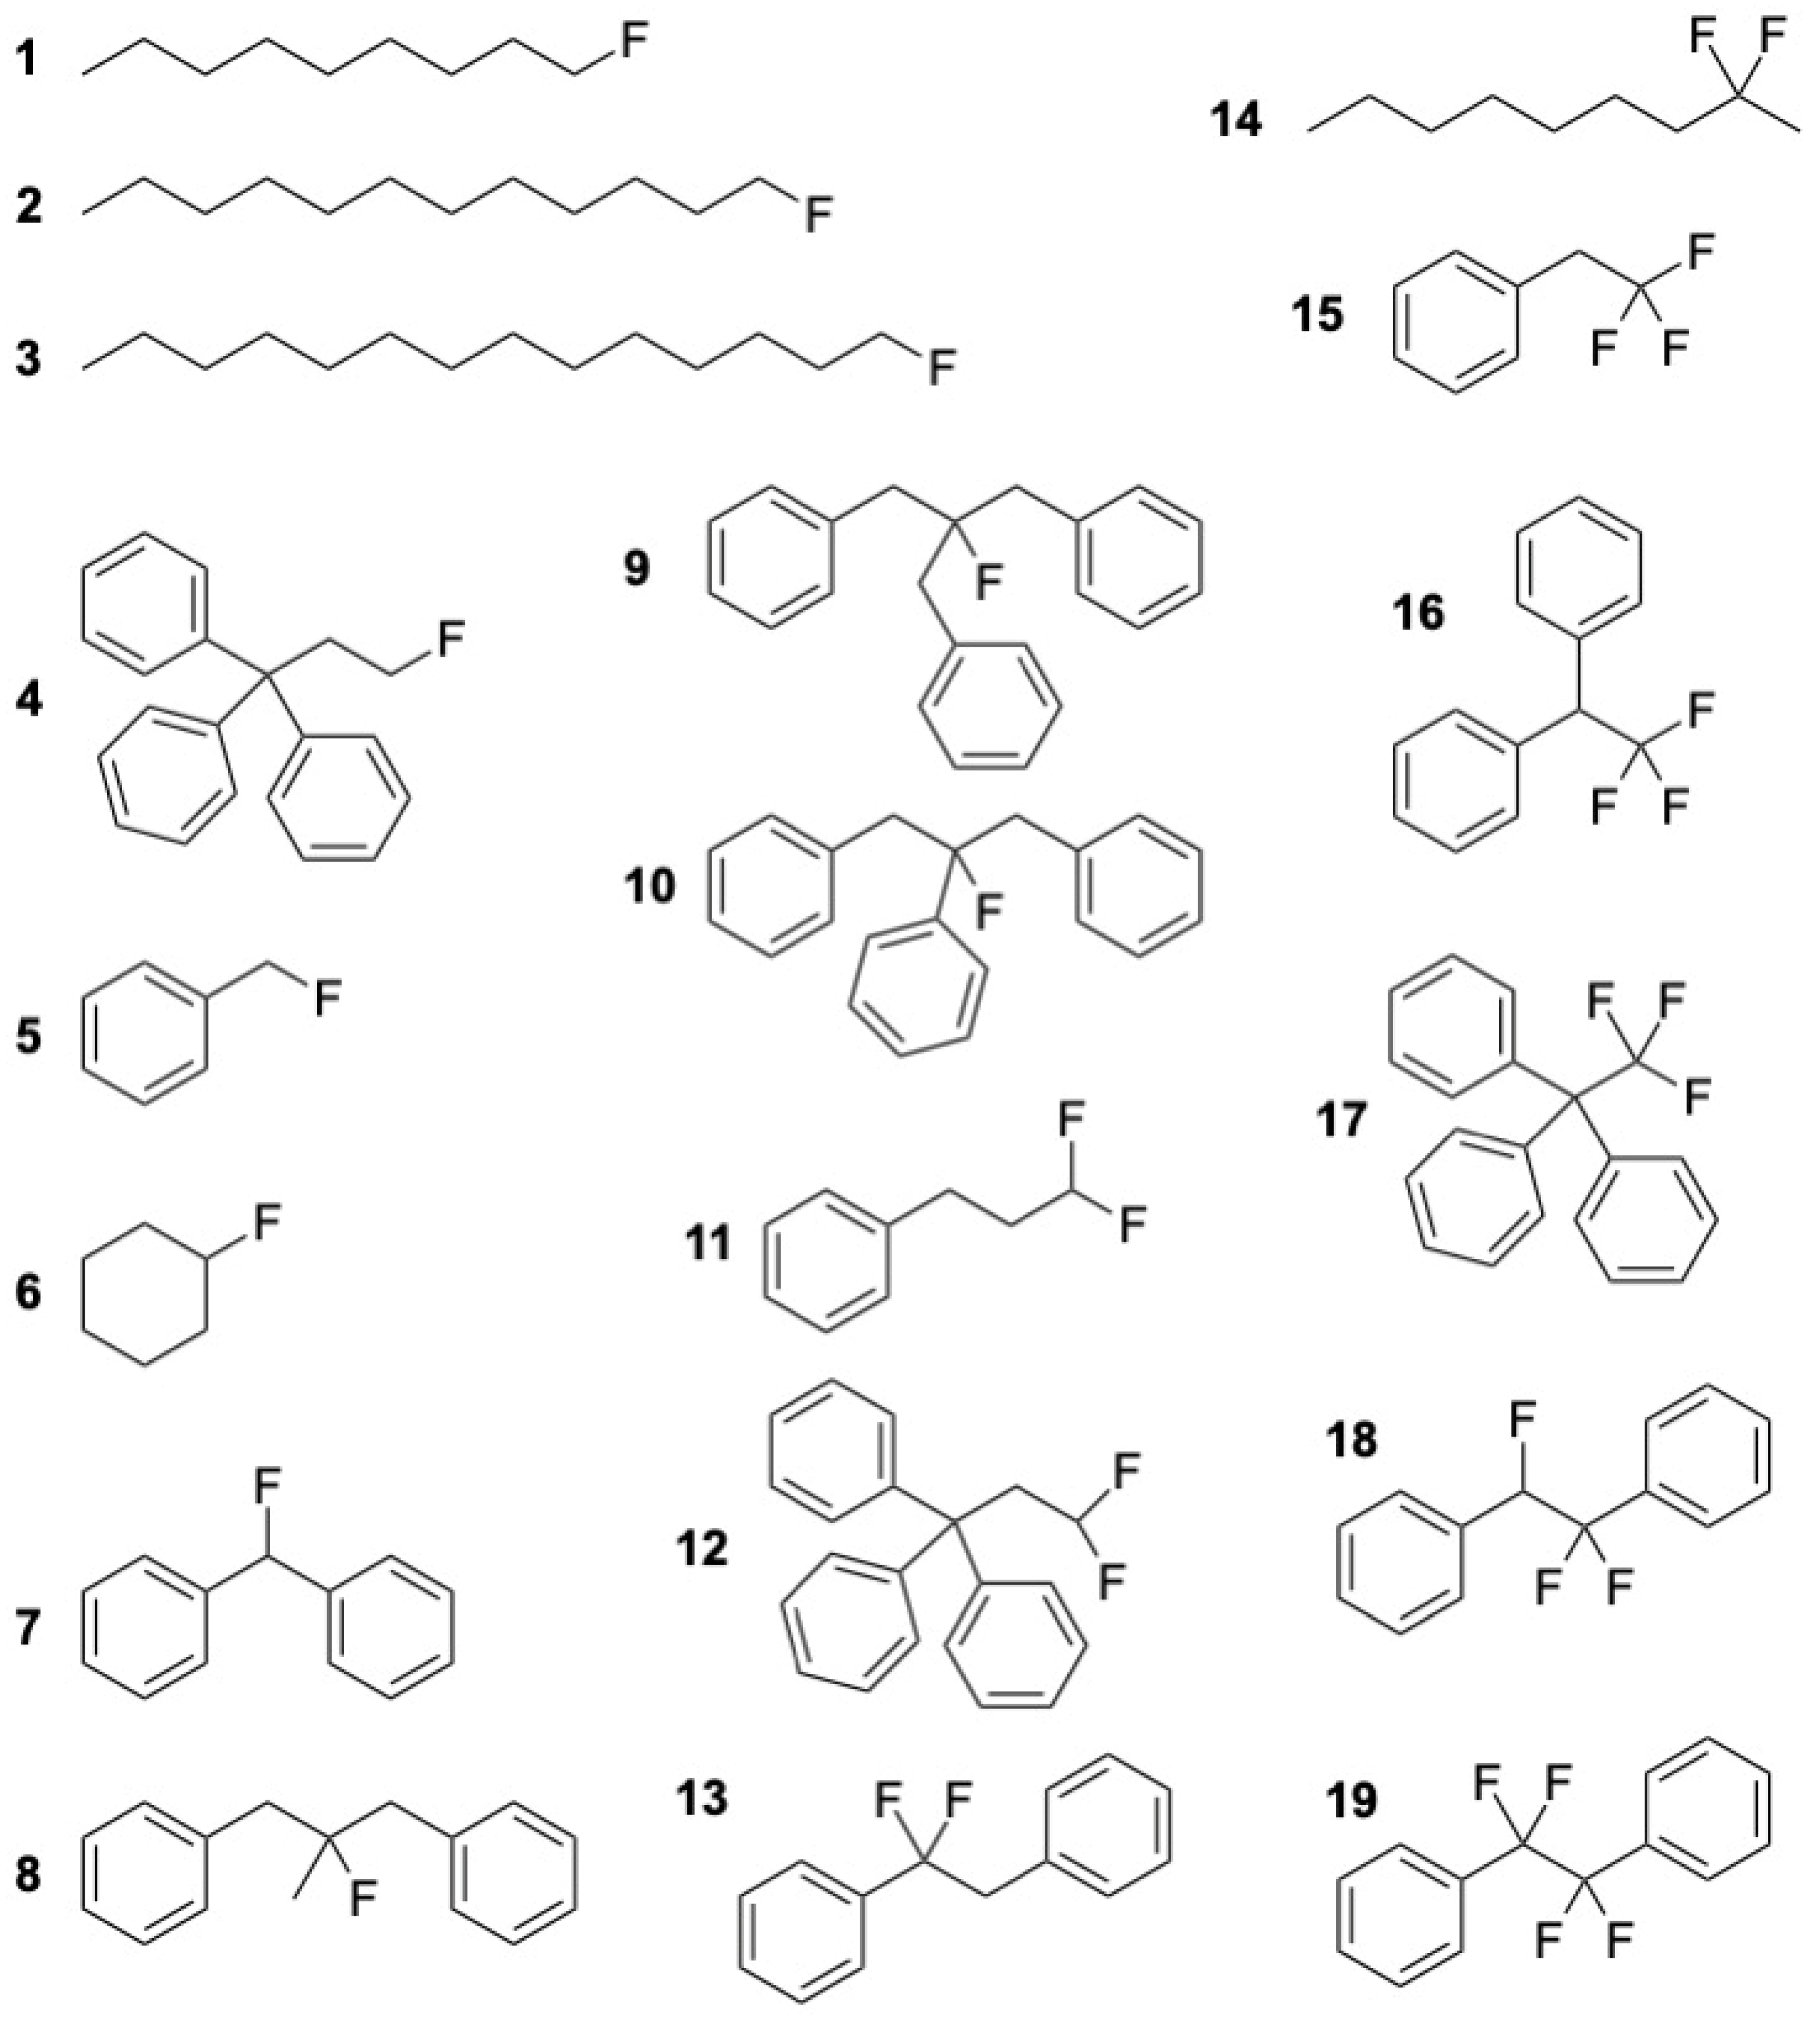
3.2.6. Aromatic Fluoro Compounds
3.3. Further Examples
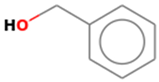
3.3.1. Benzylalcohol
3.3.2. β-Alanine

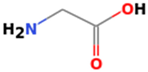
3.3.3. Glycine
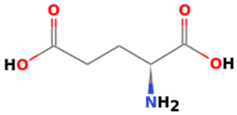
3.3.4. Glutamic Acid (Amino Pentanedioic Acid)
3.3.5. Tyrosine

3.3.6. Alkyl Benzoates
4. Discussion and Conclusions
Supplementary Materials
Author Contributions
Funding
Institutional Review Board Statement
Informed Consent Statement
Data Availability Statement
Conflicts of Interest
References
- Meier, R.J. Group contribution revisited: The enthalpy of formation of organic compounds with “chemical accuracy”. ChemEngineering 2021, 5, 24. [Google Scholar] [CrossRef]
- Meier, R.J. Group contribution revisited: The enthalpy of formation of organic compounds with “chemical accuracy” Part II. AppliedChem 2021, 1, 111–129. [Google Scholar] [CrossRef]
- Meier, R.J. Group contribution revisited: The enthalpy of formation of organic compounds with “chemical accuracy” Part III. AppliedChem 2022, 2, 213–228. [Google Scholar] [CrossRef]
- Meier, R.J.; Rablen, P.R. Group contribution revisited: The enthalpy of formation of organic compounds with “chemical accuracy” Part IV. Thermo 2023, 3, 289–308. [Google Scholar] [CrossRef]
- Meier, R.J.; Rablen, P.R. Group contribution revisited: The enthalpy of formation of organic compounds with “chemical accuracy” Part V. Appl. Sci. 2024, 14, 1929. [Google Scholar] [CrossRef]
- Peterson, K.A.; Feller, D.; Dixon, D.A. Chemical accuracy in ab initio thermochemistry and spectroscopy: Current strategies and future challenges Theor. Chem. Acc. 2012, 131, 1079–1098. [Google Scholar] [CrossRef]
- Van Krevelen, D.W.; Chermin, H.A.G. Estimation of the free enthalpy (Gibbs free energy) of formation of organic compounds from group contributions. Chem. Eng. Sci. 1951, 1, 66–80, Erratum in Chem. Eng. Sci. 1952, 1, 238. [Google Scholar] [CrossRef]
- Aouichaoui, A.R.N.; Fan, F.; Abildskov, J.; Sin, G. Application of interpretable group-embedded graph neural networks for pure compound properties. Comput. Chem. Eng. 2023, 176, 108291. [Google Scholar] [CrossRef]
- Cohen, N.; Benson, S. Estimation of the heats of formation of organic compounds. Chem. Rev. 1993, 93, 2419–2438. [Google Scholar] [CrossRef]
- Joback, K.G.; Reid, R.C. Estimation of Pure-Component Properties from Group-Contributions. Chem. Eng. Commun. 1987, 57, 233–243. [Google Scholar] [CrossRef]
- Constantinou, L.; Gani, R. New group contribution method for estimating properties of pure compounds. AIChE J. 1994, 40, 1697–1710. [Google Scholar] [CrossRef]
- Marrero, J.; Gani, R. Group-contribution based estimation of pure component properties. Fluid Phase Equilibria 2001, 183–184, 183–208. [Google Scholar] [CrossRef]
- Verevkin, S.P. Improved Benson Increments for the Estimation of Standard Enthalpies of Formation and Enthalpies of Vaporization of Alkyl Ethers, Acetals, Ketals, and Ortho Esters. J. Chem. Eng. Data 2002, 47, 1071–1097. [Google Scholar] [CrossRef]
- Verevkin, S.P.; Emel’yanenko, V.N.; Diky, V.; Muzny, C.D.; Chirico, R.D.; Frenkel, M. New Group-Contribution Approach to Thermochemical Properties of Organic Compounds: Hydrocarbons and Oxygen-Containing Compounds. J. Phys. Chem. Ref. Data 2013, 42, 033102. [Google Scholar] [CrossRef]
- Hukkerikar, A.S.; Meier, R.J.; Sin, G.; Gani, R. A method to estimate the enthalpy of formation of organic compounds with chemical accuracy. Fluid Phase Equilibria 2013, 348, 23–32. [Google Scholar] [CrossRef]
- Kadda, A.; Mustapha, B.A.; Yahiaoui, A.; Khaled, T.; Hadji, D. Enthalpy of Formation Modeling Using Third Order Group Contribution Technics and Calculation by DFT Method. Int. J. Thermodyn. 2020, 23, 34–41. [Google Scholar] [CrossRef]
- Aouichaoui, A.R.N.; Fan, F.; Mansouri, S.S.; Abildskov, J.; Sin, G. Combining Group-Contribution Concept and Graph Neural Networks Toward Interpretable Molecular Property Models. J. Chem. Inf. Model. 2023, 63, 725–744. [Google Scholar] [CrossRef]
- Ghahremanpour, M.M.; van Maaren, P.J.; Ditz, J.C.; Lindh, R.; van der Spoel, D. Large-scale calculations of gas phase thermochemistry: Enthalpy of formation, standard entropy, and heat capacity. J. Chem. Phys. 2016, 145, 114305. [Google Scholar] [CrossRef]
- Rablen, P. A Procedure for Computing Hydrocarbon Strain Energies Using Computational Group Equivalents, with Application to 66 Molecules. Chemistry 2020, 2, 22. [Google Scholar] [CrossRef]
- Wiberg, K.B.; Rablen, P.R. Increase in Strain Energy during Conversion of [4.4.4.5]Fenestrane to [4.4.4.4]Fenestrane: A Method for Estimating the Heats of Formation of Hydrocarbons and Their Derivatives from Ab Initio Energies. J. Org. Chem. 2020, 85, 4981–4987. [Google Scholar] [CrossRef]
- Dorofeeva, O.V.; Ryzhova, O.N. Gas-Phase Enthalpies of Formation and Enthalpies of Sublimation of Amino Acids Based on Isodesmic Reaction Calculations. J. Phys. Chem. A 2014, 118, 3490–3502. [Google Scholar] [CrossRef] [PubMed]
- Dorofeeva, O.V.; Filimonova, M.A.; Marochkin, I.I. Aliphatic Amines: A Critical Analysis of the Experimental Enthalpies of Formation by Comparison with Theoretical Calculations. J. Chem. Eng. Data 2019, 64, 5630–5647. [Google Scholar] [CrossRef]
- Verevkin, S.P.; Konnova, M.E.; Turovtsev, V.V.; Riabchunova, A.V.; Pimerzin, A.A. Weaving a Network of Reliable Thermochemistry around Lignin Building Blocks: Methoxy-Phenols and Methoxy-Benzaldehydes. Ind. Eng. Chem. Res. 2020, 59, 22626–22639. [Google Scholar] [CrossRef]
- Verevkin, S.P.; Safronov, S.P.; Samarov, A.A.; Vostrikov, S.V. Hydrogen Storage: Thermodynamic Analysis of Alkyl-Quinolines and Alkyl-Pyridines as Potential Liquid Organic Hydrogen Carriers (LOHC). Appl. Sci. 2021, 11, 11758. [Google Scholar] [CrossRef]
- Curtiss, L.A.; Redfern, P.C.; Raghavachari, K. Gaussian-4 theory. J. Chem. Phys. 2007, 126, 084108. [Google Scholar] [CrossRef]
- Curtiss, L.A.; Redfern, P.C.; Raghavachari, K. Gaussian 4 theory using reduced order perturbation theory. J. Chem. Phys. 2007, 127, 1241. [Google Scholar] [CrossRef]
- Narayanan, B.; Redfern, P.C.; Assary, R.S.; Curtiss, L.A. Accurate quantum chemical energies for 133,000 organic molecules. Chem. Sci. 2019, 10, 7449. [Google Scholar] [CrossRef]
- Saeys, M.; Reyniers, M.-F.; Marin, G.B.; VanSpeybroeck, V.; Waroquier, M. Ab Initio Calculations for Hydrocarbons: Enthalpy of Formation, Transition State Geometry, and Activation Energy for Radical Reactions. J. Phys. Chem. 2003, 107, 9147–9159. [Google Scholar] [CrossRef]
- Tirado-Rives, J.; Jorgensen, W.L. Performance of B3LYP Density Functional Methods for a Large Set of Organic Molecules. J. Chem. Theory Comput. 2008, 4, 297–306. [Google Scholar] [CrossRef]
- Wavefunction Inc. Spartan’10; Wavefunction Inc.: Irvine, CA, USA, 2010; Available online: https://www.wavefun.com/ (accessed on 4 June 2024).
- Pedley, J.B.; Naylor, R.D.; Kirby, S.P. Thermochemical Data of Organic Compounds, 2nd ed.; Chapman & Hall: New York, NY, USA, 1986; pp. 1–792. ISBN 0412271001. [Google Scholar]
- NIST Data Base. Available online: https://webbook.nist.gov/ (accessed on 25 May 2024).
- Roth, W.R.; Adamczak, O.; Breuckmann, R.; Lennartz, H.-W.; Boese, R. Die Berechnung von Resonanzenergien; das MM2ERW-Kraftfeld. Chem. Ber. 1991, 124, 2499–2521. [Google Scholar] [CrossRef]
- Steele, W.V.; Chirico, R.D.; Knipmeyer, S.E.; Nguyen, A.; Smith, N.K. Thermodynamic properties and ideal-gas enthalpies of formation for butyl vinyl ether, 1,2-dimethoxyethane, methyl glycolate, bicyclo[2.2.1]hept-2-ene, 5-vinylbicyclo[2.2.1]hept-2-ene, trans-azobenzene, butyl acrylate, di-tert-butyl ether, and hexane-1,6-diol. J. Chem. Eng. Data 1996, 41, 1285–1302. [Google Scholar] [CrossRef]
- Wong, S.S.; Westrum, E.F., Jr. Enthalpies of formation of globular molecules. II. Three bicyclooctanes and two bicyclononanes. J. Am. Chem. Soc. 1971, 93, 5317–5321. [Google Scholar] [CrossRef]
- Knauth, P.; Sabbah, R. Energetics of intra- and intermolecular bonds in ω-alkanediols (II) Thermochemical study of 1,2-ethanediol, 1,3-propanediol, 1,4-butanediol, and 1,5-pentanediol at 298.15K. Struct. Chem. 1990, 1, 43–46. [Google Scholar] [CrossRef]
- Emel’yanenko, V.N.; Verevkin, S.P. Benchmark thermodynamic properties of 1,3-propanediol: Comprehensive experimental and theoretical study. J. Chem. Thermodyn. 2015, 85, 111–119. [Google Scholar] [CrossRef]
- Knauth, P.; Sabbah, R. Energetics of intra- and intermolecular bonds in ω-alkanediols. III. Thermochemical study of 1,6-hexanediol, 1,8-octanediol, 1,9-nonanediol, and 1,10-decanediol at 298.15 K. Can. J. Chem. 1990, 68, 731–734. [Google Scholar] [CrossRef]
- Roux, M.V.; Temprado, M.; Chickos, J.S.; Nagano, Y. Critically Evaluated Thermochemical Properties of Polycyclic Aromatic Hydrocarbons. J. Phys. Chem. Ref. Data 2008, 37, 1855–1996. [Google Scholar] [CrossRef]
- Balepin, A.A.; Lebedev, V.P.; Miroshnichenko, E.A.; Koldobskii, G.I.; Ostovskii, V.A.; Larionov, B.P.; Gidaspov, B.V.; Lebedev, Y.A. Energy effects in polyphenylenes and phenyltetrazoles. Svoistva Veshchestv Str. Mol. 1977, 93–98. [Google Scholar]
- Coleman, D.J.; Pilcher, G. Heats of combustion of biphenyl, bibenzyl, naphthalene, anthracene, and phenanthrene. Trans. Faraday Soc. 1966, 62, 821–827. [Google Scholar] [CrossRef]
- Rakus, K.; Verevkin, S.P.; Schatzer, J.; Beckhaus, H.-D.; Ruchardt, C. Thermochemistry and thermal decomposition of 9,9’-bifluorenyl and 9,9’-dimethyl-9,9’-bifluorenyl—The stabilization energy of 9-fluorenyl radicals. Chem. Ber. 1994, 127, 1095–1103. [Google Scholar] [CrossRef]
- Pijpers, A.P.; Meier, R.J. Core Level Photoelectron Spectroscopy for Polymer and Catalyst Characterisation. Chem. Soc. Rev. 1999, 28, 233–238. [Google Scholar] [CrossRef]
- Cox, J.D.; Gundry, H.A.; Harrop, D.; Head, A.J. Thermodynamic properties of fluorine compounds. 9. Enthalpies of formation of some compounds containing the pentafluorophenyl group. J. Chem. Thermodyn. 1969, 1, 77–87. [Google Scholar] [CrossRef]
- Harrop, D.; Head, A.J. Thermodynamic properties of fluorine compounds. 18. Enthalpy of combustion of 1,2,4,5-tetrafluorobenzene. J. Chem. Thermodyn. 1978, 10, 705–706. [Google Scholar] [CrossRef]
- Good, W.D.; Lacina, J.L.; Scott, D.W.; McCullough, J.P. Combustion calorimetry of organic fluorine compounds. The heats of combustion and formation of the difluorobenzenes, 4-fluorotoluene and m-trifluorotoluic acid. J. Phys. Chem. 1962, 66, 1529–1532. [Google Scholar] [CrossRef]
- Schaffer, F.; Verevkin, S.P.; Rieger, H.-J.; Beckhaus, H.-D.; Rüchardt, C. Enthalpies of Formation of a Series of Fluorinated Hydrocarbons and Strain-Free Group Increments to Assess Polar and Anomeric Stabilization and Strain. Liebigs Ann. 1997, 1997, 1333–1344. [Google Scholar] [CrossRef]
- Wiberg, K.B.; Rablen, P.R. Origin of the Stability of Carbon Tetrafluoride: Negative Hyperconjugation Reexamined. J. Am. Chem. Soc. 1993, 115, 614–625. [Google Scholar] [CrossRef]
- Verevkin, S.P.; Elbakari, A.V.; Vostrikov, S.V.; Nagrimanov, R.N.; Varfolomeev, M.A. Renewable Platform Chemicals: Evaluation of Experimental Data for Alkyl Benzoates with Complementary Measurements, Structure−Property Correlations, and Quantum Chemical Calculations. Chem. Eng. Data 2024, 69, 380–399. [Google Scholar] [CrossRef]
- Maksimuk, Y.V.; Kabo, G.J.; Simirsky, V.V.; Kozyro, A.A.; Sevruk, V.M. Standard Enthalpies of Formation of Some Methyl Esters of Benzene Carboxylic Acids. J. Chem. Eng. Data 1998, 43, 293–298. [Google Scholar] [CrossRef]
| Acetals | Exp [13] Verevkin | GC Model | GC Model-G4 | ABS (GC Model-Exp) | G4 | ABS (GC Model-G4) | G4-Exp |
|---|---|---|---|---|---|---|---|
| dimethoxymethane | −348.2 | −350.0 | 3.1 | 1.8 | −353.1 | 3.1 | −4.9 |
| diethoxymethane | −414.8 | −420.7 | −2.1 | 5.9 | −418.6 | 2.1 | −3.8 |
| dibutoxymethane | −492.2 | −503.2 | 0.5 | 11.0 | −503.7 | 0.5 | −11.5 |
| 1,1-dimethoxyethane | −389.7 | −392.4 | 0.2 | 2.7 | −392.6 | 0.2 | −2.9 |
| 1,2-dimethoxyethane | −350.0 | −5.4 | −344.6 | 5.4 | |||
| 1,1-diethoxyethane | −454 | −463.1 | −4.4 | 9.1 | −458.7 | 4.4 | −4.7 |
| 1,2-diethoxyethane | −420.7 | −9.4 | −411.3 | 9.4 | |||
| 2,2-dimethoxypropane | −423.1 | −434.7 | −0.8 | 11.6 | −433.9 | 0.8 | −10.8 |
| 2,2-diethoxypropane | −495.3 | −505.4 | −5.0 | 10.1 | −500.4 | 5.0 | −5.1 |
| 1,3-diethoxypropane | −441.4 | −3.2 | −438.2 | 3.2 | |||
| 1,1-dimethoxybutane | −425.7 | −433.6 | 0.9 | 7.9 | −434.5 | 0.9 | −8.8 |
| 1-ethoxy-1-methoxyethane | −427.7 | −2.1 | −425.6 | 2.1 | |||
| 1-ethoxy-2-methoxyethane | −385.4 | −7.0 | −378.4 | 7.0 | |||
| trimethoxymethane | −530.8 | −529.0 | 8.2 | 1.8 | −537.2 | 8.2 | −6.4 |
| triethoxymethane | −630.6 | −635.1 | 1.6 | 4.5 | −636.7 | 1.6 | −6.1 |
| 1,1,1-trimethoxyethane | −567.4 | 9.0 | −576.4 | 9.0 | |||
| averaged absolute difference | 6.65 | 3.93 | 6.50 |
| Benzyl Ethers | Exp [13] | GC Model | GC Model-G4 | ABS (GC Model-Exp) | G4 | ABS (GC Model-G4) | G4-Exp |
|---|---|---|---|---|---|---|---|
| methyl benzyl ether | −82.1 | −83.5 | −4.2 | 1.4 | −79.3 | 4.2 | 2.8 |
| ethyl benzyl ether | −114.3 | −119.9 | −6.6 | 5.6 | −113.3 | 6.6 | 1.0 |
| t-butyl benzyl ether | −183.4 | −188.6 | −6.8 | 5.2 | −181.8 | 6.8 | 1.6 |
| t-amylbenzyl ether | −202 | −192.2 | 9.0 | 9.8 | −201.2 | 9.0 | 0.8 |
| (1-methoxyethyl) benzene | −112.4 | −125.9 | −3.2 | 13.5 | −122.7 | 3.2 | −10.3 |
| (1-ethoxyethyl) benzene | −143.6 | −140.2 | 16.6 | 3.4 | −156.8 | 16.6 | −13.2 |
| (1-propoxyethyl) benzene | −165.6 | −160.9 | 17.3 | 4.8 | −178.1 | 17.3 | −12.5 |
| (1-butoxyethyl) benzene | −190 | −181.5 | 17.3 | 8.5 | −198.8 | 17.3 | −8.8 |
| (1-isopropoxyethyl)-benzene | −177.9 | −191.6 | 0.9 | 13.7 | −192.5 | 0.9 | −14.6 |
| 1-sec-butoxyethylbenzene (RR/SS diastereomer) | −199 | −206.2 | 5.4 | 7.2 | −211.6 | 5.4 | −12.6 |
| 1-sec-butoxyethylbenzene (RS/SR diastereomer) | −201.1 | −206.2 | 8.1 | 5.1 | −214.3 | 8.1 | −13.2 |
| methyl cumyl ether | −140.5 | −162.2 | −9.1 | 21.7 | −153.1 | 9.1 | −12.6 |
| ethyl cumyl ether | −175.5 | −182.6 | 3.7 | 7.1 | −186.3 | 3.7 | −10.8 |
| propyl cumyl ether | −198.1 | −203.2 | 6.6 | 5.1 | −209.8 | 6.6 | −11.7 |
| butyl cumyl ether | −218.5 | −223.8 | 6.8 | 5.3 | −230.6 | 6.8 | −12.1 |
| Bicyclic Hydrocarbons | Experiment [33] | G4 | Exp-G4 | ABS (Exp-G4) | Other Exp |
|---|---|---|---|---|---|
| bicyclo[2.1.0]pent-2-ene | 333 | 327.8 | 5.2 | 5.2 | |
| bicyclo[2.1.0]pentane | 158 | 156.1 | 1.9 | 1.9 | |
| cis-bicyclo[2.2.0]hexane | 125 | 129.6 | −4.6 | 4.6 | |
| bicyclo[2.2.0]hex-2-ene | 259.5 | ||||
| bicyclo[2.2.0]hex-1(4)-ene | 381.0 | ||||
| bicyclo[2.1.1]hexane | 57.7 | ||||
| bicyclo[2.1.1]hex-2-ene | 251 | 228.2 | 22.8 | ||
| norbornene | 85.4 | 79.5 | 5.9 | 5.9 | 82.6 ± 2.1 [34] |
| norbornane | −56.1 | 1.4 | 1.4 | −54.7 ± 4.7 [31] | |
| norbornadiene | 244 | 237.3 | 6.7 | 6.7 | 245.3 ± 2.7 [31] |
| quadracyclane (tetracyclo[3.2.0.0(2,7).0(4,6)]heptane) | 336 | 332.1 | 3.9 | 3.9 | |
| bicyclo[3.2.0]hept-6-ene | 139.7 | 138.7 | 0.9 | 0.9 | |
| bicyclo[3.2.0]heptane | 7.1 | ||||
| bicyclo[3.2.0]hept-1(5)-ene | 181.9 | ||||
| bicyclo[2.2.2]octene | 21.1 | ||||
| bicyclo[2.2.2]octane | −95.7 | −3.3 | 3.3 | −99.0 [35] | |
| averaged absolute difference | 3.76 |
| Diols | Experiment [31] | GC Model | GC Model-Exp | ABS (GC Model-Exp) | G4 [18] | ABS (Model-G4) |
|---|---|---|---|---|---|---|
| 1,2-ethanediol | −387.5 | −383.26 | 4.24 | 4.24 | −379.3 | 3.96 |
| 1,3-propanediol | −392.1 | −403.89 | −11.79 | 11.79 | −399.7 | 4.19 |
| 1,4-butanediol | −426.7 | −424.52 | 2.18 | 2.18 | −424.9 | 0.38 |
| 1,5-pentanediol | −449.1 | −445.15 | 3.95 | 3.95 | −441.9 | 3.25 |
| 1,6-hexanediol | −461.2 | −465.78 | −4.58 | 4.58 | ||
| 1,2-propanediol | −421.3 | −421.49 | −0.19 | 0.19 | −426.8 | 5.31 |
| 1,3-butanediol | −433.2 | −442.12 | −8.92 | 8.92 | −440.2 | 1.92 |
| 2,3-butanediol | −482.3 | −459.72 | 22.58 | 22.58 | −457.6 | 2.12 |
| 2,4-pentanediol | −474.1 | −480.35 | −6.25 | 6.25 | −477.7 | 2.65 |
| glycerol | −577.4 | −570.76 | 6.64 | 6.64 | ||
| averaged absolute difference | 7.13 | 2.97 | ||||
| Fluorobenzenes | Experiment | GC Model | ABS (Exp-G4) | ABS (GC Model-Exp) | G4 | ABS (GC Model-G4) |
|---|---|---|---|---|---|---|
| hexafluorobenzene | −956 [44] | −959.5 | 2.5 | −3.5 | −953.5 | 6.0 |
| 1,2,3,4,5-pentafluorobenzene | −806 [44] | −806.0 | 2.8 | 0.0 | −803.2 | 2.8 |
| 1,2,3,4-tetrafluorobenzene | n.a. | −634.5 | −635.7 | 1.2 | ||
| 1,2,4,5-tetrafluorobenzene | −646.8 [45] | −652.5 | 1.0 | 5.7 | −647.8 | 4.7 |
| 1,3,5-trifluorobenzene | n.a. | −491.5 | −495.6 | 4.1 | ||
| 1,2,4-trifluorobenzene | n.a. | −478.5 | −477.9 | 0.6 | ||
| 1,2-difluorobenzene | −283.0 [46] | −286.5 | 7.1 | 3.5 | −290.1 | 3.6 |
| 1,3-difluorobenzene | −309.2 [46] | −302.0 | 3.3 | 7.2 | −305.9 | 3.9 |
| 1,4-difluorobenzene | −306.7 [46] | −304.5 | 4.2 | 2.2 | −302.5 | 2.0 |
| benzene, 1-fluoro-4-methyl- | −147.5 [46] | −146.4 | 1.1 | |||
| averaged absolute difference | 2.78 | 2.32 | 3.21 |
| Aromatic Fluoro Compounds (in Brackets Numbering as in Ref. [47] and Scheme 1) | Exp [47] | GC Model | GC Model-Exp | ABS (GC Model-Exp) | G4 | Exp-G4 | |
|---|---|---|---|---|---|---|---|
| 1-fluorononane | (1) | −423.5 | −425.9 | −2.4 | 2.4 | −417.2 | −6.3 |
| 1-fluorododecane | (2) | −489.2 | −487.8 | 1.4 | 1.4 | −481.3 | −7.9 |
| 1-fluorotetradecane | (3) | −533.0 | −529.1 | 4.0 | 4.0 | −523.8 | −9.2 |
| triphenyl(3-fluoropropane) | (4) | 57.5 | 10.7 | −46.8 | 46.8 | 42.6 | 14.9 |
| fluoromethylbenzene | (5) | −126.3 | −148.6 | −22.4 | 22.4 | −125.0 | −1.3 |
| fluorocyclohexane | (6) | −336.6 | −339.1 | −2.4 | 2.4 | −327.0 | −9.6 |
| fluorodiphenylmethane | (7) | −42.6 | −55.5 | −12.90 | 12.9 | −28.7 | −13.9 |
| 2-fluoro-2-methyl-1,3-diphenylpropane | (8) | −136.7 | −136.1 | 0.58 | 0.58 | −133.0 | −3.7 |
| 1,3-diphenyl-(2-methylphenyl)2-fluoropropane | (9) | −14.1 | −23.9 | −9.8 | 9.8 | −22.5 | 8.4 |
| 1,3-diphenyl-2-phenyl-2-fluoropropane | (10) | 15.0 | −3.3 | −18.3 | 18.3 | 1.0 | 14.0 |
| 1,1-difluoro-3-phenylpropane | (11) | −414.4 | −405.8 | 8.6 | 8.6 | −407.1 | −7.3 |
| 1,1,1-triphenyl-3,3-difluoropropane | (12) | −157.6 | −205.1 | −47.5 | 47.5 | −179.5 | 21.9 |
| 1,2-diphenyl-1,1-difluoroethane | (13) | −260.5 | −319.6 | −59.1 | 59.1 | −294.4 | 33.9 |
| 2,2-difluorononane | (14) | −671.5 | −674.5 | −3.0 | 3.0 | −675.9 | 4.4 |
| trifluoroethylbenzene | (15) | −623.9 | −628.6 | −4.8 | 4.8 | −629.6 | 5.8 |
| (1,1,1-trifluoro-2-phenylethane) | |||||||
| 1,1,1-trifluoro-2,2-diphenylethane | (16) | −516.1 | −521.5 | −5.4 | 5.4 | −515.5 | −0.6 |
| 1,1,1-triphenyl-2,2,2-trifluoroethane | (17) | −364.9 | −428.0 | −63.1 | 63.1 | −393.9 | 29.0 |
| 1,2-diphenyl-1,1,2-trifluoroethane | (18) | −462.2 | −521.5 | −59.3 | 59.3 | −473.5 | 11.3 |
| 1,2-diphenyl-1,1,2,2-tetrafluoroethane | (19) | −689.0 | −751.0 | −62.0 | 62.0 | −691.2 | 2.2 |
| Alkyl Benzoates | Experiment [49] | GC Model | GC Model-Exp |
|---|---|---|---|
| Methylbenzoate | −274.5 | −271.9 | 2.6 |
| Ethylbenzoate | −305.3 | −305.5 | −0.2 |
| n-propylbenzoate | −331.3 ± 5.1 | −326.1 | 5.2 |
| methyl-2-methylbenzoate | −301.5 [50] | −308.2 | −6.7 |
| methyl-3-methylbenzoate | −309.6 [50] | −308.2 | 1.4 |
| methyl 4-methylbenzoate | −308.7 [50] | −308.2 | 0.5 |
| phenylbenzoate | −142.6 | −145 | −2.4 |
Disclaimer/Publisher’s Note: The statements, opinions and data contained in all publications are solely those of the individual author(s) and contributor(s) and not of MDPI and/or the editor(s). MDPI and/or the editor(s) disclaim responsibility for any injury to people or property resulting from any ideas, methods, instructions or products referred to in the content. |
© 2024 by the authors. Licensee MDPI, Basel, Switzerland. This article is an open access article distributed under the terms and conditions of the Creative Commons Attribution (CC BY) license (https://creativecommons.org/licenses/by/4.0/).
Share and Cite
Meier, R.J.; Rablen, P.R. Group Contribution Revisited: The Enthalpy of Formation of Organic Compounds with “Chemical Accuracy” Part VI. AppliedChem 2024, 4, 333-352. https://doi.org/10.3390/appliedchem4040021
Meier RJ, Rablen PR. Group Contribution Revisited: The Enthalpy of Formation of Organic Compounds with “Chemical Accuracy” Part VI. AppliedChem. 2024; 4(4):333-352. https://doi.org/10.3390/appliedchem4040021
Chicago/Turabian StyleMeier, Robert J., and Paul R. Rablen. 2024. "Group Contribution Revisited: The Enthalpy of Formation of Organic Compounds with “Chemical Accuracy” Part VI" AppliedChem 4, no. 4: 333-352. https://doi.org/10.3390/appliedchem4040021
APA StyleMeier, R. J., & Rablen, P. R. (2024). Group Contribution Revisited: The Enthalpy of Formation of Organic Compounds with “Chemical Accuracy” Part VI. AppliedChem, 4(4), 333-352. https://doi.org/10.3390/appliedchem4040021