Article

Quantitative Analysis of NDMA in Drug Products: A Proposed High-Throughput Approach Using Headspace–SIFT-MS

by
Mark J. Perkins
1,
Colin J. Hastie
1 and
Vaughan S. Langford
2,*
1
Element Lab Solutions, Cambridge CB3 0NA, UK
2
Syft Technologies Limited, Christchurch 8011, New Zealand
*
Author to whom correspondence should be addressed.
AppliedChem 2024, 4(1), 107-121; https://doi.org/10.3390/appliedchem4010008
Submission received: 8 February 2024 / Revised: 5 March 2024 / Accepted: 14 March 2024 / Published: 20 March 2024

Abstract

:
Since the initial 2018 recall of angiotensin receptor blockers due to unacceptable levels of mutagenic N-nitrosodimethylamine (NDMA) impurity, numerous drug products delivering diverse active pharmaceutical ingredients (APIs) have been recalled. Regulators and the industry are working together to understand and address this widescale problem. Conventional analysis of NDMA utilizes liquid or gas chromatography-based procedures that can involve complicated sample preparation and slow sample analysis. Selected ion flow tube mass spectrometry (SIFT-MS) analyses NDMA directly in the gas phase using soft chemical ionization, with an LOQ of 2 ng g−1. Through the novel application of the multiple headspace extraction (MHE) technique, NDMA was quantified directly and rapidly from the drug product without dissolution, at levels well below the regulatory acceptable intake of 96 ng day−1. A comparative analysis of recalled metformin using MHE-SIFT-MS and a conventional liquid chromatography–mass spectrometry/mass spectrometry (LC-MS/MS) method showed good agreement. Use of the novel MHE-SIFT-MS approach may enable a wider screening of drug products to be conducted, since it provides around a three-fold increase in daily sample throughput.

1. Introduction

The known or suspected mutagenicity of many N-nitrosamines—in particular, N-nitrosodimethylamine (NDMA)—means that their presence in any product to which humans are exposed is of concern [1,2]. Despite the occurrence of these compounds being well-known in water [3], beverages [4], foods [5,6], and elastomeric products [7], their discovery in sartan-type angiotensin receptor blocker (ARB) drug substances in 2018 [8] has resulted in ongoing challenges for the pharmaceutical industry to address a widespread issue [2,9,10]. Research efforts to understand the extent of the sources and mechanisms by which drug products become contaminated continue [10,11]. It is, however, well-known that elastomeric sources of N-nitrosamines—as used in various packaging components—are typically very well controlled due to improvements made in the manufacture of elastomers and are therefore of lower likelihood in causing contamination [7]. Investigations have revealed that N-nitrosamine impurities commonly arise from nitrosating agents used in synthesis—especially when secondary amines are present [12,13].
Following substantial industry investigation and consultation, the European Medicines Agency (EMA) and United States Food and Drug Administration (US FDA) have issued acceptable intakes for NDMA of 96 ng day−1 [12,13]. With acceptable intakes at such low levels, highly sensitive and selective analytical methods are required. Typically, these are based on gas or liquid chromatography with longer analysis times and more complex sample preparation (e.g., dissolution and centrifugation are required) [14,15]. These methods are laboratory-based and take a relatively long time to produce the first test result when calibration is considered. Additionally, they have relatively low sample throughput. To address this, researchers at the US FDA have recently noted the probable need for higher sample throughputs [16]. They reported results for four nitrosamines (not NDMA) utilizing micro-solid phase extraction coupled with “rapid fire” sample introduction and triple-quadrupole mass-selective detection.
Alternatively, selected ion flow tube mass spectrometry (SIFT-MS) [17,18], an emerging direct-injection mass spectrometry (DIMS) technique, potentially complements the chromatographic approaches used in the standard methods by directly quantifying volatile nitrosamines in air (and headspace). By eliminating chromatographic separation and applying ultra-soft chemical ionization, SIFT-MS can simplify sample preparation and increase sample throughput. A direct analysis of the high-polarity volatile nitrosamines—with no derivatization—has been described previously [19]. Utilizing this capability for quantitative drug product analysis is non-trivial because conventional dissolution approaches developed for chromatographic techniques typically use organic solvents, whereas water is strongly preferred as a solvent for SIFT-MS due to its low reactivity under soft chemical ionization [20]. However, low-molecular-weight nitrosamines such as NDMA partition poorly for headspace from water due their high solubility [21] (p. 30).
Since dissolution is not currently an appropriate approach for the SIFT-MS analysis of volatile nitrosamines, the multiple headspace extraction (MHE) technique was utilized [21] (pp. 45–49). Briefly, MHE quantifies volatile impurities in condensed-phase samples (such as polymers, powders, and gels) for which matrix-matched calibration standards are difficult or impossible to prepare. Conventionally, quantitative analysis is achieved by undertaking repeated static headspace analyses (under equilibrium conditions) for the same sample, with headspace purges and regeneration cycles between. The headspace responses from the limited number of measurements (typically six to ten) are extrapolated to zero concentration and the area gives the total response for all analyte in the sample. The concentration is obtained by calibrating the instrument response for the analyte. The compatibility of this approach with SIFT-MS has been demonstrated in detail for the model polystyrene system, where the residual styrene monomer is quantified [22].
Due to the cost of repeated analysis of a single sample, the MHE approach tends to be avoided—if possible—when analysis uses slower chromatographic techniques. SIFT-MS, however, offers an advantage through faster sample analysis, enabling multiple MHE extractions to be conducted in parallel rather than sequentially [22]. Furthermore, for a consistent matrix the decay of headspace concentration is very repeatable, and the first injection correlates with the full MHE [22]. Hence, this has been termed “MHE calibration”, and for formaldehyde analysis in Gelucire 44/14 excipient has been observed to remain stable for several weeks [23]. This means that for a compatible system, MHE-SIFT-MS can be reduced to simple static headspace analysis, with calibration conducted offline at an earlier time (e.g., the previous night or weekend). Hence, the quantitative analysis of NDMA directly from powdered pharmaceutical products using headspace–SIFT-MS could be a feasible analytical approach. This article describes the static headspace– and MHE-SIFT-MS method development conducted to this end, together with comparative sample analysis using a conventional liquid chromatography–mass spectrometry/mass spectrometry (LC-MS/MS) method. The study was conducted using several drug products known to contain NDMA either through prior measurement (active pharmaceutical ingredient (API): ranitidine [24]; analysis in the Element laboratory) or recall (APIs valsartan [8] and metformin [25]).

2. Materials and Methods

2.1. Samples, Chemicals, and Standards

2.1.1. Drug Product Samples

The focus of this study is method development followed by proof-of-concept testing on several drug products (Table 1). It should be noted that although the valsartan and metformin drug products are from recalled batches, the data cannot be compared with published data from the time of recall since analyses reported here were obtained long after the product expiration dates. Hence, the results obtained here do not apply to the product as originally marketed, but rather demonstrate potential capability for the headspace–SIFT-MS approach. Therefore, for the most recent metformin study, side-by-side data acquisition using SIFT-MS and LC has been conducted to enable the quantitative performance of the SIFT-MS approach to be assessed. Unless otherwise stated, 300 mg of drug product was utilized for SIFT-MS analysis and 400 mg for LC-MS/MS analysis.

2.1.2. Chemicals and Standards

Ultrapure water was obtained using a laboratory water purification device (SLS Scientific Laboratory Supplies Limited, Fairham, Nottingham, UK). Methanol (HPLC grade) was obtained from Sigma Aldrich (Gillingham, UK) and formic acid (>98% purity) from Romil (Waterbeach, Cambridge, UK).
NDMA calibration standards were prepared from a 5000 μg mL−1 standard in methanol (1 mL ampoules; Sigma-Aldrich, Gillingham, UK).

2.2. SIFT-MS

2.2.1. SIFT-MS Analysis

The SIFT-MS analytical technique has been described in detail elsewhere [17,18]. A commercial SIFT-MS instrument (Voice200ultra model; Syft Technologies Limited, Christchurch, New Zealand) operating on helium carrier gas was used in this study. The SIFT-MS instrument was operated under standard factory conditions (ion source pressure 0.7 mbar; carrier gas pressure in flow tube 0.8 mbar; flow-tube temperature 120 °C; static potential on flow tube, 25 V; sample flow rate approx. 25 standard cubic centimetres per minute (sccm)) [26].
SIFT-MS analysis of NDMA has been described previously [19,26]. Reaction rate coefficients, k, are the primary indicator of the relative SIFT-MS sensitivity to different analytes. (Note that instrument sensitivity in DIMS is usually measured as counts per second of product ions at the detector per unit concentration [17,27]—typically parts per billion by volume, ppbV.) For nitrosamines, values of k are larger than most VOCs due to their high polarity [19], resulting in higher sensitivity. Specificity is achieved by utilizing multiple product ions per compound, which enables a cross-comparison of independent concentration measurements from the individual product ions [26]. Dimethyl formamide (DMF), which is quite widely used in the pharmaceutical industry [28] and a potential source of NDMA [10,29], is the most probable interferent with SIFT-MS analysis of NDMA via its 13C isotopologue, but that this is readily corrected [26]. No issues were encountered in any matrix analysed in this study.
High levels of residual solvent may impact the calculation of concentrations in SIFT-MS due to excessive consumption of the reagent ions [20,26]. High concentrations are evident in the non-linear headspace responses to drug product mass for H3O+ and O2+•—a phenomenon that needs to be understood and mitigated in method development [26]. Here, the NO+ reagent ion is often more robust to this effect than are H3O+ and O2+• due to it being somewhat less sensitive to very common solvents such as ethanol or isopropyl alcohol (based on their relative reaction rate coefficients). Figure S1 (Supplementary Materials) shows full-scan analyses of the ranitidine drug products (R1 and R2 in Table 1) with spectral features arising from the residual solvents annotated.

2.2.2. Automated Headspace–SIFT-MS Analysis

The SIFT-MS instrument was equipped with a multipurpose (MPS) autosampler (Robotic Pro; GERSTEL, Mülheim, Germany). Samples were incubated in a virtual twelve-place agitator (composed of two physical six-place agitators; GERSTEL) prior to the sampling of the headspace and subsequent injection into the SIFT-MS instrument through a septumless sampling head (GERSTEL).
Drug products were analysed by headspace–SIFT-MS in powdered form without subsequent dissolution in water. The static headspace analysis conditions (both for single measurement and MHE) utilized 10 mL headspace vials incubated at 60 °C for 30 min. (Note that 10 mL vials were used to increase the partitioning to headspace for a given amount of condensed-phase sample [21] (pp. 34–36) relative to the standard SIFT-MS headspace conditions that recommend 20 mL vials [30].) A 2.5 mL aliquot of headspace was removed using a heated gas-tight syringe (150° C) and injected into the SIFT-MS instrument’s sample inlet at 100 μL s−1, with a flow of make-up gas (high-purity nitrogen) through the heated inlet (120 °C) to ensure that the total flow into the instrument was 25 mL min−1. After sample injection, the syringe was flushed with zero air for 1 min at 200 mL min−1.
Dilution of the sample in the inlet is accounted for in calibration since this occurs under the same conditions as sample measurement. The analysis time for each sample was 100 s (Figure 1) and the reported concentrations are the mean of the values obtained during injection (i.e., between about 40 and 60 s); the measurements to the left and right of the injection represent the background contributed by the instrument and make-up gas. Hence, the sample injection profile (Figure 1) also serves to demonstrate the absence of carryover in the headspace–SIFT-MS system because the rise and fall times were very rapid when sample injection started and stopped at approximately 37 and 63 s, respectively.
The calibration of instrument response and assessment of linearity (Section 3.1) were conducted by utilizing the complete evaporation of NDMA solutions, with two dilution sequences. The approaches differed for method development (Section 3.1 and Section 3.2) and the comparative study (Section 3.3).
In method development, 1 μL of the 5000 μg mL−1 standard (Section 2.1.2; stock A) was added to a 20 mL headspace vial, giving 250 ng mL−1 in the gas phase (stock B). Aliquots of 250, 500, 750, 1000, and 1250 μL of headspace of stock B were added to 20 mL vials, giving 62.5, 125, 187.5, 250, and 312.5 ng, respectively. Since the drug product was analysed in 10 mL sample vials, this gave amounts in 10 mL vial equivalents of 31.25, 62.5, 93.75, 125, and 156.25 ng. For the low range, stock A was diluted two-fold and 0.5 μL of this was added to a 20 mL vial to make low-range stock B—a four-fold dilution for the low-level calibration.
For the comparative study, 2 μL of stock A was added to a 20 mL vial, giving 500 ng per mL (stock C). A 2 mL aliquot of headspace from stock C was transferred into a 20 mL vial giving stock D at 50 ng mL−1. Adding 250, 500, 750, 1000, and 1250 μL of headspace of stock D to 10 mL vials gave the standards for calibration in Section 3.3. The extra dilution step was necessary in this case because a low range was required. It also had the benefit of reducing methanol concentration in the calibration vials.

2.3. Automated LC-MS/MS Analysis

Metformin-containing drug products (Table 1) were analysed using a LC-MS/MS method validated on several metformin (and irbesartan) drug substances [31]. Briefly, this analysis utilized an Agilent 1260 high-performance liquid chromatography (HPLC) system and 6470 LC-MS/MS (Agilent Technologies, Santa Clara, CA, USA). Chromatographic separation was achieved using a Halo 90 Å biphenyl, 2 µm, 2.1 × 100 mm column (Advanced Materials Technology, Wilmington, DE, USA) with gradient elution. Starting with 95% water and 5% methanol, both elution solvents contained 0.2% formic acid. Initial conditions were held for 1 min then ramped to 95% methanol for 10 min and held for 5 min. The MS had an atmospheric pressure chemical ionization (APCI) source, with gas and vaporizer temperatures of 325 and 350 °C, respectively, a gas flow of 4 L min−1, nebulizer pressure of 10 psi, a capillary voltage of 1000 V, and a corona current of 2 µA. NDMA was quantified using multiple reaction monitoring (MRM) based on the transition from m/z 75.1 to 58.2 with a fragmentor voltage of 60 V and a collision energy of 20 eV. A qualifying transition of m/z 75.1 to 43.1 with a fragmentor voltage of 60 V and collision energy of 18 eV was also acquired. Figure 2 shows an example chromatogram for a 5 ng mL−1 standard solution of NDMA in water.
The initial methodology for sample extraction wasbased on a previously developed method for the LC-MS/MS analysis of nitrosamines in APIs, which added 5 mL of water to 400 mg of API [31]. However, this approach resulted in gel formation with the finished metformin-containing drug products (Table 1), making it impossible to analyse the samples. Here, gelification was prevented by dissolving the drug product (400 mg) in 5 mL of methanol. Samples were mixed for 2 min at 2000 rpm on a QuickMix (GERSTEL), and then sonicated for 2 min and centrifuged at 4500 rpm for 5 min to separate the supernatant from residual excipients. An aliquot of 100 µL of the methanol extract was diluted 1:10 in ultrapure water. The resulting solution was then analysed by LC-MS/MS.

3. Results

In this section, results are presented that demonstrate basic NDMA detection performance by headspace–SIFT-MS, the development of the MHE-SIFT-MS procedure, and the comparison of its results with a validated LC-MS/MS method. Note that different NDMA-containing drug products were analysed through the successive stages of development due to the availability of very limited samples. This, however, serves to illustrate that the MHE-SIFT-MS procedure provides a flexible approach to NDMA analysis.

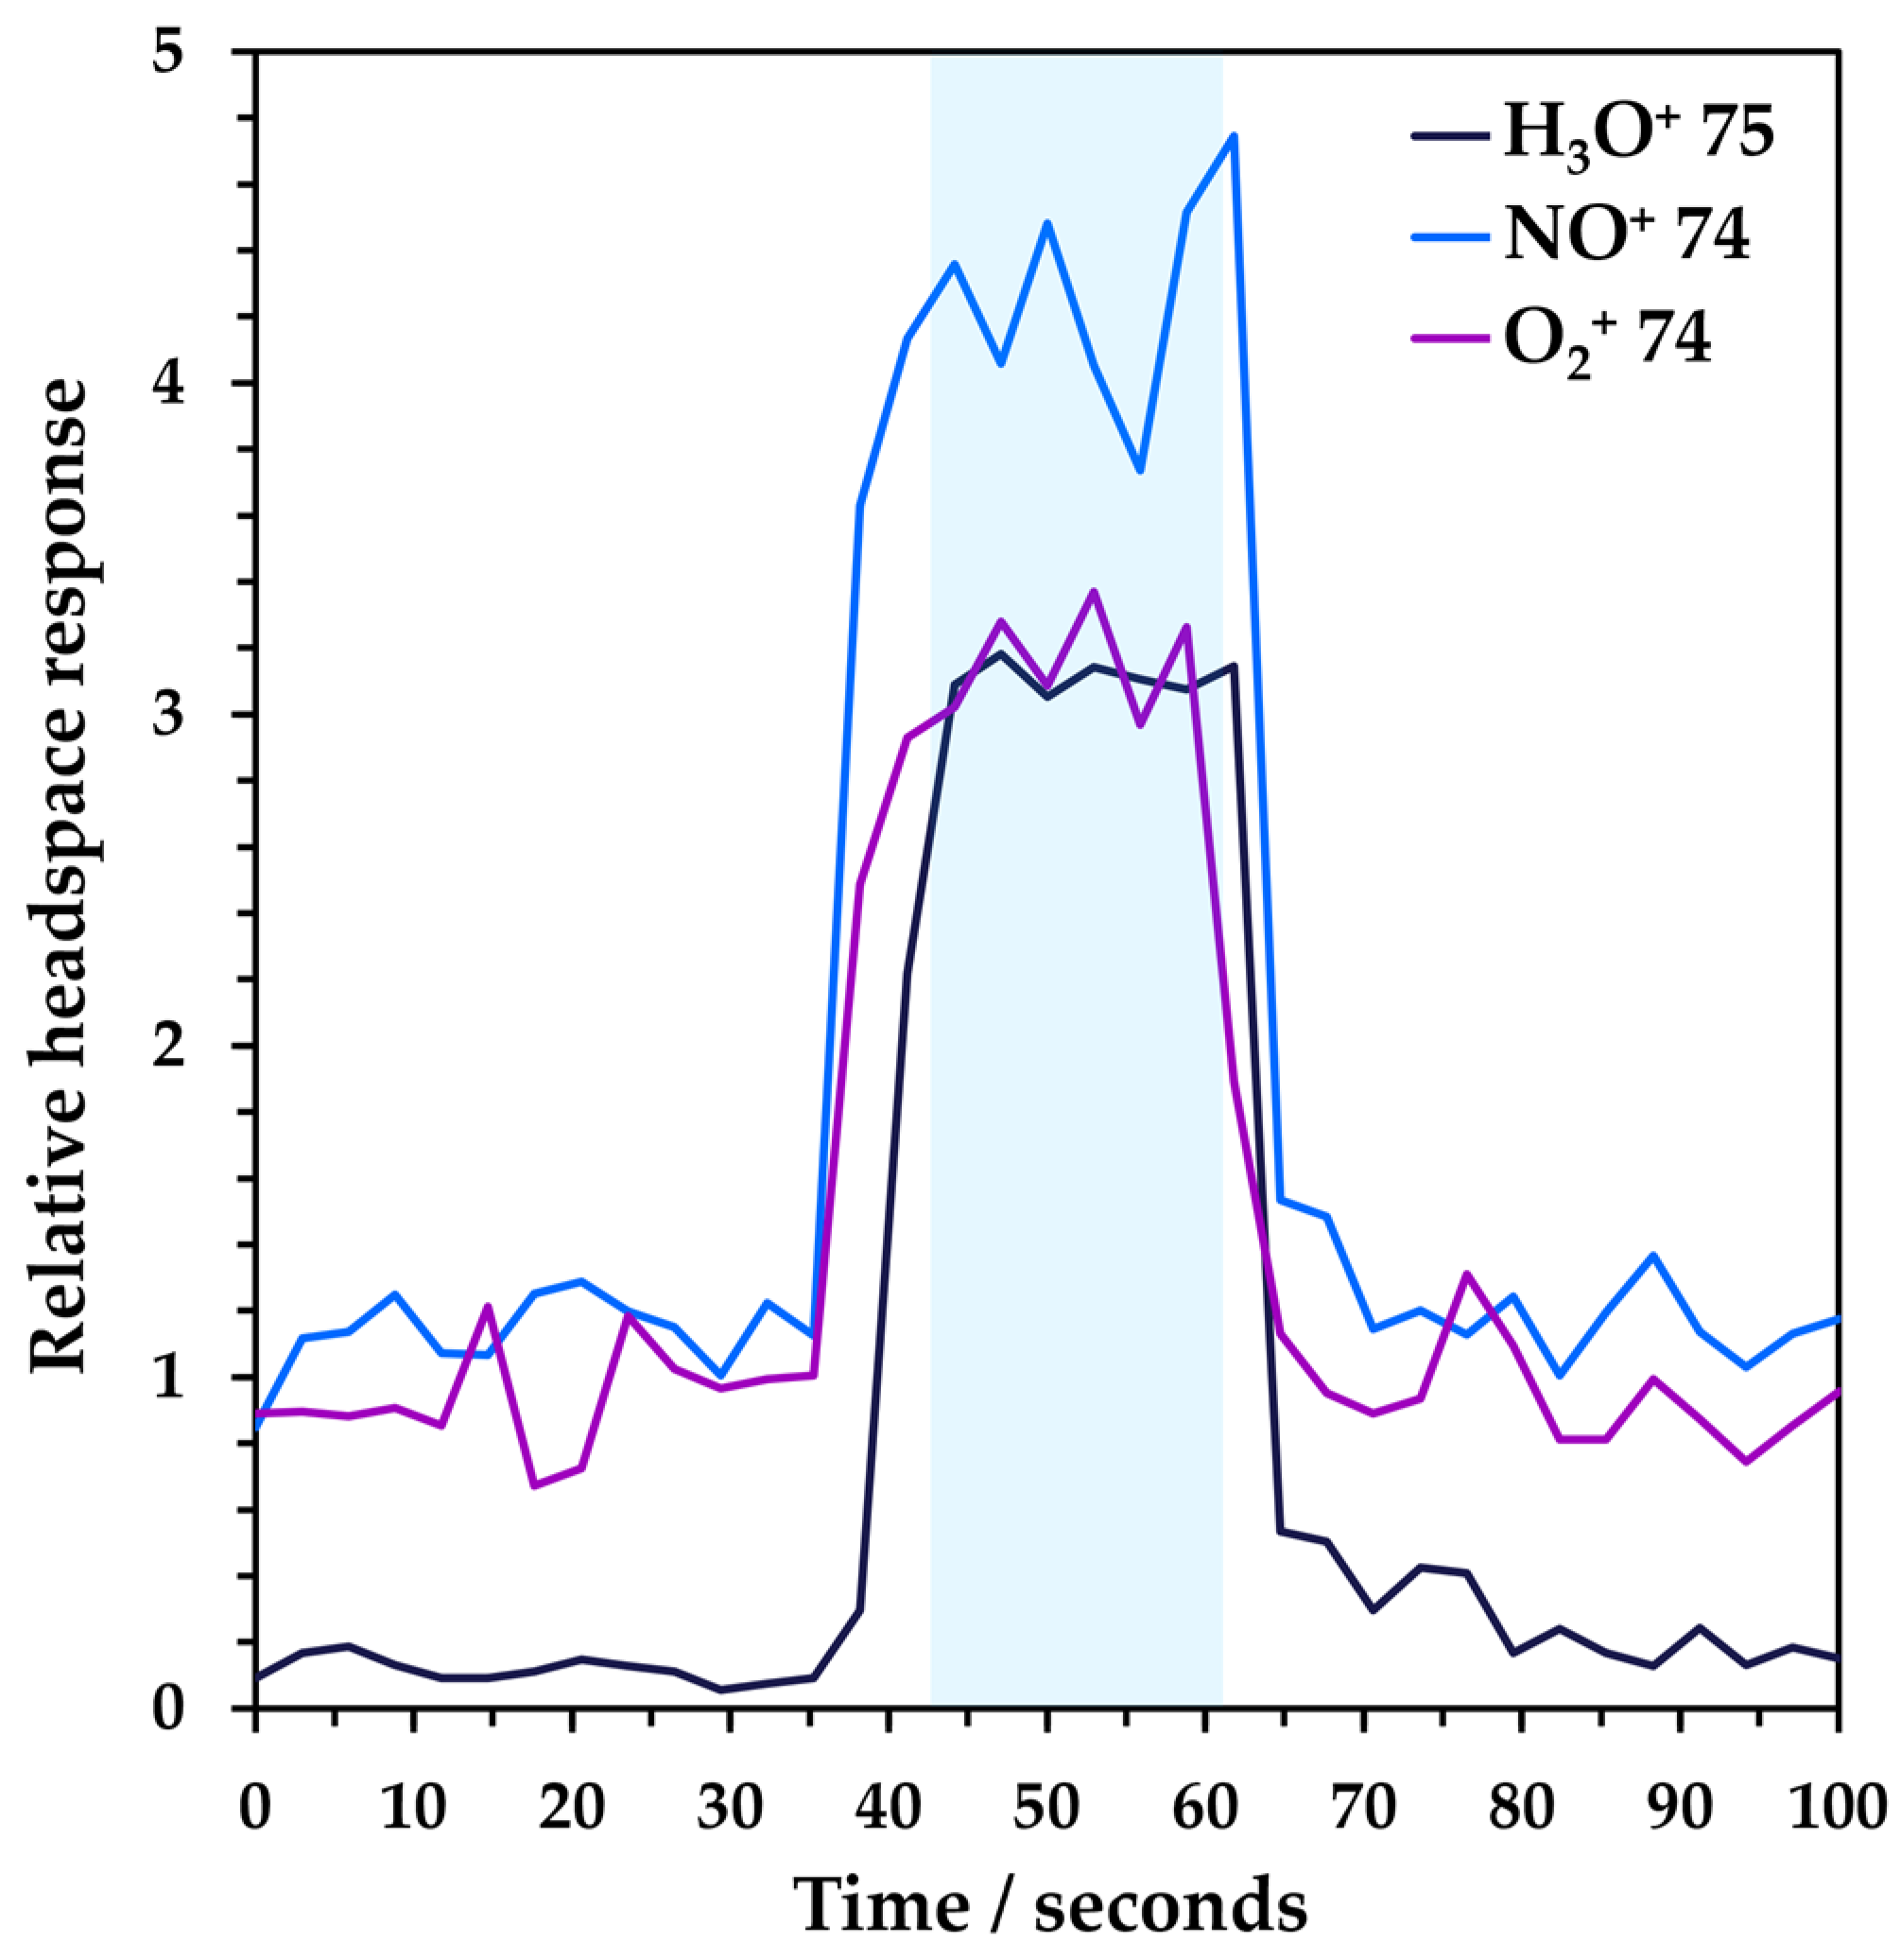
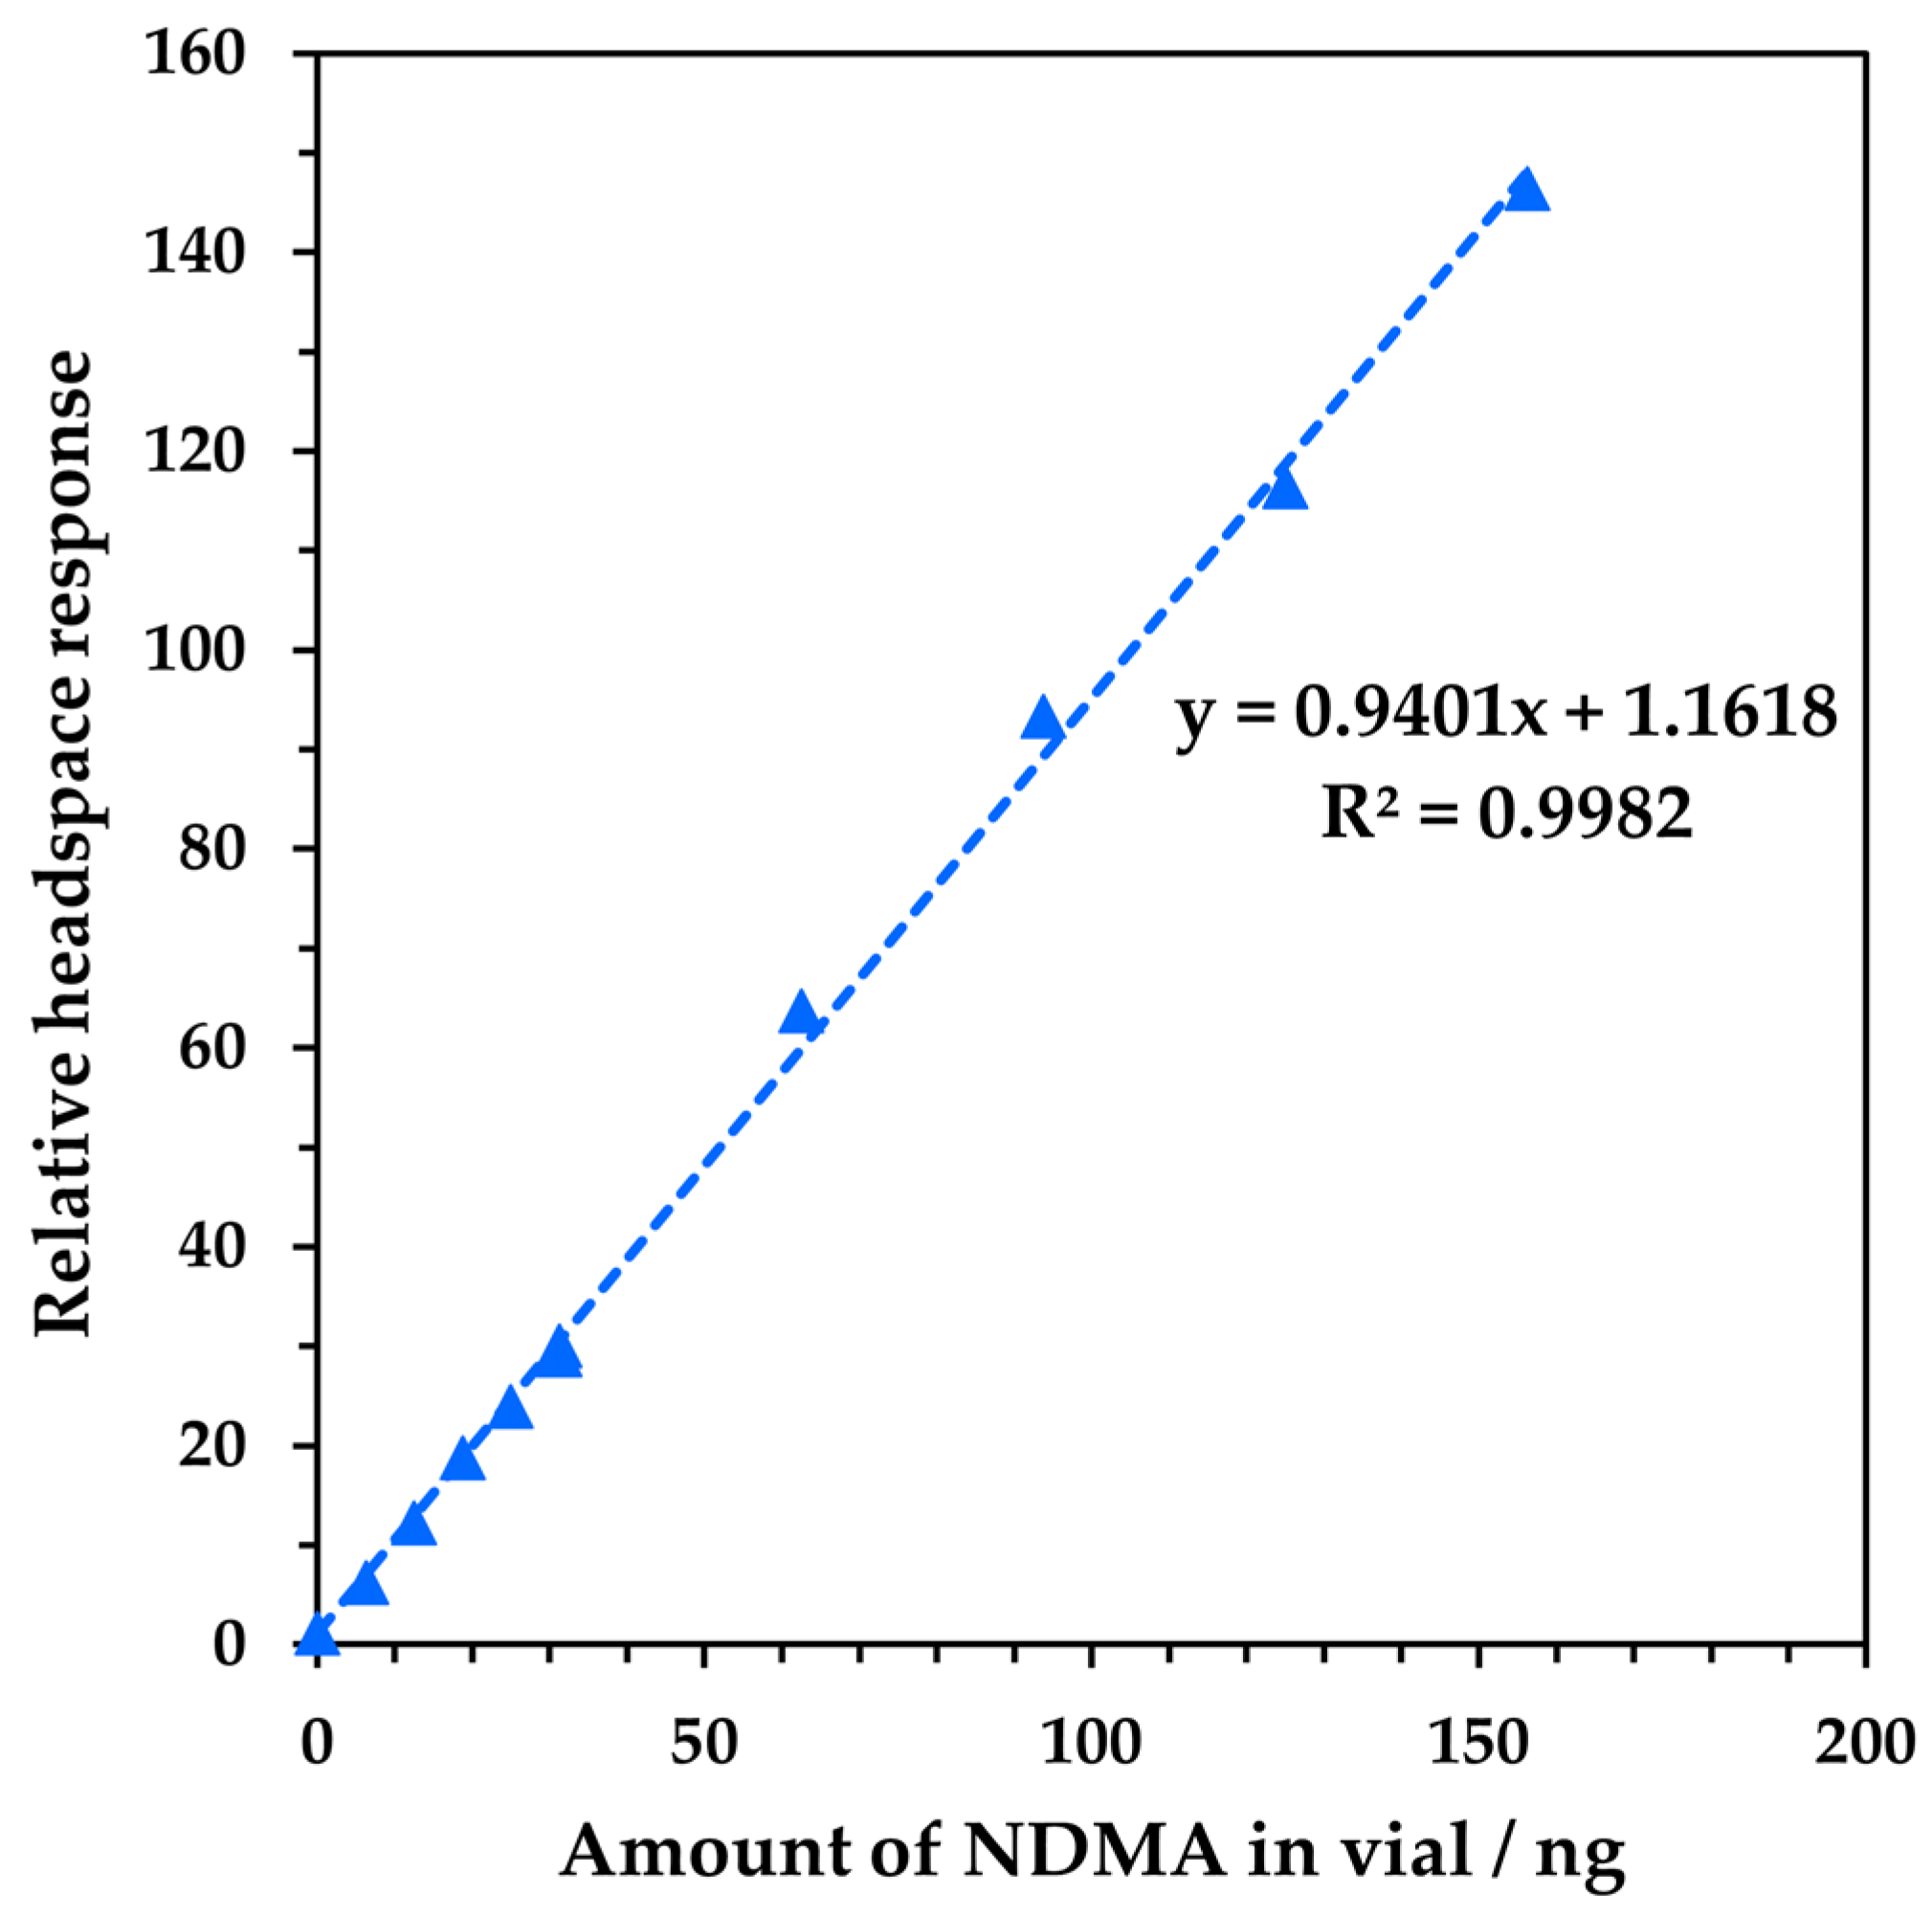
3.1. Analytical Performance of Headspace–SIFT-MS Analysis of NDMA

The first step in method development was to confirm the linear detection of NDMA and determine the limit of quantitation (LOQ) for headspace analysis. Using the procedure described in Section 2.2.2, calibration curves were generated over two ranges for the three product ions used to target NDMA (see Figure S2 in the Supplementary Materials). The presence of solvent in the standard (methanol in the higher range and methanol plus acetone in the lower range) resulted in non-linear (quadratic) calibration curves for product ions H3O+ and O2+• for the reasons described in Section 2.2.1 [20], while the curve for NO+ was linear due to this reagent ion’s much lower sensitivity to methanol [32] and moderate sensitivity to acetone [33]. The latter was used as a diluent in the lower concentration region to attempt the stimulation of a non-linear response in NO+, but the NO+ remained robust. Although the solvents do not originate from a drug product, but rather from the calibration mixture, the effect is the same. With no chromatographic separation, they are present in the ionization region of the SIFT-MS instrument (the flow tube) and compete with NDMA for the selected reagent ion. At the high concentration end of Figure S2a there is about 60 ppmV of methanol in the headspace. NO+ is unaffected by methanol, but H3O+ (especially) and O2+• are, causing increasing over-reporting as the concentration increases. Because of this behaviour, the NO+ product ion (m/z 74) is used as the quantitation ion, while O2+• and H3O+ are used as qualifier ions. Nevertheless, in both situations, linear and quadratic fits yielded linear regression coefficients (R2) greater than 0.996. The linearity of the quantitation ion combining both dilution ranges is shown in Figure 3.
The signal-to-noise ratio (S/N), limit of detection (LOD), and LOQ for the gas-phase SIFT-MS analysis of NDMA are summarized in Table 2. These results are applicable to a 2.5 mL aliquot of headspace injected at 100 μL s−1 and were calculated from the low-concentration headspace injection shown in Figure 1. From these data, the LOQ for drug products is estimated at 2 ng g−1 for a 500 mg sample.

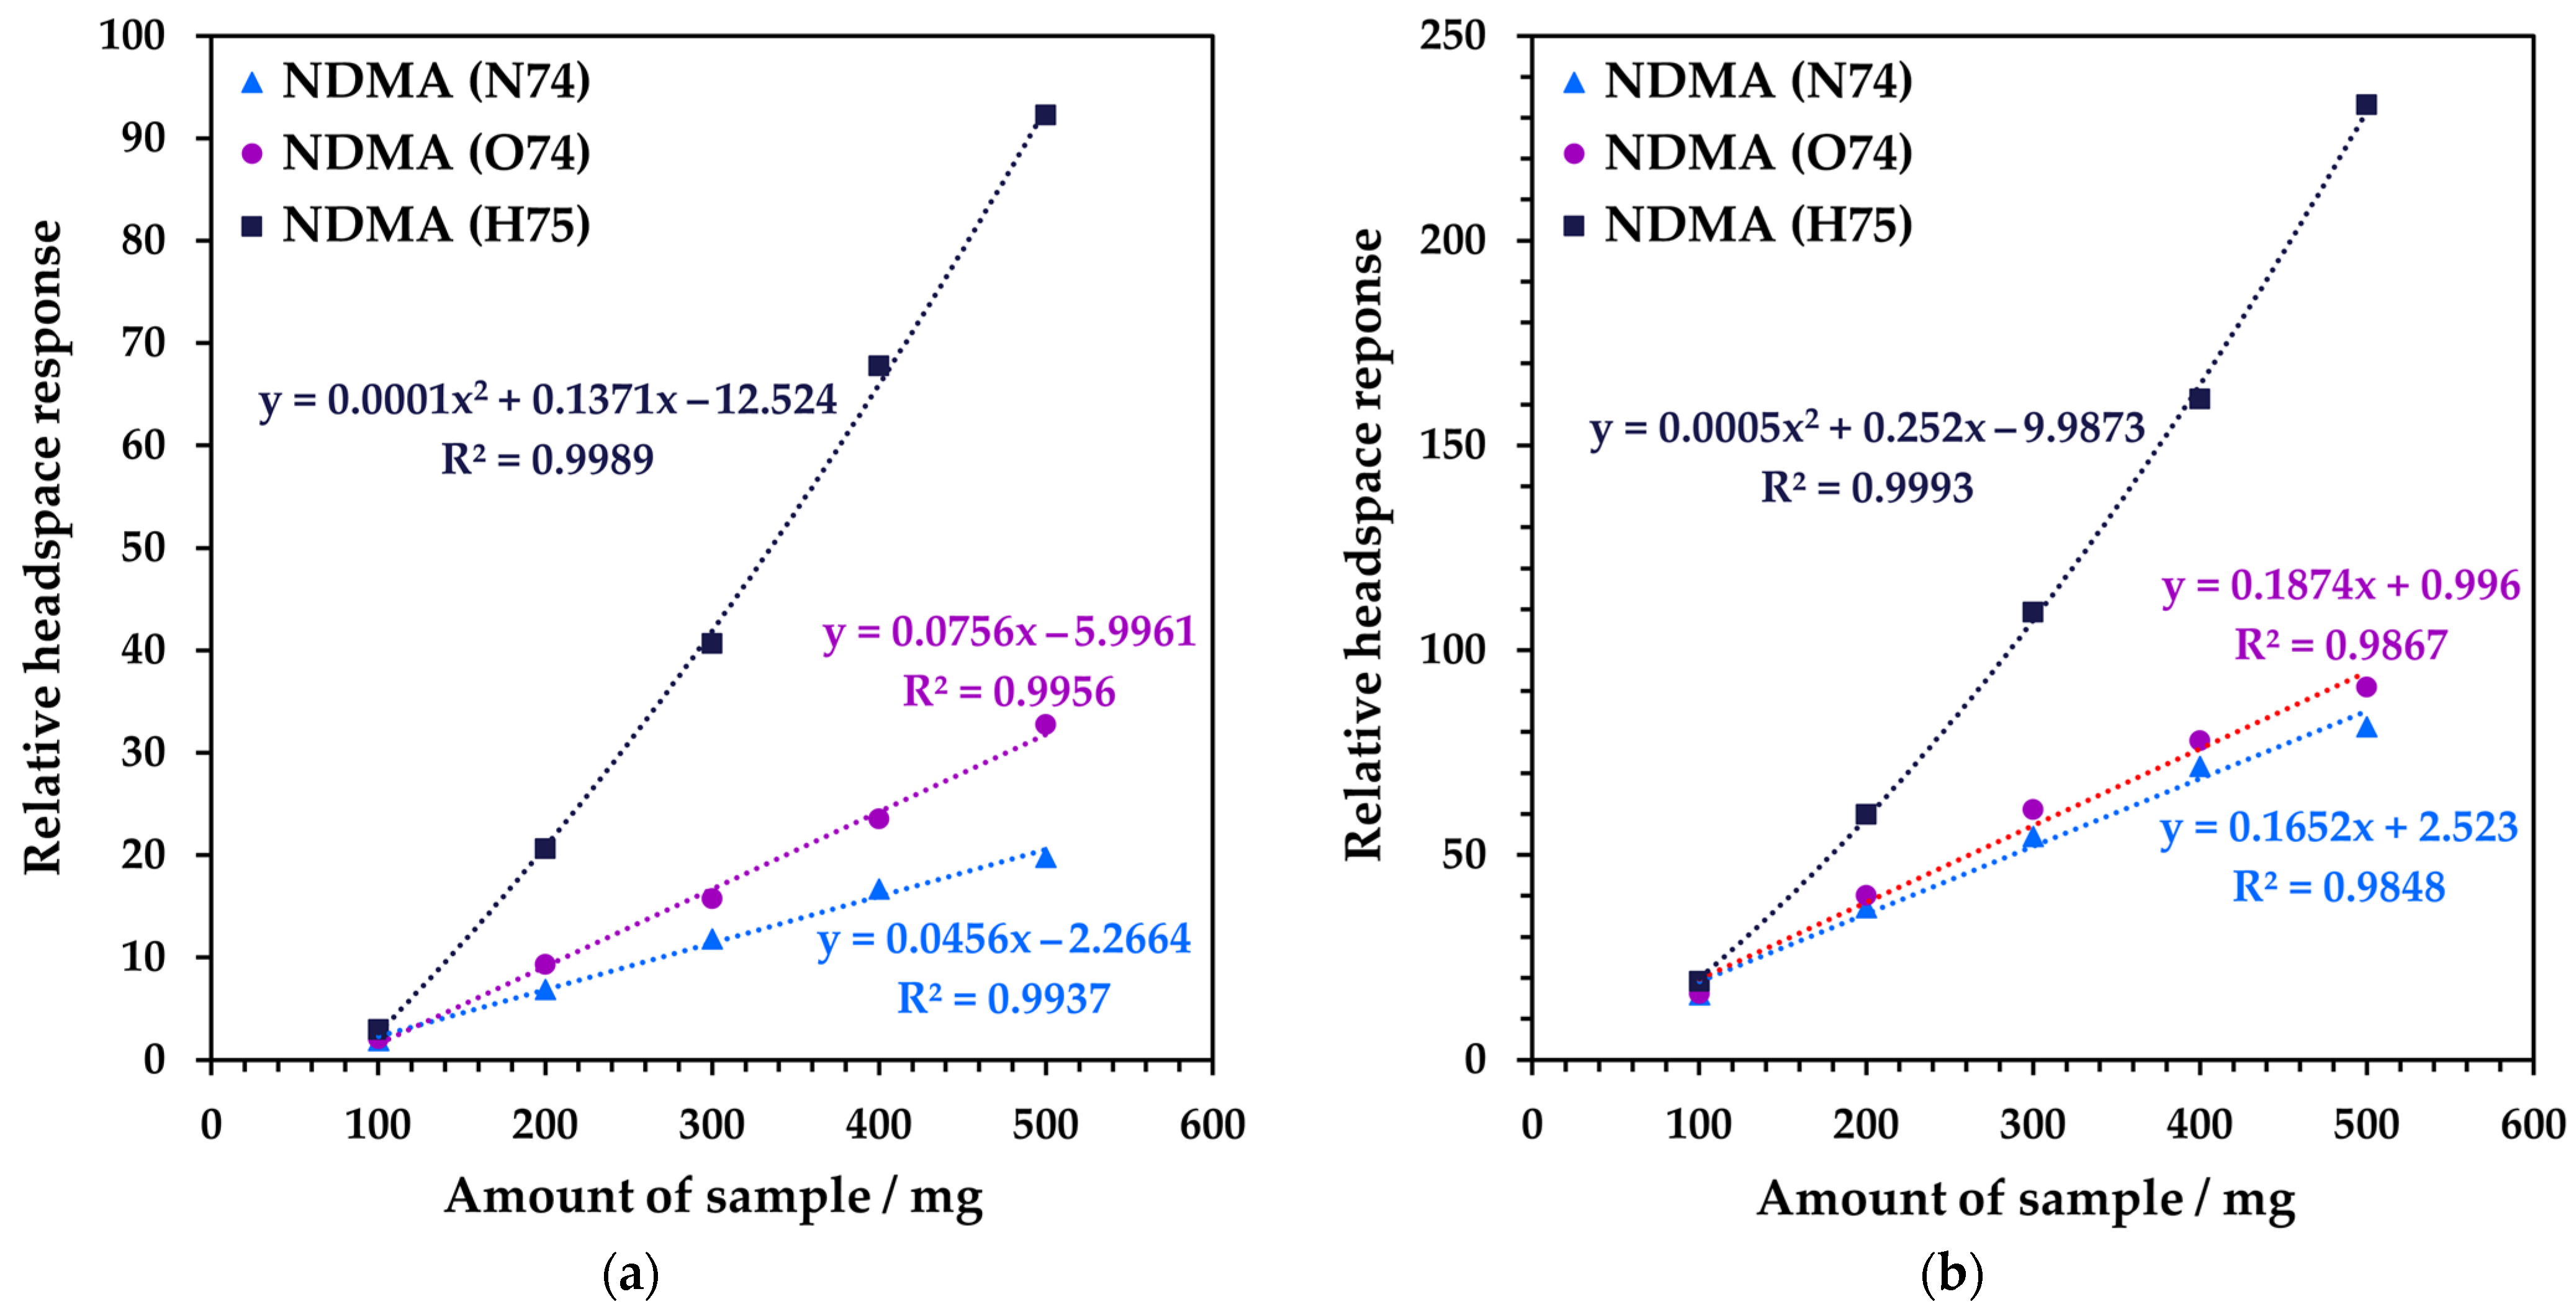
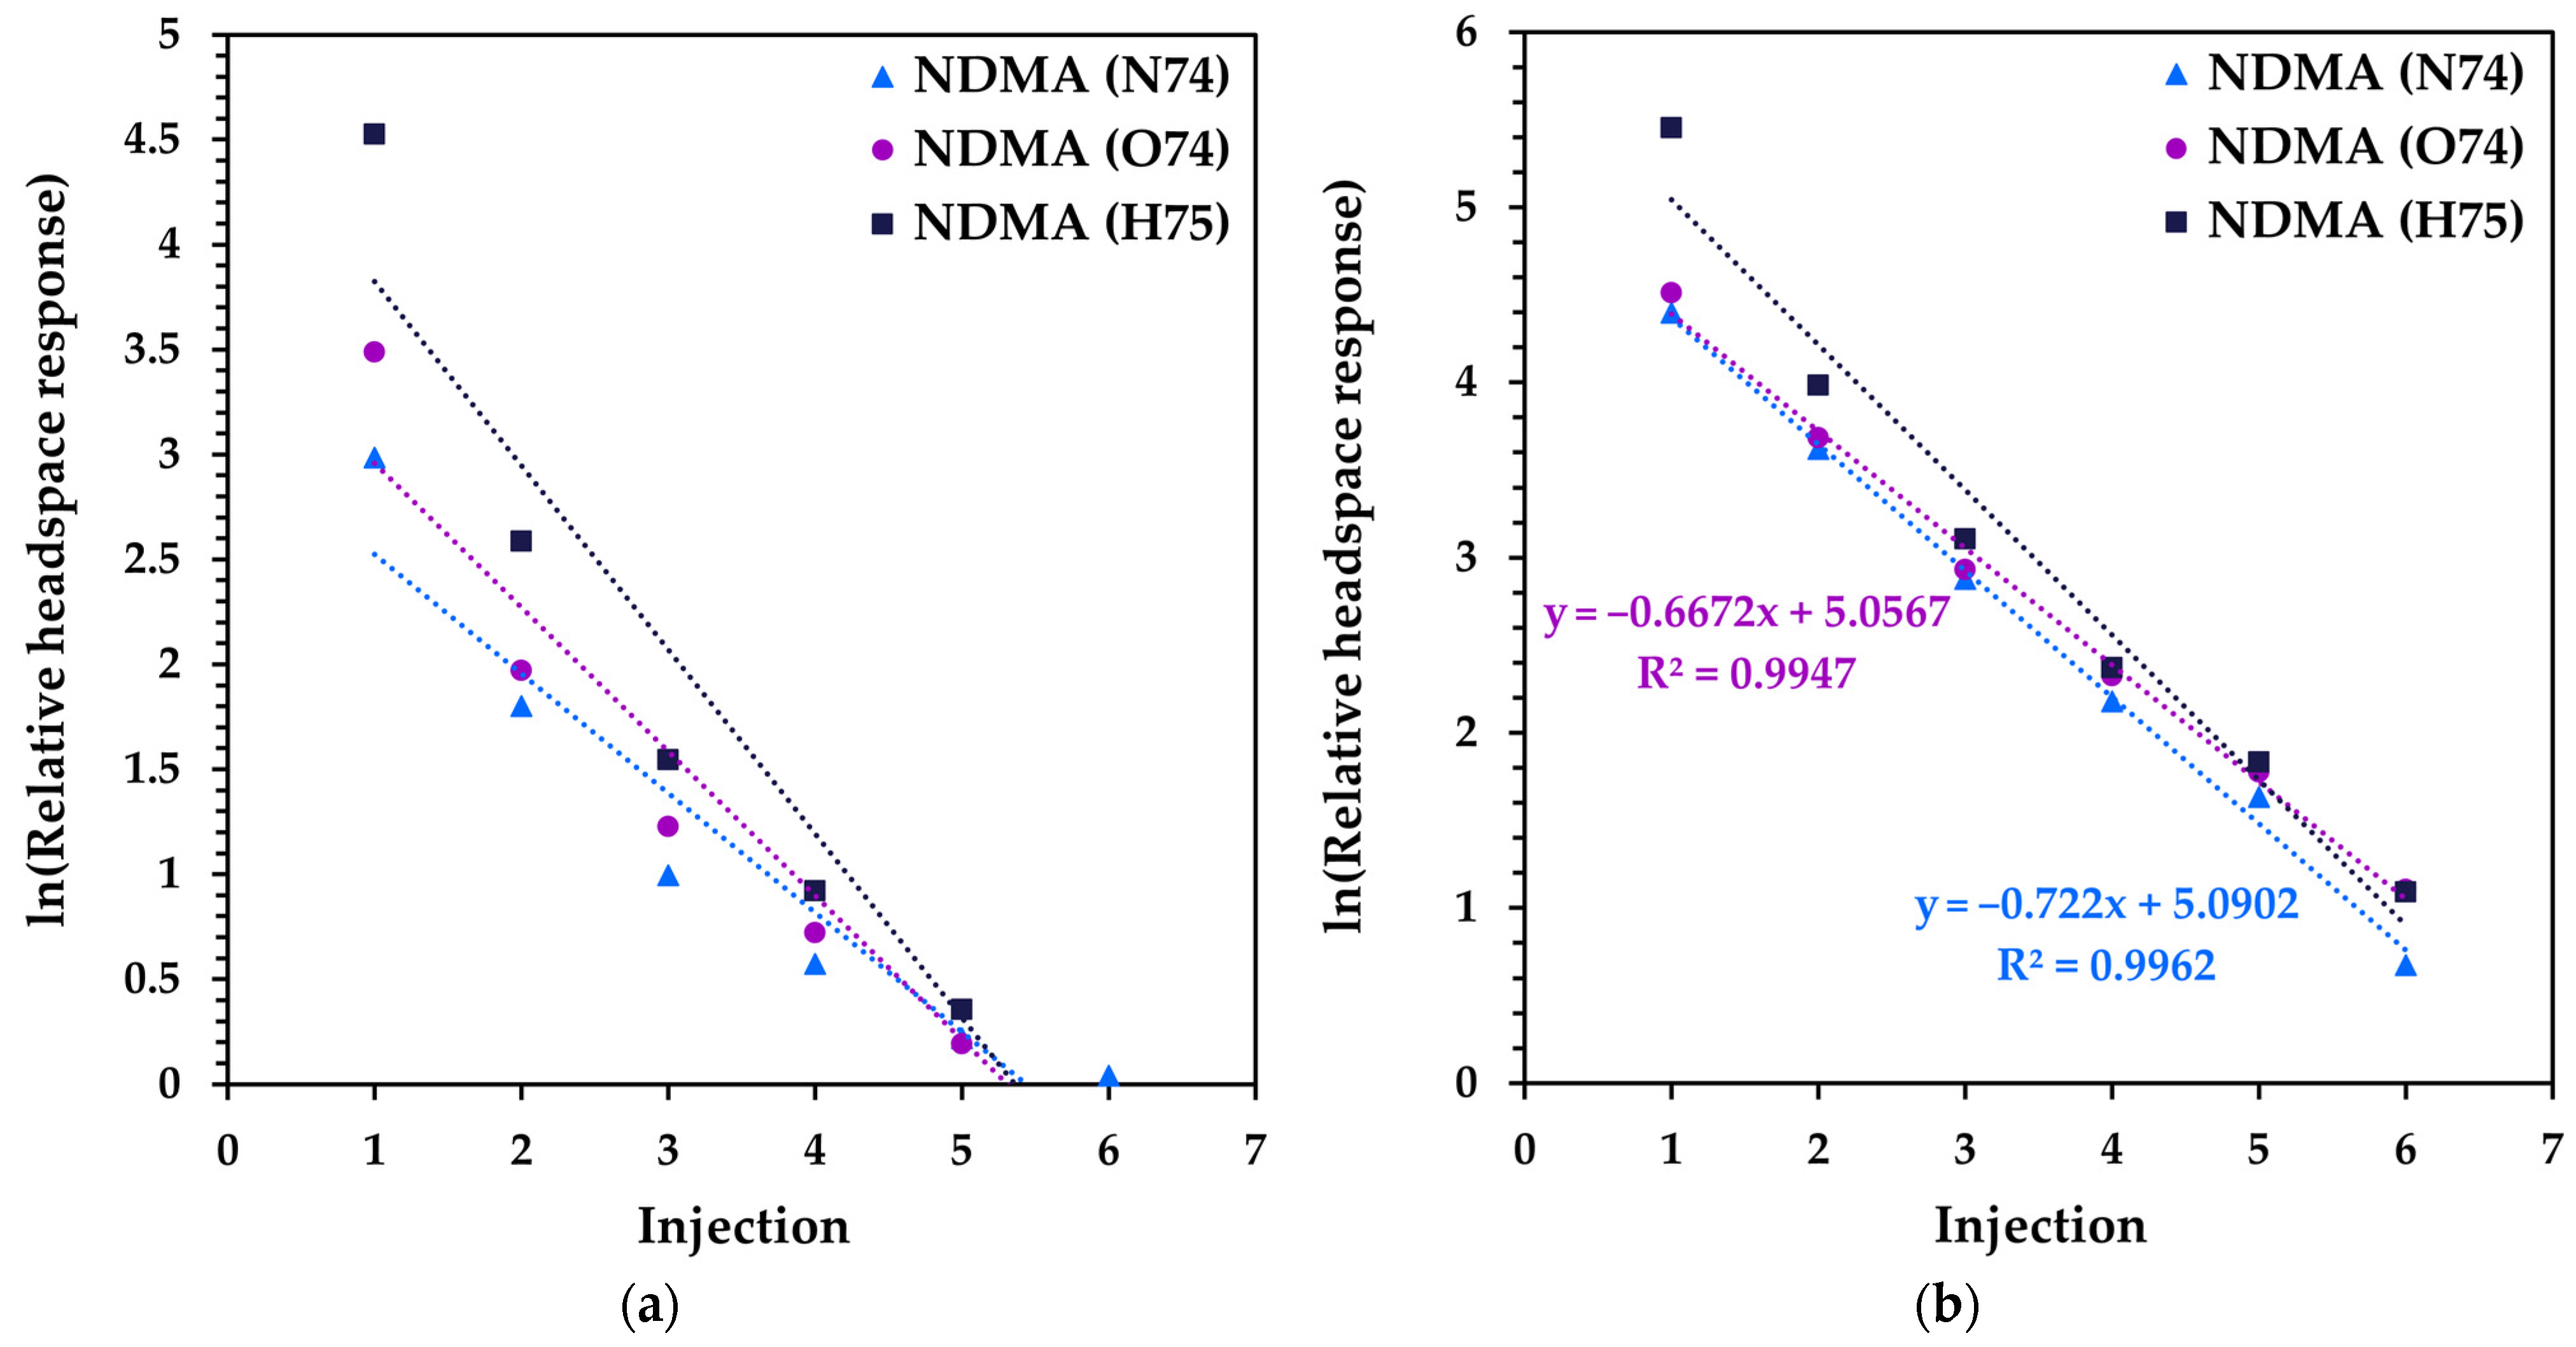
3.2. Method Development for Quantitative SIFT-MS Analysis of Tablet Formulations

Multiple headspace extraction (MHE) enables absolute concentrations to be determined in condensed phases independent of the matrix [21] (pp. 45–49, 221–237). Successful MHE requires analysis over a dynamic range of approximately two orders of magnitude to enable a good fit to the decay of the VOC signal [22]. Hence, the first step is to optimize the amount of sample (100–500 mg) that should be utilized from static headspace analysis (at equilibrium; see Figure 4). For the ranitidine samples, the NO+ signal levels suggest that 500 mg of drug product can be utilized. Hence, full MHE was conducted using this quantity and the results obtained over six MHE injections were plotted against the natural logarithm of concentration in Figure 5. It is evident that sample R1 (Figure 5a) has no product ion signals that behave linearly with injection number, while NO+ and O2+• both behave well for sample R2. Under these incubation conditions, the NDMA concentration in both drug products is essentially at the baseline by the sixth injection. In this situation, when the conventional area-under-the-curve approach to determining total concentration in the drug product cannot be adopted, the concentration measurements from the individual injections can be summed instead. For Product 2, the conventional area-under-the-curve-approach was used to derive the final concentration [22], while for Product 1, the values obtained for injections 1–6 were added together. The NDMA concentrations in drug products R1 and R2 are 68 and 328 ng g−1, respectively, which lie in the range reported to the US FDA for ranitidine products [34].
Although some MHE curves do not exhibit a linear relationship with injection number when the natural logarithm is applied, the results obtained are very repeatable. Triplicate measurements were obtained for 300 mg samples and gave relative standard deviations (RSDs) in the ranges 1.5–2.7% and 3.6–5.5% for products R1 and R2, respectively. The data are summarized in Figure S3, where the over-reporting of O2+• is evident (due to the consumption of the reagent ion signal [20,26]). These data used the full six-injection MHE approach with no internal standard, as is common practice with SIFT-MS [35]. This illustrates the high repeatability of the SIFT-MS technique even in non-ideal matrices.
The excellent repeatability enables the use of a single headspace injection per sample rather than full MHE because the latter is repeatably correlated to the first injection, as demonstrated for MHE-SIFT-MS analysis of polystyrene [22]. Note that the sample headspace must be at equilibrium, as for full MHE. For samples R1 and R2, the ratio of the first injection and the sum of injections (1 to 6)—i.e., the “MHE calibration”—averaged across three replicates each was 0.588 and 0.598, respectively, with corresponding RSD of 4.3% and 0.2%. The excellent inter-product comparability coupled with high repeatability per sample supports the proposed MHE calibration approach, meaning that subsequent ranitidine samples could be analysed using a single static headspace analysis at equilibrium, enabling a post-calibration sample throughput of 12 samples per hour to be achieved.
The applicability of the above MHE procedure optimized for the ranitidine products was also evaluated on a single recalled valsartan tablet (sample V1; Table 1 [36]). The full six-injection MHE results are shown in Figure S4 (Supplementary Materials) and demonstrate excellent comparability across the three quantification and qualification ions that were simultaneously acquired to ensure specific analysis of NDMA. By using the conventional area-under-the-curve quantitation approach for MHE [22], followed by applying NDMA calibration (Section 2.2.2), 213 ng of NDMA was measured in the expired valsartan tablet (over double the acceptable intake [12,13]). Although the authors do not have a reported value within expiry to compare to, it is noteworthy that this value is low compared to reported values of up to 22 μg per tablet [29]. Headspace partitioning is lower for this drug product than for the ranitidine products (the first injection is 0.16 for V1 versus nearly 0.60 for R1 and R1) and demonstrates that MHE calibration is required for different drug product matrices.

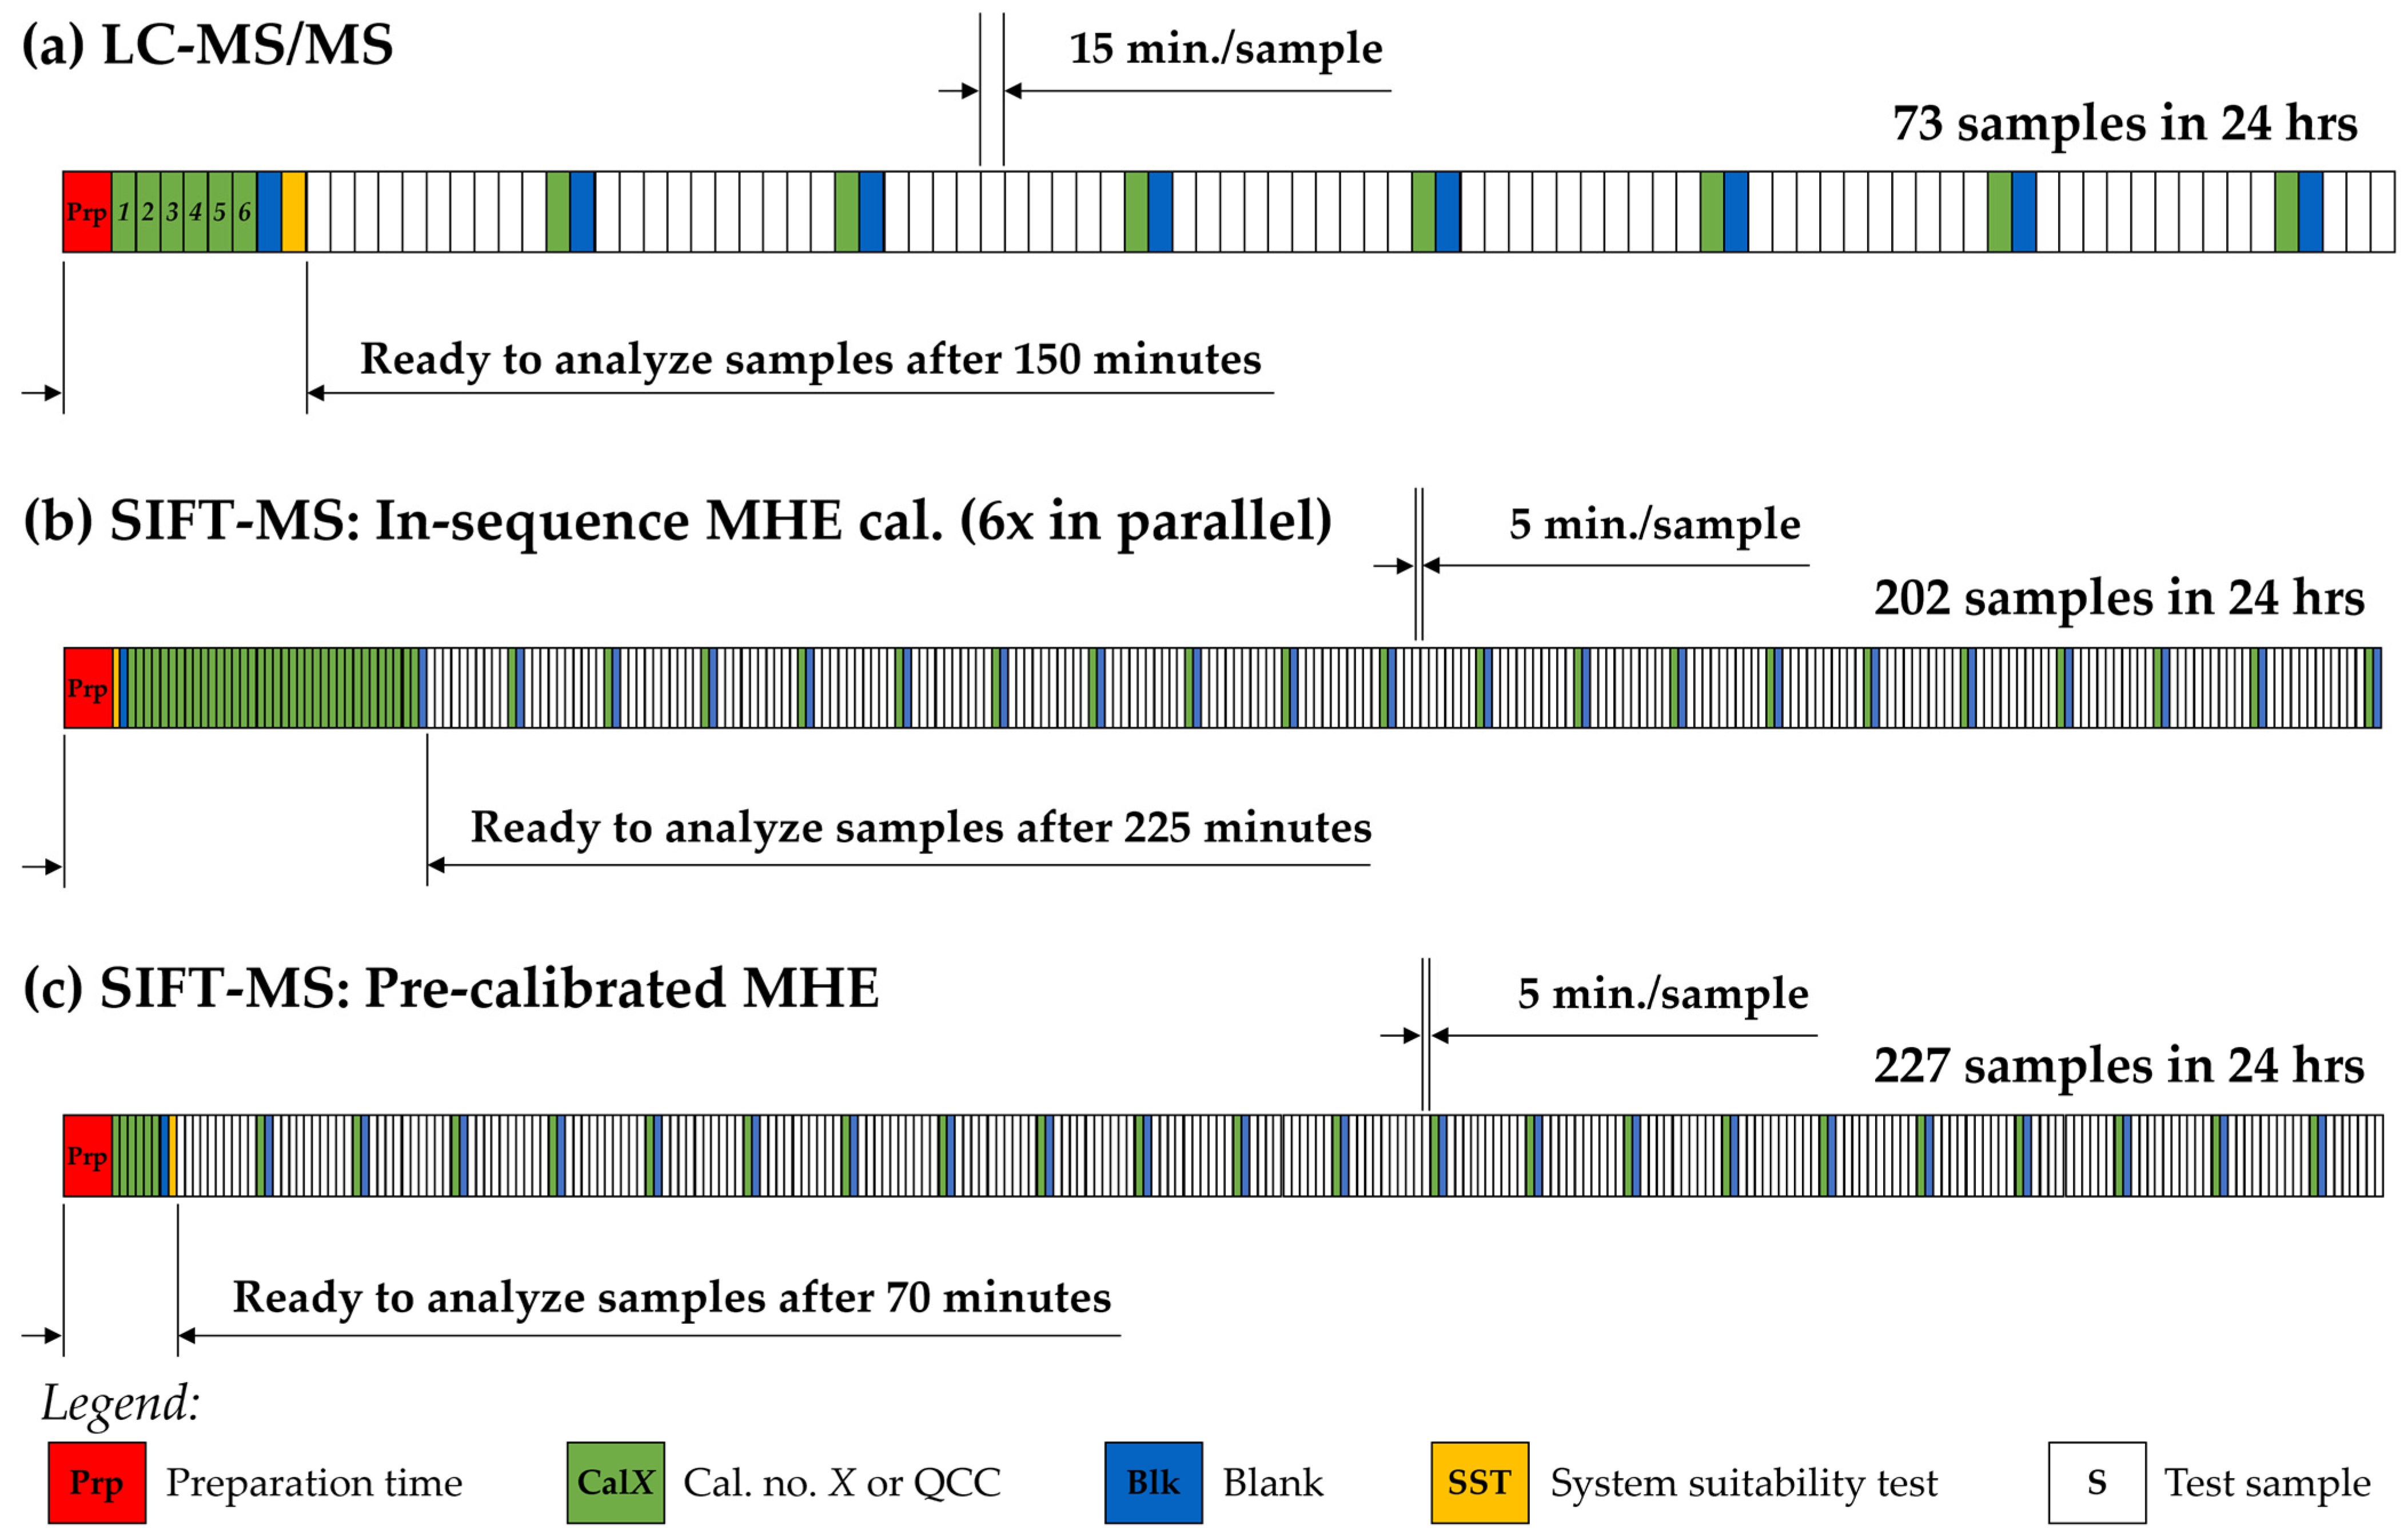
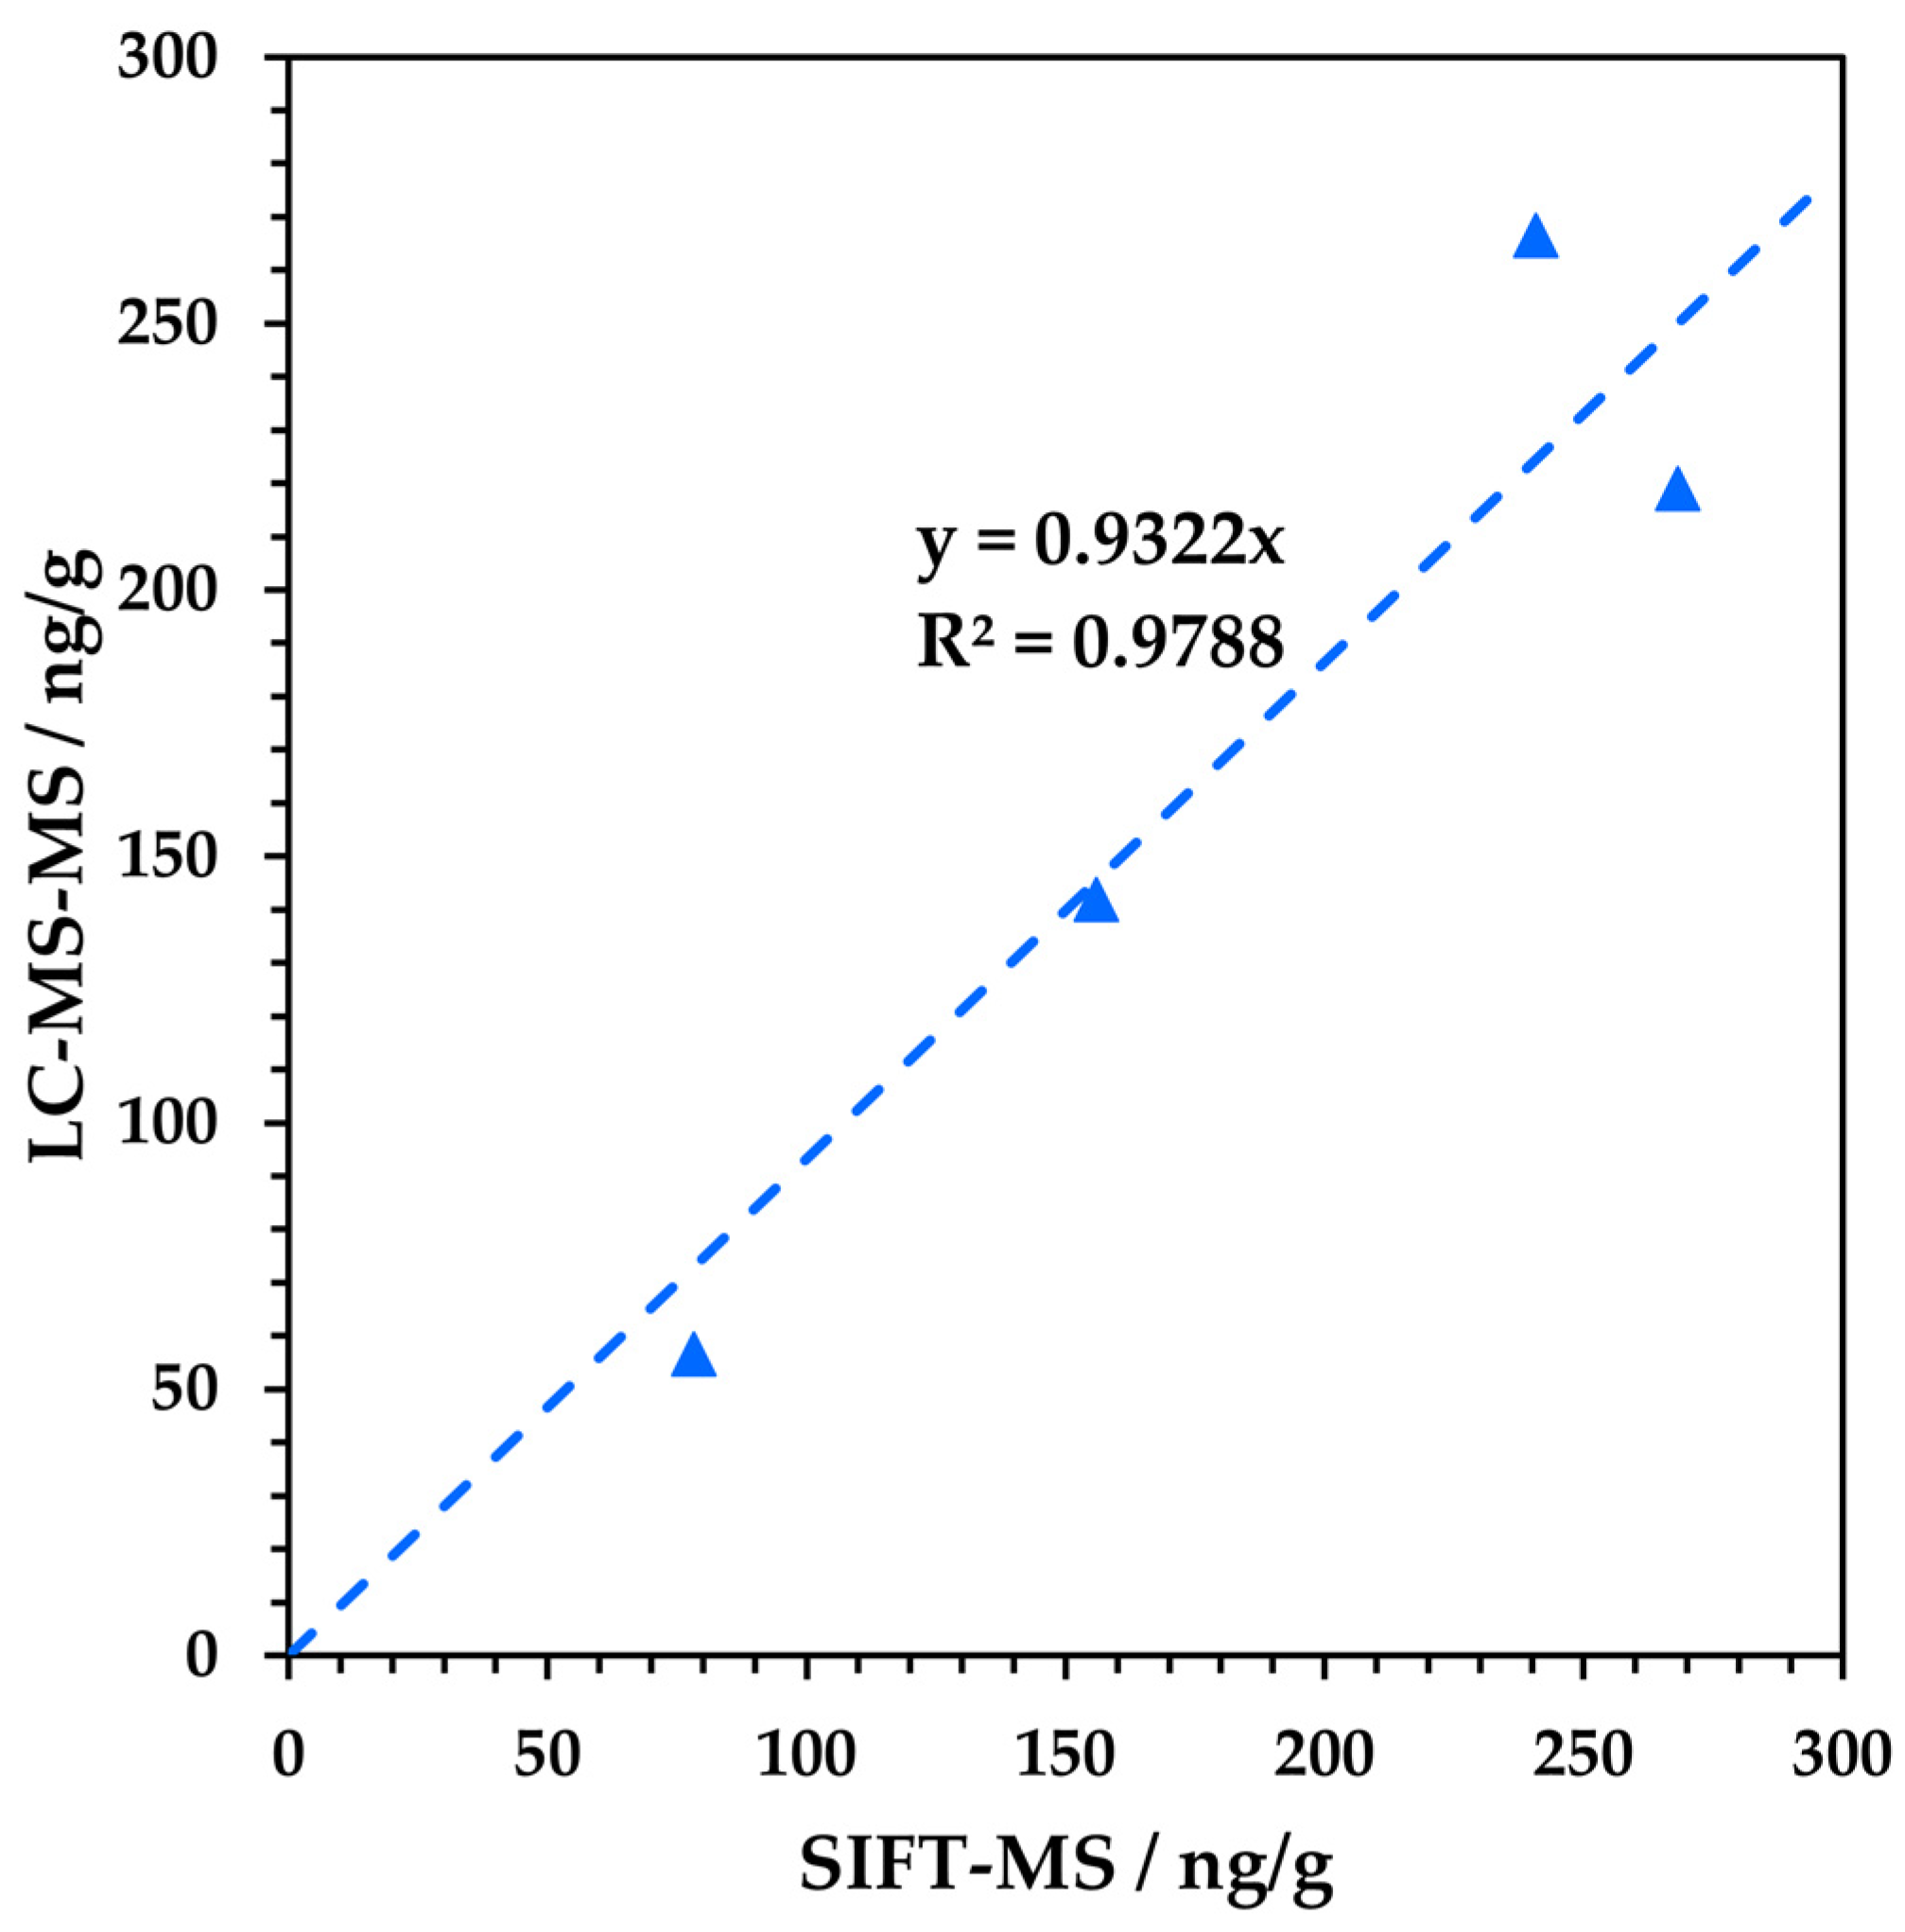
3.3. Head-to-Head Comparison with LC-MS/MS

The previous subsection described the development of an MHE-SIFT-MS procedure for the analysis of NDMA in powdered drug products. The results obtained in method development indicate that the procedure reports the correct order of magnitude, but they were not benchmarked against the more established chromatographic procedures. Hence, samples from six batches of recalled metformin (M1–M6; Table 1) were tested side-by-side using the SIFT-MS method and a validated dissolution-LC-MS/MS procedure [31]. The results obtained are summarized in Table 3 and the correlation is shown visually in Figure 6. Note that for two samples (M5 and M6), the matrix resulted in the suppression of the ion signals in the LC-MS/MS analysis. It was outside the scope of the present study to undertake further development of the LC-based method to enable the measurement of these samples, so no data are reported. For the four samples that both techniques measured, results showed good agreement considering the very different approaches to sample preparation and analysis. Furthermore, although the test samples were significantly past their respective expiration dates, the values reported here are very much within the correct concentration range of 60 to 190 ng per tablet reported by the US FDA in May 2020 [37]. This suggests that headspace–SIFT-MS could be utilized for faster product screening.

4. Discussion

The previous section presented the results obtained during the development of an MHE-SIFT-MS procedure for the quantification of NDMA in drug products direct from the headspace above powdered samples (i.e., avoiding dissolution in solvent). The method was also compared to a conventional LC-MS/MS procedure. In this section, the results are discussed in the context of potential advantages and disadvantages of the proposed MHE-SIFT-MS procedure compared to the conventional approach, with emphasis on the likely breadth of application of the approach.
It is evident from Table 3 and Figure 6 that—for the samples which both the SIFT-MS and LC-MS/MS procedures were able to analyse—there is good agreement between the techniques given the very different sample preparation and analytical approaches. The potential advantage of SIFT-MS lies in reducing the sample preparation and increasing the sample throughput of analysis. The latter is more important and relies upon ‘collapsing’ the procedure to a single headspace analysis so that the slow, full MHE procedure does not need to be conducted for all samples [22]. For the limited ranitidine sample set, the comparability across products from two manufacturers that have utilized different residual solvents (Figure 5 and Figure S1) was very good—the MHE calibrations (i.e., the ratio for the first injection to the sum of the six MHE injections) were 0.588 and 0.598 for R1 and R2, respectively. Table 4 shows the results obtained for the six metformin samples. The RSDs calculated across these samples for the MHE calibration and the slope of the MHE fit were less than 12% and 14%, respectively. Given that this calculation is made across metformin products from three manufacturers and four different products and/or batches from one of these manufacturers (Table 1), these results suggest that MHE calibration is applicable across products. On this basis, it is also likely that it can be applied at least across a day [22], or possibly longer given the stable performance observed for formaldehyde in a gel matrix [23]. Assuming daily MHE calibration using six samples and a 5 min headspace analysis (per injection), schematic sequence schedules are shown in Figure 7, comparing the LC-MS/MS and optimized MHE-SIFT-MS procedures (with both in-sequence and pre-sequence MHE calibration. Figure 7 assumes that samples and standards are prepared on the day of analysis. For MHE-SIFT-MS, it is assumed that MHE calibration will be conducted on representative samples. Depending on the variability of samples, averaging can be conducted accordingly, and the result applied to the single static headspace measurements made throughout the day. Based on this workflow evaluation, SIFT-MS could provide a three-fold daily throughput increase compared to LC-MS/MS. Comparing the time to first analytical result, conducting an in-sequence MHE calibration slows the initial SIFT-MS reporting (it takes 33% longer than LC to be ready to test samples; Figure 7b), but when utilizing pre-calibration (Figure 7c), the analysis of test samples can begin in less than half the time required for the LC sequence. Note, however, that the calibration of the analyte is clearly necessary in very different drug products, given the variation in MHE calibration results obtained for the ranitidine (approx. 0.60), valsartan (0.16 based on area under the curve), and metformin (0.11) products. (The larger the value of the MHE calibration, the greater the release of volatile impurity from the drug matrix in the first injection.) An investigation of the breadth of applicability of the MHE calibration should be made during method development. Quality control check standards (QCCs) under this approach should be equivalent to the representative samples used for the initial daily MHE calibration plus NDMA concentration check standards within the range appropriate to the drug product (from this study, 100 ng in a 10 mL sample vial would be satisfactory).
It is, however, conceded that the MHE-SIFT-MS approach will not always be advantageous. For example, for very short sample runs the set-up time and time to report a first result will likely be better for LC-MS/MS unless the calibration for MHE-SIFT-MS is durable longer-term (e.g., weekly calibration). Note that this needs to be investigated in a future study; limited drug-product samples precluded its evaluation here. For some matrices, residual solvent levels in headspace may be so high that quantitative analysis using SIFT-MS is not possible [20] and/or solvents could interfere with the measurement of the analyte [26]. In the three drug products investigated here, trace DMF interference was, however, easily corrected [26]. Finally, it is conceivable that headspace composition in some drug products might be too complex for SIFT-MS to resolve since it does not provide a temporal separation of analytes because chromatography is eliminated. This will be apparent very early in method development. It should be noted, however, that chromatographic techniques are not immune to matrix effects. In this study, for example, the LC-MS/MS procedure could not analyse NDMA in two of the metformin samples due to ion suppression, whereas headspace–SIFT-MS analysed all six samples readily using the procedure developed in Section 3.2. Furthermore, the previously published extraction method [32] required significant modification for use on the metformin products rather than water-soluble API, whereas the same SIFT-MS method has proved applicable across multiple drug products containing three APIs.

5. Conclusions

This study has demonstrated that SIFT-MS can analyse NDMA impurity to low ng g−1 concentrations in drug products containing three APIs: metformin, ranitidine, and valsartan. In all matrices investigated, SIFT-MS provided specific analysis through the m/z 74 product ion formed from the reaction of NDMA with NO+. The O2+• and H3O+ product ions at m/z 74 and 75, respectively, are useful qualifier ions in these matrices. The ability to utilize multiple product ions (especially from different reagent ions) simultaneously in one real-time analysis is critical to achieving specificity while eliminating chromatography. Where a comparative analysis was conducted against a validated LC-MS/MS method, the results obtained using SIFT-MS compared well. As for any analytical technique, SIFT-MS is not expected to provide an analytical solution for all drug matrices, just as the LC-MS/MS method used here was not suited to two metformin samples due to ion suppression. However, the results obtained during this method development study suggest that SIFT-MS is worthy of further evaluation for the analysis of (i) NDMA in other matrices, and (ii) other volatile nitrosamines in relevant drug products (e.g., those nitrosamines demonstrated in [19]).
Compared to conventional chromatographic approaches for nitrosamine analysis, which generally involve dissolution in solvent followed by the direct injection of the solution, the novel SIFT-MS approach quantifies directly from the headspace of the powdered drug product. This is achieved by utilizing MHE—a long-established static headspace technique that enables matrix-independent quantitation—with SIFT-MS. Normally a slow technique due to repeated analysis of the same sample, fast SIFT-MS analysis (5 min per headspace sample) facilitates faster analysis for the full multiple-injection procedure through the running of multiple samples concurrently rather than sequentially (using chromatographic systems) [22]. Further throughput enhancement is achieved by correlating the first headspace injection with the full MHE procedure. This means that SIFT-MS can potentially deliver a daily sample throughput about 200% higher than that of the LC-MS/MS method. The MHE-SIFT-MS technique may therefore be suitable for application as a fast screening tool in routine testing laboratories, supporting expanded quality assurance/quality control (QA/QC). It must be emphasized, however, that full validation of the MHE-SIFT-MS procedure still needs to be conducted. Finally, the real-time analysis provided by SIFT-MS (Figure 1; [18]) could lend itself to in-process NDMA monitoring applications.

Supplementary Materials

The following supporting information can be downloaded at: https://www.mdpi.com/article/10.3390/appliedchem4010008/s1, Figure S1. SIFT-MS full-scan mass spectra of the two ranitidine-containing drug products containing relatively high levels of residual solvents; Figure S2. NDMA response in presence of (a) methanol and (b) 50:50 methanol:acetone mix; Figure S3. Repeatability of triplicate MHE-SIFT-MS measurements of NDMA (using NO+ 74) in 300 mg samples of the ranitidine drug products; Figure S4. MHE-SIFT-MS results (natural logarithm of headspace concentration as function of injection number) for NDMA in the valsartan-containing drug product.

Author Contributions

Conceptualization, M.J.P. and V.S.L.; methodology, M.J.P. and C.J.H.; formal analysis, M.J.P. and C.J.H.; investigation, M.J.P. and C.J.H.; data curation, M.J.P., C.J.H., and V.S.L.; writing—original draft preparation, V.S.L.; writing—review and editing, M.J.P., C.J.H., and V.S.L.; visualization, V.S.L. All authors have read and agreed to the published version of the manuscript.

Funding

This research received no external funding.

Institutional Review Board Statement

Not applicable.

Informed Consent Statement

Not applicable.

Data Availability Statement

The data that support the findings of this study are available upon reasonable request from the authors.

Acknowledgments

We are very grateful to David Light and Kaury Kucera of Valisure, LLC, New Haven, CT, USA for providing the samples of recalled valsartan and metformin drug products for this study. We also thank Daniel Milligan (Syft Technologies Ltd.) and Leslie Silva (Syft Technologies Inc.) for helpful discussions.

Conflicts of Interest

M.J.P. and C.J.H. are employees of Element Lab Solutions (formerly Anatune) in Cambridge, United Kingdom, a distributor of commercial SIFT-MS instruments in the United Kingdom and the Republic of Ireland. V.S.L. is an employee of Syft Technologies Limited, New Zealand, which is, respectively, a manufacturer of commercial SIFT-MS instruments.

References

  1. Halden, R.U.; Gushgari, A.J. Critical review of major sources of human exposure to N-nitrosamines. Chemosphere 2018, 210, 1124–1136. [Google Scholar] [CrossRef]
  2. Akkaraju, H.; Tatia, R.; Mane, S.S.; Khade, A.B.; Dengale, S.J. A comprehensive review of sources of nitrosamine contamination of pharmaceutical substances and products. Regul. Toxicol. Pharmacol. 2023, 139, 105355. [Google Scholar] [CrossRef]
  3. World Health Organization. N-Nitrosodimethylamine in Drinking Water. 2008. Available online: https://cdn.who.int/media/docs/default-source/wash-documents/wash-chemicals/ndma-2add-feb2008.pdf?sfvrsn=122aa3d3_4 (accessed on 5 February 2024).
  4. McWeeny, D.J. Nitrosamines in beverages. Food Chem. 1983, 11, 273–287. [Google Scholar] [CrossRef]
  5. Park, J.; Seo, J.; Lee, J.; Kwon, H. Distribution of seven N-nitrosamines in food. Toxicol. Res. 2015, 31, 279–288. [Google Scholar] [CrossRef]
  6. Tricker, A.R.; Preussmann, R. Carcinogenic N-nitrosamines in the diet: Occurrence, formation, mechanisms and carcinogenic potential. Mutat. Res. 1991, 259, 277–289. [Google Scholar] [CrossRef] [PubMed]
  7. Boltres, B. Evaluating nitrosamines from elastomers in pharmaceutical primary packaging. PDA J. Pharm. Sci. Tech. 2022, 76, 136–150. [Google Scholar] [CrossRef] [PubMed]
  8. United States Food and Drug Administration (US FDA). FDA Updates on Valsartan Recalls. 2018. Available online: https://www.fda.gov/news-events/press-announcements/fda-announces-voluntary-recall-several-medicines-containing-valsartan-following-detection-impurity (accessed on 5 February 2024).
  9. Golob, N.; Grahek, R.; Ross, M.; Roskar, R. Nitrocellulose blister material as a source of N-nitrosamine contamination of pharmaceutical drug products. Int. J. Pharmaceutics 2022, 618, 121687. [Google Scholar] [CrossRef] [PubMed]
  10. Schlingemann, J.; Burns, M.J.; Ponting, D.J.; Avila, C.M.; Romero, N.E.; Jaywant, M.A.; Smith, G.F.; Ashworth, I.W.; Simon, S.; Saal, C.; et al. The landscape of potential small and drug substance related nitrosamines in pharmaceuticals. J. Pharm. Sci. 2023, 112, 1287–1304. [Google Scholar] [CrossRef] [PubMed]
  11. Thresher, A.; Foster, R.; Ponting, D.J.; Stalford, S.A.; Tennant, R.E.; Thomas, R. Are all nitrosamines concerning? A review of mutagenicity and carcinogenicity data. Regul. Toxicol. Pharmacol. 2020, 116, 104749. [Google Scholar] [CrossRef] [PubMed]
  12. European Medicines Agency (EMA). Questions and Answers for Marketing Authorisation Holders/Applicants on the CHMP Opinion for the Article 5(3) of Regulation (EC) No 726/2004 Referral on Nitrosamine Impurities in Human Medicinal Products, EMA/409815/2020. 2021. Available online: https://www.ema.europa.eu/en/documents/referral/nitrosamines-emea-h-a53-1490-questions-answers-marketing-authorisation-holders/applicants-chmp-opinion-article-53-regulation-ec-no-726/2004-referral-nitrosamine-impurities-human-medicinal-products_en.pdf (accessed on 1 February 2024).
  13. United States Food and Drug Administration (US FDA). Control of Nitrosamine Impurities in Human Drugs: Guidance for Industry. 2021. Available online: https://www.fda.gov/media/141720/download (accessed on 1 February 2024).
  14. United States Pharmacopeia. Nitrosamine Impurities <1469>; United States Pharmacopeia: Rockville, MD, USA, 2021. [Google Scholar]
  15. European Pharmacopeia. N-Nitrosamines in Active Substances, 11th ed.; European Pharmacopeia: Strasbourg, France, 2022; Chapter 2.5.42. [Google Scholar]
  16. Zhang, J.; Selaya, S.D.; Shakleya, D.; Mohammad, A.; Faustino, P.J. Rapid quantitation of four nitrosamine impurities in angiotensin receptor blocker drug substances. J. Pharm. Sci. 2023, 112, 1246–1254. [Google Scholar] [CrossRef]
  17. Smith, D.; Španěl, P. Selected ion flow tube mass spectrometry (SIFT-MS) for on-line trace gas analysis. Mass Spec. Rev. 2005, 24, 661–700. [Google Scholar] [CrossRef]
  18. Smith, D.; Španěl, P.; Demarais, N.; Langford, V.S.; McEwan, M.J. Recent developments and applications of selected ion flow tube mass spectrometry (SIFT-MS). Mass Spec. Rev. 2023, e21835. [Google Scholar] [CrossRef] [PubMed]
  19. Langford, V.S.; Gray, J.D.C.; Maclagan, R.G.A.R.; Milligan, D.B.; McEwan, M.J. Real-time measurement of nitrosamines in air. Int. J. Mass Spectrom. 2015, 377, 490–495. [Google Scholar] [CrossRef]
  20. Perkins, M.J.; Silva, L.P.; Langford, V.S. Evaluation of solvent compatibilities for headspace-SIFT-MS analysis of pharmaceutical products. Analytica 2023, 4, 313–335. [Google Scholar] [CrossRef]
  21. Kolb, B.; Ettre, L.S. Static Headspace-Gas Chromatography—Theory and Practice, 2nd ed.; Wiley–Interscience: New York, NY, USA, 2006. [Google Scholar]
  22. Perkins, M.J.; Langford, V.S. Multiple headspace extraction-selected ion flow tube mass spectrometry (MHE-SIFT-MS). Part 1: A protocol for method development and transfer to routine analysis. Rev. Sep. Sci. 2022, 4, e22001. [Google Scholar] [CrossRef]
  23. Perkins, M.J.; Langford, V.S. Improved MHE-SIFT-MS Workflow: Even Faster Quantitation of Formaldehyde in Gelucire Excipient. Syft Technologies Application Note. 2023. Available online: http://bit.ly/431xTp2 (accessed on 1 February 2024).
  24. United States Food and Drug Administration (US FDA). FDA Requests Removal of All Ranitidine Products (Zantac) from the Market. 2020. Available online: https://www.fda.gov/news-events/press-announcements/fda-requests-removal-all-ranitidine-products-zantac-market (accessed on 5 February 2024).
  25. United States Food and Drug Administration (US FDA). FDA Alerts Patients and Health Care Professionals to Nitrosamine Impurity Findings in Certain Metformin Extended-Release Products. 2020. Available online: https://www.fda.gov/news-events/press-announcements/fda-alerts-patients-and-health-care-professionals-nitrosamine-impurity-findings-certain-metformin (accessed on 5 February 2024).
  26. Langford, V.S.; Dryahina, K.; Španěl, P. Robust automated SIFT-MS quantitation of volatile compounds in air using a multicomponent gas standard. J. Am. Soc. Mass Spectrom. 2023, 34, 2630–2645. [Google Scholar] [CrossRef] [PubMed]
  27. McEwan, M.J. Direct analysis mass spectrometry. In Ion Molecule Attachment Reactions: Mass Spectrometry; Fujii, T., Ed.; Springer: New York, NY, USA, 2015; pp. 263–317. [Google Scholar]
  28. United States Pharmacopeia. Residual Solvents <467>; United States Pharmacopeia: Rockville, MD, USA, 2007. [Google Scholar]
  29. Parr, M.K.; Joseph, J.F. NDMA impurity in valsartan and other pharmaceutical products: Analytical methods for the determination of N-nitrosamines. J. Pharm. Biomed. Anal. 2019, 164, 536–549. [Google Scholar] [CrossRef] [PubMed]
  30. Perkins, M.J.; Langford, V.S. Standard validation protocol for selected ion flow tube mass spectrometry methods applied to direct headspace analysis of aqueous volatile organic compounds. Anal. Chem. 2021, 93, 8386–8392. [Google Scholar] [CrossRef] [PubMed]
  31. Liscio, C. Full Method Validation of an Automated Solution for Nitrosamines in Irbesartan and Metformin by LC-MS-MS Analysis. Anatune Limited Application Note. 2020. Available online: https://bit.ly/3Sut1Ee (accessed on 5 February 2024).
  32. Španěl, P.; Smith, D. SIFT studies of the reactions of H3O+, NO+, and O2+• with a series of alcohols. Int. J. Mass Spectrom. Ion Proc. 1997, 167/168, 375–388. [Google Scholar] [CrossRef]
  33. Španěl, P.; Ji, Y.; Smith, D. SIFT studies of the reactions of H3O+, NO+, and O2+• with a series of aldehydes and ketones. Int. J. Mass Spectrom. Ion Proc. 1997, 165/166, 25–37. [Google Scholar] [CrossRef]
  34. United States Food and Drug Administration (US FDA). Laboratory Tests|Ranitidine. 2019. Available online: https://www.fda.gov/drugs/drug-safety-and-availability/laboratory-tests-ranitidine (accessed on 1 February 2024).
  35. Perkins, M.J.; Langford, V.S. Application of routine analysis procedures to a direct mass spectrometry technique: Selected ion flow tube mass spectrometry (SIFT-MS). Rev. Sep. Sci. 2021, 3, e21003. [Google Scholar] [CrossRef]
  36. United States Food and Drug Administration (US FDA). Prinston Pharmaceutical Inc Issues Voluntary Nationwide Recall of Valsartan and Valsartan HCTZ Tablets Due to Detection of a Trace Amount of Unexpected Impurity, N-nitrosodimethylamine (NDMA) in the Products. 2018. Available online: https://www.fda.gov/safety/recalls-market-withdrawals-safety-alerts/prinston-pharmaceutical-inc-issues-voluntary-nationwide-recall-valsartan-and-valsartan-hctz-tablets (accessed on 1 February 2024).
  37. United States Food and Drug Administration (US FDA). Laboratory Tests|Metformin. 2020. Available online: https://www.fda.gov/drugs/drug-safety-and-availability/laboratory-tests-metformin (accessed on 5 February 2024).
Figure 1. Example headspace injection with synchronous SIFT-MS analysis of NDMA at a 2.6 ng spike level in a 10 mL sample vial. The blue shading indicates approximately the region from which the NDMA response is calculated.
Appliedchem 04 00008 g001
Figure 2. Extracted-ion LC-MS/MS chromatogram (using the MRM transition of m/z 75.1 to 58.2) for a standard containing 5 ng mL−1 of NDMA.
Appliedchem 04 00008 g002
Figure 3. Example of linearity of NDMA detection across the full range for the quantitation ion (NO+ at m/z 74). The blue triangles represent measured data.
Appliedchem 04 00008 g003
Figure 4. Measured NDMA headspace response using SIFT-MS as a function of sample mass for the ranitidine drug products (a) R1 and (b) R2.
Appliedchem 04 00008 g004
Figure 5. MHE-SIFT-MS results (natural logarithm of headspace concentration as a function of injection number) for NDMA in 500 mg samples of the ranitidine drug products (a) R1 and (b) R2.
Appliedchem 04 00008 g005
Figure 6. Correlation of results obtained for four metformin samples (M1–M4; Table 1) obtained using the MHE-SIFT-MS and dissolution-LC-MS/MS procedures. The blue triangles represent measured data.
Appliedchem 04 00008 g006
Figure 7. Sequence schedules for efficient NDMA analysis using (a) LC-MS/MS and (b,c) MHE-SIFT-MS over a 24 h period. The MHE-SIFT-MS sequences assume six parallel MHE calibration samples (accommodated within the 30 min incubation) either (b) at the start of the run or (c) offline (i.e., pre-sequence). See the text for more details.
Appliedchem 04 00008 g007
Table 1. Summary of drug products used for method development and testing (ranitidine and valsartan) and comparative analysis with LC (metformin).
Active Pharmaceutical Ingredient (API)ManufacturerUS National Drug Code (NDC)Lot NumberExpiration Date 1Measured Date 1,2Sample Code
NameQuantity (mg)
Ranitidine150Medreich 3Unknown97004301/20229/2022R1
150Sanofi 4Unknown19A430U01/20219/2022R2
Valsartan160Prinston Pharm./Solco Healthcare 543547-369-09342B1702210/201910/2022V1
Metformin 6500Amneal 753746-178-01HM02918A01/202111/2023M1
500Amneal 753746-178-90HD03319A04/202111/2023M2
500Apotex 860505-0260-1NE580104/202111/2023M3
500Amneal 765162-178-10AM190107AA12/202011/2023M4
750Amneal 765162-179-10AM180770A05/202011/2023M5
500Lupin 968180-336-07G90120312/202011/2023M6
1 Month/year format. 2 Data of measurements reported here. 3 Feltham, UK. 4 Reading, UK. 5 Somerset, NJ, USA. 6 As hydrochloride (extended-release tablets). 7 Piscataway, NJ, USA. 8 Weston, FL, USA. 9 Baltimore, MD, USA.
Table 2. Signal-to-noise (S/N), limit of detection (LOD), and limit of quantitation (LOQ) for gas-phase SIFT-MS analysis of NDMA in a 2.5 mL aliquot injected at 100 μL s−1 (data in Figure 1).
NDMA Reagent Ion—Product Ion PairSignal-to-Noise Ratio (S/N)Theoretical LOD Based on 3:1 S/N (ng)Theoretical LOQ Based on 10:1 S/N (ng)
H3O+ 7523.80.331.1
NO+ 7415.30.511.7
O2+• 745.91.34.4
Table 3. Reported concentrations of NDMA in the metformin products (M1–M6; Table 1) for the MHE-SIFT-MS and dissolution-LC-MS/MS procedures.
Metformin SampleNDMA Concentration (ng g−1)
SIFT-MSLC-MS/MS
M1268219
M2241267
M378.257
M4156142
M5131*
M655.1*
* The matrix of these samples caused ion suppression. It was outside the scope of this study to develop and validate a method specifically for these matrices.
Table 4. MHE-SIFT-MS parameters (ratio of first injection to full procedure and slope of linear fit) for the analysis of NDMA in the metformin products (M1–M6; Table 1).
Metformin Sample and Statistical ParametersRatio of First MHE Injection to Full MHE *Slope of Linear Fit to Six MHE Injections
M10.1232−0.2276
M20.1245−0.2301
M30.0924−0.1630
M40.1281−0.2365
M50.1119−0.2030
M60.1070−0.1894
Mean0.1145−0.2083
Standard Dev.0.01350.0286
RSD (%)11.8%13.7%
* For the metformin samples, the “full MHE” corresponds to a calculation using the area under the curve, not a sum of data points (c.f., the ranitidine products).
Disclaimer/Publisher’s Note: The statements, opinions and data contained in all publications are solely those of the individual author(s) and contributor(s) and not of MDPI and/or the editor(s). MDPI and/or the editor(s) disclaim responsibility for any injury to people or property resulting from any ideas, methods, instructions or products referred to in the content.

