Article

Application of a Universal Calibration Method for True Molar Mass Determination of Fluoro-Derivatized Technical Lignins by Size-Exclusion Chromatography

by
Esakkiammal Sudha Esakkimuthu
*,†,
Nathalie Marlin
,
Marie-Christine Brochier-Salon
and
Gérard Mortha
*
Institute of Engineering, Université Grenoble Alpes, LGP2, Grenoble INP, CNRS, F-38000 Grenoble, France
*
Authors to whom correspondence should be addressed.
Present address: Renewable Materials Composites Group, InnoRenew CoE, Livade 6, 6310 Izola, Slovenia.
AppliedChem 2022, 2(1), 30-47; https://doi.org/10.3390/appliedchem2010002
Submission received: 23 December 2021 / Revised: 24 February 2022 / Accepted: 28 February 2022 / Published: 3 March 2022
(This article belongs to the Special Issue Feature Papers in AppliedChem)

Abstract

:
The determination of the true molar mass distribution (MMD) of lignin is highly important to understand the physicochemical characteristics for lignin-based value-added applications. It is imperative to develop a universal method to quantify accurate MMD of lignin using size exclusion chromatography (SEC), as the conventional method with polymer standards provides irregular MMD results. This work aims to evaluate the MMD of five lignin samples (Protobind 1000, Organosolv, Indulin, Pine Kraft and Eucalyptus Kraft) in THF. Different derivatization methods (acetylation, fluorobenzylation and fluorobenzoylation) were performed. FTIR and 19F NMR analyses were used to follow derivatization. The MMDs of derivatized and underivatized lignins were determined by the conventional method and compared with the universal calibration method developed using intrinsic viscosity. The 19F NMR spectra provided the information to quantify the degree of substitution of lignin hydroxyl groups, to calculate the true molar mass of the derivatives of lignin monomers. The obtained MMDs values for all the derivatized lignin by universal calibration were found to be three to five times higher than that of the conventional calibration. The polydispersity values obtained with the acetylation method were higher than the fluoro-derivatives. The results demonstrated that fluoro-derivatization is an appropriate method to apply to higher molar mass technical lignins and lacks solubility and aggregation issues.

1. Introduction

Lignin is the second most abundant biopolymer produced as a by-product during the wood pulping process and is mostly utilized to produce energy through burning [1,2]. Lignin is highly heterogeneous and made up of three randomly polymerized main constituents, p-hydroxy phenyl, guaiacyl and syringyl units [3]. The physicochemical properties and molecular weight distribution of lignin are highly dependent on the source of the wood species, pulping and isolation processes [4]. The structural and molecular weight information are key parameters to understand the reactivity and physiochemical properties of lignin to use it in a wide range of value-added applications such as carbon fibre-based composites, polymer synthesis and sustainable based chemicals [5,6,7]. The molar mass distribution (MMD) of lignin is determined by the well-known technique called size exclusion chromatography (SEC) using a mono-dispersed polystyrene standard as a conventional calibrant [6]. The obtained molar mass is rather inaccurate and deviates from the absolute molar mass of lignin because the cross-linked three-dimensional structural conformation of lignin greatly differs from that of the narrow polystyrene (PS) standards [8,9]. Another drawback of methods based only on elution time is the phenomenon of flow dispersion through columns, valves, and tubing that cause peak enlargement, which is known as band broadening [10,11,12]. Mathematical corrections are theoretically possible to account for this, with variable accuracy [13].
To minimize the conventional polystyrene calibration-based error, efforts have been made in the past by analysing synthetically made lignin models in combination with polystyrene [13]. The results have demonstrated that no significant improvement can be seen in the MMD, and it was concluded that in addition to the hydrodynamic volume of the polymer, the low solubility of the lignin in most organic chromatographic solvents is also an issue [14]. The solubility problem can be overcome through lignin hydroxyl group derivatization using acetylation, methylation, acetobromination and silylation reactions [13,15,16,17,18]. Although, the modification of lignin enhances the possibility of acquiring good solubility using solvents of different polarities [15,19], there remains a lack of method that is applicable to find the absolute molecular weight of lignin. In such instances, several authors have attempted to justify the true molar mass of lignin by developing a universal method that can be applied for calculating the MMD of any lignin of interest [20,21,22]. The “universal method” rather considers a variety of analytical techniques that can support the MMD calculation, which includes coupling of UV-visible spectrometer (UV-Vis), intrinsic viscometry, differential refractometer (DRI), light-scattering (LS) detector and associated with mass detectors, such as electrospray ionization mass spectrometry (ESI-MS) or matrix-assisted laser desorption/ionization mass spectrometry (MALDI-MS) techniques [13,23,24,25,26,27]. Furthermore, given that the multiple detectors have been used, the cheapest option to calculate the MMD is using one or combined detectors such as UV-Vis, RI or LS, rather than ESI-MS and MALDI-MS [28].
Plant source, isolation method, functionality, and molar mass distribution are determining factors for the solubility of lignin in chromatographic solvents. The selection of the solvents for SEC analysis is most important to find the true MMD of lignin, otherwise, technical lignin samples undergo polymer association due to lignin polar interactions, which significantly increases light-scattering and viscometric signals, leading to overestimation of the molar mass. Several solvents have been used to solubilize the lignin to calculate the MMD and the most common are DMSO, DMAc, DMF and THF. The study of the MMD of lignin in a nonpolar solvent like THF requires acetylation or silylation or methylation to enhance solubility and minimize the aggregation effect [29,30] in the SEC column.
Universal methods can be applied to find true the MMD of lignin with or without derivatization. The authors of [9] applied conventional and universal methods to calculate the MMD of lignosulfonates in sulphite liquor samples without derivatization using SEC, with eluent systems formed by DMSO/H2O/LiBr and DMAc/LiCl. The obtained MMD values from the conventional calibration method exhibited lower molar mass than the universal methods, and the error became larger for the higher molar mass of lignin.
Acetylation is the most widely used method for modification of lignin hydroxyl groups before SEC analysis and establishes a universal method for true MMD calculation. The studies described in references [28,29] proposed the use of UV-viscometry coupled detectors for the analysis of acetylated lignin samples by SEC, following the principle of “universal calibration” [31,32]. Although acetylation is a method of interest for lignin derivatization in recent decades, acetylated lignins dissolution time in a variety of solvents like DMAc and DMSO sometimes requires more than a couple of weeks, which significantly slows the quantification. Furthermore, acetylated lignin samples exhibited aggregation inside the SEC column with polar aprotic solvents which cannot be solved entirely even when different salts (LiBr and MgCl2) were added to the solvents [33]. On the other hand, some researchers (A. Potthast and co-workers) attempted to determine the MMD of lignin by direct and simple methods, such as ultra-performance liquid chromatography (UPLC) using 0.1 M NaCl, and by a coupling method, A4F-MALS (asymmetric flow field-flow fractionation coupled to multiangle laser light scattering detector) using DMSO/LiBr eluent for lignosulfonates [8,34].
In many studies, columns containing non-polar polystyrene gels, eluted with THF, have been used to calculate the more reliable MMDs for different varieties of lignins [35]. Despite the number of studies and techniques investigated until now, there is still a certain uncertainty about real lignin molar mass, and the choice of a determination method. This is illustrated by the recent work of Crestini’s group [13], who studied MMDs of different lignin derivatives (acetobromination, acetylation and benzoylation) by standard calibration with THF. The results showed that the columns setup and 2-detectors setup (PDA and RI), as well as the correction calculated from NMR, significantly enhanced the quality of the SEC results and the correction factor from NMR [36].
The present work focuses on the SEC analysis of five technical lignins (Protobind 1000 (PB), Organosolv (ORG), Indulin (IND), Softwood Kraft (KR) and Eucalyptus Kraft (EU-KR)), comparing different types of derivatizations (acetylation and fluoro-derivatization). The universal calibration method, using SEC and the coupling of DRI and viscometry detectors, is developed to calculate the MMD of the lignin samples, using THF as a chromatographic solvent. The obtained universal MMD is compared with conventional MMD that is calculated using different polymers as standards, such as polystyrene (PS), polymethyl methacrylate (PMMA), and cellulose acetate (CA).

2. Materials and Methods

2.1. Technical Lignins

Four industrial lignin samples and one laboratory-cooked lignin were used in this study: (i) Soda lignin from wheat straw (Protobind 1000) (PB) was purchased from Green Value Enterprises LLC, Frederick, MD, USA; (ii) Kraft lignin from pine (KR) was provided by the Centre Technique du Papier (CTP), Grenoble, France; (iii) Organosolv lignin (ORG) (namely BioLignin® CIMV process using formic acid/acetic acid/water at 185–210 °C) from wheat straw was purchased from CIMV Co., Labège, France; (iv) Kraft Indulin AT lignin (IND) was purchased from DKSH Ltd., Zurich, Switzerland [37]; and (v) Eucalyptus Kraft lignin (EU-KR) was prepared in the laboratory and the detailed procedure can be found in [38].

2.2. Derivatizations
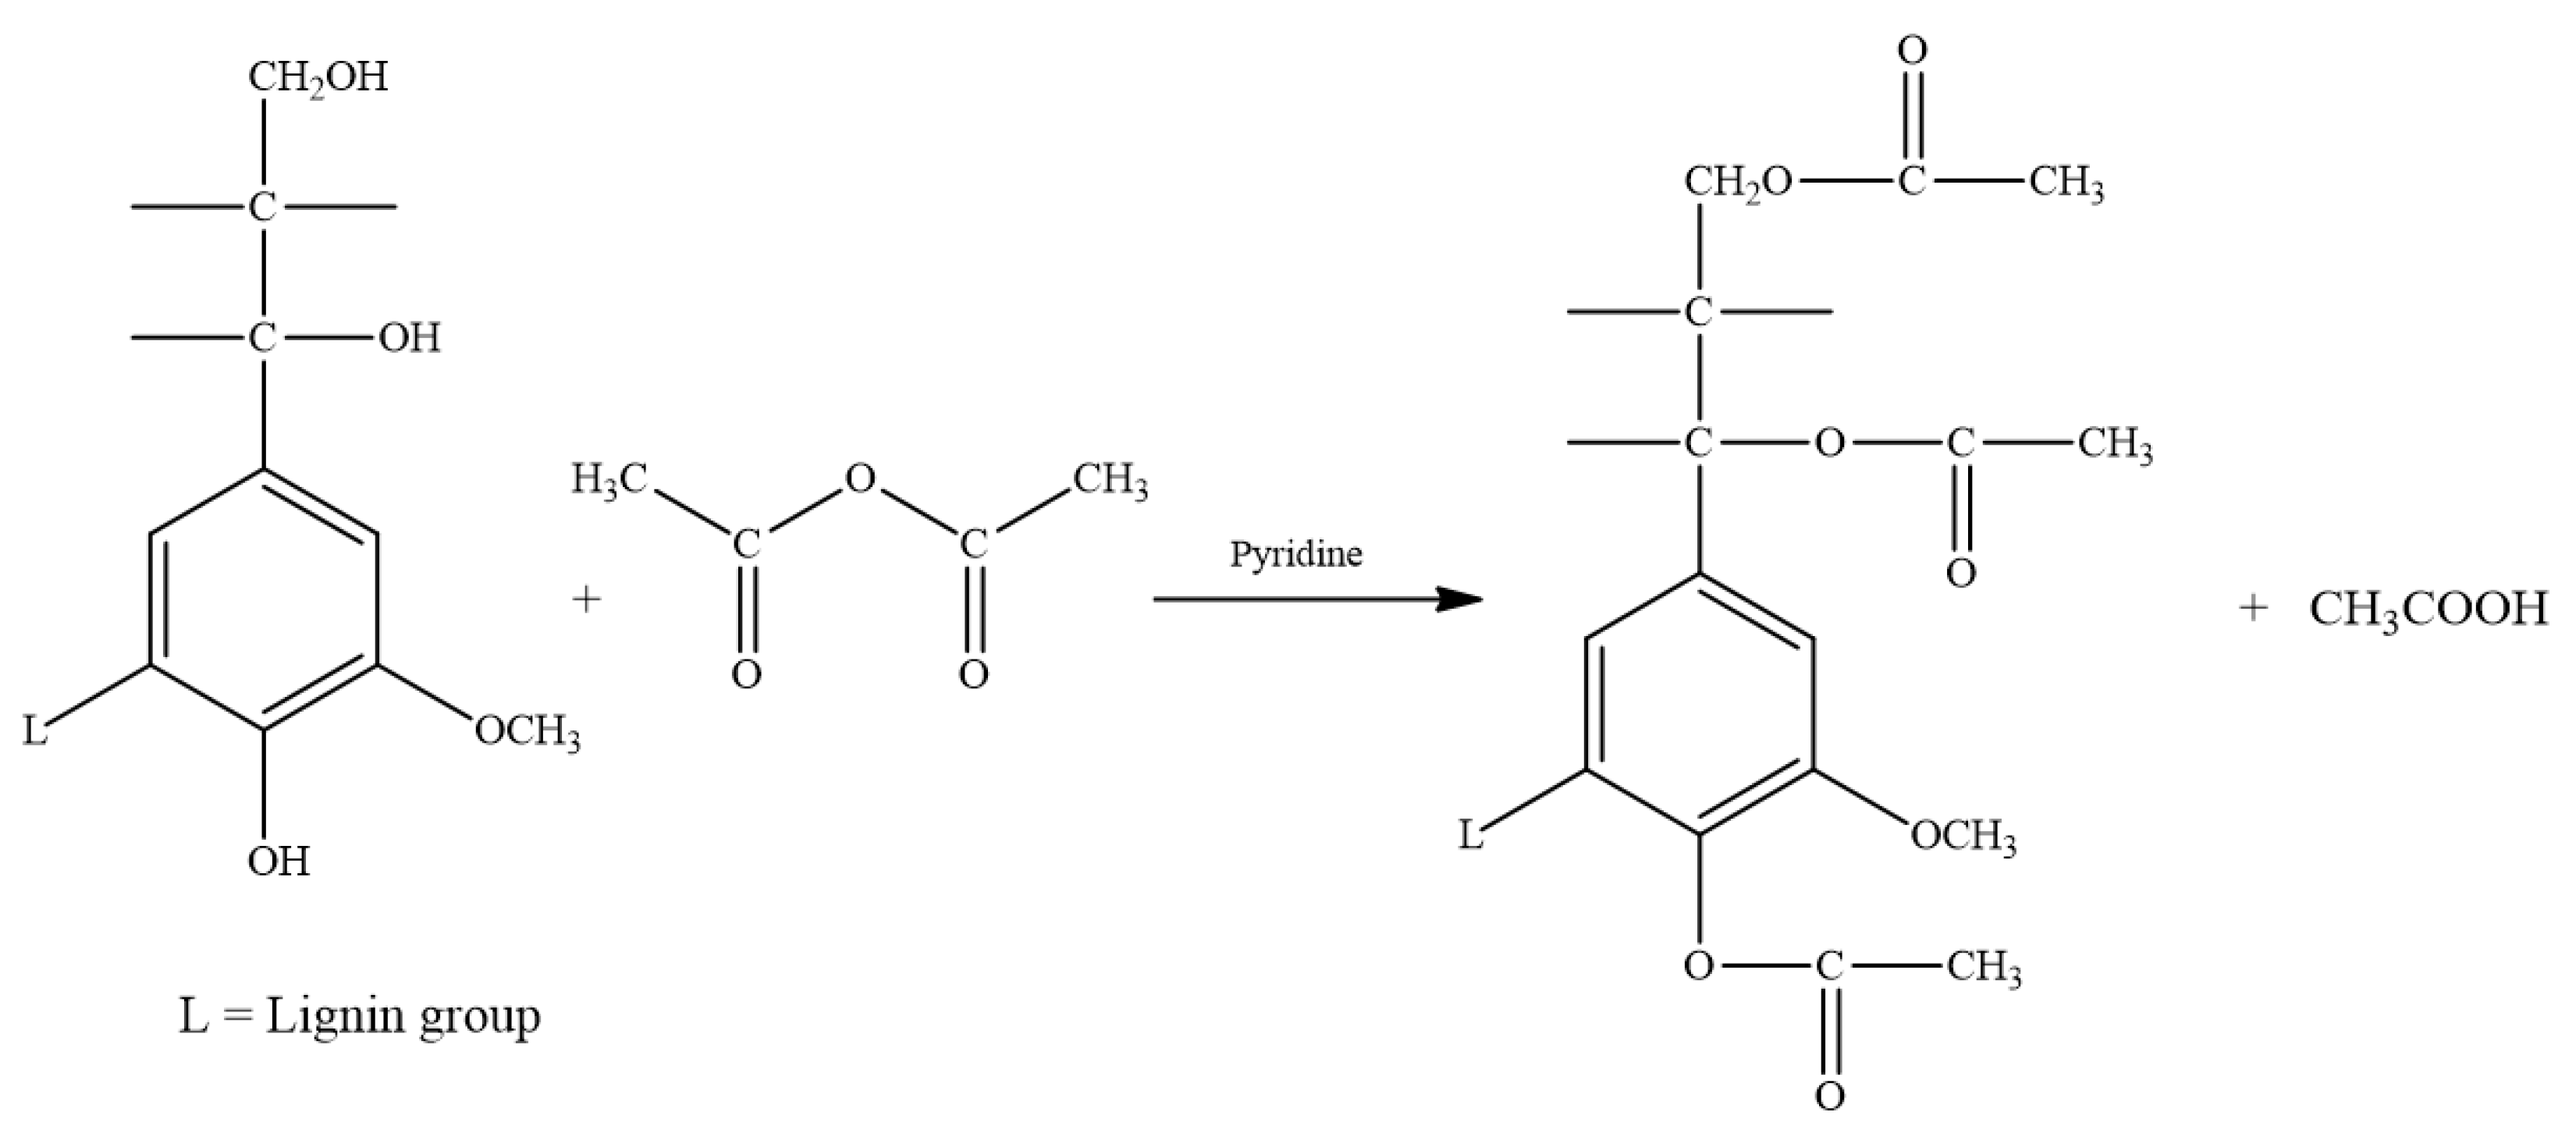
2.2.1. Acetylation

Prior to different derivatizations, all lignin samples were washed using ethyl acetate to remove the sugar and ash impurities. 100 mg of lignin samples (dry matter content basis) were acetylated with 5 mL of pyridine and acetic anhydride mixture (1/1: V/V) at room temperature for 15 h in a round bottom flask with continuous stirring (Figure 1) as described in the reference [37]. After the reaction time, the mixture was quenched with 40 mL of 50% aqueous methanol and dried under vacuum. After methanol evaporation, the product was washed with toluene three times (3 × 40 mL) to remove residual pyridine and once with 40 mL of 99.5% methanol. Finally, the sample was freeze-dried to ensure total solvent removal.

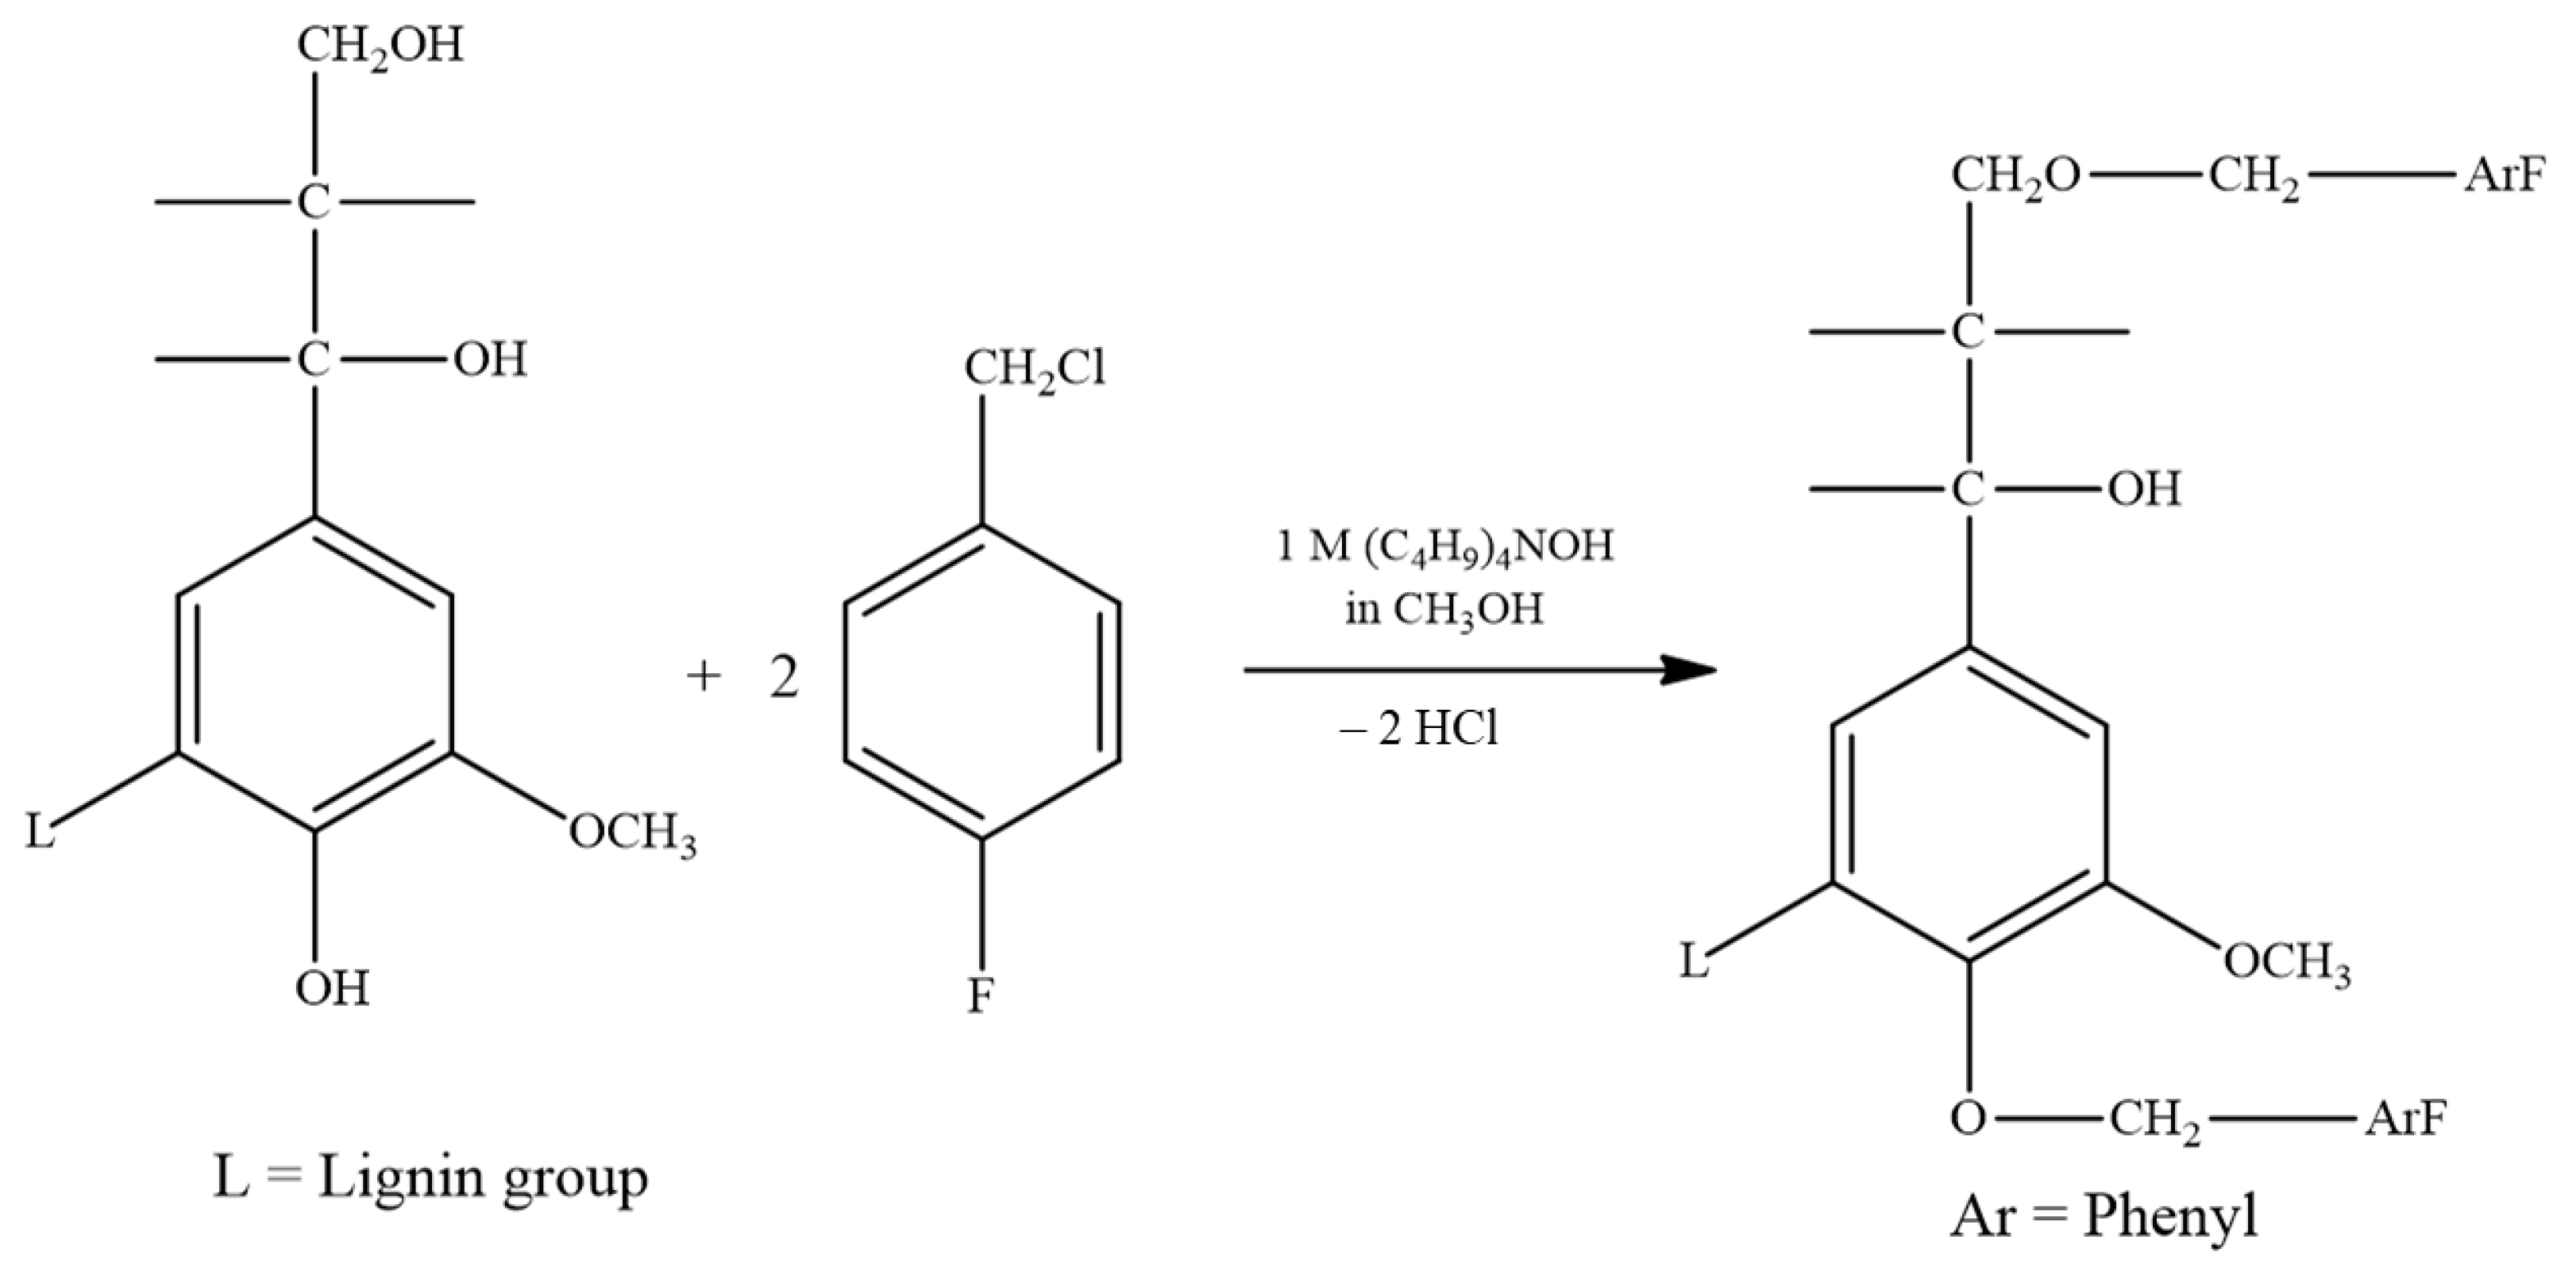
2.2.2. Fluorobenzylation

100 mg of lignin samples were dissolved in 10 mL of 0.1 N tetra N-butylammonium hydroxide (NBu) in methanol and stirred for 1 h at 50 °C. Then 10 mL of acetonitrile was added followed by 300 mg of 4-fluorobenzyl chloride (FBC), the derivatizing agent [39]. The reaction scheme is shown in Figure 2. The reaction mixture was stirred at 50 °C overnight. After the reaction time, the derivatized lignin recovery was performed by precipitation in diethyl ether. Lignin produced a viscous precipitate in diethyl ether, precipitated again in ice-cold distilled water. This precipitate was filtered through a 0.45 µm PTFE filter, washed with distilled water several times and oven-dried at 50 °C [40,41].

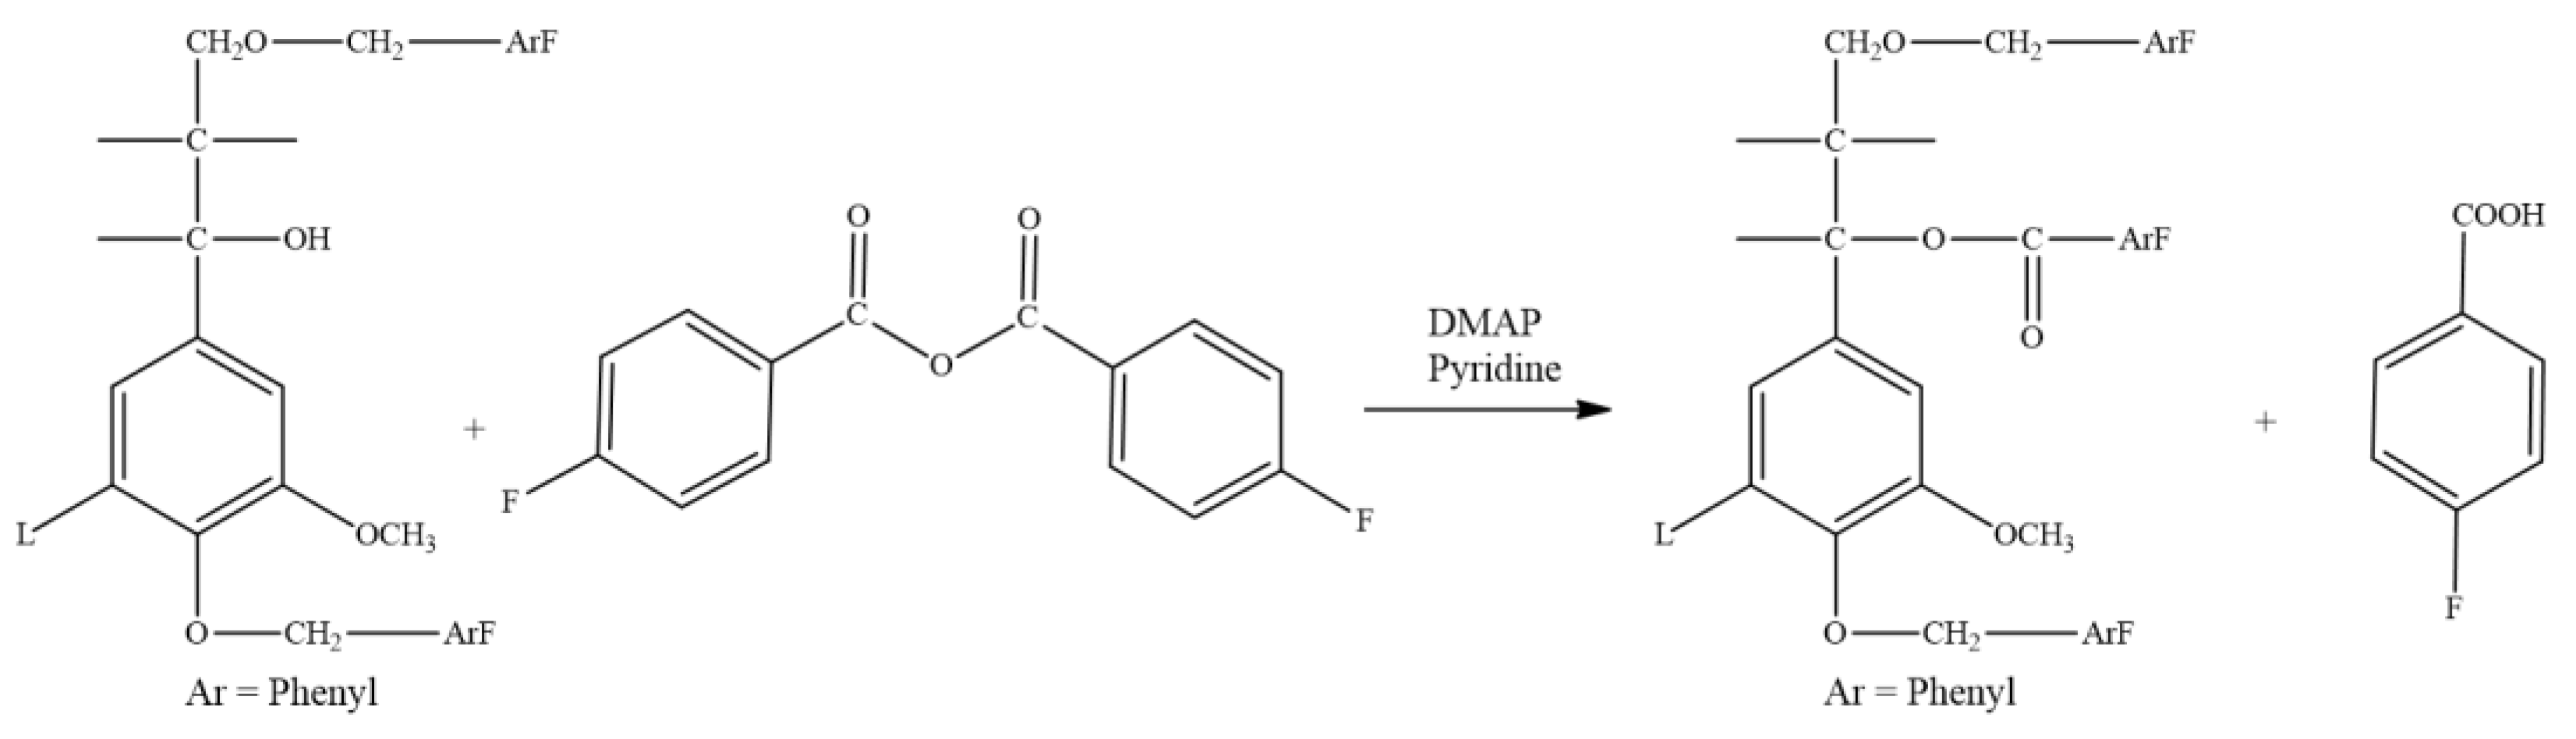
2.2.3. Fluorobenzoylation

Fluorobenzylated lignins obtained from the above procedure were dissolved in 2.5 mL of pyridine. Then, 4-dimethyl-aminopyridine (DMAP, 2.5 mg) and 4-fluorobenzoic acid anhydride (150 mg) were progressively added into the reaction medium [39]. The reaction scheme is presented in Figure 3. The mixture was stirred for 48 h at 60 °C. Then, the derivatized lignins were poured into ice-cold water. The obtained precipitate was washed with distilled water several times and filtered through 0.45µm PTFE filters and dried in the oven at 40 °C. The obtained product was followed by FT-IR, 19F NMR and SEC analyses.
Fourier Transform Infrared spectra (FT-IR) for underivatized and derivatized lignin samples were recorded with a Perkin Elmer spectrometer with the absorbance mode using KBr pellets. Spectra were recorded between 400 to 4000 cm−1 with 32 cumulative scans and 4 cm1 resolution. NMR spectroscopic measurements were conducted on a Bruker AVANCE 400 spectrometer equipped with a 5 mm BB/19F−1H/d Z-GRD probe for 19F operating at 100.612 MHz. Acquisition and data treatment were done using the LINUX TopSpin 3.2 software. The experiments were conducted with 1.25 s acquisition time, 8.76 s relaxation delay and a 30° pulse using a 65 ppm spectral width. 64,000 data points were used for data acquisition. Prior to Fourier transformation, zero-filling at 64 k was applied, followed by apodization with a 0.3 Hz exponential. Chemical shifts are given relative to CFCl3 (δ = 0 ppm). The positions of the peaks were referred for C6F6 as an internal reference at −164.90 ppm. Lignin derivatives were dissolved in DMSO-d6 (15–20 mg/0.7 mL) and quantification was done using 2-Fluoroacetophenone (3 mg) as an internal standard. The measurements were performed at 298 K. 3.75 g of Chromium acetylacetonate in 0.075 mL of DMSO was used as a relaxation agent.

2.3. MMD–SEC Conditions

SEC analysis of all examined samples was performed using Malvern TDA 302 with Omnisec 4.5 software and equipped with three detectors setup (differential refractive index (DRI), low- and right-angle light scattering (LALS and RALS) and in-line viscometer). Three SEC columns were connected in series such as 300 cm × 7.5 mm, PLGel mixed B (10 µm mixed B LS) and a pre-column (Agilent Co., Santa Clara, CA, USA), and pure THF (HPLC grade) was used as eluent. The temperature of the column was maintained at 35 °C. The samples were injected at a concentration of 10 mg/mL with an eluent flow rate of 1 mL/min and the sample injection volume was 100 µL. All lignin samples were derivatized prior to the analysis using the derivatization methods described above. The present work focused on two different methods, i.e., a standard and the universal calibration for MMD calculations using different standards: polystyrene (PS): 1670; 4970; 10,030; 28,400; 64,200; poly(methyl methacrylate) (PMMA): 1520; 6840; 13,200; 31,380; 73,850; 135,300; 342,700; 525,000; 1,026,000 and 2,095,000, and cellulose acetate (CA).

3. Results and Discussion

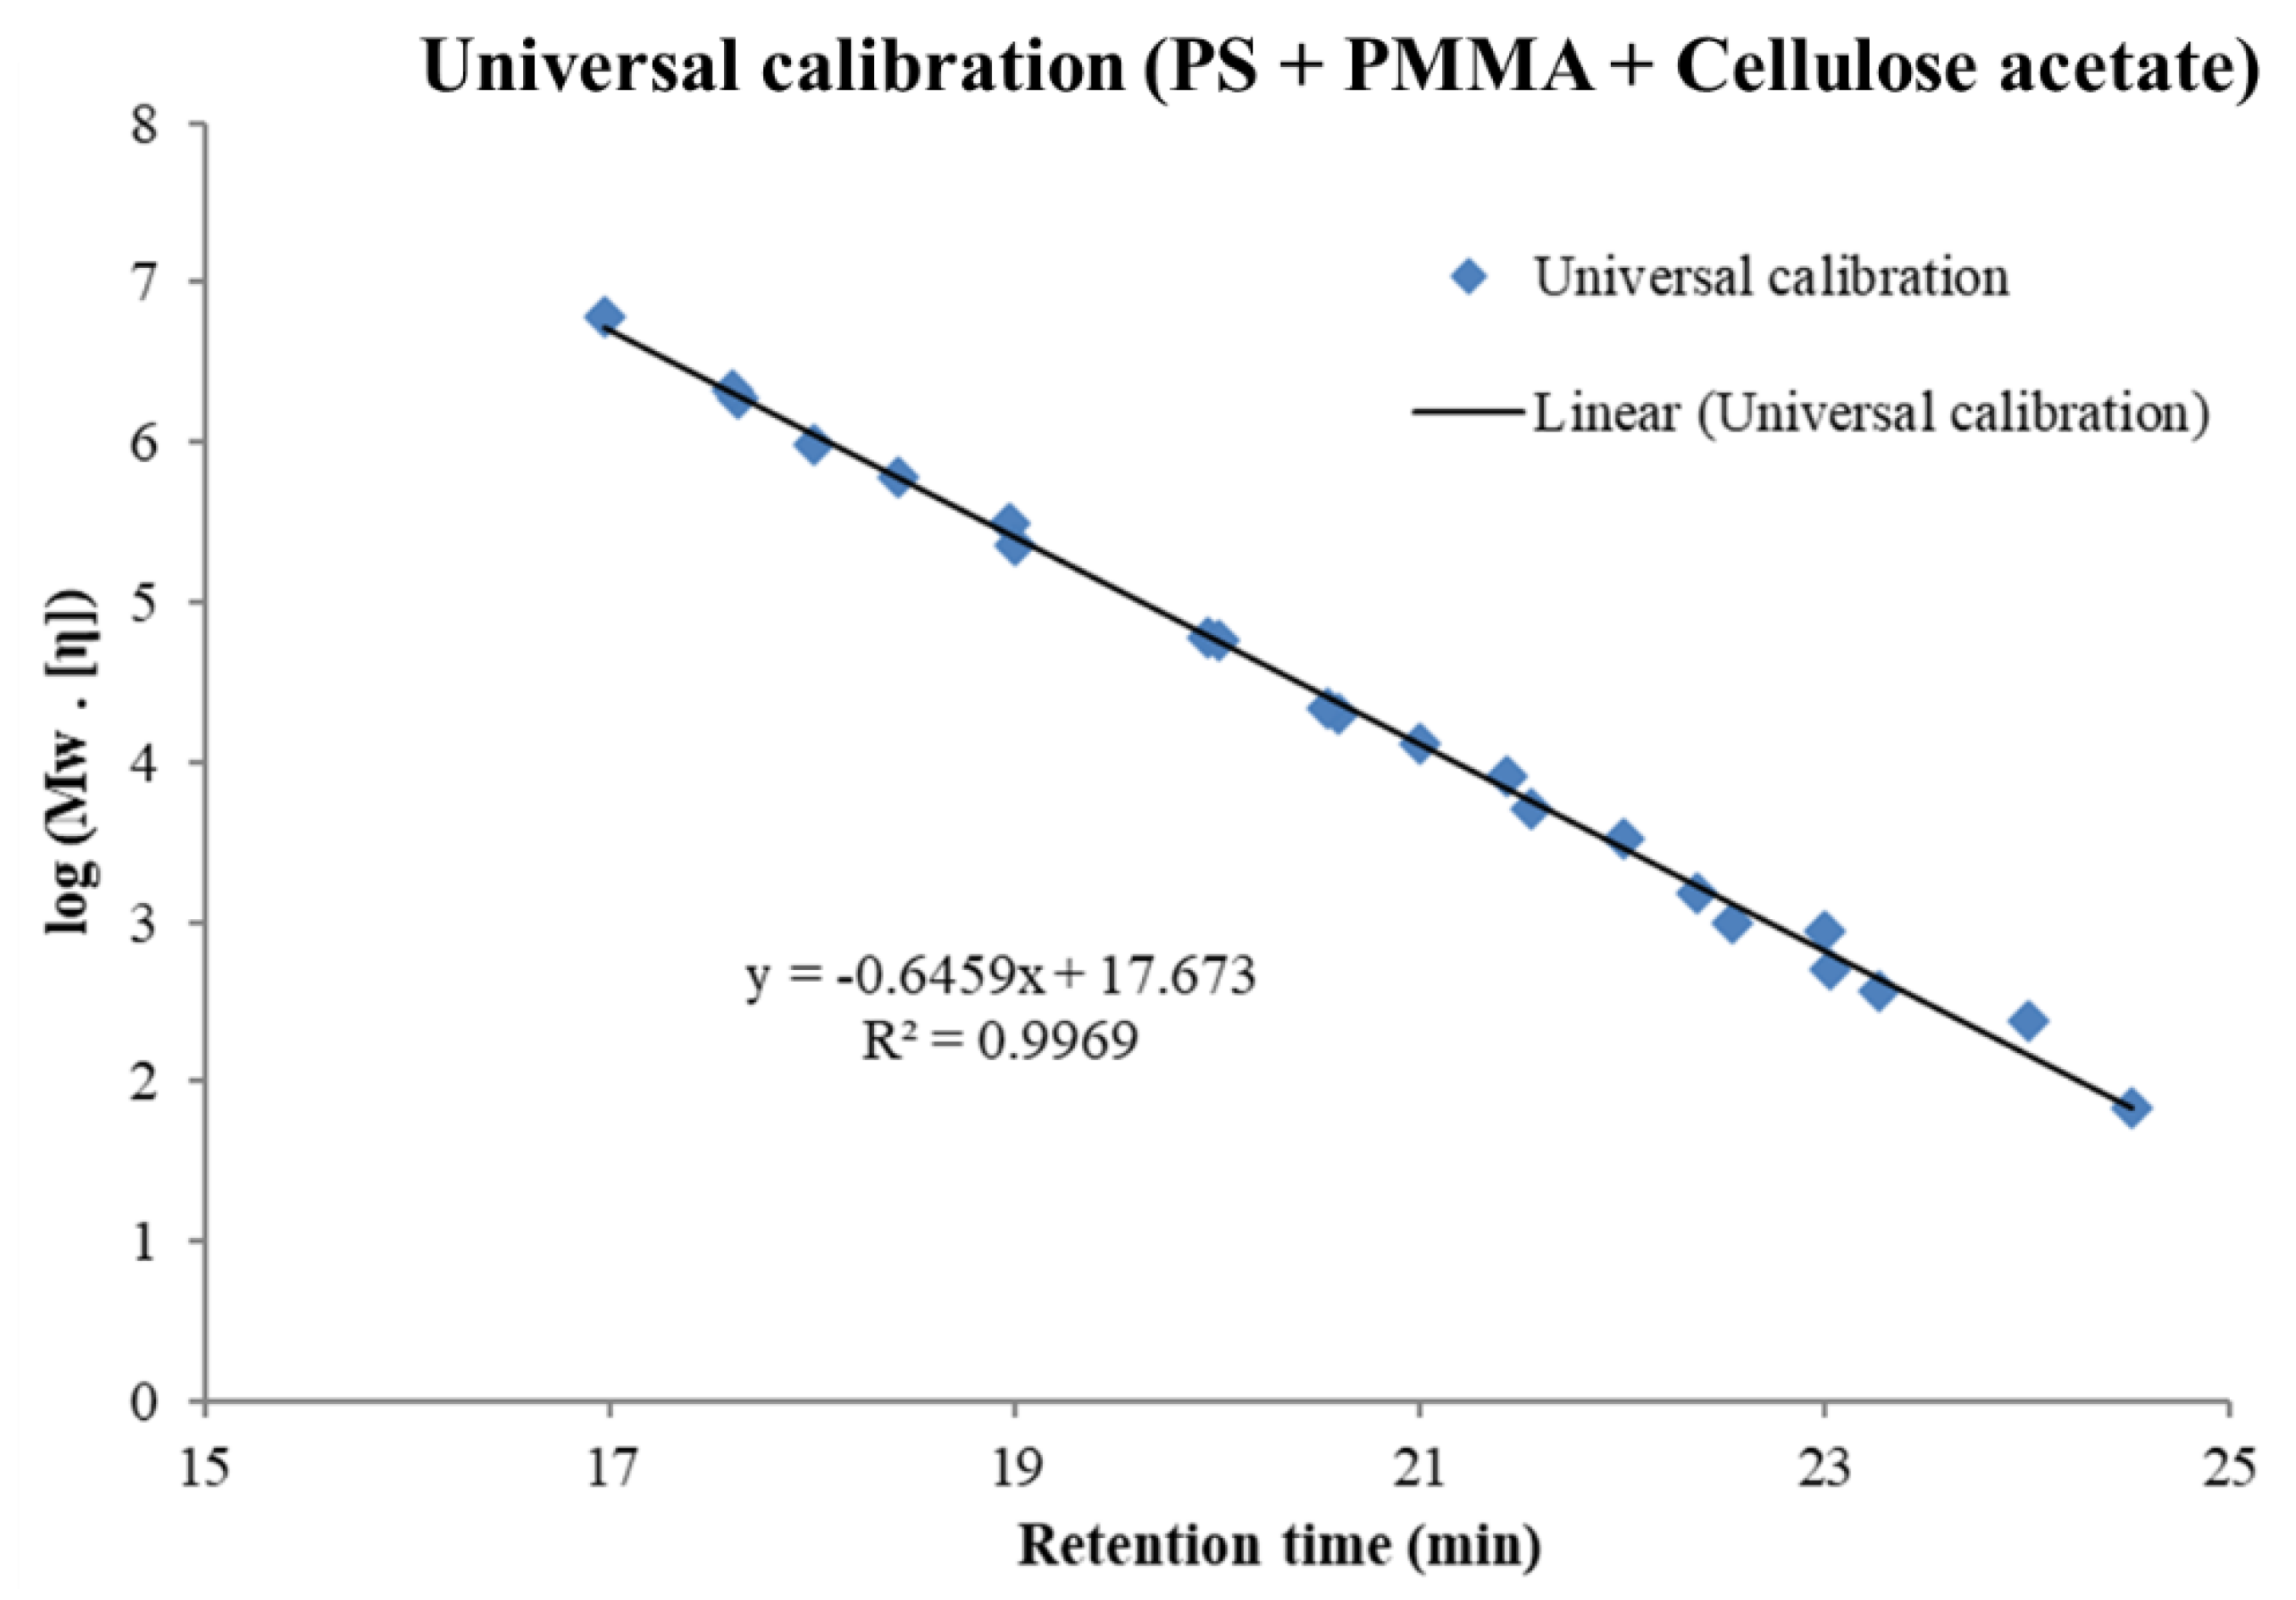
3.1. Molar Mass Determination Using the Universal Calibration

The universal calibration concept relies on the Mark–Houwink–Sakurada (MHS) relationship and was first evidenced by H. Benoit using polystyrene [42]. The author stated that chromatographic separation in SEC columns is based on the molar hydrodynamic volume of the polymer pellet rather than on its molar mass, which is the principle of universal calibration in SEC. Based on the obtained hydrodynamic volume, the elution volume or retention volume (Vr) can be determined.
The MHS relationship is expressed as:
  [ η ] = K M a
where [η] is the intrinsic viscosity of the polymer, expressed in dL g−1 or in mL g−1, K′ and a are Mark–Houwink constants, depending on the polymer-solvent system; M is the viscosity-average molar mass of the polymer in g mol−1, assumed to be equal to M, the molar mass of the polymer for a mono-disperse sample. According to polymer theory, the product ([η].M) is proportional to the hydrodynamic volume for a well-solvated polymer in a given solvent, the plot of log ([η].M) vs. Vr should be unique if the universal calibration concept applies correctly.
The present study used narrowly distributed standards, with known M and [η], to calibrate the SEC columns setup in THF solvent. The universal calibration curve was constructed using in-line SEC-viscometry detector. Monodispersed (PS, PMMA) and polydispersed (CA) polymer standards have been used. In the case of CA, eight sample values of M and [η] were used to build the universal calibration curve.
The curve of log (M.[η]) vs. retention time is presented in Figure 4. It is shown that all samples align on a single linear curve. Himmel et al., [32] stated that according to the MHS relationship, “a” values of linear and flexible polymers were limited between 0.50 to 0.80. Indeed, we found for the three investigated polymers “a” values in this range (for PS, between 0.5 to 0.8; for PMMA, between 0.6 to 0.8; for cellulose acetate, 0.815).
By universal calibration, the molar mass of an unknown polymer sample is calculated based on the measurement of the intrinsic viscosity, and the column retention volume, from which the product ([η].M) is read on the universal calibration curve. Knowing the independently ([η].M) and [η] leads to the calculation of M.
Using the known standard polymer data, two types of universal calibration curve were constructed: one type gathering all data points of the three polymer standards in a single linear regression, so-called “global curve fit”; and another type using the data of every single polymer, leading to three “individual curve fit”. Results of all the corresponding individual polymer calibration curves were compared in Figure S1. Both types of calibration curves (global curve and individual curves) appear very linear (with R2 very close to 1), but nevertheless, it can be noticed that each individual slope varies in a range of about ±5%, which may have rather significant consequence on the calculation of M.

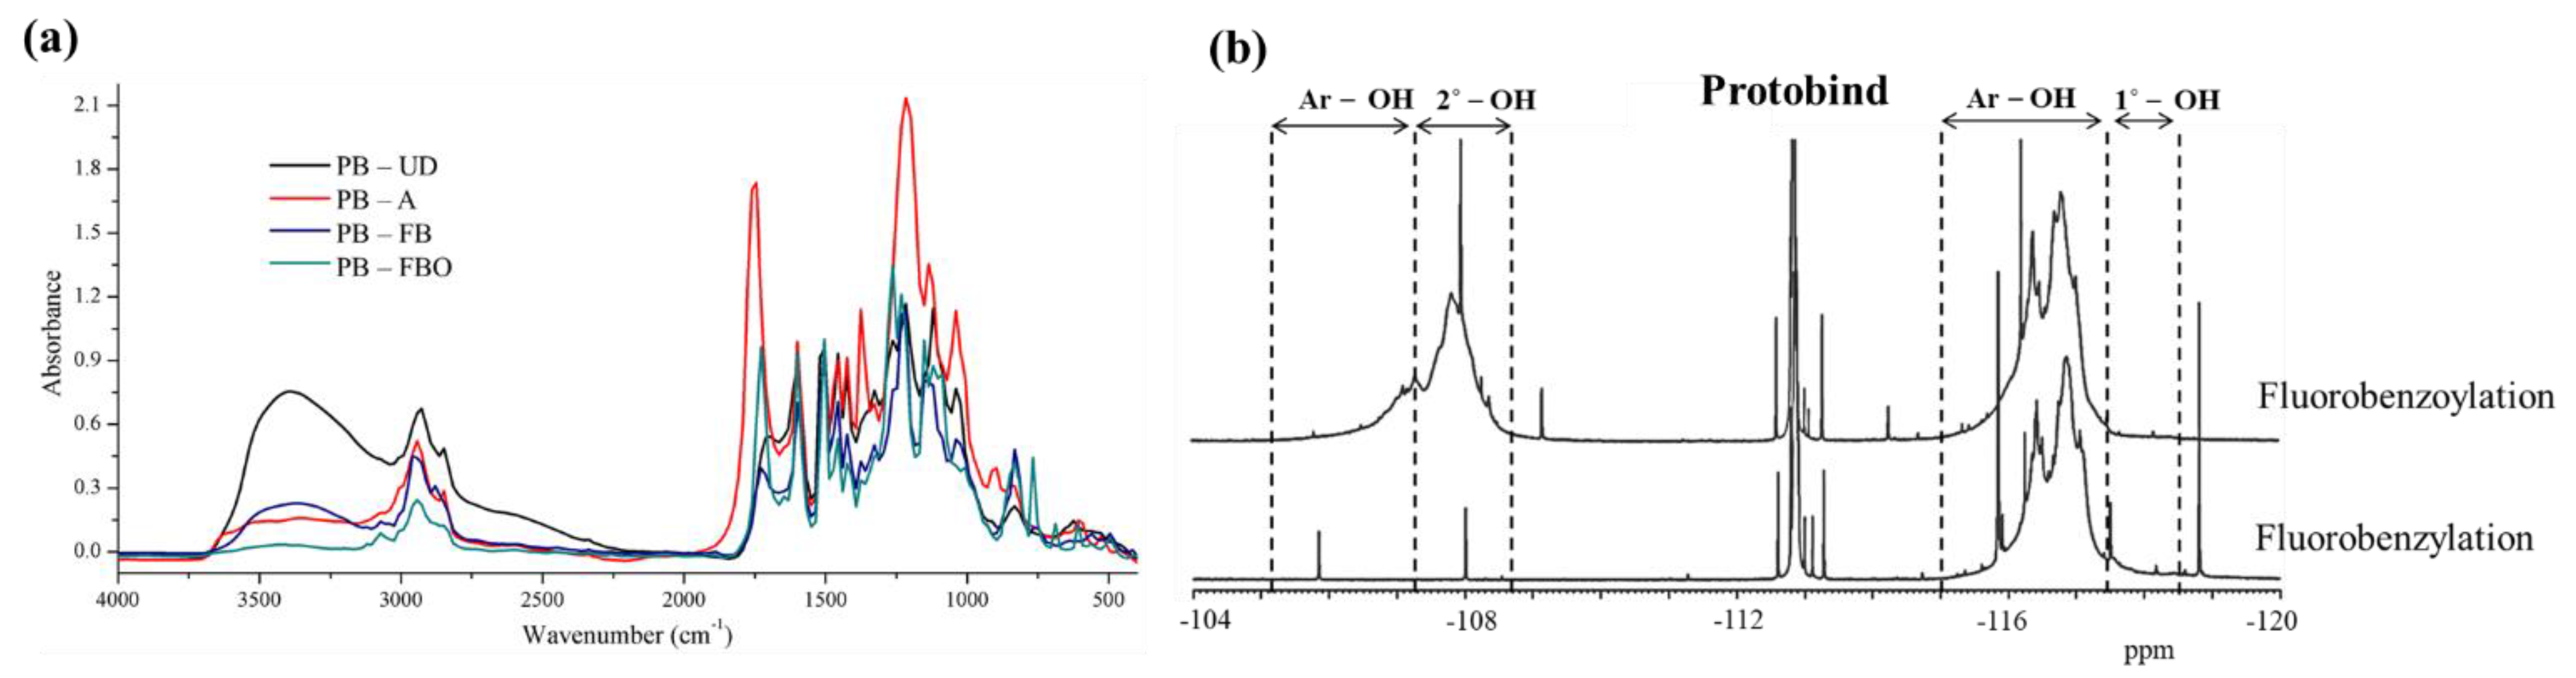
3.2. FTIR and 19F NMR Spectra of Different Lignin and Its Derivatives

The lignin samples (PB, ORG, IND, KR, and EU-KR) were subjected to different chemical derivatizations such as acetylation, fluorobenzylation and fluorobenzoylation. FT-IR analysis was performed for underivatized and derivatized (acetylated, fluorobenzylated and fluorobenzoylated) lignins and spectra are illustrated in Figure 5a and Figure S2. Two main frequencies were considered to understand the derivatization of lignin, such as –OH and –CH frequencies. The obtained results revealed that –OH stretching frequency intensity (range of 3600–3100 cm1) was noticeably decreased after derivatization [37]. Comparing different derivatizations, fluorobenzylated lignin –OH groups intensity was slightly higher than in acetylated lignins, due to the fact of the selectivity of fluorobenzylation towards phenolic and primary –OH groups, without many changes on the secondary –OH groups. The frequency range, 3000–2800 cm−1 is attributed to the formation of new –CH, –CH2 and –CH3 groups and the corresponding IR intensity increased compared to underivatized lignin. On the other hand, the frequency, 1750–1720 cm−1 is assigned to non-conjugated C=O of ester, ketones, aldehydes and acids. In the case of acetylated lignin, the increased band intensity in the frequency region 1900–1700 cm−1 illustrates the large extent of esterification. For fluorobenzoylation, the formation of new ester groups increases the band intensity in this region. 1700–1550 cm−1 is classified for conjugated C=O and C=C stretching and the region of 1180–1080 cm−1 refers to new ether bond formation. Therefore, FTIR analysis revealed that all investigated lignin samples were derivatized.
Fluoro-derivatized lignin samples were analysed by 19F NMR to determine the extent of hydroxyl groups derivatization, based on the fluoro-derivatization work described in the references [38,39] and spectra were depicted in Figure 5b and Figure S3. In the case of fluorobenzylation spectra, the broad spectral region ranges from −115 to −117.48 ppm corresponding to phenolic hydroxyl groups. The primary aliphatic hydroxyl groups signals are assigned from −117.48 to −118.5 ppm. For fluorobenzoylated samples, the right side broad spectral region belongs to fluorobenzylated lignin, and the left side to fluorobenzoylated lignin. In fluorobenzoylation region, phenolic hydroxyl groups were assigned from −104.6 to −107.24 ppm and secondary hydroxyl groups from −107.24 to −108.64 ppm [43].
The number of phenolic and aliphatic hydroxyl groups was proportional to the area of the peak and quantified based on the internal standard. The area of the internal standard (2-fluoroacetophenone) was fixed as 1 for calculation. This method provides the information about the number of total hydroxyl groups per gram of derivatized lignin (mmol g−1), which can be expressed as:
n O H = A L × m I S   × 1000 / ( m L F × 138.14 )   in   mmol / g   derivatized   lignin
where, nOH = mmol/g derivatized lignin, AL = Area of lignin signal, mIS = mass of internal standard (g), MIS = molar mass of internal standard (138.14 g mol−1), mLF = sample mass of derivatized lignin (g); Internal standard IS = 2-fluoroacetophenone.
The number of phenolic and primary hydroxyl groups were calculated in different lignin samples from fluorobenzylation and reported in Table 1. From Table 1, IND lignin shows the highest amount of phenolic hydroxyl group than other lignin samples. Among the investigated lignin samples, the annual plant-based lignin samples such as PB and ORG lignins exhibit a lower number of hydroxyl groups, and the latter ORG lignin contains the lowest amount of hydroxyl groups.
The main focus was to calculate the monomer molar mass of fluorobenzylated lignin samples. Before calculation, the number of moles of lignin derivative was derived from the 19F NMR fluorobenzylation spectra in which the areas of aromatic and aliphatic hydroxyl groups were taken into account. Several parameters were considered, and the detailed explanation of the calculation for the total OH groups (in mol/mol aromatic unit) and monomer molar mass can be found in the supporting information (Equation (S1) and Table S1). From the calculation, the obtained molar mass of fluorobenzylated lignin monomer is presented in Table 2. The highest molar masses were found for the Kraft lignin samples, such as IND, KR and EU-KR, followed by PB and ORG lignin for fluorobenzylation.
A similar procedure as for fluorobenzylation was adopted for calculating the mol/mol of aromatic and aliphatic units in the lignin samples, followed by the calculation of monomer mass of fluorobenzoylated lignins using the Equation (S3) (mol/mol calculation is reported in Table S2). The final monomer molar mass of fluorobenzoylated lignin samples is also given in Table 2. The following trend was obtained for fluorobenzoylated monomers: IND > KR > PB > EU-KR > ORG. It is pointed out that the average molar mass of the lignin monomer was considered to be 200 g/mol for the underivatized lignin and 240 g/mol for the acetylated lignin.
Values for the total number of hydroxyl groups in all lignin samples, including total phenolic and aliphatic hydroxyls, based on the calculations from the fluorobenzoylated samples, are reported in Table S3.
Comparing two wheat straw lignins (PB and ORG), a higher hydroxyl group was obtained for PB lignin than the ORG lignin. Considering various Kraft process lignins, IND lignin showed the highest total hydroxyl content, followed by the KR lignin and the least quantity was found for the EU-KR lignin. For instance, IND had 3.418 mmol g−1 and KR contained 3.145 mmol g−1 of total hydroxyl groups, of which 2.331 and 2.277 mmol g−1 corresponded to phenolic hydroxyl for IND and KR, 1.087 and 0.868 mmol g−1 aliphatic hydroxyl groups for IND and KR, respectively. In our previous work [37], we had employed several analytical methods, i.e., aminolysis combined with gas chromatography (GC), NMR spectroscopy (1H, 13C and 31P) and a fast wet chemistry method for the quantification of phenolic hydroxyl groups in the same lignin samples. Comparing all investigated methods, the total phenolic hydroxyl contents after fluorobenzoylation using 19F NMR results were consistent with the results obtained by other methods and the detailed information can be found in the Reference.

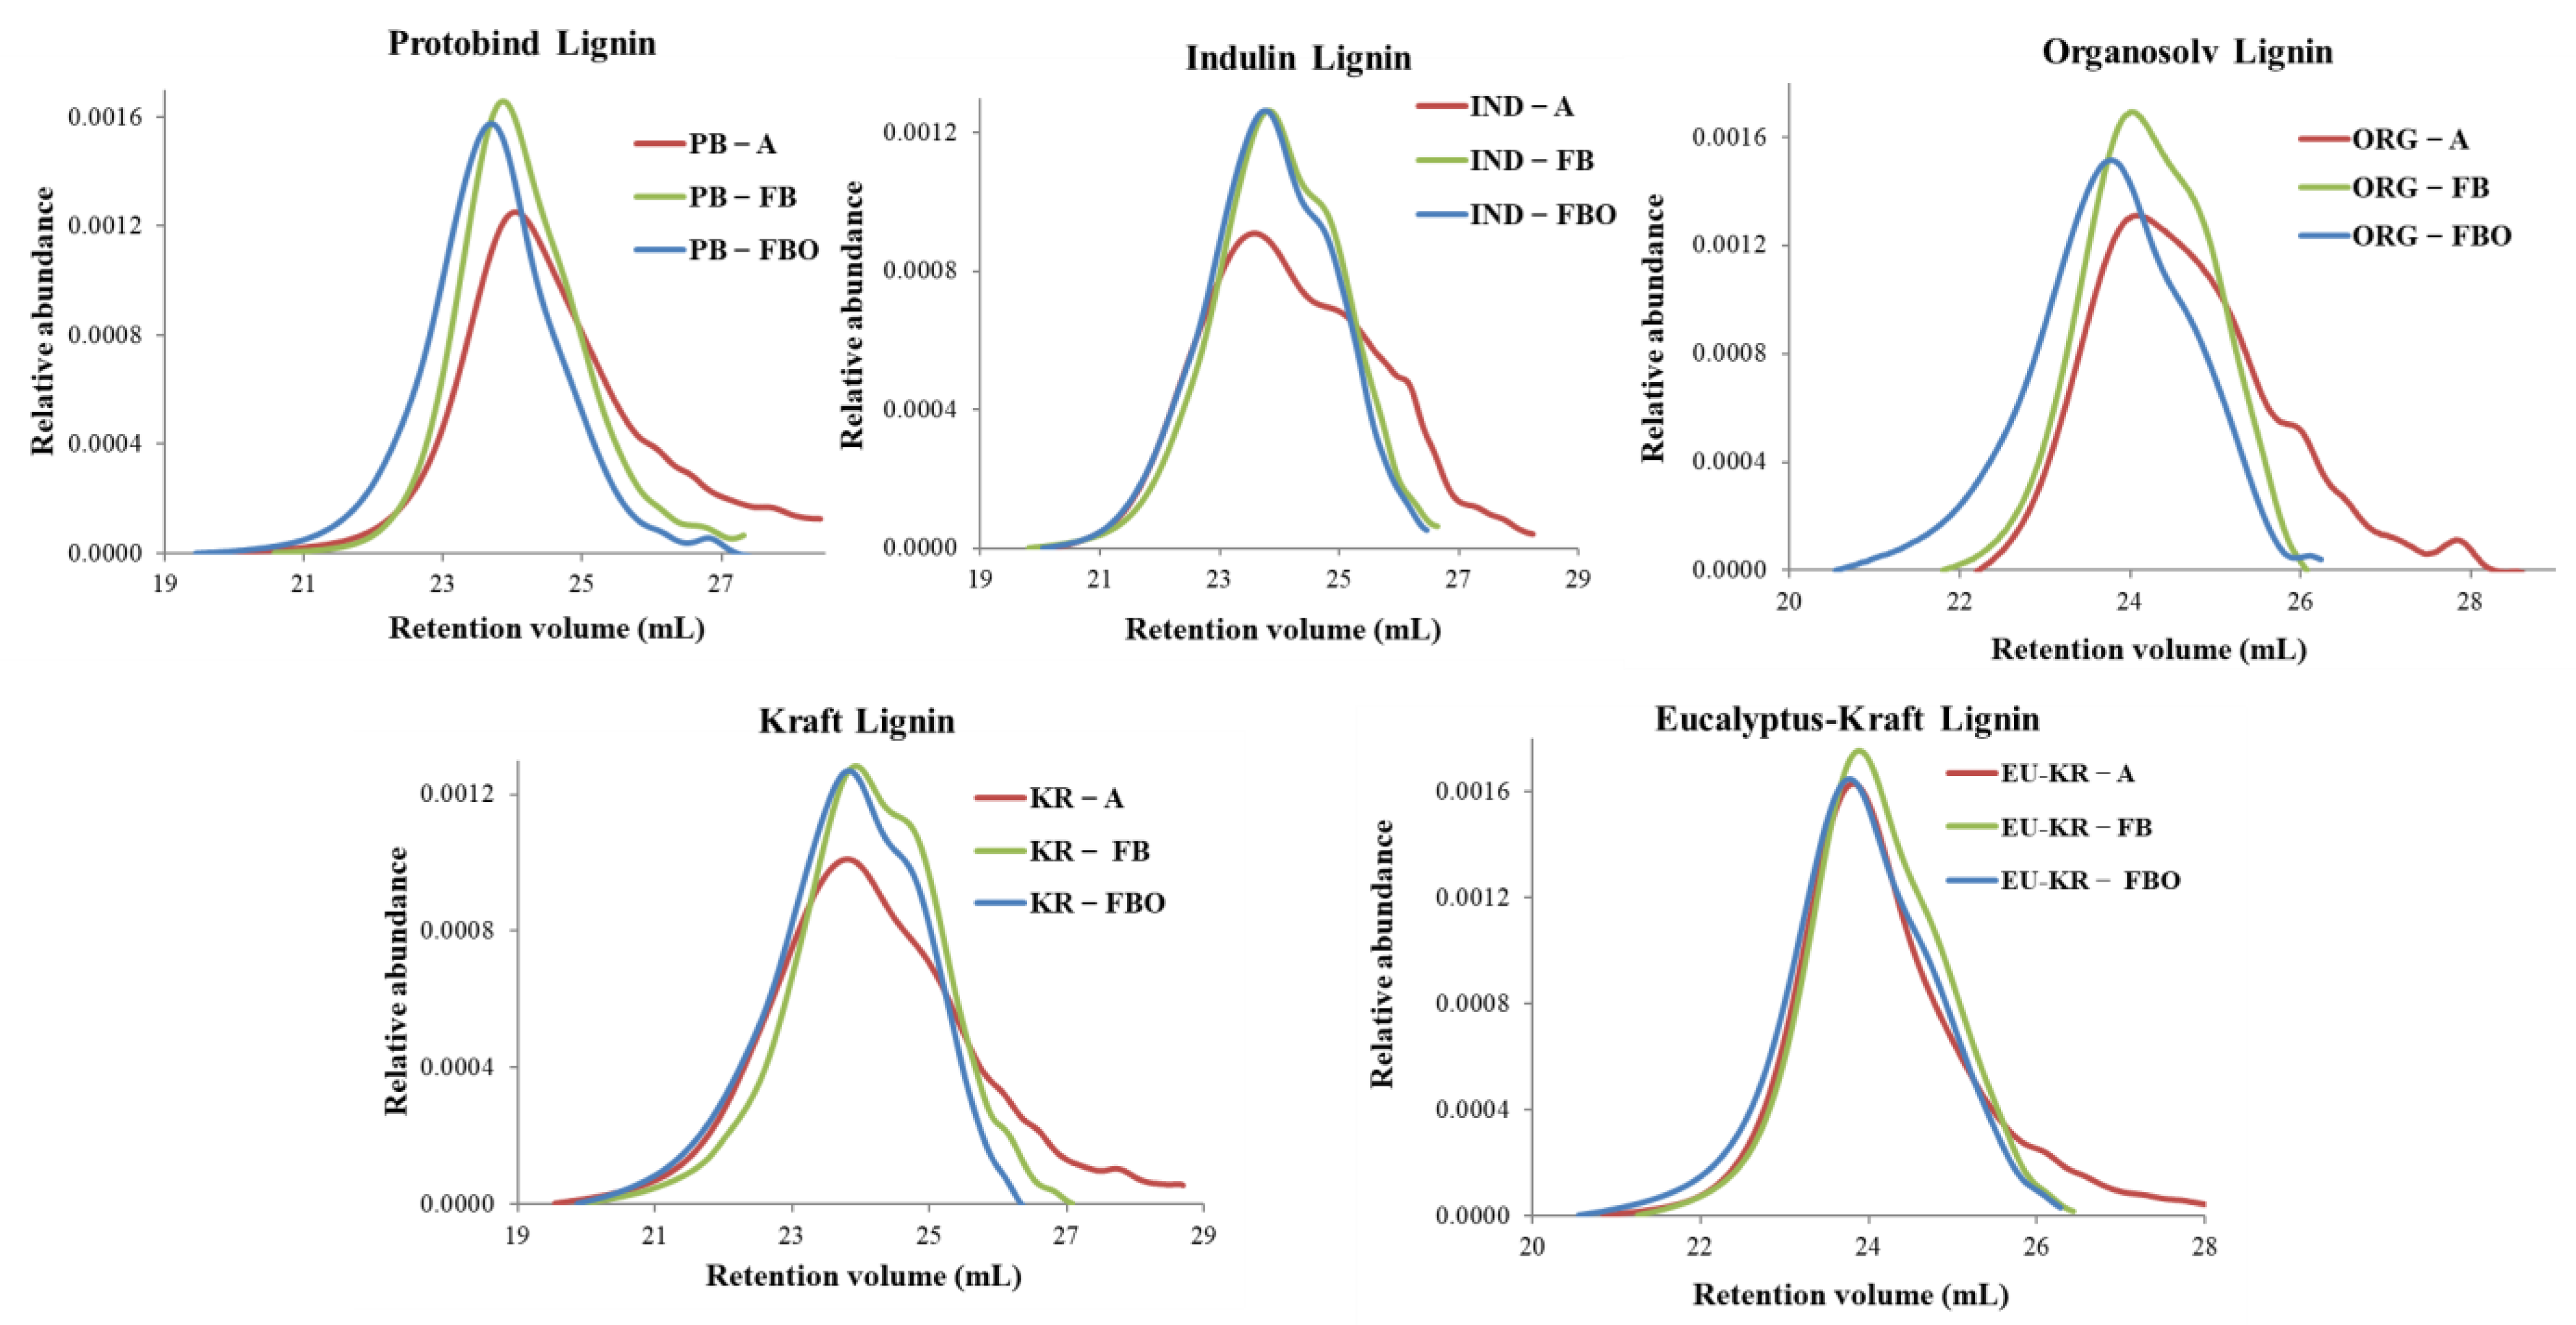
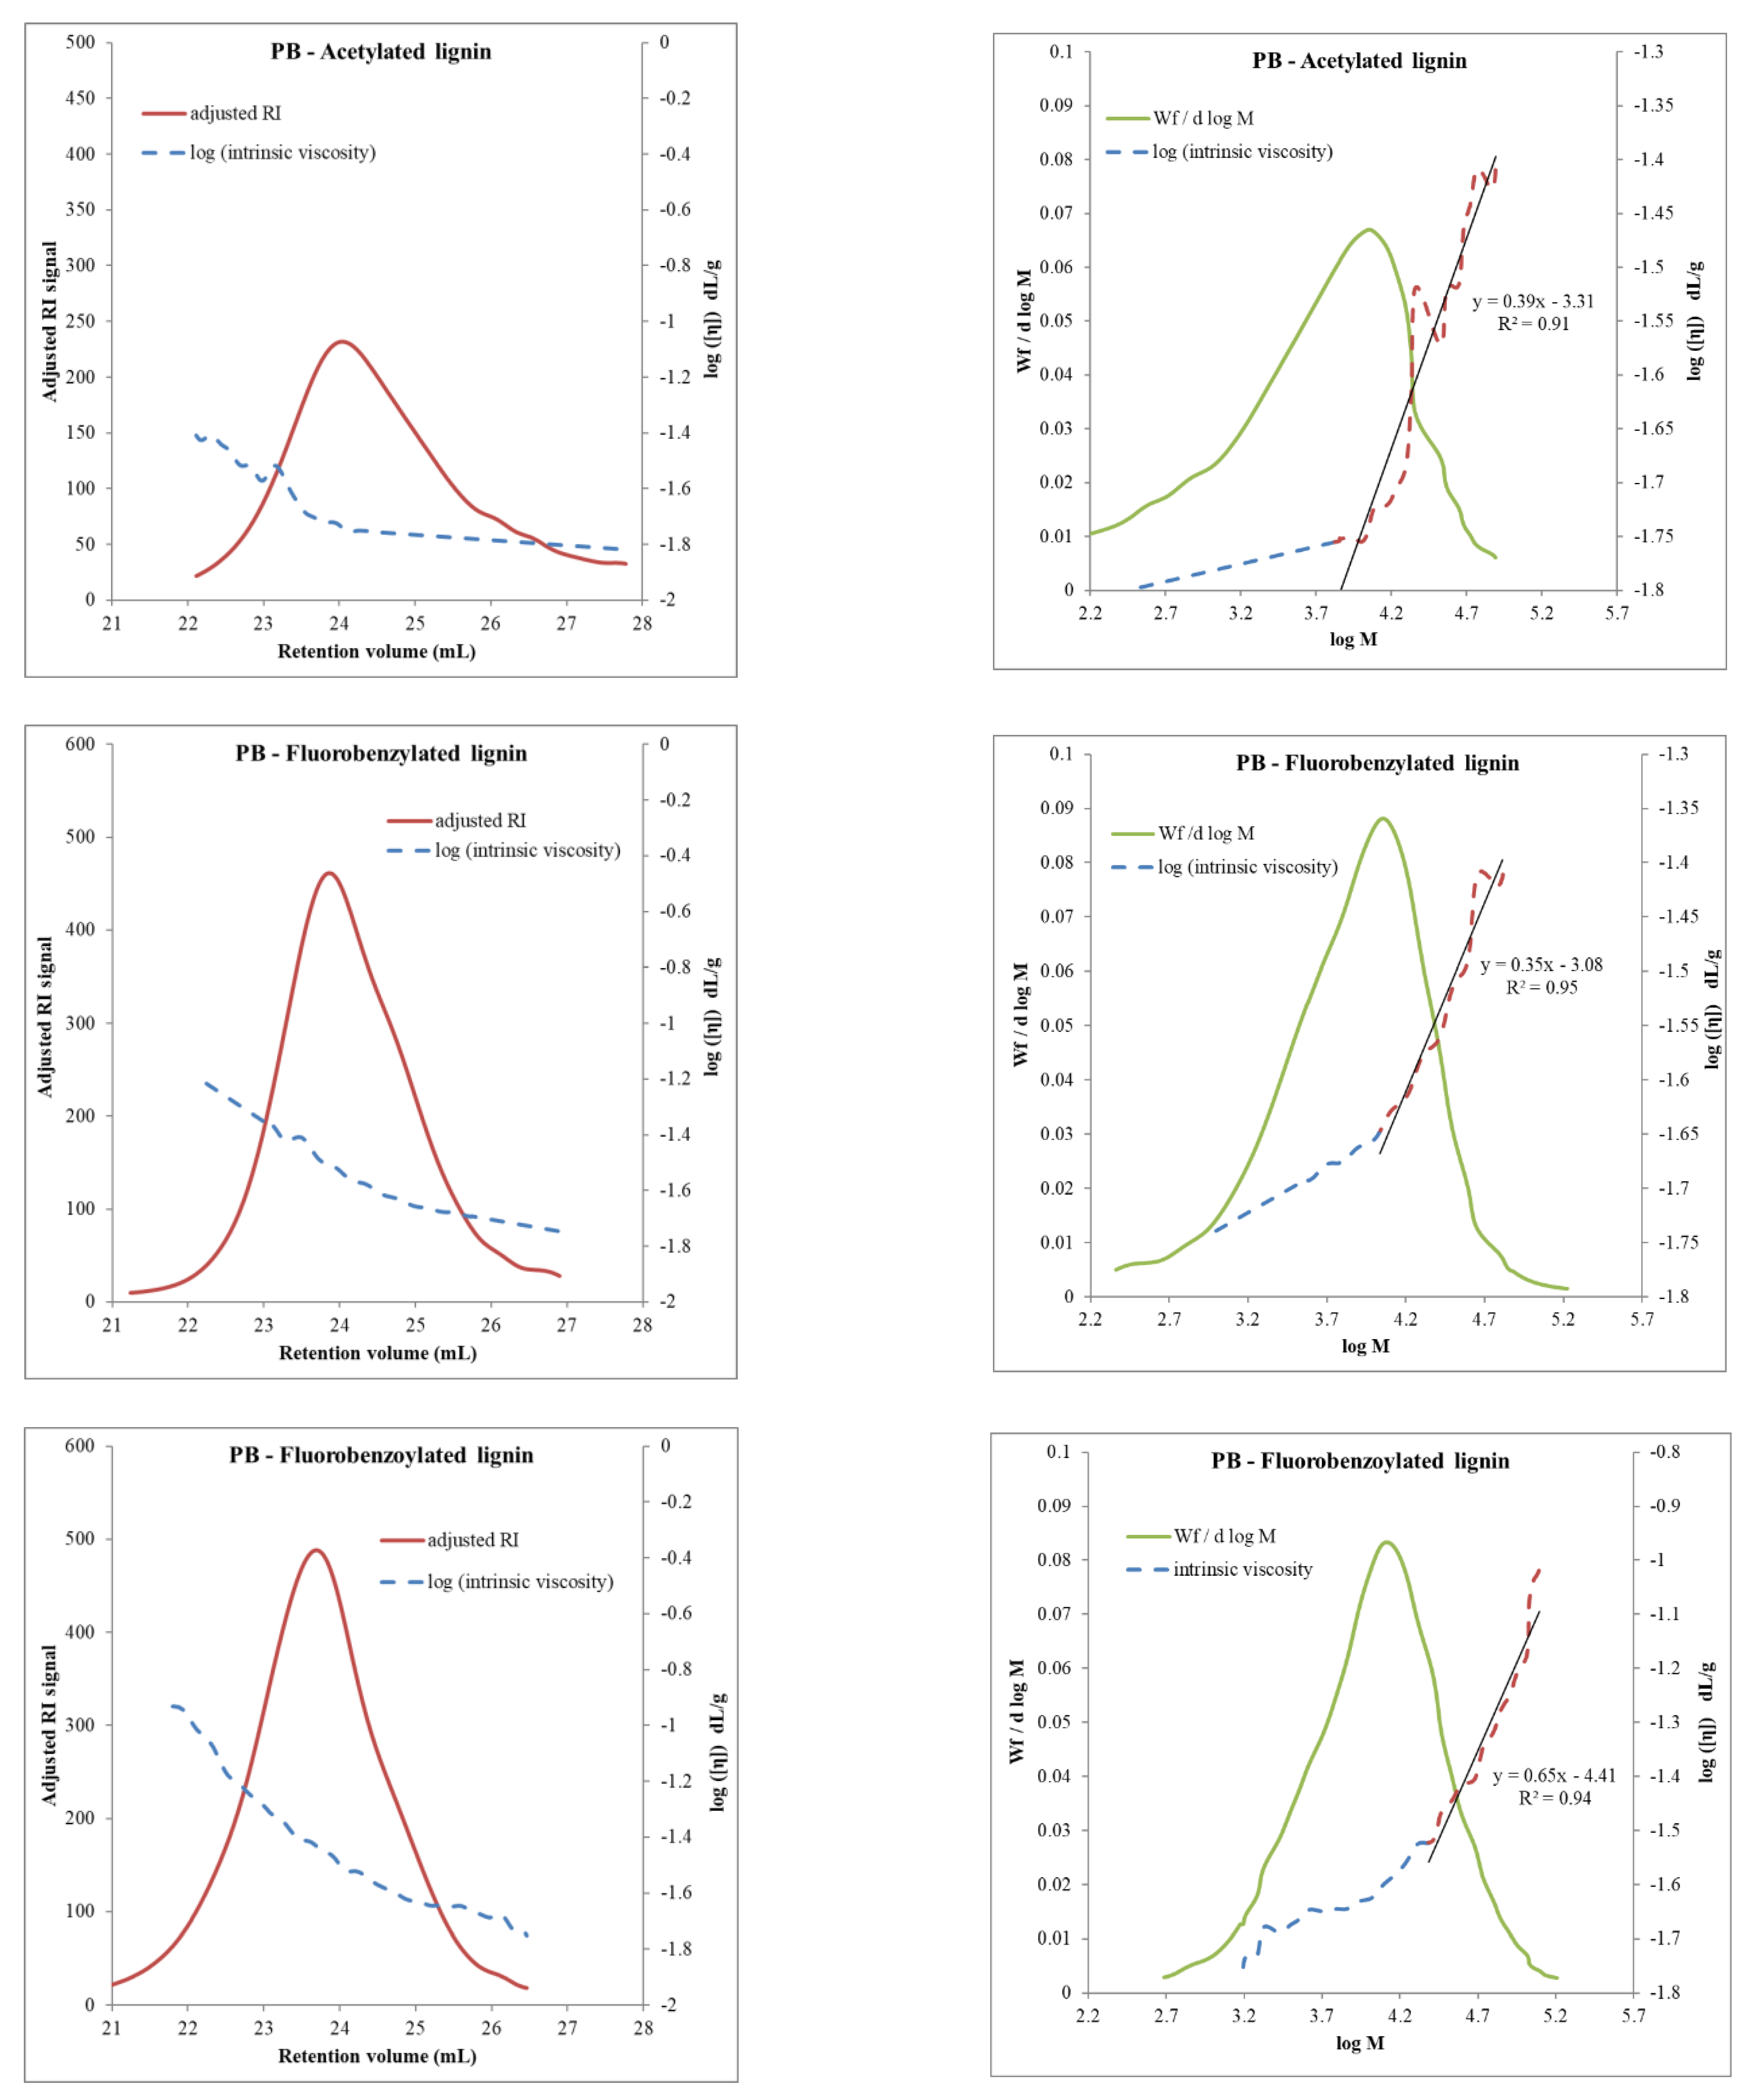
3.3. Molar Mass Distribution Curves of Different Derivatized Lignin Samples in SEC-THF System

In this section, the lignin derivatives were analysed in SEC-THF, using three PLGel columns (non-polar Polystyrene-divinylbenzene (PSDVB) gel), as described in the Materials and Methods section and three different polymers as standards (PS, PMMA and CA) to establish standard and universal calibration curves.
The solubility of the derivatized lignin samples in THF was assessed visually. The results showed that derivatization enhanced the solubility of lignin samples in THF. In particular, PB and EU-KR derivatives exhibited better solubility in THF than the other lignin samples and the ranking order for solubility was PB ≈ EU-KR > IND > KR > ORG. However, it should be pointed out that compared with acetylation, fluoro-derivatization significantly improved the solubility of the lignin derivatives in THF.
SEC-THF chromatograms for all lignin derivatives are illustrated in Figure 6. The good solubility of PB and EU-KR lignin derivatives lead to the uniform narrow distributed SEC profiles in THF among the samples. All fluoro-derivatives exhibited regular, Gaussian-shape distributions, more regular than for acetylated lignin samples. The good shape of the distribution curves showed that the lignin fluoro-derivatives exhibit good compatibility with the SEC column used in a wide range of molar mass, good solubility in THF, good elution without noticeable aggregation. The acetylated lignins showed less regular and long tailing in the high molar mass region, probably due to higher number of soluble small fractions. Similar differences between SEC profiles of acetylated and fluoro-derivatives were found for all lignin samples, except the case of EU-KR for which acetylated and fluoro-derivatives were almost superimposed. In the case of ORG, acetylated lignin exhibited irregular SEC profiles with a long tail in the low mass region; only the main peak was considered, and the long tail was ignored in the average mass calculation since a significant part of ORG acetylated lignin eluted outside the calibration range in the low-molar-mass region. Comparing all fluorobenzoylated lignins, the uniform distribution obtained showed a good solvent-column compatibility towards these samples. The increased hydrodynamic volume due to derivatization drives the system at a lower retention time.
Moreover, the dn/dc values found were slightly different considering the different lignin derivatizations. For instance, acetylated lignin yielded dn/dc = 0.079, and fluorobenzoylated lignin yielded 0.098. Once the dn/dc is known, the polymer concentration in each eluent slice is known and the viscometer allows calculating the intrinsic viscosity in each eluent slice.

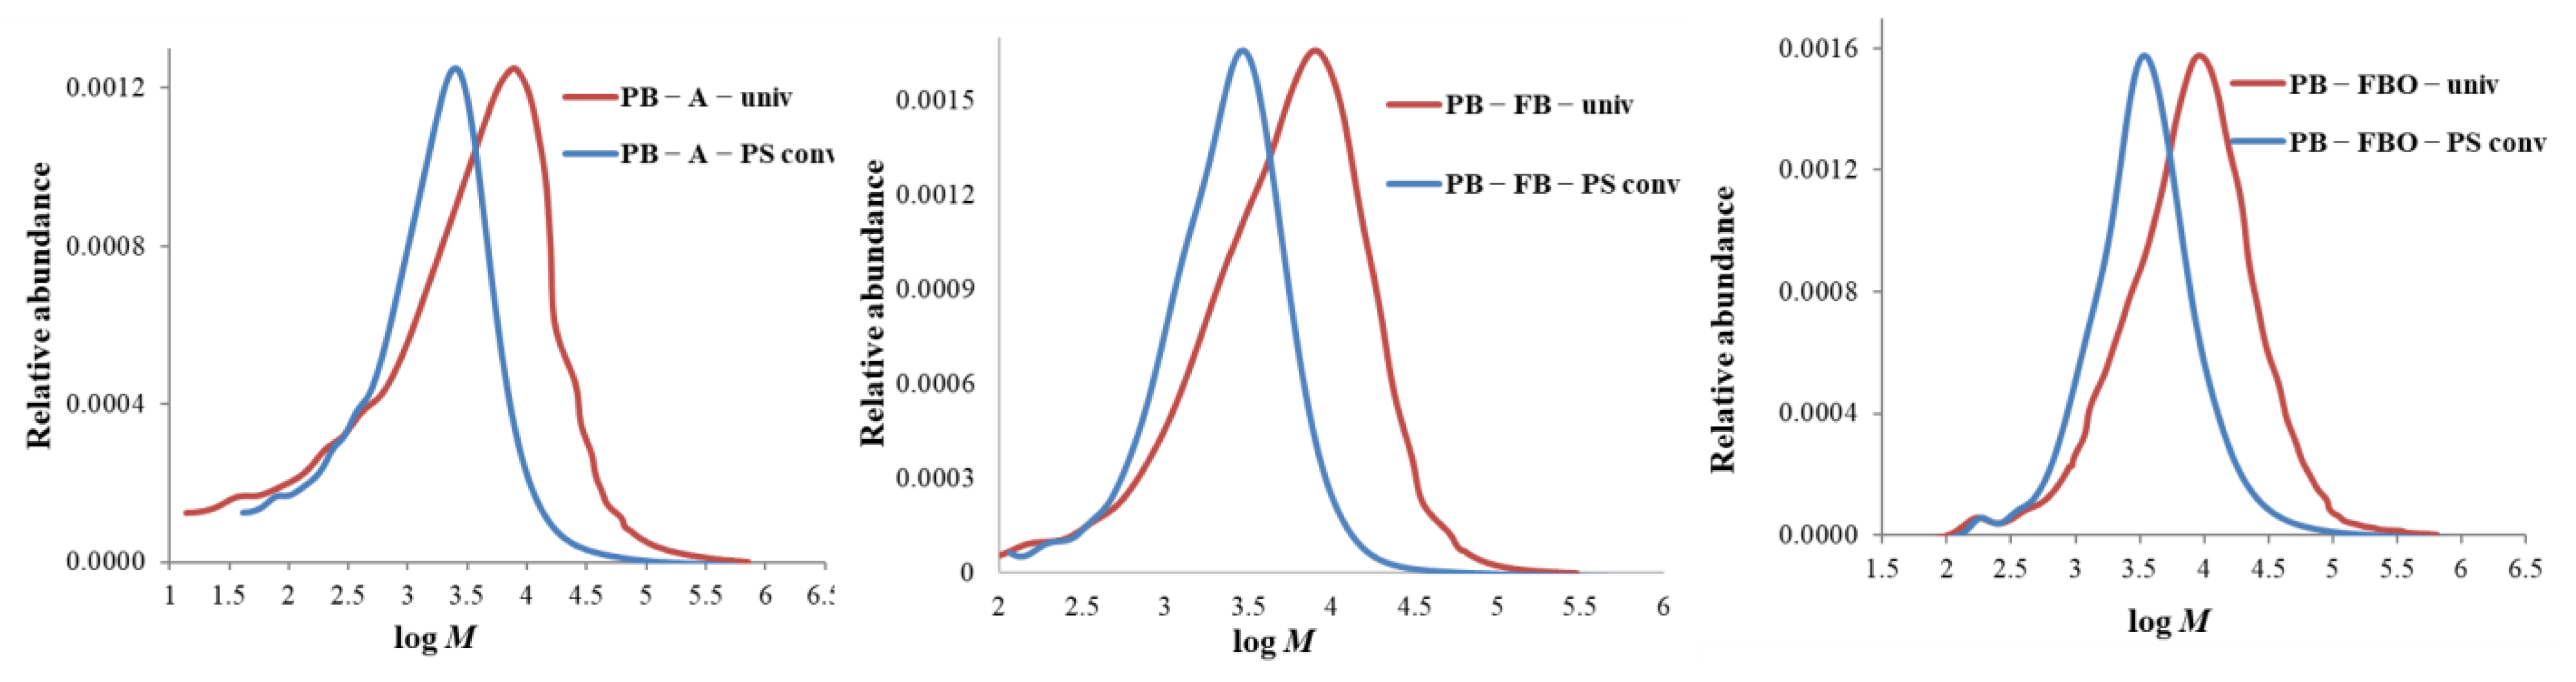
3.3.1. Molar Mass Distribution Curves: Comparison between the Standard and the Universal Calibration

The apparent Mn and Mw values were calculated for different lignin samples, based on applying the standard and the universal calibration methods, and the corresponding MMD curves of relative abundance vs. log(M) were compared in Figure 7 and Figure S4. From Figure 7 and Figure S4, it is seen that the MMD curves of the different derivatives showed the same trend: a shift towards higher molar mass for calculations from the universal calibration method. Another reason can be due to the higher added mass introduced by fluoro-derivatization, as compared to the acetylation. PB and EU-KR lignin samples exhibit a narrow distribution compared to other lignin samples and noticeably, the ORG lignin sample undergoes a large shift towards the higher mass. It should be noted that the conventional method used polystyrene as standard and the molar mass of ORG lignin could probably not fit in the range of the standard. This may explain the huge difference between the values obtained from universal calibration. There could be branching is also a possible explanation for the shift of the MMD curves determined by universal calibration. Overall, the global shape of the fluoro-derivative curves indicates that fluoro-derivatization promotes a good SEC behaviour in non-polar columns.
The molar mass distribution determined by universal calibration is to a certain extent affected by the band broadening. In addition, as described in the reference [26], in the case of branched polymers such as lignin, the slice polydispersity is increased by possible co-elution of molecules of different degree of branching and/or branch topology.
In Table 3 and Table S4–S7, the calculated Mn, Mw, and dispersity values (Mw/Mn) of all lignin derivatives are reported, each of them calculated by universal calibration using global curve fit (calibration curve using together the data of the three standard polymers) and single curve fit (calibration using each individual polymer), and by standard calibration (using each individual polymer).
  • In all cases of universal calibration, average molar mass values using PS and PMMA as standards were rather close but more distant to the values using CA as standard.
  • The difference between universal and conventional calibration is significant: M-averages and dispersity values obtained by conventional calibration appear 3 to 5 times lower than those obtained by universal calibration.
  • In the case of PB lignin in Table 3, dispersity values of fluorobenzylated and fluorobenzoylated lignins were significantly lower than the acetylated sample.
  • Similarly, in Table S4, acetylated IND showed Mw values closer to fluorobenzoylated IND than to fluorobenzylated IND. This is due to the width of the acetylated lignin MMD which extends in the high mass region, increasing Mw.
  • As Mn values for acetylated lignin appear generally much lower than for fluoro-derivatives, this explains the large differences in dispersity index. It is likely that compared to other derivatives, acetylated lignins contain a larger number of small molecules which contribute to the decrease of Mn. Because of the size selection process during the precipitation procedure, fluoro-derivatives contain bigger molecular fractions, thus contributing to an increase of Mn and decrease of dispersity index.
  • It is likely that in the case of ORG lignin, the solubility of the fluorobenzoylated lignin was better than for the two other derivatives and a major part of the higher-molar-mass lignin could be analysed, which increased the Mw value (Table S5). In the case of the ORG FB curve, the molecular weight was calculated until log M = 4.8 and after log M > 4.8, erratic measurement of [η] was observed which was represented as a dashed line (shown in Figure S4). Therefore, M-average value calculations were limited to the integration of the full-line portion of the curve.
  • In the case of KR lignin, the acetylated lignin using universal calibration showed the highest MMD compared to fluoro-derivatives (Table S6). However, the Mn value was very low and it greatly influenced the dispersity value, compared to fluoro-derivatives. Fluorobenzoylated lignin dispersity value was lower than fluorobenzylated and acetylated derivatives and the higher molar mass addition increased significantly the average Mw and Mn in this case.
  • Similarly, as for PB lignin, a small shift (compared to other lignins) towards higher molar mass was observed for EU-KR lignin. Average-M values in Table S7 indicate that standard calibration yields about 2–2.5 times lower average mass than universal calibration. With universal calibration, acetylated and fluorobenzylated lignins showed similar Mw values, but as for other lignins, the acetylated lignin Mn value was lower than for the fluorobenzylated sample, leading to a higher dispersity value.
The more important feature from the above list is the important difference in molar mass between the two calibration methods. In principle, universal calibration should be more accurate than conventional calibration as it relies on the use of an additional detector, the viscosity detector that works with the principle of exclusion by hydrodynamic molar volume. The viscosity measurement relies on the suitability of viscometric detection for a given polymer sample. Conversely, column retention is the single information used in the standard calibration method and relies on the adequacy of the calibrant.
Indeed, in the case of the lignin derivatives used in this study, a high polymer concentration (10 mg/mL) in the injected sample was chosen, which is typically above the usual range from 0.5 mg/mL to 5 mg/mL. Despite that, the viscometer signal remained quite low, especially for the lowest mass fractions. The case of PB lignin, taken as an example, is illustrated in Figure 8, in which the measured intrinsic viscosity was plotted against the retention volume (left curve), and against the molar mass M calculated by universal calibration (using global curve fit—right curve). It is seen that the (log [η] vs. log M) curve is far from the expected linearity of MHS curves for well-dissolved linear polymers. Typically, the curve is divided into two portions: at the highest mass, the curve tends towards linearity, with the MHS a-exponent (slope of the curve) ranging from 0.4 to 0.7; and at low mass, the curve deviates from linearity and the viscosity tends to a constant value, close to zero. It can be seen that a dramatic change is observed at the high molecular mass region (M~10,000), which can be due to the addition of branching in the high molar mass lignin sample fractions. A similar trend has been observed before with benzoylation of lignin [44].
The reason for this is simply that the measured sample viscosity in this portion of the curve was too low. Indeed, the intrinsic viscosity value calculated for the fluorobenzylated PB lignin (taken as an example for the present calculation) by the OMNISECTM program (Malvern SEC system) was 2.1 mL/g (weight-average value of the specific viscosity, defined as (ηηo)/ηo.C) measured on each eluent slice. Such a value falls below the lowest intrinsic viscosity (4.1 mL/g) of the polystyrene standard sample (1660 g mol−1) used for setting up the universal calibration curve.
Furtehr evidence is given by the following calculation: considering an average polymer concentration of 2.5 × 10⁻⁴ g/mL in the eluent portion analysed by the detector (corresponding to an injection of 100 μL at a concentration of 10 mg/mL, diluted in about 4 mL of eluent), and considering an intrinsic viscosity of 2.1 mL/g, the relative viscosity value can be calculated as:
Relative viscosity = (ηηo)/ηo = [η].C = 2.1 × 2.5 × 10−4 = 5.25 × 10⁻⁴ ≈ 0.05 %
where η is the dissolved polymer viscosity, and ηo is the solvent viscosity.
The relative viscosity is thus too low and inaccurate. This fact, combined with a misuse of the universal calibration curve log ([η].M) vs. Vr) (at the lowest end of the calibration range by polystyrene standards), leads to an inadequate estimation of the molar mass by universal calibration in the present case. Either the measured viscosity is too low, or ([η].M) from the universal calibration curve is too high, leading to an overestimated calculated value of M.
Despite the above observations, it should be noticed that the results obtained in this study are consistent with others from previous studies on a large panel of lignins [32,45]. Faix et al. calculated MMD of various acetylated and non-acetylated lignin samples (Spruce, Bamboo, Beech, Aspen; milled-wood lignins) using standard calibration with polystyrene. They found higher Mw and Mn for the acetylated lignin than for underivatized lignins, and dispersity values lie in the range of 1.8 to 3.6. Himmel et al. carried out SEC analysis of different aspen lignin samples after acetylation using standard calibration with UV and RI detection, and universal calibration with viscometric detection. The authors found dispersity values for standard calibration ranging from 3.4 to 4.2; universal calibration yielded higher Mw values, about 1.5 to 2.5 times higher than standard calibration. The Mw values determined by universal calibration were in the same range as those determined by the sedimentation equilibrium method. Similarly, Nascimento et al. [46] calculated the apparent Mw values of four acetylated lignins of Eucalyptus grandis wood (milled wood lignin, Organosolv, Kraft-mild conditions, Kraft-vigorous conditions) using standard calibration with polystyrene. The authors obtained broad MMD’s in all cases, with two maxima found in the case of milled wood and Organosolv lignin samples. For the calculation of Mw, the authors excluded some macromolecular fractions. We faced the same difficulty with the ORG lignin; after the elimination of secondary peaks, the ORG lignin exhibited a higher Mw than Kraft lignin samples. On the other hand, Ringena et al. [9] carried out SEC analysis of various technical lignins without derivatization in DMSO/H2O/LiBr and DMAC/LiCl, and molar mass values were calculated from standard and universal calibration methods. Again, the calculated Mw values by standard calibration were found to be lower than universal calibration due to the fact of the different hydrodynamic volumes of the standards used. The error associated with the real molar mass calculation increased with lignin that had higher molar mass fractions.
Among the three derivatization methods employed, acetylated samples exhibited the poorest solubility in THF whereas fluorobenzylated and fluorobenzoylated lignin exhibited higher solubility. Such a difference in solubility eventually affects the elution behaviour in the SEC column and yields to broader MMDs. It can also be noticed that acetylated derivatives were recovered by solvent evaporation instead of liquid precipitation, and contain many smaller molecules, readily soluble in the chromatographic solvents. However, higher molar mass fractions still have solubility issues. Precipitation methods used in the case of fluoro-derivatization lead to a selection of higher molar mass derivatives. Moreover, fluoro-derivatives have a much-decreased polarity which enhances their solubility while decreasing interactions with the column gel and association phenomena, especially in THF as a non-polar solvent. All these effects contribute to an improvement of SEC profiles.
As the main conclusion, it can be considered that all fluoro-derivatized lignin samples exhibited uniform SEC and MMD profiles except for ORG lignin. An evolution for the molar mass data can also be noticed, also characterized by higher Mw and dispersity values. In general, acetylated lignins in our study exhibited higher dispersity; a good reason for this is that acetylation retained a greater proportion of low molar mass fractions due to the derivatization method used, but a bad reason could be the imperfection of the SEC profiles resulting from larger number of soluble small molecules, compared to fluoro-derivatives. Regarding universal calibration, it seems that there is a lack of accuracy with the chromatographic method used since the derivatized lignin molecules are too small to provide precise in-line intrinsic viscosity measurement. This is at least partly due to the high dilution due to in-line measurement, even if the injected concentration is taken at a maximum acceptable value. In accordance with some previous observations, the molar mass measured by universal calibration was found higher and outside the range of molar mass conventionally measured by standard calibration (although it is well known that this method is also questionable for lignin samples). A main relevant point of this study was that fluoro-derivatives presented a better solubility in THF than acetylated lignins, which makes them good candidates for molar mass measurement by other possible methods.

3.3.2. Degree of Polymerization of Different Derivatives Using Universal Calibration

The degree of polymerization was calculated from the knowledge of M values and monomer molar mass of the different derivatives. The latter were calculated from the results of 19F NMR spectroscopy. The average DP is equal to the average molar mass divided by the monomer molar mass. In Table 4 and Table S8, DPn, DPw and dispersity values are reported from the calculation of universal calibration with global curve fit; standard calibration with individual curve fit for each polymer; the molar mass of acetylated lignin equal to 240 g mol−1.
The conclusions for the comparison of M-averages are: (1) very high DP and dispersity values were obtained by universal calibration, and (2), acetylated lignins have the broadest distribution among the different derivatives.

4. Conclusions

Size exclusion chromatography analysis (SEC) was performed on five technical lignin samples, Protobind 1000 (PB), Organosolv (ORG), Indulin (IND), Softwood Kraft (KR), and Eucalyptus Kraft (EU-KR), to compare different derivatization methods (acetylation-A, fluorobenzylation-FB and fluorobenzoylation-FBO) in THF solvent.
The results of FTIR, 19F NMR spectra confirmed the efficiency of derivatization and allowed the quantification of the different types of hydroxyl groups. THF was used as a chromatographic solvent to allow using a viscometric detector in-line to DRI and SEC, using the principle of universal calibration. The fluoro-derivatives exhibited good solubility in THF, better than that of the acetylated lignins. The obtained MMDs and average M-values were compared to results of standard calibration in the same solvent. A significant deviation was found between the two calibration methods, which was due to the very low viscosity of the dissolved derivatized lignins in THF. The calculated molar mass by universal calibration provided 3 to 5 times higher values than values from standard calibration.
Comparing the behaviour of the different derivatives in SEC-THF, acetylated lignins exhibited more dispersed chromatograms, because the applied acetylation procedure preserved the lower mass fractions of the samples. Although, the fluoro-derivatization procedures enhanced the lignin solubility, the final precipitation step used for the lignin recovery induced partial elimination of the lower mass fraction of the sample. The results confirmed that SEC performed well for fluoro-derivatives in the high molar mass region without solubility and aggregation issues, which are important factors to overcome to find the true molar mass of the lignin. The same fluoro-derivatization procedures can also be tested with different recovery procedures, for instance, solvent evaporation to preserve the small molar mass of lignin for further validation.

Supplementary Materials

The following supporting information can be downloaded at: https://www.mdpi.com/article/10.3390/appliedchem2010002/s1, Figure S1. Individual universal calibration curves including data of each type of polymer; Figure S2: FTIR spectra of ethyl acetate washed (a) ORG, (b) IND, (c) KR, and (d) EU-KR (Eucalyptus kraft) lignins, UD—Underivatized, A—Acetylated, FB—Fluorobenzylated, FBO—Fluorobenzoylated; Figure S3. 19F NMR spectra of fluorobenzylated and fluorobenzoylated, (a) ORG, (b) IND, (c) KR, and (d) EU-KR. Chemical shifts relative to CFCl3. Internal standard: 2-fluoroacetophenone; Figure S4. SEC—MMD curves (in THF): comparison of universal and standard calibration—calculations from global curve fit; A—acetylated, FB—fluorobenzylated and FBO—fluorobenzoylated lignin samples. Top to Bottom: IND, ORG, KR and EU-KR; Equation (S1): Calculation of the number of moles of hydroxyl groups from 19F NMR spectra; Table S1: Total OH groups (in mol/mol aromatic unit) in fluorobenzylated lignin samples, determined by 19F NMR spectra; Equations (S2)–(S4): The number of aromatic and aliphatic hydroxyl group and monomer molar mass from fluorobenzoylation spectra; Table S2: Total OH groups in fluorobenzoylated lignin in (mol mol−1), determined by 19F NMR spectroscopic analysis; Table S3: Total number of OH groups (in mmol g−1) in fluorobenzoylated lignin samples, determined by 19F NMR spectra; Tables S4–S7: MMD of derivatized from universal calibration with global curve fit and individual curve fit and comparison with standard calibration. (M values in g mol−1) of IND, ORG, KR and EU-KR, respectively; Table S8: DP-average from standard calibration (solvent = THF; individual curve fit).

Author Contributions

Conceptualization, E.S.E., N.M., M.-C.B.-S. and G.M.; methodology, E.S.E., N.M., M.-C.B.-S. and G.M.; validation, E.S.E., N.M., M.-C.B.-S. and G.M.; formal analysis, E.S.E., N.M., M.-C.B.-S. and G.M.; investigation, E.S.E., N.M., M.-C.B.-S. and G.M.; writing—original draft preparation, E.S.E.; writing—review and editing, E.S.E., N.M., M.-C.B.-S. and G.M.; visualization, E.S.E., N.M., M.-C.B.-S. and G.M.; supervision, N.M., M.-C.B.-S. and G.M. All authors have read and agreed to the published version of the manuscript.

Funding

The authors thank French Ministerial Fellowship for PhD funding (IMEP2 doctoral school) (2016–2018).

Institutional Review Board Statement

Not applicable.

Informed Consent Statement

Not applicable.

Data Availability Statement

Not applicable.

Acknowledgments

The authors thank Grenoble-INP PAGORA and LGP2 for the constant support and research. LGP2 is part of the LabEx Tec 21 (Investissements d’Avenir—grant agreement n°ANR-11-LABX-0030) and PolyNat Carnot Institute (Investissements d’Avenir—grant agreement n° ANR-16-CARN-0025-01).

Conflicts of Interest

The authors declare no conflict of interest. The funders had no role in the design of the study; in the collection, analyses, or interpretation of data; in the writing of the manuscript, or in the decision to publish the results.

References

  1. Demirbaş, A. Relationships between Lignin Contents and Heating Values of Biomass. Energy Convers. Manag. 2001, 42, 183–188. [Google Scholar] [CrossRef]
  2. Hamelinck, C.N.; van Hooijdonk, G.; Faaij, A.P. Ethanol from Lignocellulosic Biomass: Techno-Economic Performance in Short-, Middle- and Long-Term. Biomass Bioenergy 2005, 28, 384–410. [Google Scholar] [CrossRef]
  3. Hatakeyama, H.; Hatakeyama, T. Lignin Structure, Properties, and Applications. In Biopolymers: Lignin, Proteins, Bioactive Nanocomposites; Advances in Polymer Science; Abe, A., Dusek, K., Kobayashi, S., Eds.; Springer: Berlin/Heidelberg, Germany, 2010; pp. 1–63. ISBN 978-3-642-13630-6. [Google Scholar]
  4. Fengel, D.; Wegener, G. Wood: Chemistry, Ultrastructure, Reactions; Walter de Gruyter: Berlin, Germany, 2011; ISBN 978-3-11-083965-4. [Google Scholar]
  5. Pellinen, J.; Salkinoja-Salonen, M. High-Performance Size-Exclusion Chromatography of Lignin and Its Derivatives. J. Chromatogr. A 1985, 328, 299–308. [Google Scholar] [CrossRef]
  6. Baumberger, S.; Abaecherli, A.; Fasching, M.; Gellerstedt, G.; Gosselink, R.; Hortling, B.; Li, J.; Saake, B.; de Jong, E. Molar Mass Determination of Lignins by Size-Exclusion Chromatography: Towards Standardisation of the Method. Holzforschung 2007, 61, 459–468. [Google Scholar] [CrossRef]
  7. Mansouri, N.-E.E.; Salvadó, J. Structural Characterization of Technical Lignins for the Production of Adhesives: Application to Lignosulfonate, Kraft, Soda-Anthraquinone, Organosolv and Ethanol Process Lignins. Ind. Crop. Prod. 2006, 24, 8–16. [Google Scholar] [CrossRef]
  8. Sulaeva, I.; Zinovyev, G.; Plankeele, J.-M.; Sumerskii, I.; Rosenau, T.; Potthast, A. Fast Track to Molar-Mass Distributions of Technical Lignins. ChemSusChem 2017, 10, 629–635. [Google Scholar] [CrossRef]
  9. Ringena, O.; Lebioda, S.; Lehnen, R.; Saake, B. Size-Exclusion Chromatography of Technical Lignins in Dimethyl Sulfoxide/Water and Dimethylacetamide. J. Chromatogr. A 2006, 1102, 154–163. [Google Scholar] [CrossRef]
  10. Araújo, L.C.P.; Yamaji, F.M.; Lima, V.H.; Botaro, V.R. Kraft Lignin Fractionation by Organic Solvents: Correlation between Molar Mass and Higher Heating Value. Bioresour. Technol. 2020, 314, 123757. [Google Scholar] [CrossRef]
  11. Schure, M.R.; Moran, R.E. Size Exclusion Chromatography with Superficially Porous Particles. J. Chromatogr. A 2017, 1480, 11–19. [Google Scholar] [CrossRef] [Green Version]
  12. Cathala, B.; Saake, B.; Faix, O.; Monties, B. Association Behaviour of Lignins and Lignin Model Compounds Studied by Multidetector Size-Exclusion Chromatography. J. Chromatogr. A 2003, 1020, 229–239. [Google Scholar] [CrossRef]
  13. Lange, H.; Rulli, F.; Crestini, C. Gel Permeation Chromatography in Determining Molecular Weights of Lignins: Critical Aspects Revisited for Improved Utility in the Development of Novel Materials. ACS Sustain. Chem. Eng. 2016, 4, 5167–5180. [Google Scholar] [CrossRef]
  14. Wang, L.; Shigetomi, K.; Koda, K.; Gele, A.; Uraki, Y. A Branched Structure Provides Kraft Lignins a Denser Morphology and a High Molar Mass for a given Hydrodynamic Radius. Holzforschung 2020, 74, 551–558. [Google Scholar] [CrossRef]
  15. Gosselink, R.J.A.; Abächerli, A.; Semke, H.; Malherbe, R.; Käuper, P.; Nadif, A.; van Dam, J.E.G. Analytical Protocols for Characterisation of Sulphur-Free Lignin. Ind. Crop. Prod. 2004, 19, 271–281. [Google Scholar] [CrossRef]
  16. Asikkala, J.; Tamminen, T.; Argyropoulos, D.S. Accurate and Reproducible Determination of Lignin Molar Mass by Acetobromination. J. Agric. Food Chem. 2012, 60, 8968–8973. [Google Scholar] [CrossRef] [PubMed]
  17. Duval, A.; Avérous, L. Mild and Controlled Lignin Methylation with Trimethyl Phosphate: Towards a Precise Control of Lignin Functionality. Green Chem. 2020, 22, 1671–1680. [Google Scholar] [CrossRef]
  18. Buono, P.; Duval, A.; Verge, P.; Averous, L.; Habibi, Y. New Insights on the Chemical Modification of Lignin: Acetylation versus Silylation. ACS Sustain. Chem. Eng. 2016, 4, 5212–5222. [Google Scholar] [CrossRef]
  19. Glasser, W.G.; Jain, R.K. Lignin Derivatives. I. Alkanoates. Holzforschung 1993, 47, 225–233. [Google Scholar] [CrossRef]
  20. Glasser, W.G.; Davé, V.; Frazier, C.E. Molecular Weight Distribution of (Semi-) Commercial Lignin Derivatives. J. Wood Chem. Technol. 1993, 13, 545–559. [Google Scholar] [CrossRef]
  21. Dong, D.; Fricke, A.L. Intrinsic Viscosity and the Molecular Weight of Kraft Lignin. Polymer 1995, 36, 2075–2078. [Google Scholar] [CrossRef]
  22. Alzahrani, Q.E.; Adams, G.G.; Gillis, R.B.; Besong, T.M.D.; Kök, M.S.; Fong, E.; Harding, R.A.; van Dam, J.E.G.; Gosselink, R.J.A.; Rowe, A.J.; et al. Matrix-Free Hydrodynamic Study on the Size Distribution and Conformation of Three Technical Lignins from Wood and Non-Wood. Holzforschung 2016, 70, 117–125. [Google Scholar] [CrossRef] [Green Version]
  23. Gidh, A.V.; Decker, S.R.; See, C.H.; Himmel, M.E.; Williford, C.W. Characterization of Lignin Using Multi-Angle Laser Light Scattering and Atomic Force Microscopy. Anal. Chim. Acta 2006, 555, 250–258. [Google Scholar] [CrossRef]
  24. Jacobs, A.; Dahlman, O. Absolute Molar Mass of Lignins by Size Exclusion Chromatography and MALDI-TOF Mass Spectroscopy. Nord. Pulp Pap. Res. J. 2000, 15, 120–127. [Google Scholar] [CrossRef]
  25. Richel, A.; Vanderghem, C.; Simon, M.; Wathelet, B.; Paquot, M. Evaluation of Matrix-Assisted Laser Desorption/Ionization Mass Spectrometry for Second-Generation Lignin Analysis. Anal. Chem. Insights 2012, 7, ACI-S10799. [Google Scholar] [CrossRef] [PubMed]
  26. Podzimek, S. Molar Mass Distribution by Size Exclusion Chromatography: Comparison of Multi-Angle Light Scattering and Universal Calibration. J. Appl. Polym. Sci. 2019, 136, 47561. [Google Scholar] [CrossRef]
  27. Wang, L.; Uraki, Y.; Koda, K.; Gele, A.; Zhou, X.; Chen, F. Determination of the Absolute Molar Mass of Acetylated Eucalyptus Kraft Lignin by Two Types of Size-Exclusion Chromatography Combined with Multi-Angle Laser Light-Scattering Detectors. Holzforschung 2019, 73, 363–369. [Google Scholar] [CrossRef]
  28. Zinovyev, G.; Sulaeva, I.; Podzimek, S.; Rössner, D.; Kilpeläinen, I.; Sumerskii, I.; Rosenau, T.; Potthast, A. Getting Closer to Absolute Molar Masses of Technical Lignins. ChemSusChem 2018, 11, 3259–3268. [Google Scholar] [CrossRef] [Green Version]
  29. Brown, W. Solution Properties of Lignin. Thermodynamic Properties and Molecular Weight Determinations. J. Appl. Polym. Sci. 1967, 11, 2381–2396. [Google Scholar] [CrossRef]
  30. Faix, O.; Lange, W.; Salud, E.C. The Use of HPLC for the Determination of Average Molecular Weights and Molecular Weight Distributions of Milled Wood Lignins from Shorea Polysperma (Blco.). Holzforschung 1981, 35, 3–9. [Google Scholar] [CrossRef]
  31. Chum, H.L.; Johnson, D.K.; Tucker, M.P.; Himmel, M.E. Some Aspects of Lignin Characterization by High Performance Size Exclusion Chromatography Using Styrene Divinylbenzene Copolymer Gels. Holzforschung 1987, 41, 97–108. [Google Scholar] [CrossRef]
  32. Himmel, M.E.; Tatsumoto, K.; Oh, K.K.; Grohmann, K.; Johnson, D.K.; Chum, H.L. Molecular Weight Distribution of Aspen Lignins Estimated by Universal Calibration. In Lignin; ACS Symposium Series; American Chemical Society: Washington, DC, USA, 1989; Volume 397, pp. 82–99. ISBN 978-0-8412-1631-0. [Google Scholar]
  33. Clauss, M.M.; Weldin, D.L.; Frank, E.; Giebel, E.; Buchmeiser, M.R. Size-Exclusion Chromatography and Aggregation Studies of Acetylated Lignins in N,N-Dimethylacetamide in the Presence of Salts. Macromol. Chem. Phys. 2015, 216, 2012–2019. [Google Scholar] [CrossRef]
  34. Sulaeva, I.; Vejdovszky, P.; Henniges, U.; Mahler, A.K.; Rosenau, T.; Potthast, A. Molar Mass Characterization of Crude Lignosulfonates by Asymmetric Flow Field-Flow Fractionation. ACS Sustain. Chem. Eng. 2019, 7, 216–223. [Google Scholar] [CrossRef]
  35. Faix, O. Fourier Transform Infrared Spectroscopy. In Methods in Lignin Chemistry; Lin, S.Y., Dence, C.W., Eds.; Springer: Berlin/Heidelberg, Germany, 1992; Volume 10, pp. 83–109. [Google Scholar]
  36. Rönnols, J.; Jacobs, A.; Aldaeus, F. Consecutive Determination of Softwood Kraft Lignin Structure and Molar Mass from NMR Measurements. Holzforschung 2017, 71, 563–570. [Google Scholar] [CrossRef]
  37. Serrano, L.; Esakkimuthu, E.S.; Marlin, N.; Brochier-Salon, M.-C.; Mortha, G.; Bertaud, F. Fast, Easy, and Economical Quantification of Lignin Phenolic Hydroxyl Groups: Comparison with Classical Techniques. Energy Fuels 2018, 32, 5969–5977. [Google Scholar] [CrossRef]
  38. Esakkimuthu, E.S. Study of New Chemical Derivatization Techniques for Lignin Analysis by Size Exclusion Chromatography. Ph.D. Thesis, Université Grenoble Alpes, Grenoble, France, 2020. [Google Scholar]
  39. Esakkimuthu, E.S.; Marlin, N.; Brochier-Salon, M.-C.; Mortha, G. Study of the Reactivity of Lignin Model Compounds to Fluorobenzylation Using 13C and 19F NMR: Application to Lignin Phenolic Hydroxyl Group Quantification by 19F NMR. Molecules 2020, 25, 3211. [Google Scholar] [CrossRef]
  40. Barrelle, M.; Fernandes, J.C.; Froment, P.; Lachenal, D. An Approach to the Determination of Functional Groups in Oxidized Lignins by 19F Nmr. J. Wood Chem. Technol. 1992, 12, 413–424. [Google Scholar] [CrossRef]
  41. Barrelle, M. Improvements in the Structural Investigation of Lignins by 19F NMR Spectroscopy. J. Wood Chem. Technol. 1995, 15, 179–188. [Google Scholar] [CrossRef]
  42. Benoit, H.; Grubisic, Z.; Rempp, P.; Decker, D.; Zilliox, J.-G. Étude par chromatographie en phase liquide de polystyrènes linéaires et ramifiés de structures connues. J. Chim. Phys. 1966, 63, 1507–1514. [Google Scholar] [CrossRef]
  43. Ahvazi, B.C.; Crestini, C.; Argyropoulos, D.S. 19F Nuclear Magnetic Resonance Spectroscopy for the Quantitative Detection and Classification of Carbonyl Groups in Lignins. J. Agric. Food Chem. 1999, 47, 190–201. [Google Scholar] [CrossRef]
  44. Zoia, L.; King, A.W.T.; Argyropoulos, D.S. Molecular Weight Distributions and Linkages in Lignocellulosic Materials Derivatized from Ionic Liquid Media. J. Agric. Food Chem. 2011, 59, 829–838. [Google Scholar] [CrossRef]
  45. Faix, O.; Lange, W.; Beinhoff, O. Molecular weights and molecular weight distributions of milled wood lignins of some wood and bambusoideae species. Holzforschung 1980, 34, 174–176. [Google Scholar] [CrossRef]
  46. Nascimento, E.A.; Morais, S.A.; Machado, A.E.; Veloso, D.P. Studies of Eucalyptus Grandis Lignin. Part II: High-Performance Size-Exclusion Chromatography of Milled Wood Lignin, Kraft and Organosolv Lignins. J. Braz. Chem. Soc. 1992, 3, 61–64. [Google Scholar] [CrossRef]
Figure 1. Acetylation of lignin using acetic anhydride in presence of pyridine.
Appliedchem 02 00002 g001
Figure 2. Fluorobenzylation of lignin using 4-fluorobenzylchloride.
Appliedchem 02 00002 g002
Figure 3. Fluorobenzoylation on fluorobenzylated lignin.
Appliedchem 02 00002 g003
Figure 4. Global universal calibration curve including all points of PS, PMMA and Cellulose acetate.
Appliedchem 02 00002 g004
Figure 5. (a) FTIR spectra of ethyl acetate washed PB (UD—Underivatized, A—Acetylated, FB—Fluorobenzylated, FBO—Fluorobenzoylated), (b) 19F NMR spectra of fluorobenzylated and fluorobenzoylated PB, Chemical shifts relative to CFCl3. Internal standard: 2-fluoroacetophenone.
Appliedchem 02 00002 g005
Figure 6. SEC profiles in THF for all lignin samples: relative abundance vs. retention volume (A—acetylated, FB—fluorobenzylated and FBO—fluorobenzoylated).
Appliedchem 02 00002 g006
Figure 7. SEC–MMD curves (in THF): comparison of universal and standard calibration–calculations from global curve fit of PB lignin sample; A—acetylated, FB—fluorobenzylated and FBO—fluorobenzoylated.
Appliedchem 02 00002 g007
Figure 8. Protobind lignin; SEC profiles (left) and MHD curves (right) from universal calibration (global curve fit). Top to bottom: acetylated lignin; fluorobenzylated lignin; fluorobenzoylated lignin. log(intrinsic viscosity) = log ([η]).
Appliedchem 02 00002 g008
Table 1. Total number of OH groups (in mmol g−1) in fluorobenzylated lignin samples, determined by 19F NMR spectroscopy.
LigninFluorobenzylatedTotal OHCalculated
mmol/g Derivatized Lignin
Ph–OH1°–OH
PB1.7850.1061.891
ORG1.7080.1201.828
IND2.4510.0782.529
KR2.2520.0892.341
EU-KR2.3220.0592.381
Table 2. Calculated monomer molar mass in g.mol−1 of fluorobenzylated (FB) and fluorobenzoylated (FBO) lignin samples from 19F NMR spectroscopic analysis.
LigninMolar Mass of Monomer
FBFBO
PB251308
ORG249275
IND275328
KR268310
EU-KR269291
Table 3. MMD of derivatized PB lignin from universal calibration with global curve fit and individual curve fit and comparison with standard calibration. (M values in g mol−1).
Universal Calibration
(Viscometric + RI Detectors)
Standard Calibration
(RI Detector)
PB–AcetylatedMnMwMw/MnMpeakMnMwMw/MnMpeak
Fit with Global curve a38010,06026.57780----
PS330903027.4691056028905.22500
PMMA240826034.4598172536405.03150
Cellulose acetate70013,26018.911,09085627203.22620
PB–Fluorobenzylated
Fit with Global curve a200095604.87980----
PS176085704.97110145031802.22930
PMMA140077005.56200184040002.23690
Cellulose acetate322012,8904.011,230177030601.72990
PB–Fluorobenzoylated
Fit with Global curve a369016,1404.49240----
PS323014,5504.58250214053902.53430
PMMA264013,5105.17250271067402.54320
Cellulose acetate564020,6803.712,850245046601.93420
a = fit with global curve (PS, PMMA, cellulose acetate).
Table 4. DP-average from universal calibration (solvent = THF; global curve fit).
Universal Calibration in THF
Molar Mass of Monomer (g/mol)DPnDPwDispersity
PBAcetylated24024226.2
FB251 *8384.8
FBO308 *12524.4
INDAcetylated24058318.3
FB275 *9566.3
FBO328 *11685.9
ORGAcetylated24012796.5
FB249 *------
FBO275 *311254
KRAcetylated240212957.5
FB268 *8516.2
FBO310 *10595.7
EU-KRAcetylated2405356.7
FB269 *13322.5
FBO291 *12453.6
* Monomer molar mass of Fluorobenzylated (FB) and Fluorobenzoylated (FBO) lignins calculated from 19F NMR; DPw/DPn = dispersity.
Publisher’s Note: MDPI stays neutral with regard to jurisdictional claims in published maps and institutional affiliations.

